Article

Hybrid Power System Design and Dynamic Modeling for Enhanced Reliability in Remote Natural Gas Pipeline Control Stations

Department of Electrical and Computer Engineering, Faculty of Engineering and Applied Science, Memorial University of Newfoundland, St. John’s, NL A1C 5S7, Canada
*
Author to whom correspondence should be addressed.
Energies 2024, 17(7), 1763; https://doi.org/10.3390/en17071763
Submission received: 4 March 2024 / Revised: 2 April 2024 / Accepted: 3 April 2024 / Published: 7 April 2024
(This article belongs to the Topic Power Electronics Converters)

Abstract

:
The most rapid and efficient method to transport natural gas from its source to its destination is through a pipeline network. The optimal functioning of control stations for natural gas pipelines depends on the use of electrical devices, including data loggers, communication devices, control systems, surveillance equipment, and more. Ensuring a reliable and consistent power supply proves to be challenging due to the remote locations of these control stations. This research article presents a case study detailing the design and dynamic modeling of a hybrid power system (HPS) to address the specific energy needs of a particular natural gas pipeline control station. The HOMER Pro 3.17.1 software is used to design an optimal HPS for the specified location. The designed system combines a photovoltaic (PV) system with natural gas generators as a backup to ensure a reliable and consistent power supply for the control station. Furthermore, it provides significant cost savings, reducing the cost of energy (COE) by USD 0.148 and the annual operating costs by USD 87,321, all while integrating a renewable energy fraction of 79.2%. Dynamic modeling of the designed system is performed in MATLAB/Simulink R2022a to analyze the system’s response, including its power quality, harmonics, voltage transients, load impact, etc. The experimental results are validated using hardware in the loop (HIL) and OPAL-RT Technologies’ real-time OP5707XG simulator.

1. Introduction

One of the most important necessities of modern living is energy. It plays a crucial role in enhancing a nation’s economic development and raising the standard of living. As economic progress continues, the exploration and exploitation of oil and gas reserves progressively intensify alongside the consumption of these conventional sources [1]. The reliability of energy resources is pivotal for sustaining modern life, and a consistent energy supply is essential for fostering economic growth while promising solutions for addressing the depletion of traditional energy sources, including using clean energy devices [2,3]. The availability of energy at an affordable cost is a key determinant in fostering the prosperity of a nation [4].
In the present era, energy is pivotal in driving socio-economic advancement, with per capita energy consumption closely linked to a nation’s development [5]. Energy can be derived from renewable resources such as solar, geothermal, biomass, hydro, and wind power or fossil fuel reserves like uranium, natural gas, coal, and oil [6]. Given its low carbon intensity and minimal environmental impact in production and consumption, natural gas is preferred over other fossil fuel sources such as oil and coal [7]. A substantial share of Pakistan’s energy requirements is fulfilled by natural gas, making it a key contributor to electricity generation [8]. Figure 1 shows Pakistan’s total energy supply (TES) from 1990 to 2021.
Due to challenges in storing natural gas, it must be promptly transported to its intended destination once extracted from the reservoir. Several methods exist for transporting natural gas from oil and gas fields to the end consumers [10]. Energy transportation refers to the transportation of various forms of energy from production sources to end-users. Main energy sources are typically distant from end consumers in remote and unpopulated areas. Therefore, an energy transportation system becomes essential for delivering energy to end-users. Due to its extremely low density, economically transporting natural gas is challenging; hence, it undergoes compression before being transported. Weather conditions significantly impact the transportation of natural gas through pipelines. In regions where temperatures vary from −50 to +40 degrees Celsius annually, the physical properties of the pipeline metal are affected. Therefore, it is crucial to maintain an optimal temperature for efficient gas transportation through the main pipeline [11].
Natural gas energy may be transported from its source to its destination in several ways. Table 1 displays various methods of transporting natural gas from its source to its destination, along with the preferred transportation mode based on distance in kilometers (km) and capacity in billion cubic meters (bcm) per year.
Various natural gas pipeline control stations oversee the operation and maintenance of high-pressure natural gas pipelines. The geographic distribution of these control stations poses operational challenges, especially in remote locations, where maintaining and operating high-pressure natural gas pipeline control stations can be difficult due to unreliable electricity supply and other logistical issues. At the same time, the smooth functioning of control stations depends on a range of electrically powered devices installed within these control stations [13].
Compared to rural and remote areas, metropolitan areas have a consistent and uninterrupted electricity supply throughout the year. Data from the World Bank for 2021 reveals that around 15.5% of the global population residing in remote and rural areas lack access to electricity [14]. In the current era, there is also an increasing concern about environmental issues, and society has an extensive dependence on fossil fuels [15]. Electricity production in Pakistan involves a mix of thermal power plants, with a primary focus on utilizing natural gas and coal, hydroelectric power stations, and nuclear power facilities, and there is an increasing emphasis on harnessing renewable energy sources like wind and solar power, particularly in regions with favorable conditions. The percentage share of different energy sources used for power generation in Pakistan is shown in Figure 2.
The LNG price depends on the international market and is affected by various other global factors. By late 2021, the ultimate cost of LNG delivered to Pakistan had risen to nearly USD 16 per MMBtu, exceeding the average domestic gas price by more than four-fold [17]. Thus, a consistent and reliable supply of electric power from conventional fossil fuels is at risk due to increased fuel prices resulting from the ongoing conflicts and continued demands for environmental pollution reduction [18]. Likewise, the cost of energy in Pakistan is mainly affected by imported energy costs, transmission losses, economic conditions, and pricing policies. Figure 3 shows the forecast for the annual average cost of energy in Pakistan based on historical data.
When Sui Northern Gas Pipelines Limited (SNGPL) commenced its operations following the discovery of substantial natural gas reserves in Pakistan, control stations were strategically established in remote areas to facilitate natural gas transportation across the country. These stations were initially designed to rely on the internal consumption of natural gas through natural gas generators for their electrical power needs, as reliable alternative power sources were not readily available in those areas. However, the continuous and dependable power supply demanded by these control stations became a critical requirement. Unfortunately, at their inception, little consideration was given to the future scenario when natural gas reserves might deplete.
With indigenous natural gas sources diminishing and a significant reliance on imported LNG, the internal consumption of natural gas for power generation at these control stations has become economically impractical due to the escalating LNG prices constituting both wastage and an economically inefficient practice. Therefore, exploring alternative methods, such as harnessing renewable energy sources for power generation at these control stations, is prudent. It is critical to switch to renewable energy sources, which are the most promising options because of their endless supply, low cost, and environmental friendliness. Because renewable energy sources are intermittent, hybrid power systems that integrate both conventional and renewable energy sources are used to generate electricity [20]. HPSs are dependable, eco-friendly systems that efficiently reduce reliance on a single renewable resource. This is particularly significant in regions with scarce natural resources [21]. In most cases, a hybrid power system contains renewable energy sources (solar, wind, and hydro), conventional energy sources (diesel and/or natural gas generators and AC distribution systems), energy storage elements, power converters, and DC/AC loads.
Solar energy emerges as Pakistan’s most viable renewable energy option, boasting a potential of about 5500 terawatt hours per year—which is over five times the nation’s current electricity consumption. Pakistan has tremendous solar energy potential, with an average daily sun insolation of 5.30 kWh/m2, and the capacity to generate up to 10,000 GW. The distribution of solar insolation throughout Pakistan is shown in Figure 4, which provides clear evidence that ample solar energy is available for utilization.
Considering these facts, it is recommended to encourage the production of electricity using solar energy, especially in rural and remote areas where such control stations are located. Numerous researchers have explored the potential of employing PV systems for domestic and commercial structures, water pumps, reverse osmosis plants, and more. However, there is a notable absence of relevant research on implementing HPSs for such natural gas pipeline control stations located remotely. These stations require minimizing or ceasing the internal consumption of conventional fossil fuels to enhance the conservation of depleting resources, mitigate environmental impact, and reduce energy costs while ensuring a consistent and reliable power supply.
This research article addresses the challenges mentioned earlier by proposing the design of an optimal HPS. In particular, this research contributes to the existing research in the following ways:
  • It designs and sizes the proposed HPS using HOMER Pro, which involves determining the optimal capacity and configuration of components to meet the energy demands of a specific application. This process includes analyzing the load profile, assessing renewable resource availability, incorporating energy storage, determining the generator capacity, and implementing a control system.
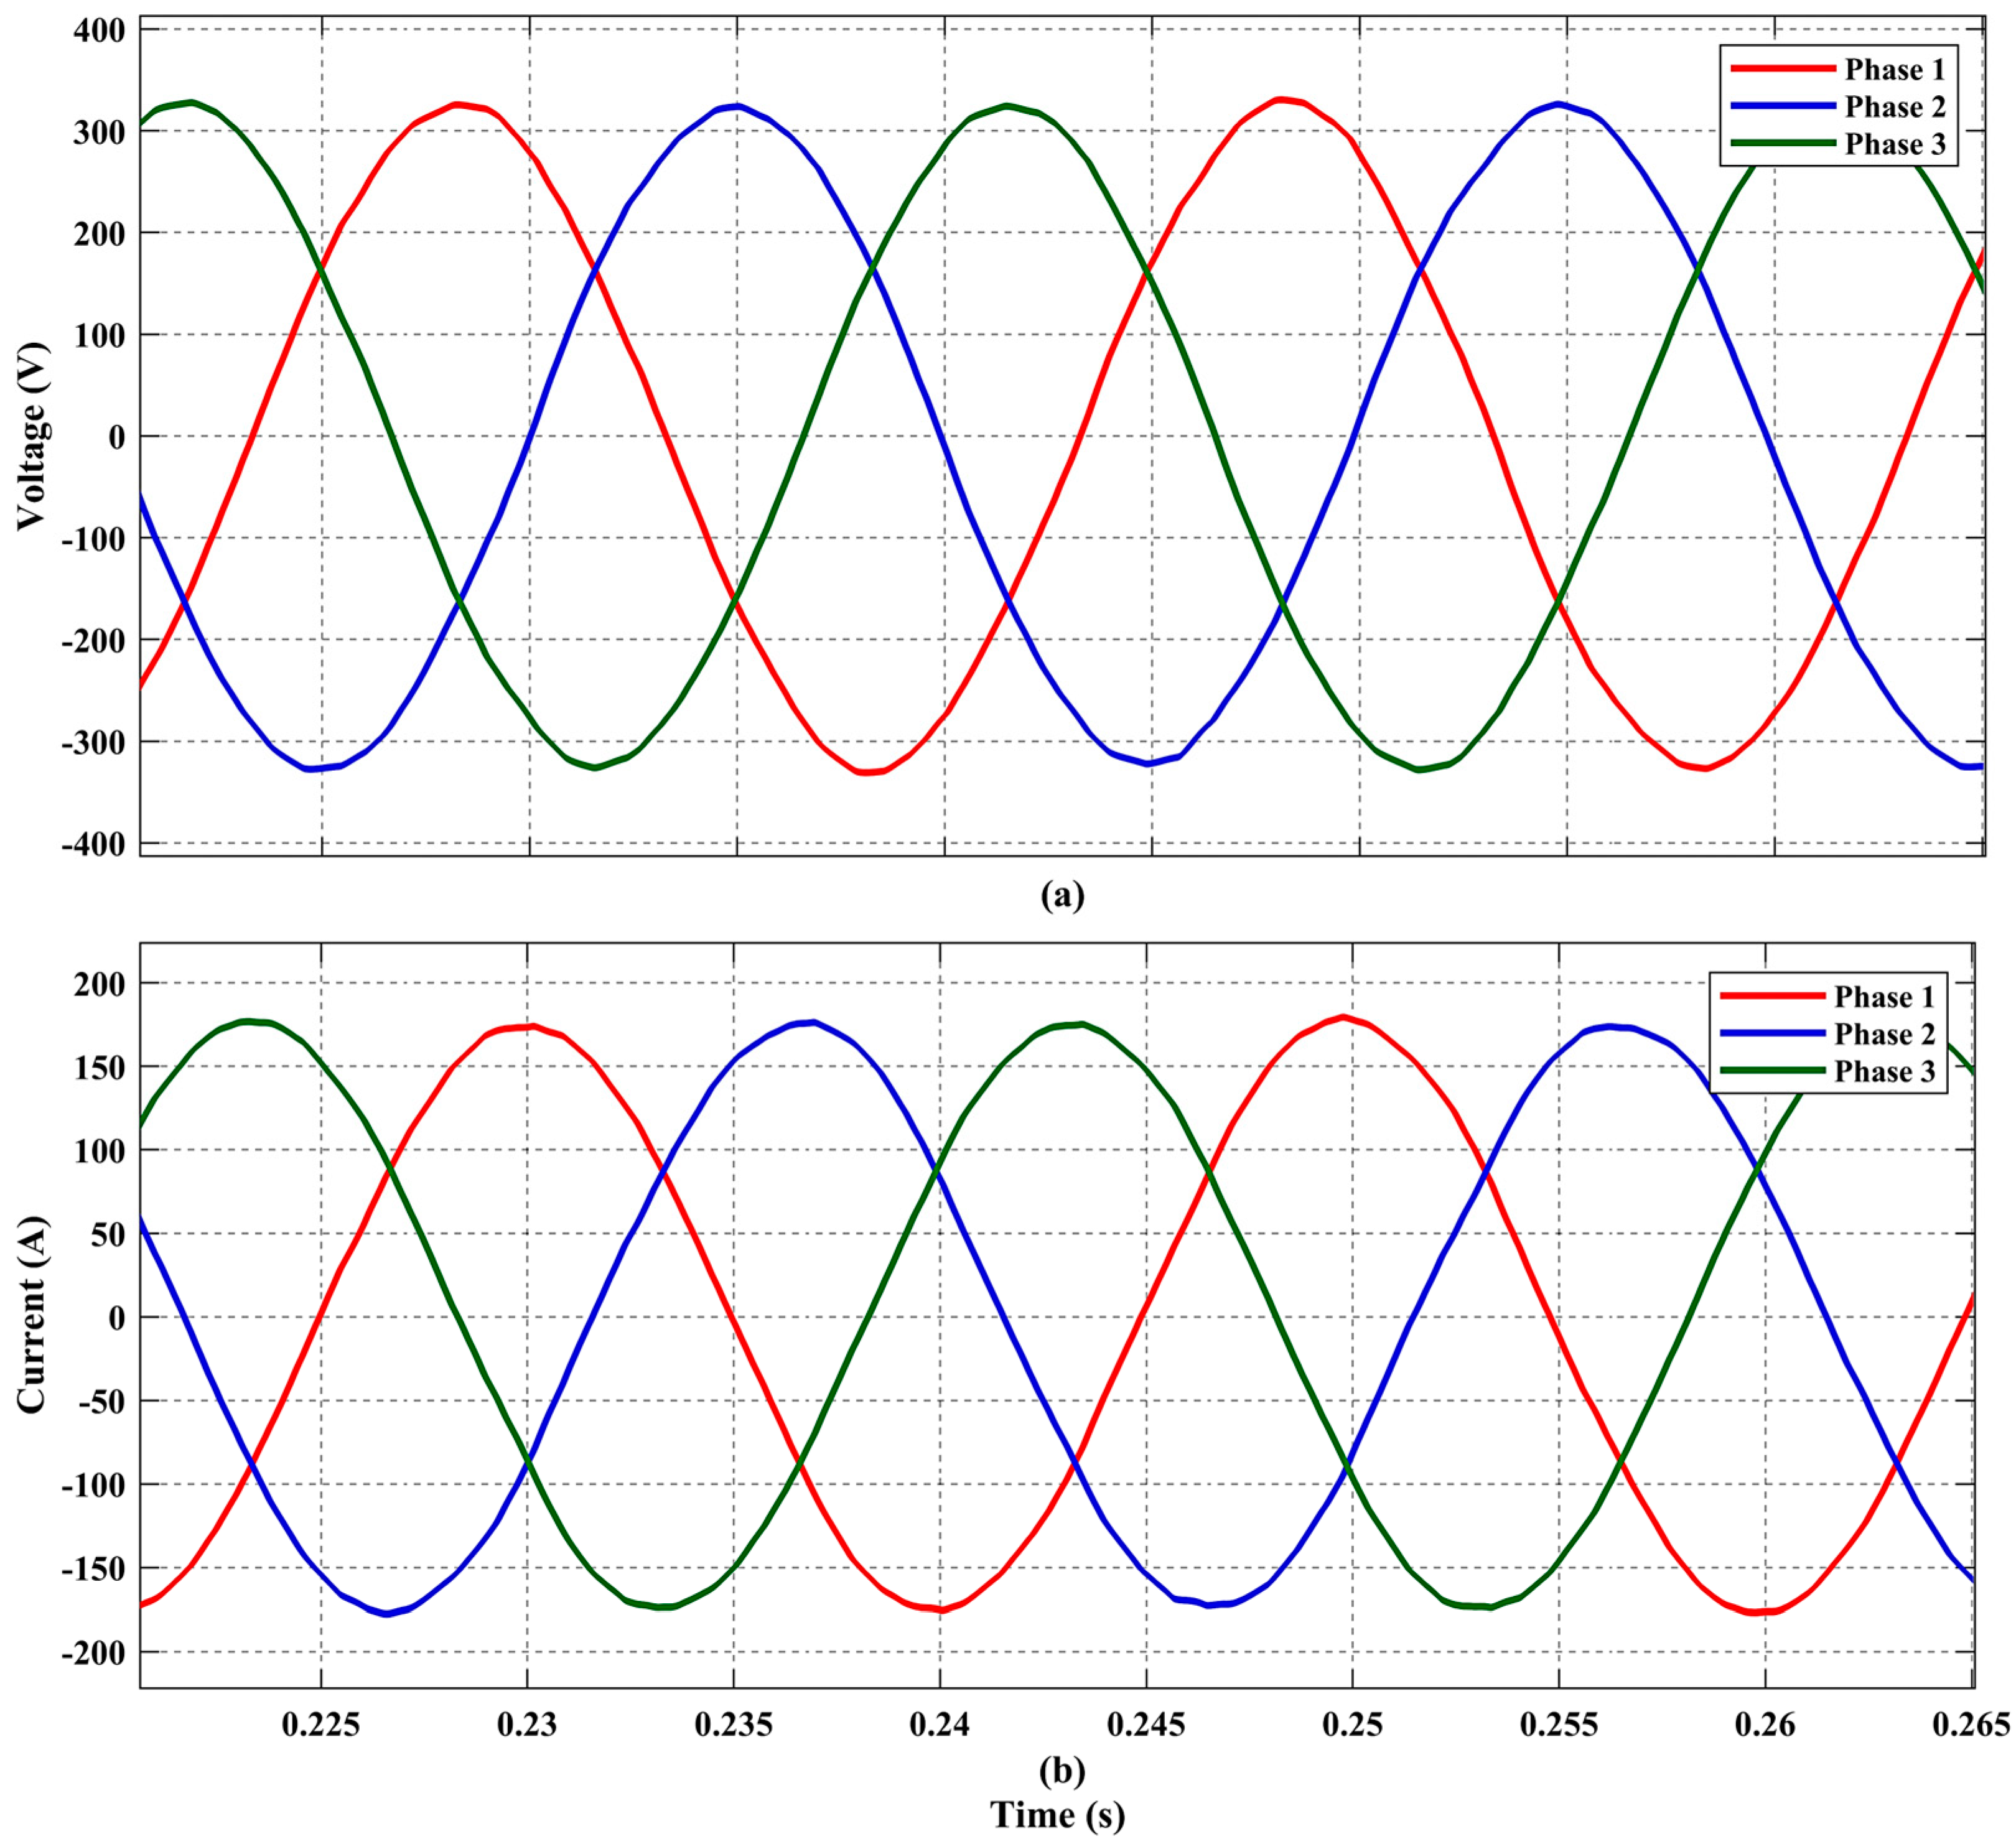
  • It carries out dynamic modeling of the proposed hybrid power system using MATLAB Simulink to analyze the system’s response, voltage transients, load impact, and power quality under diverse conditions, which are specifically related to the control station under consideration.
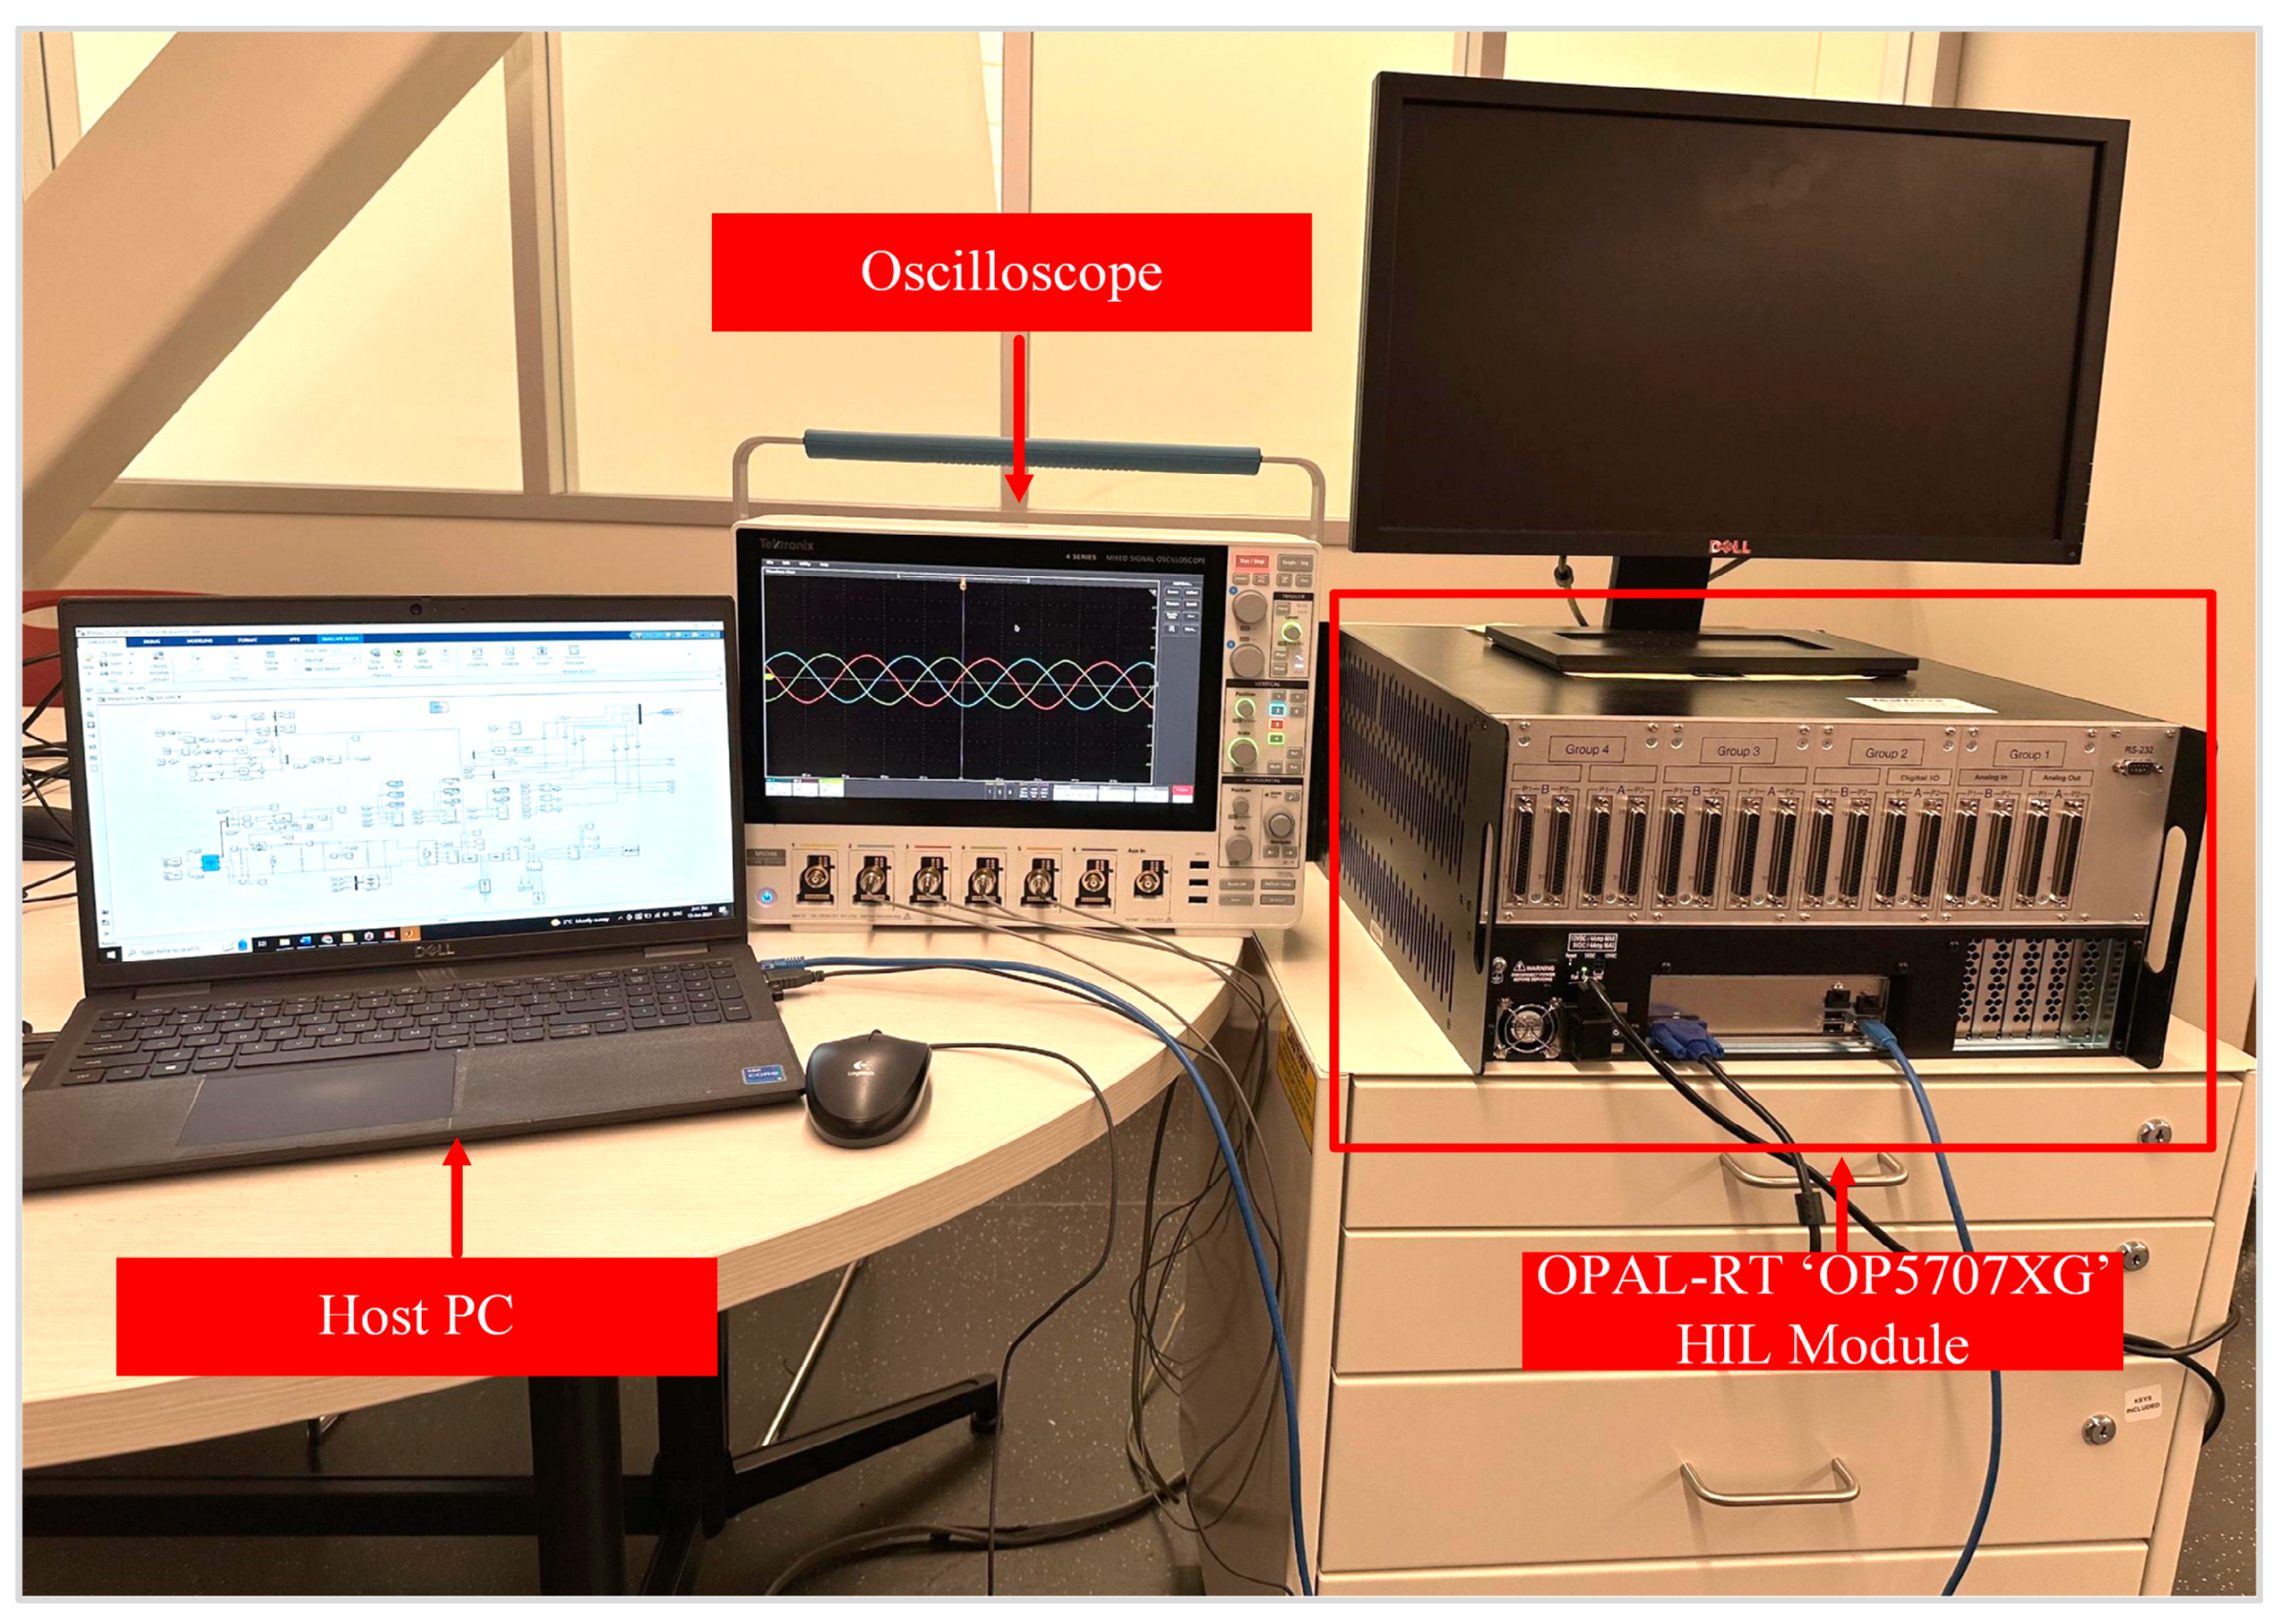
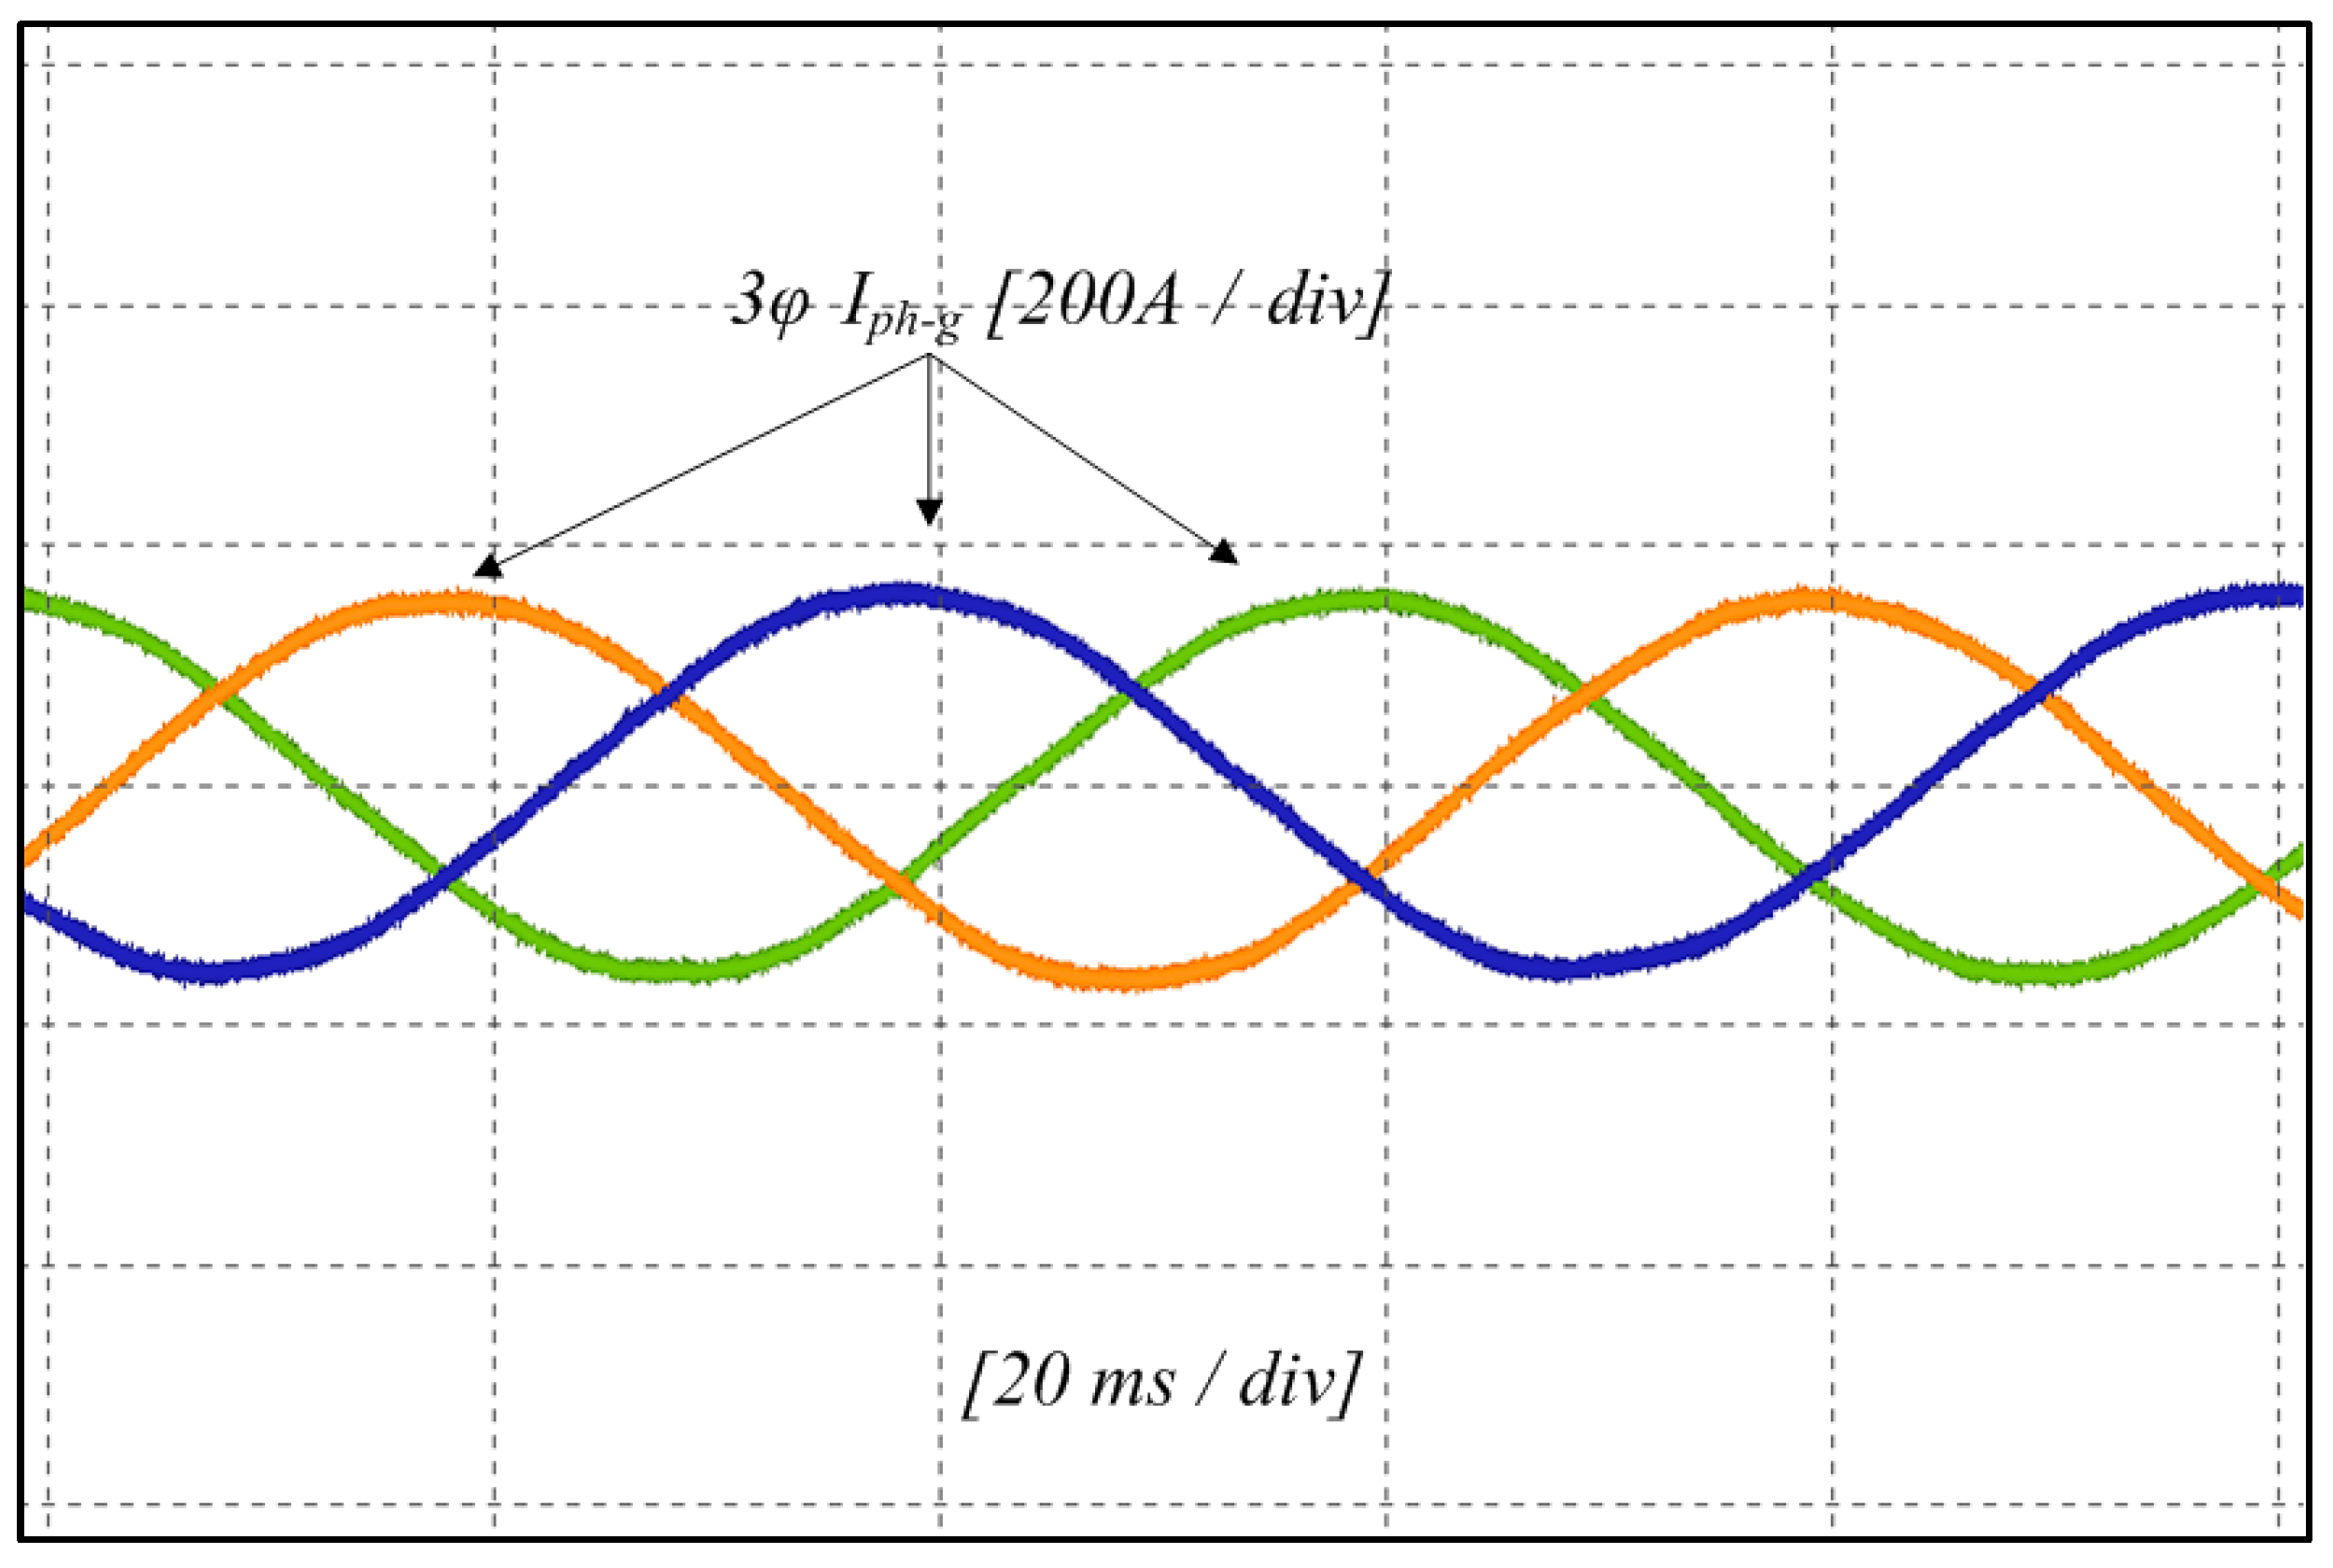
  • The experimental validation of the proposed hybrid power system (HPS) is carried out using hardware in the loop (HIL), and the real-time OPAL-RT Technologies’ OP5707XG simulator (OPAL-RT, Montreal, QC, Canada) is used to confirm the systems’ robustness and overall performance.
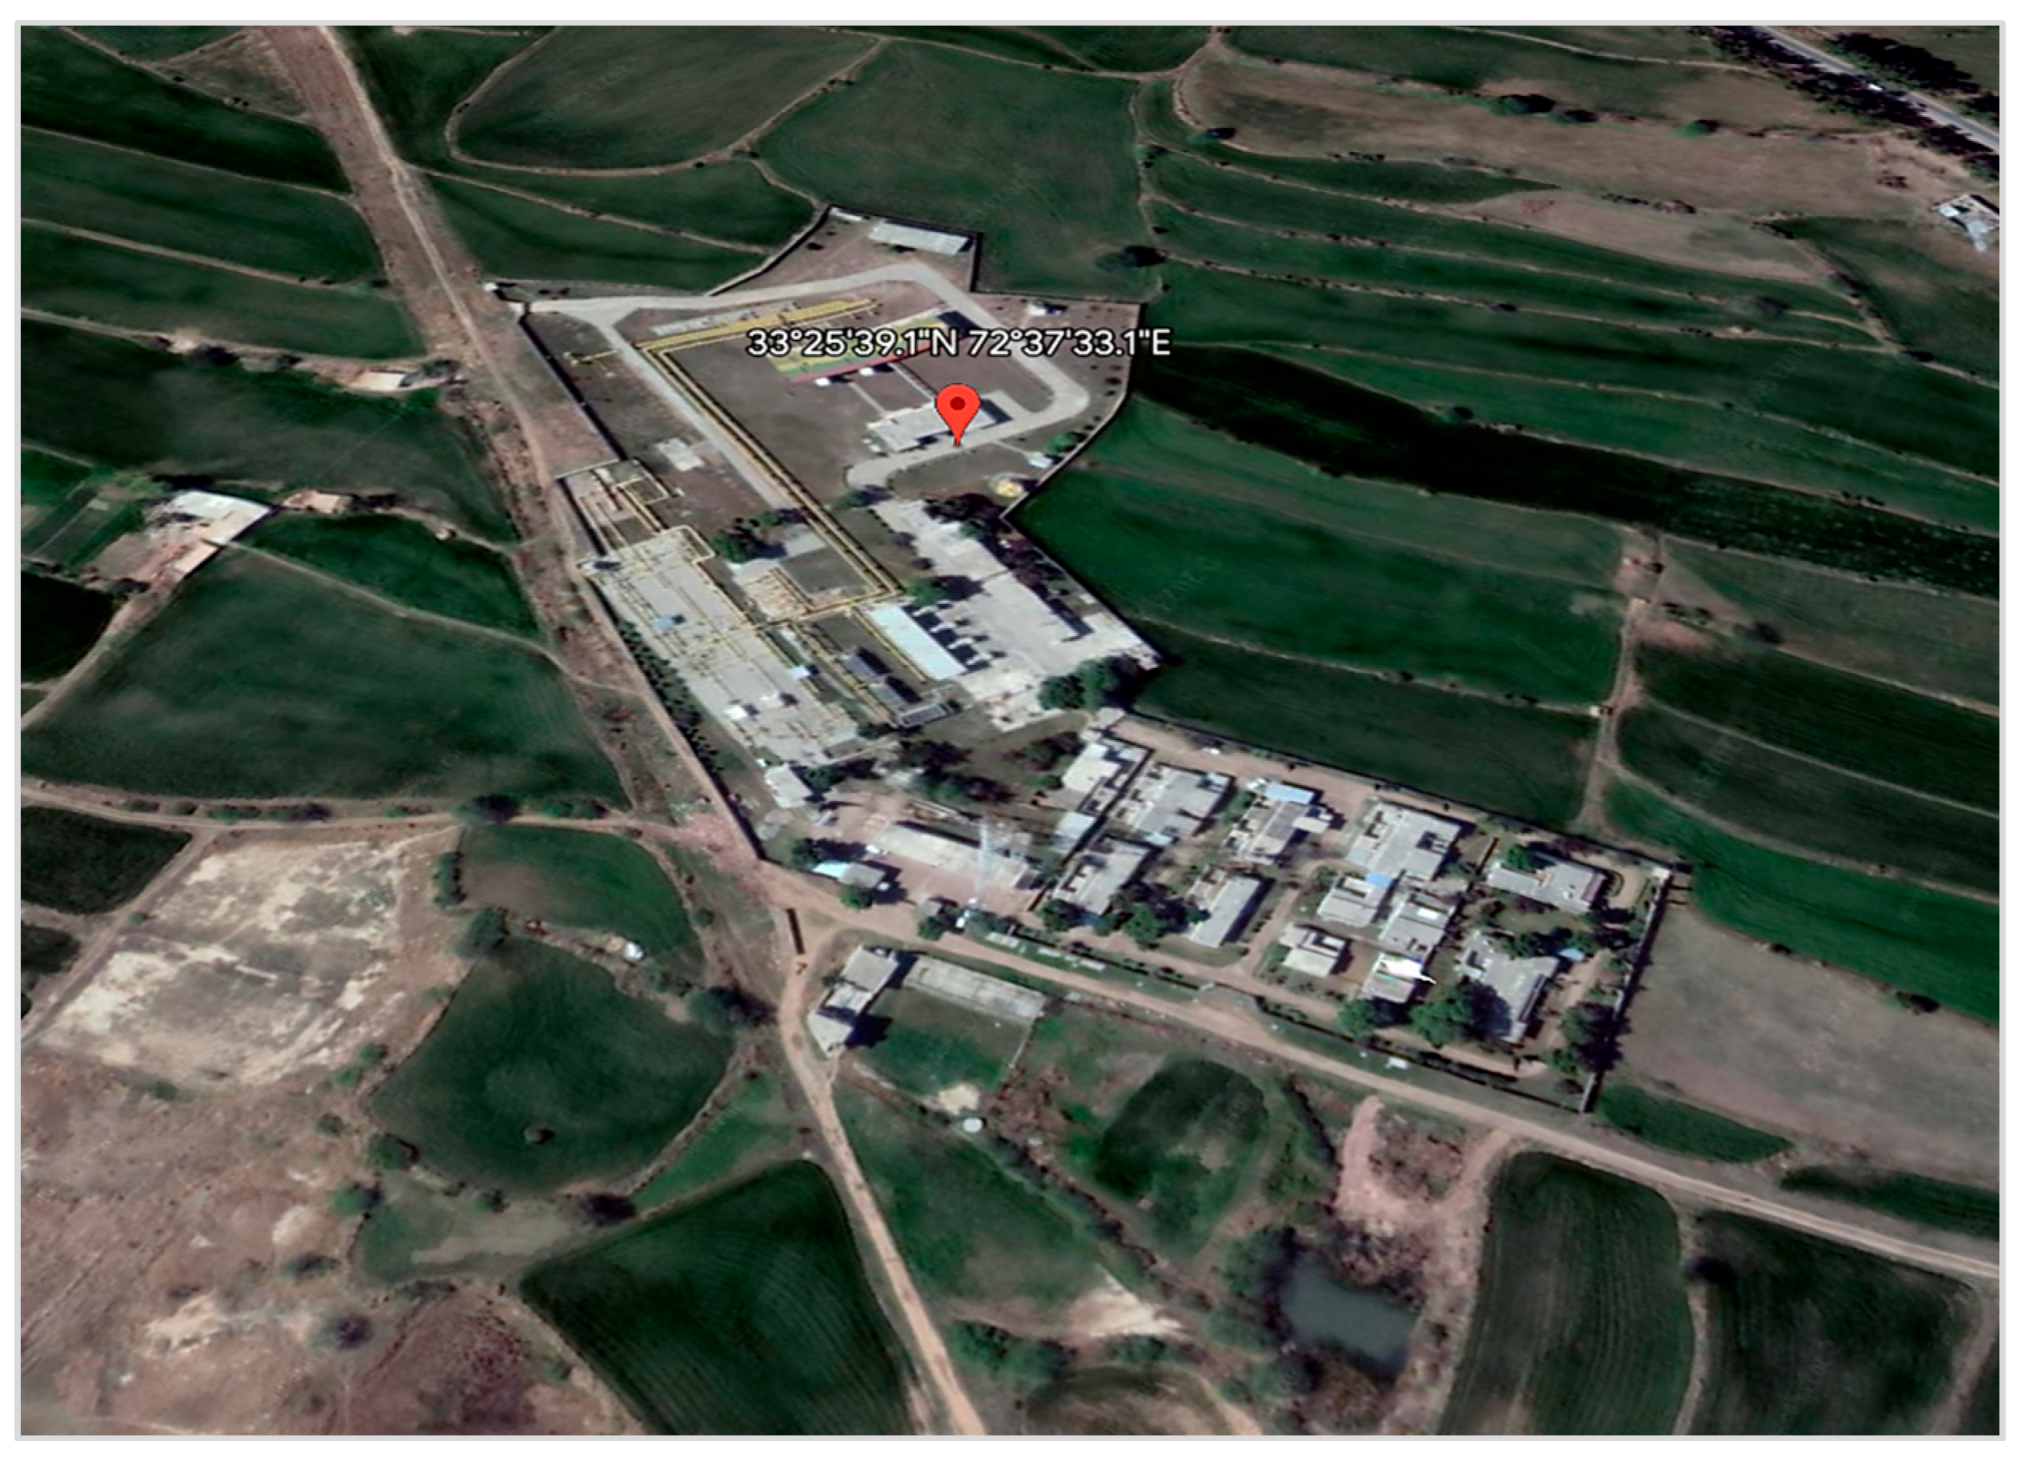
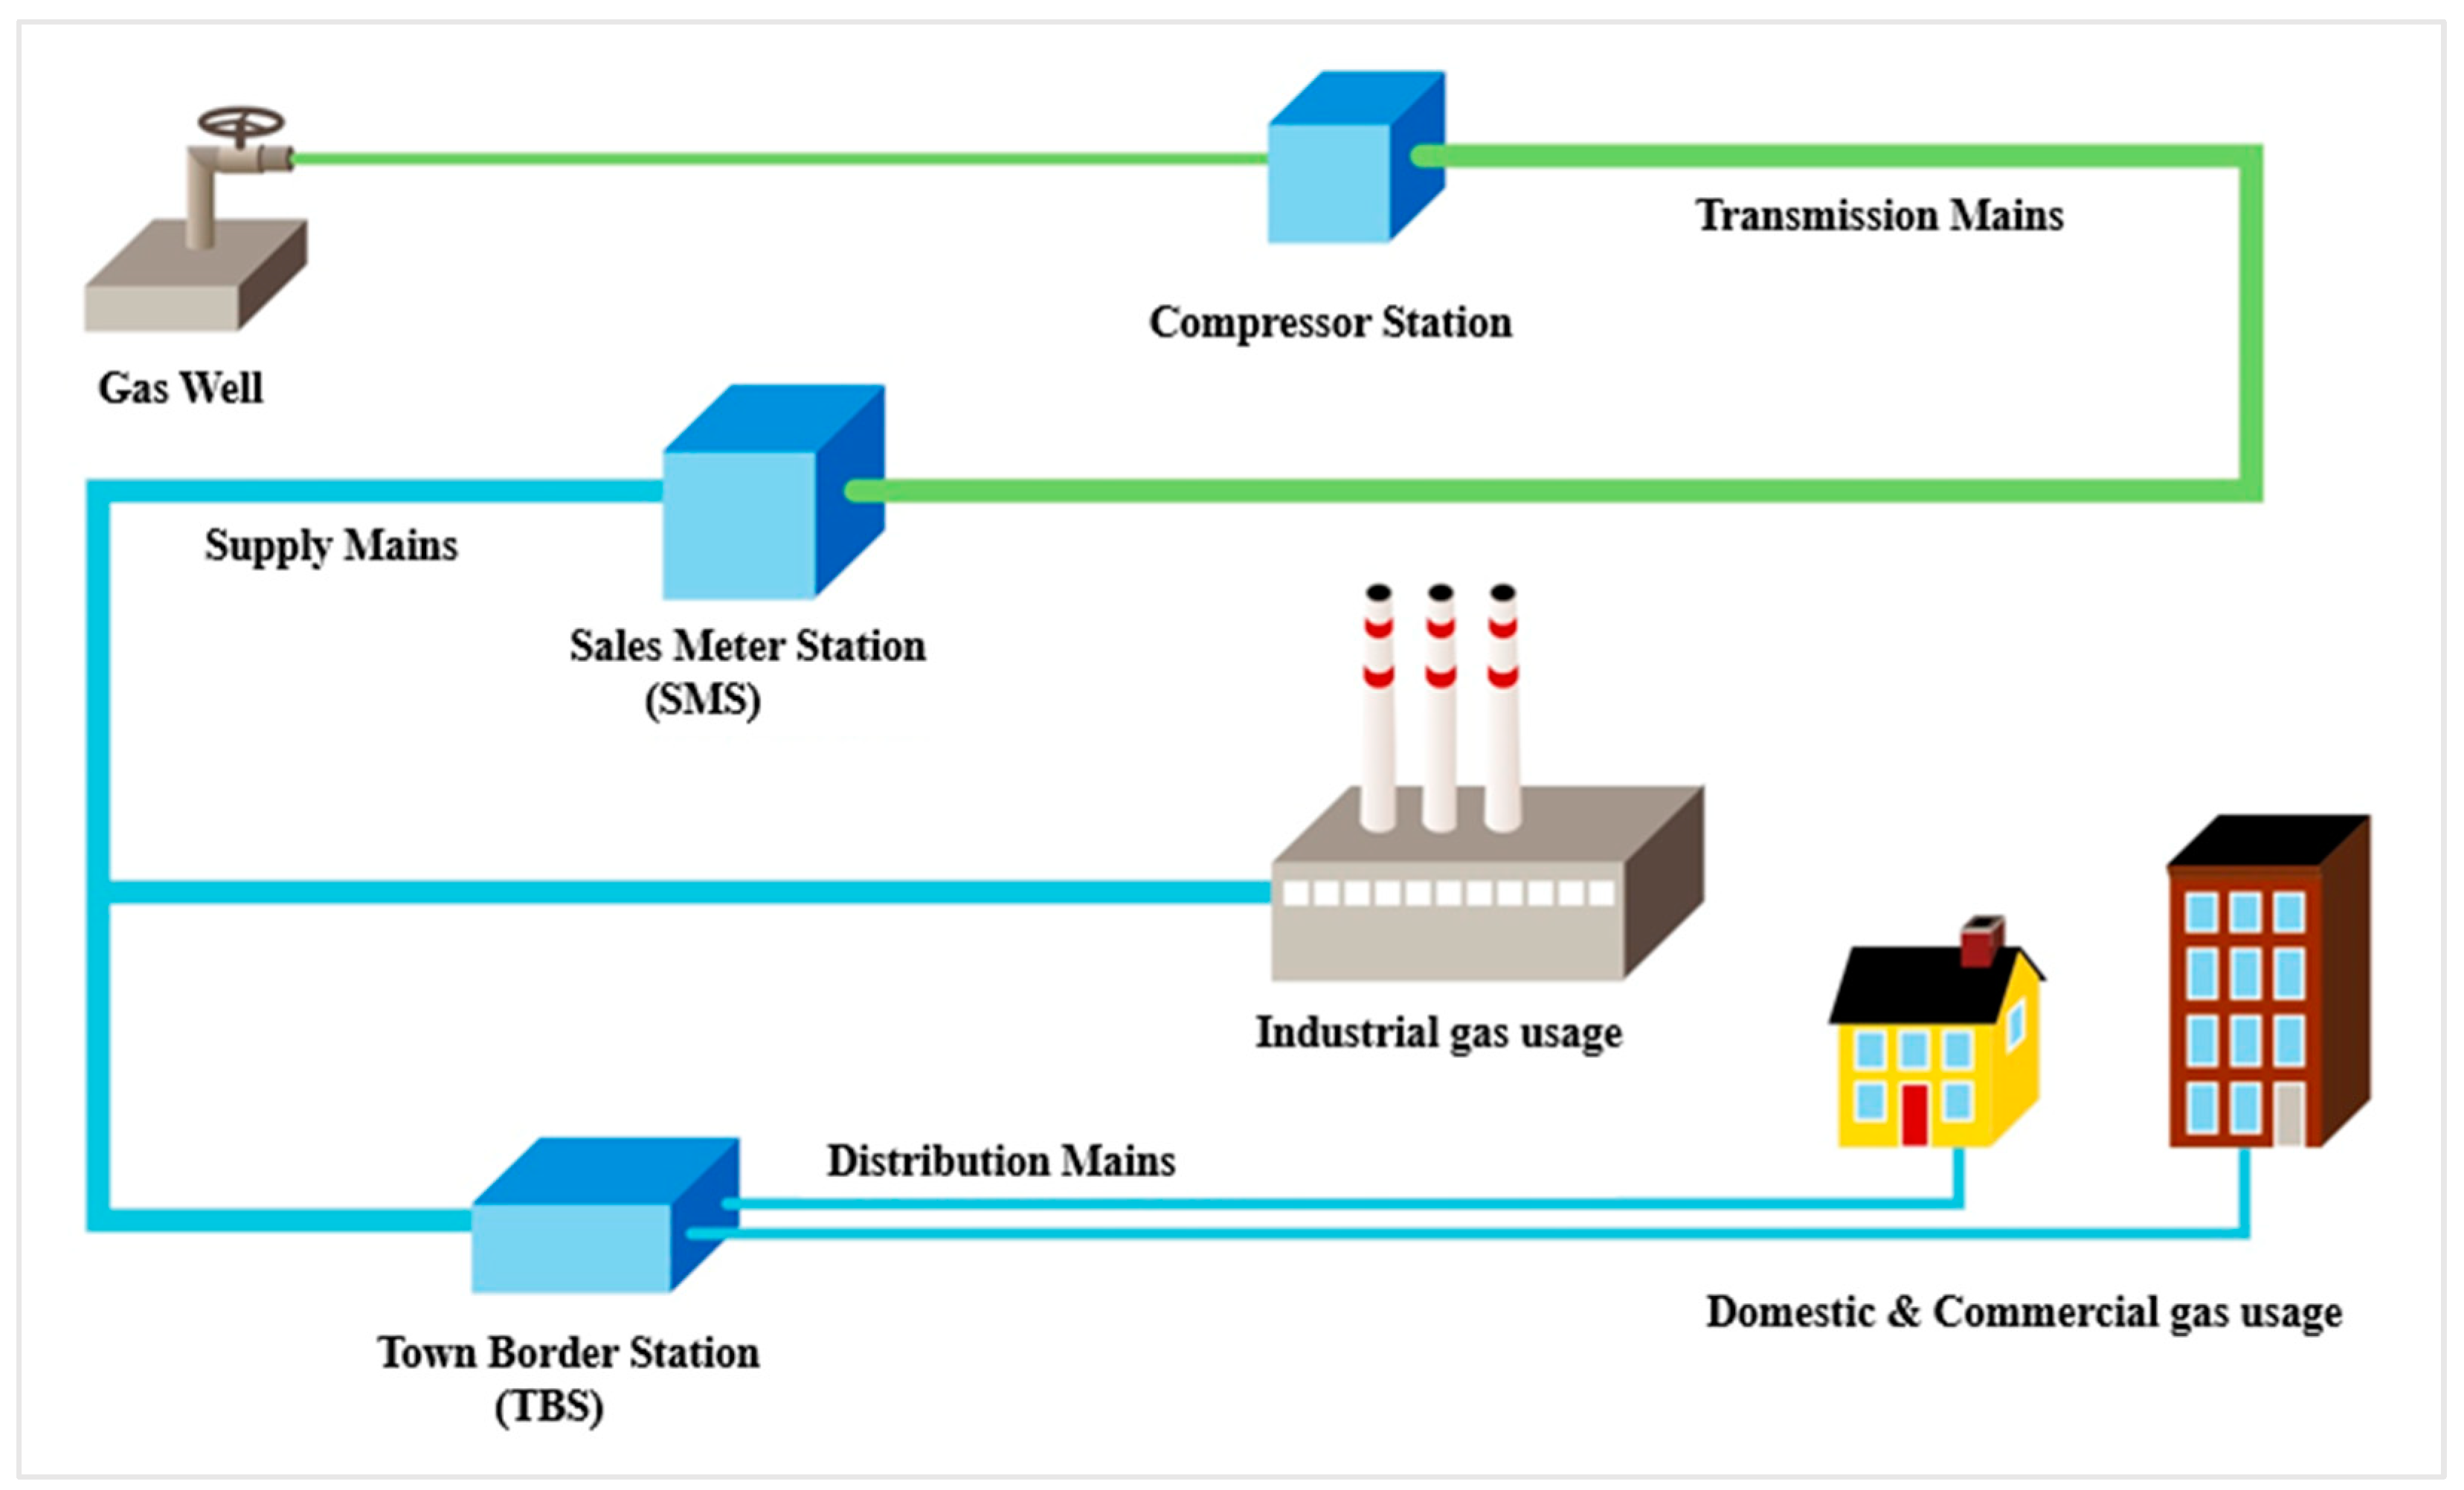
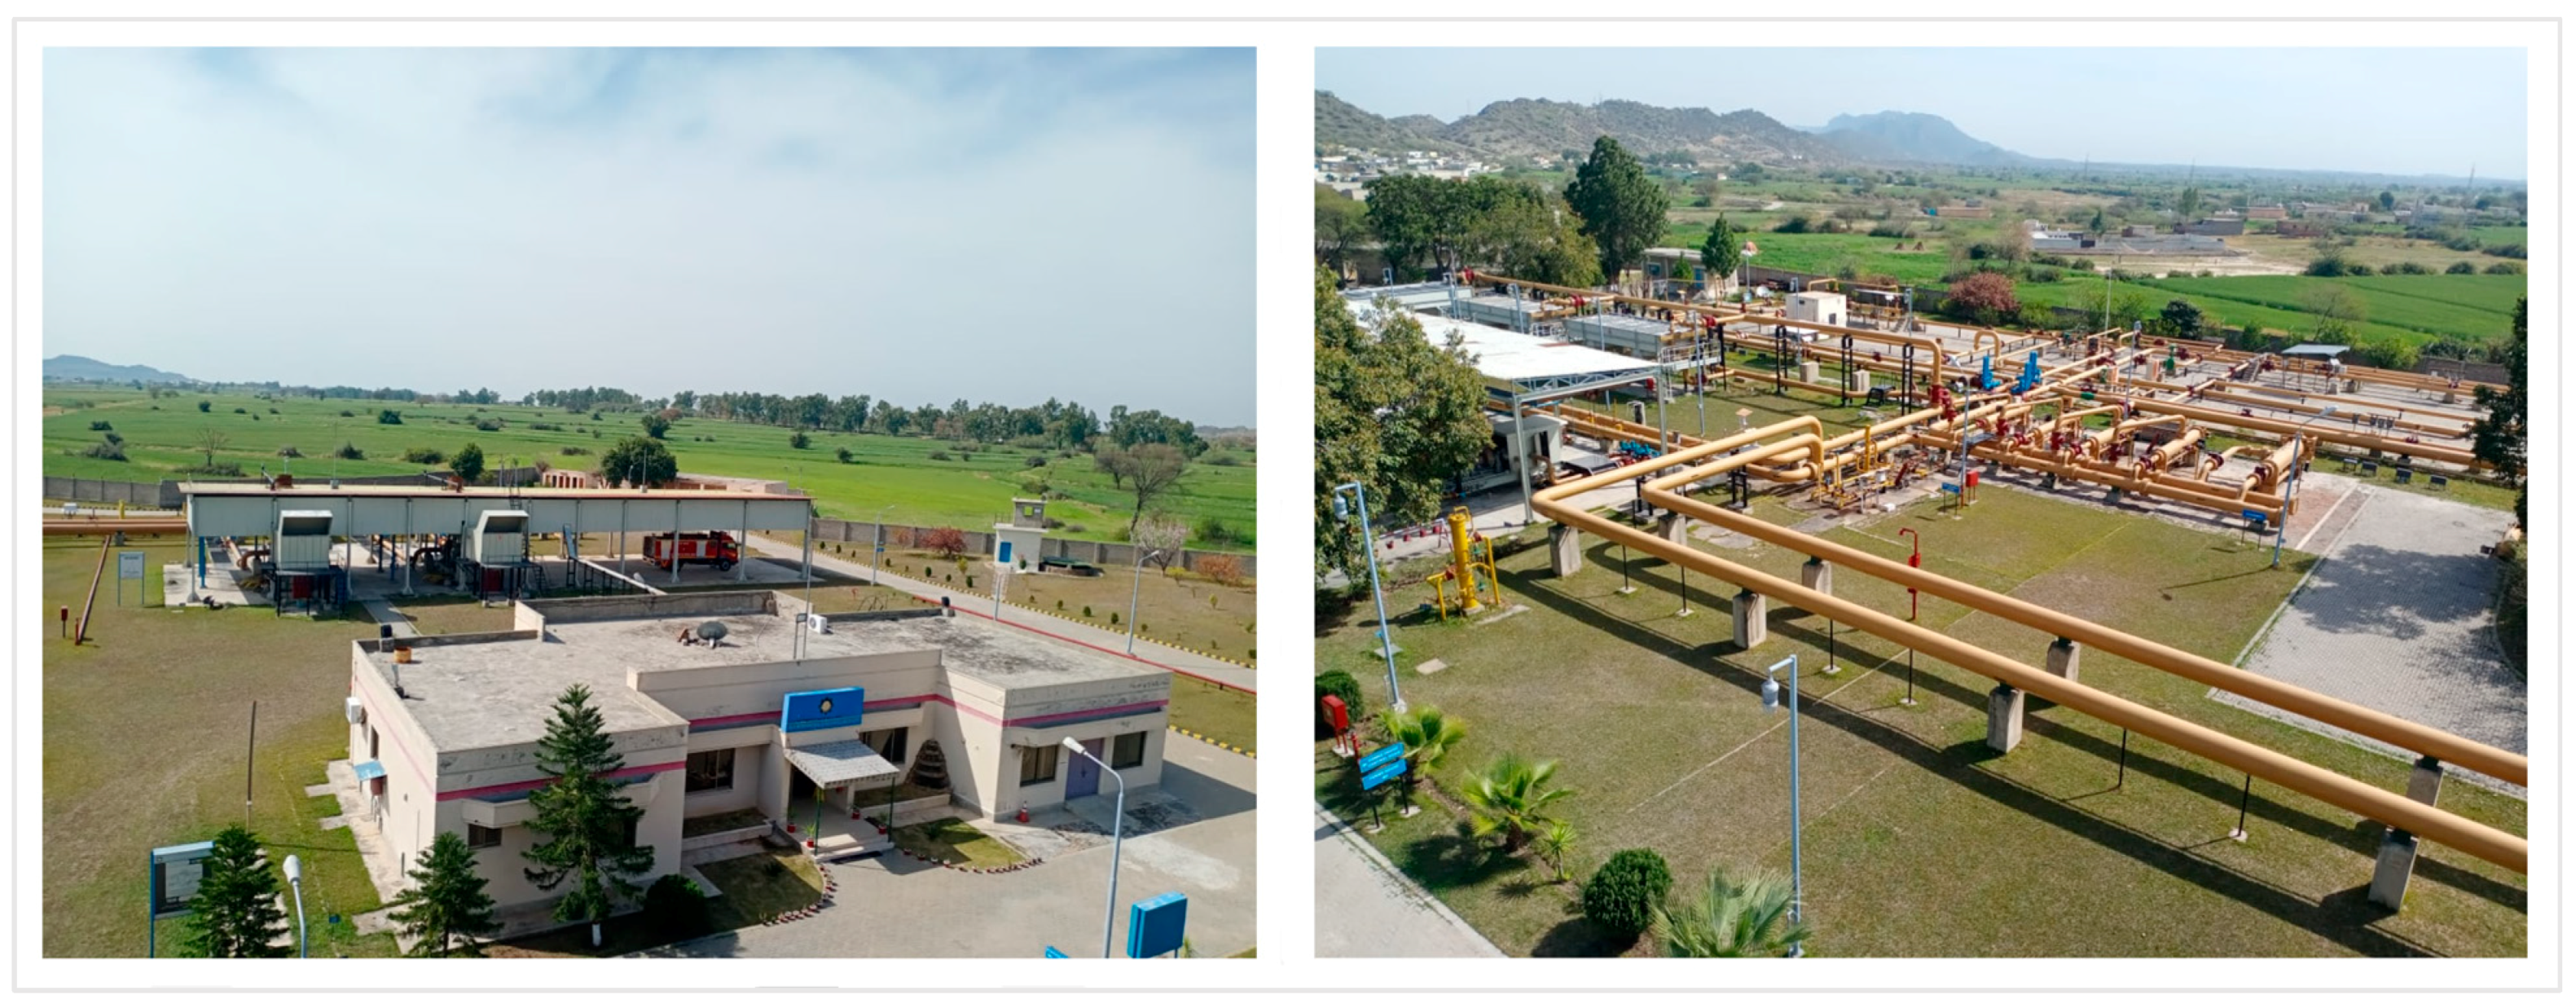
2. Site Selection

One of the most fundamental choices made during any project’s establishment, expansion, or relocation is the site selection. The installation of a solar photovoltaic system component in large-scale hybrid power systems requires a significant long-term investment; therefore, choosing the right site is crucial to the system’s success or failure. Hence, finding the best location with the ideal circumstances for solar photovoltaic system installation is one of the primary goals in the site selection process. The primary factors to consider when selecting a site for a solar photovoltaic system are solar irradiance; economic performance metrics, such as the return on investment (ROI), internal rate of return (IRR), and net present value (NPV); along with carbon emission reductions and policy support [23].
SNGPL is the biggest integrated natural gas provider in North Central Pakistan, serving over 7.22 million customers over a vast network spanning throughout Khyber Pakhtunkhwa (KPK), Punjab, and Azad Jammu and Kashmir (AJ&K). SNGPL’s transmission network comprises 9239 km of high-pressure gas pipelines, while the distribution network comprises 142,998 km of low-pressure gas pipelines. Pipeline control stations play a crucial role in the compression and elevation of natural gas pressure, facilitating transportation from gas wells to end consumers. SNGPL operates eleven compressor stations to compress natural gas efficiently, ensuring its delivery to the doorsteps of end consumers. The overall operation of the company’s business is shown in Figure 5.
The site selected to be a part of this research is one of the natural gas compressor stations operated by Sui Northern Gas Pipelines Limited (SNGPL) in Pakistan. This selected site is located in a remote and sparsely populated area named Gali Jagir, Fateh Jhang (33.427522, 72.625862). An aerial view of the site on Google Maps is shown in Figure 6.
Figure 7 shows several viewpoints of the selected natural gas pipeline control station. The site covers a total area of 11 acres, with a designated 6-acre section for the compressor station and a 5-acre area for residential blocks. Ample space is present at the selected site, encompassing both rooftop and ground areas and providing opportunities for the installation of solar PV panels.

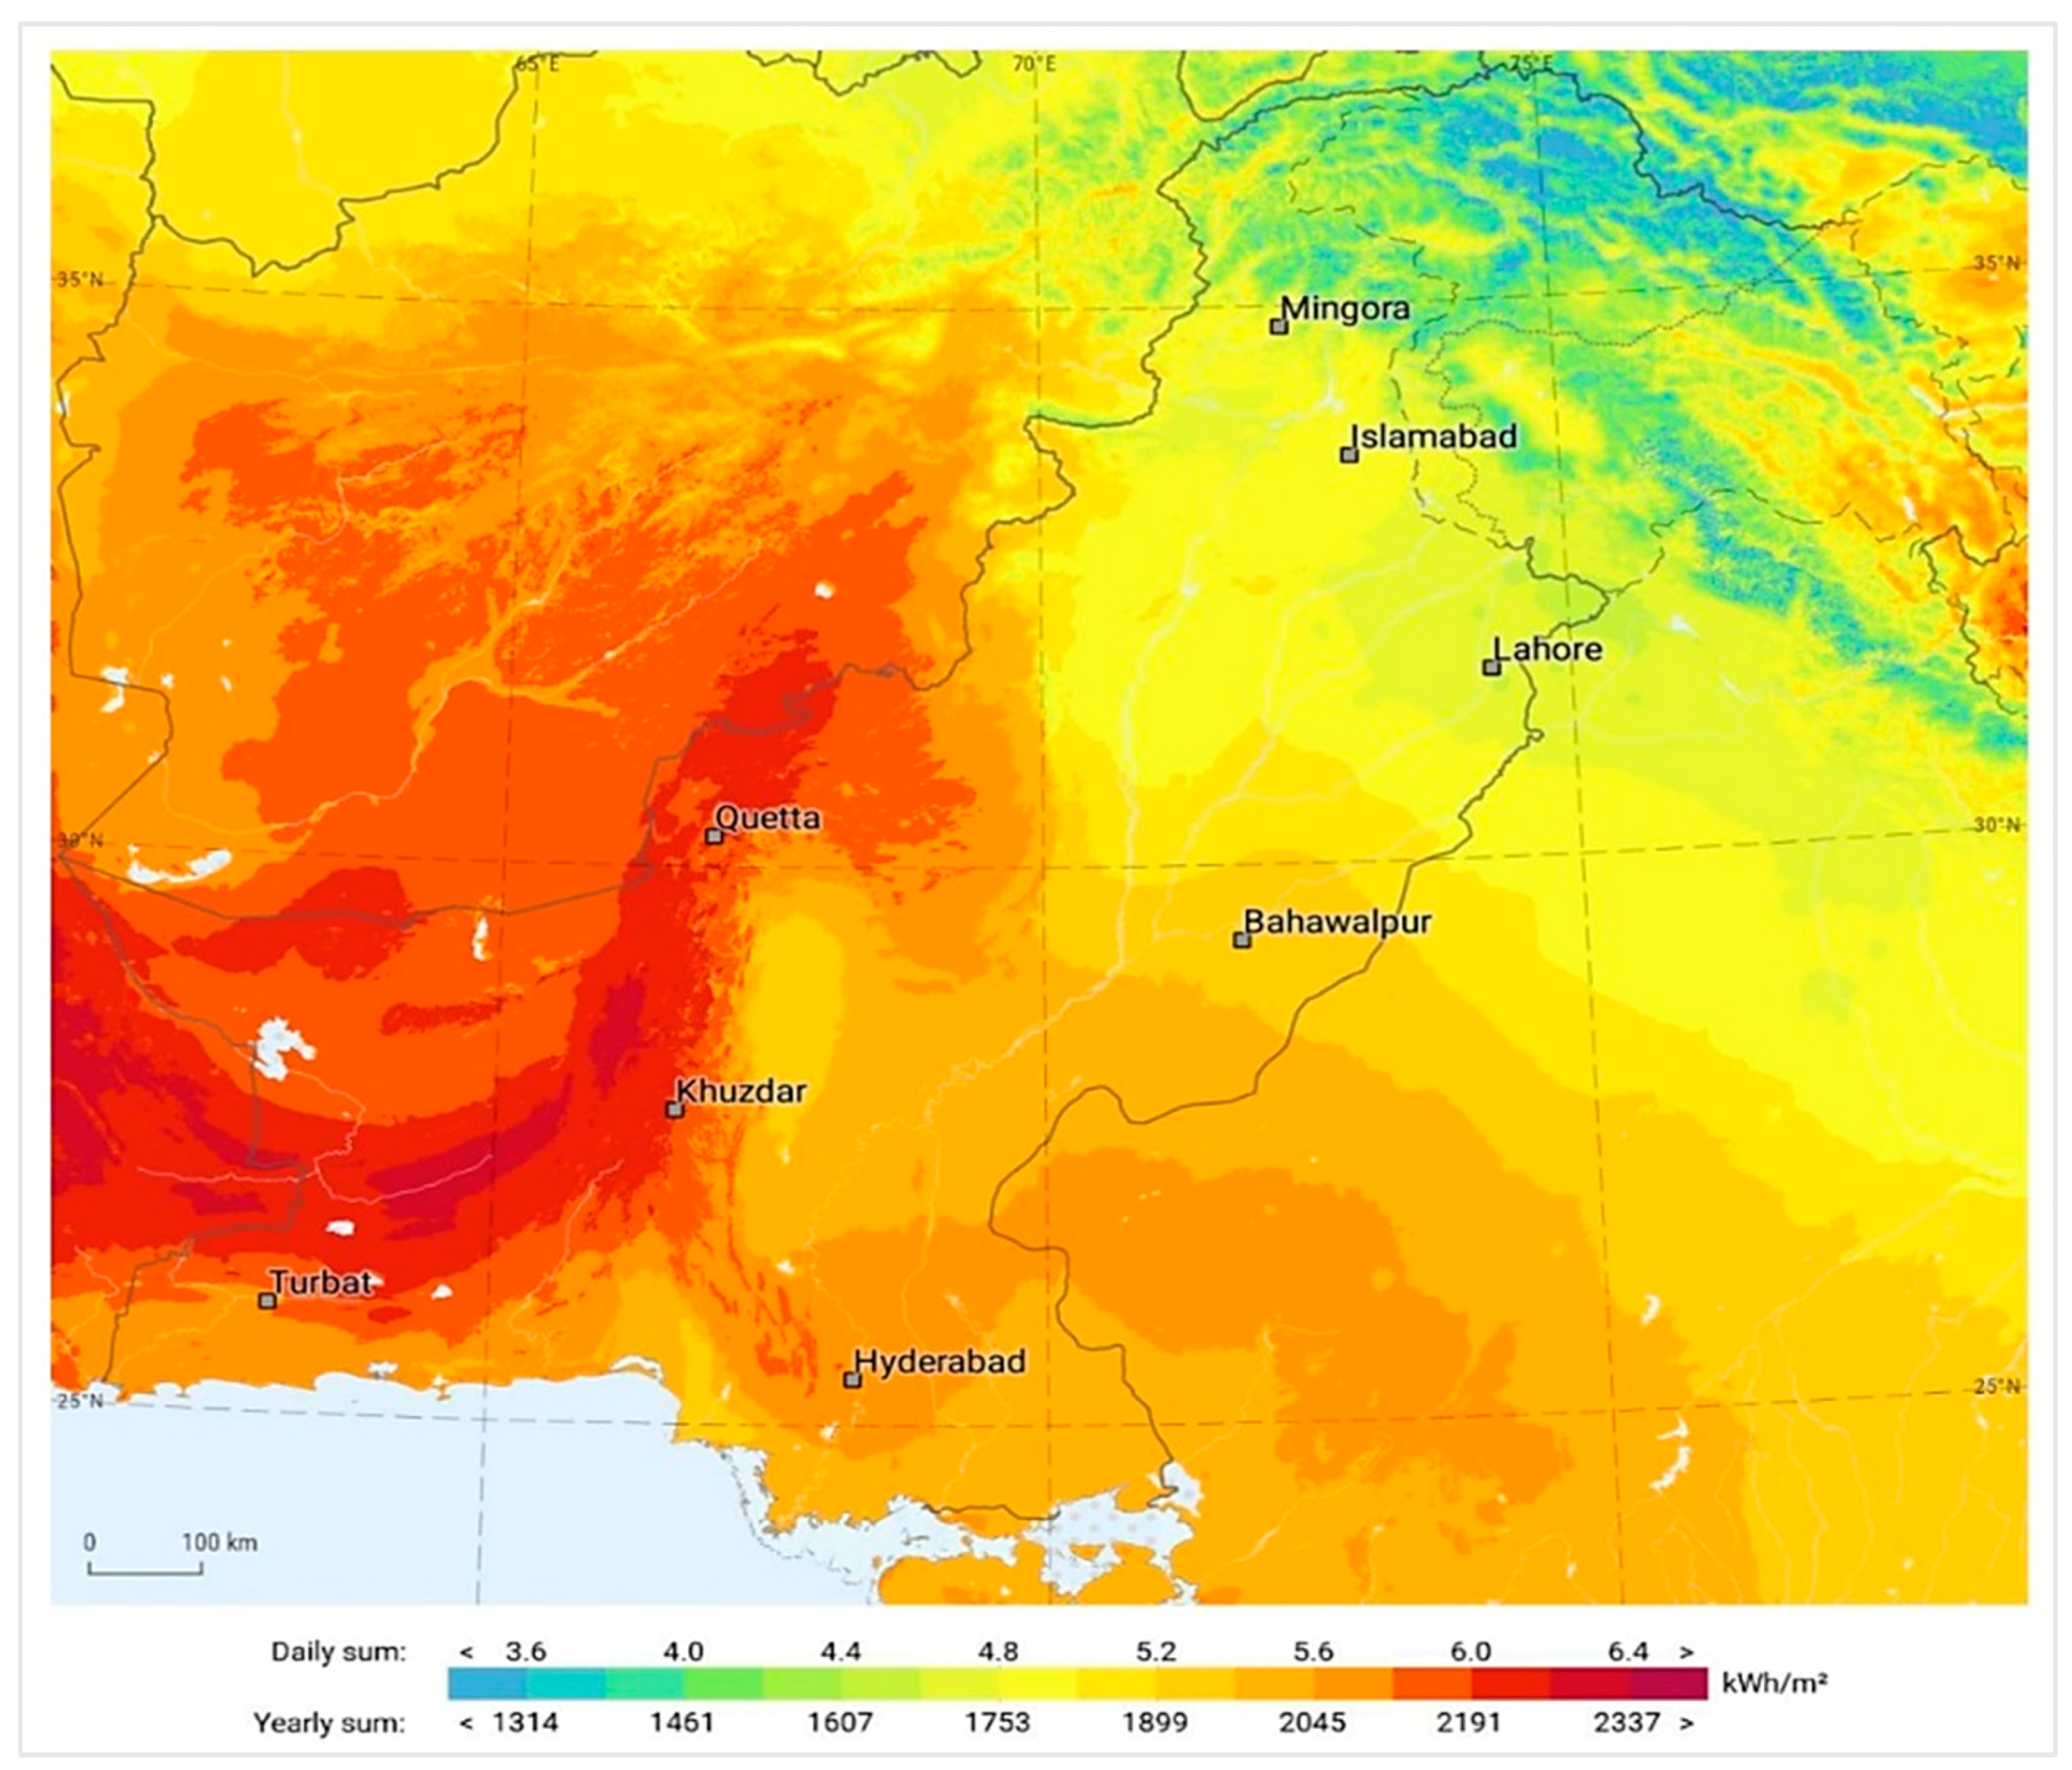
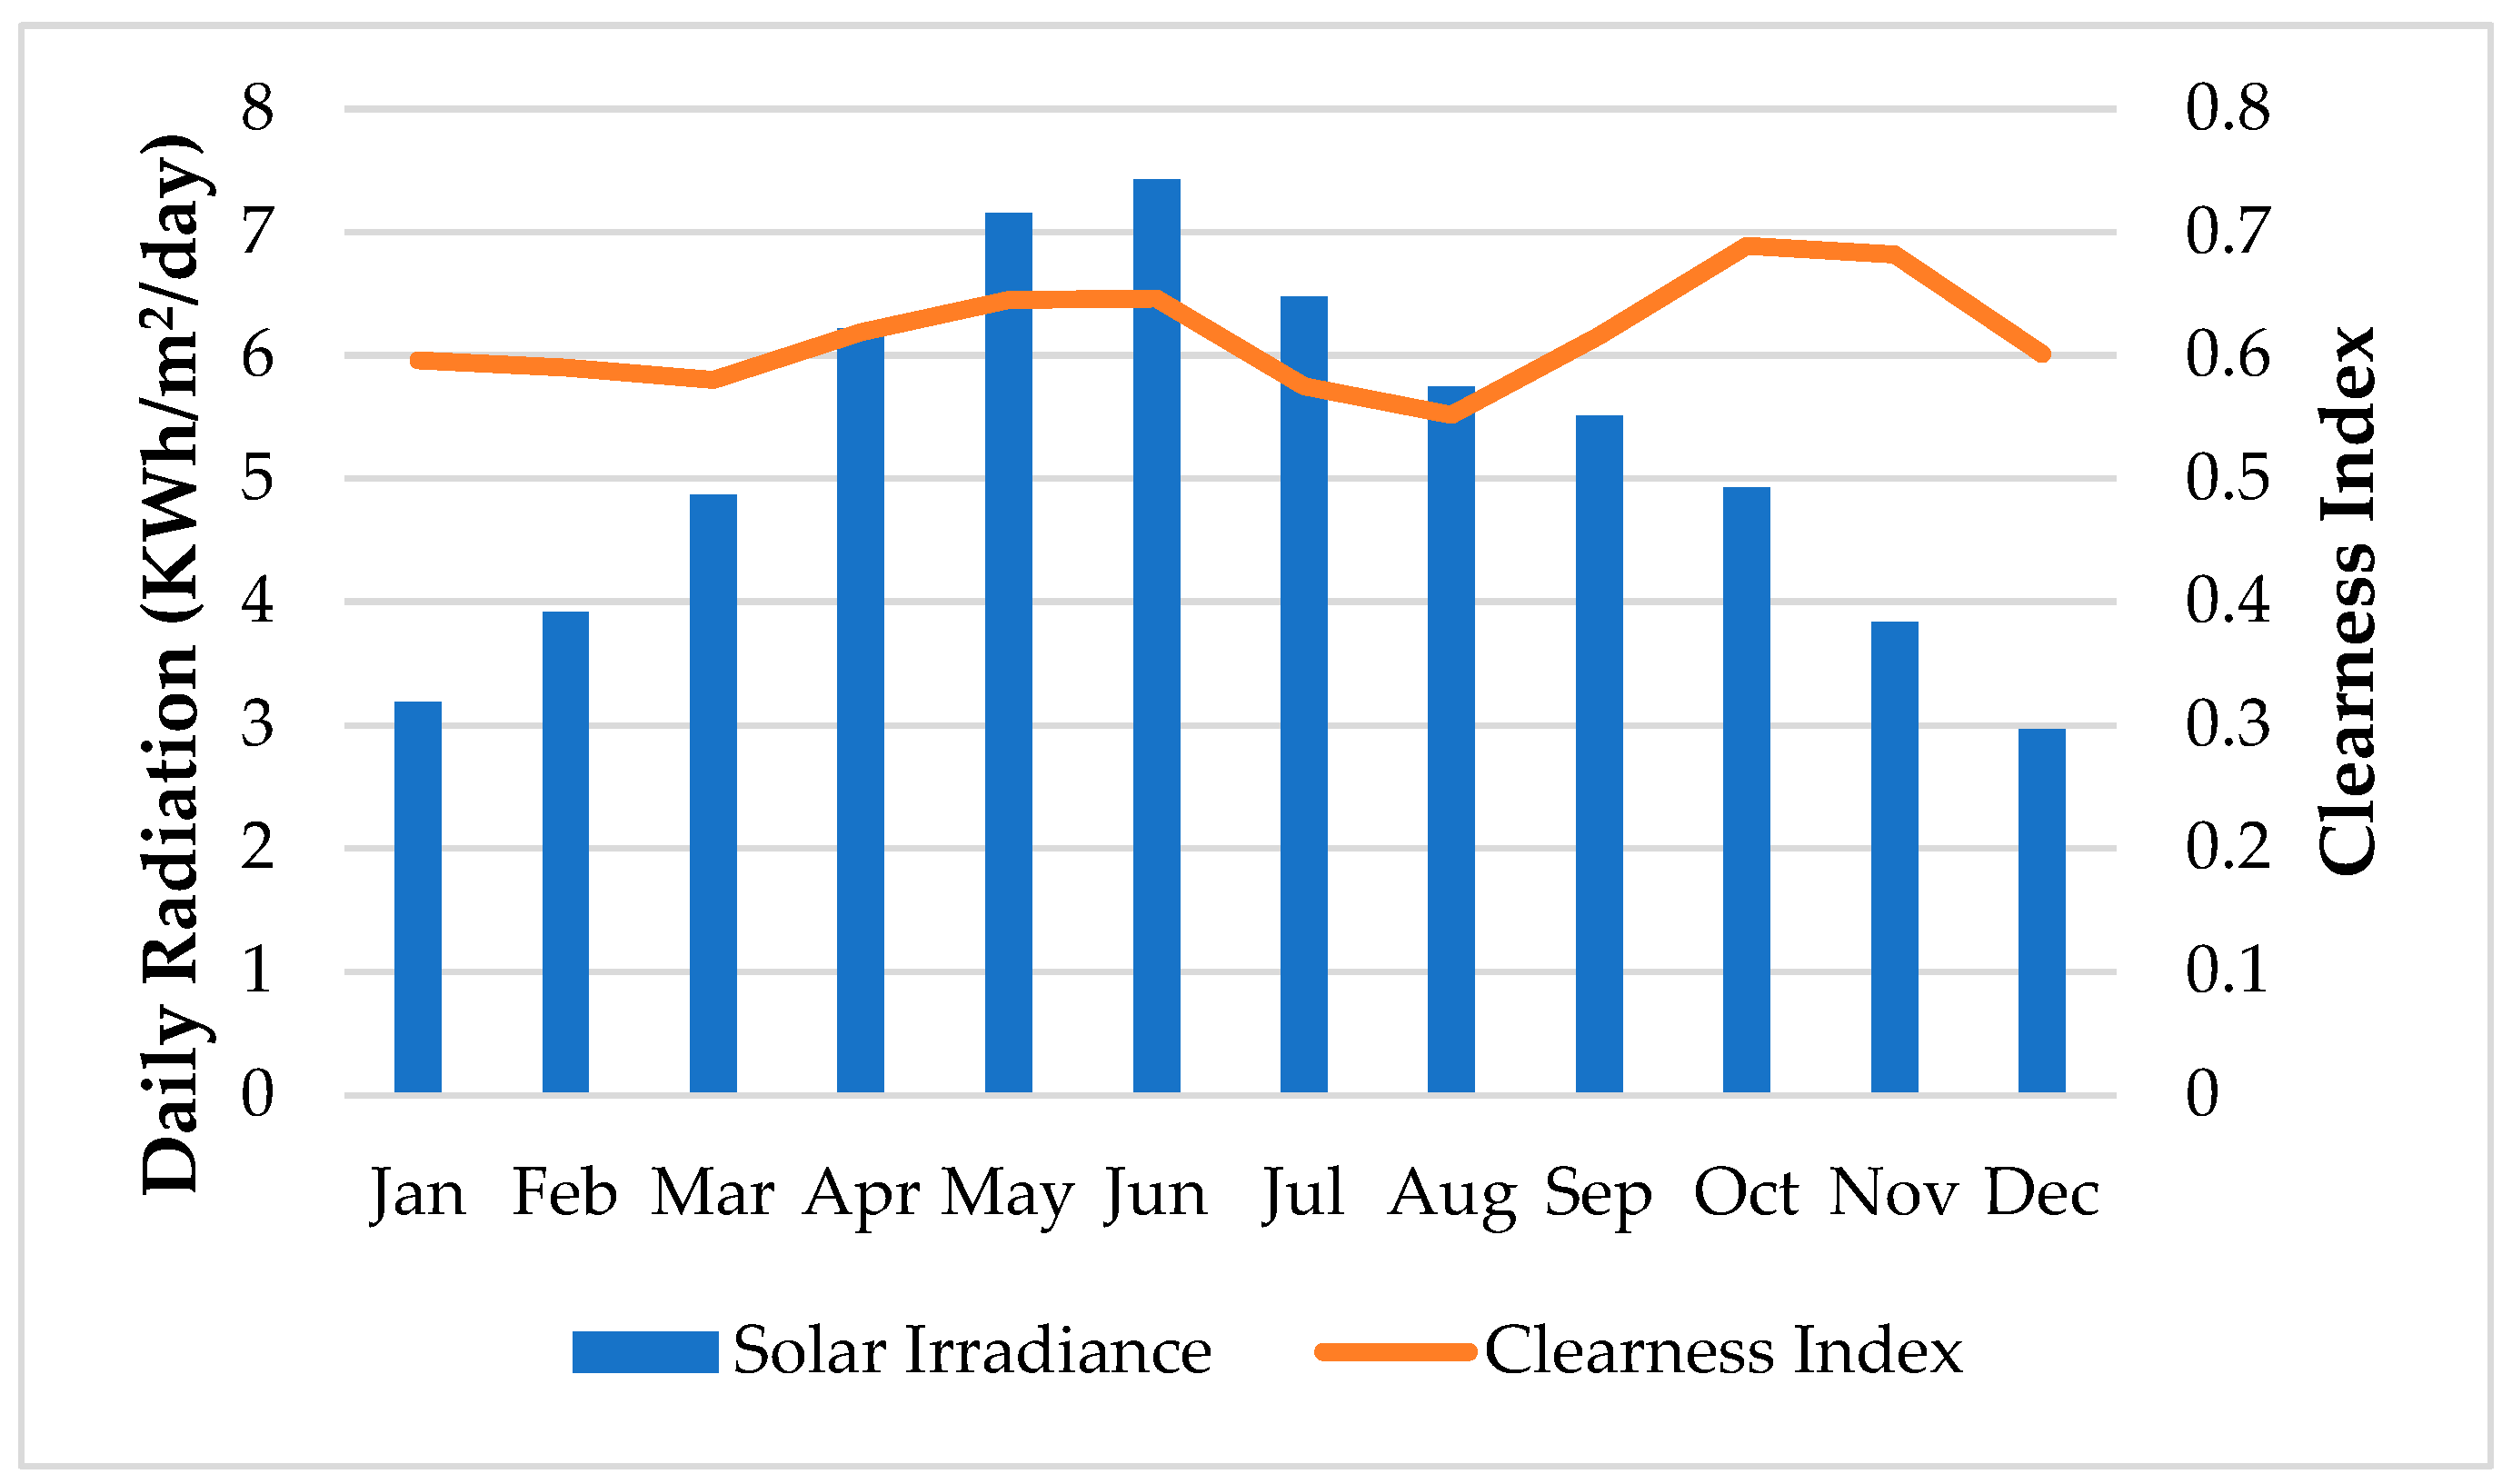
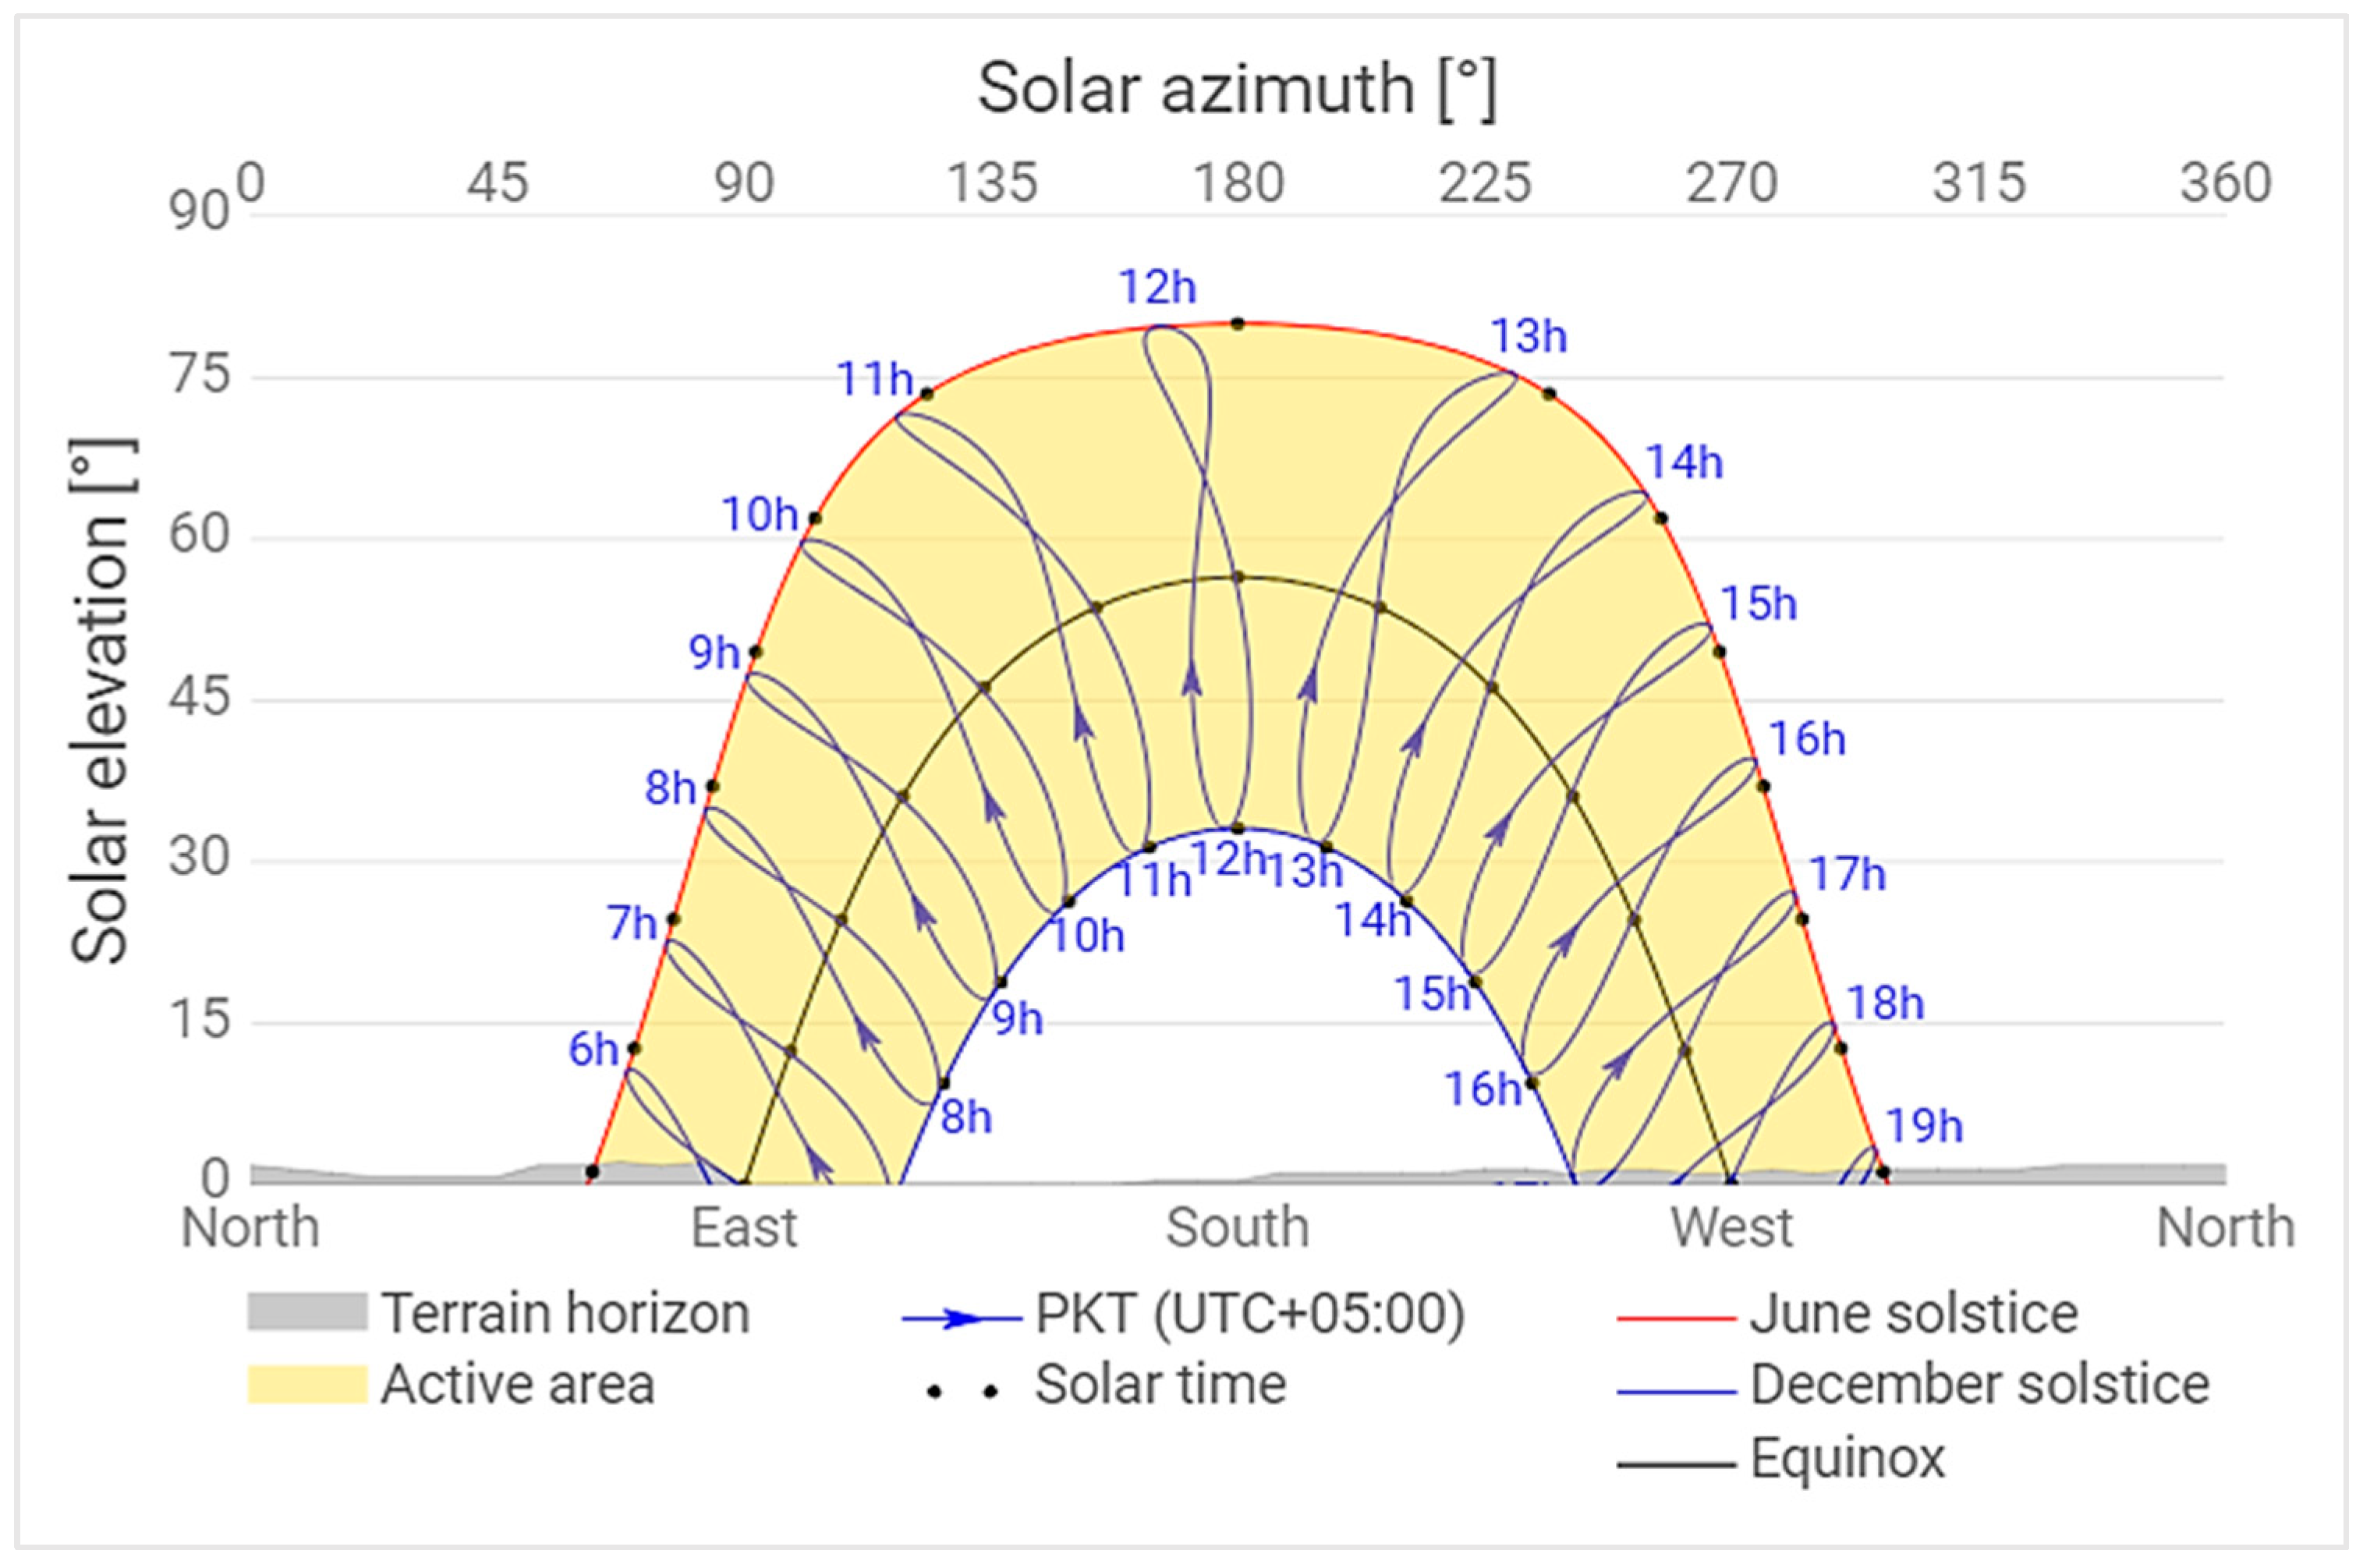
2.1. Global Horizontal Irradiance (GHI)

Global horizontal irradiance (GHI), also known as solar global horizontal irradiance, is vital in assessing site viability. It is a measurement of the solar radiation intensity in a particular place. The solar global horizontal irradiance data for the selected site is obtained from the NASA Surface Meteorology and Solar Energy Database using the HOMER Pro software, as depicted in Figure 8. Solar energy remains consistently available at the chosen location year-round, with values varying between 2.97 kWh/m2/day and 7.43 kWh/m2/day, with an annual average of 5.19 kWh/m2/day. Similarly, the clearness index is another crucial factor considered during site feasibility assessment. It quantifies the atmosphere’s clarity and is denoted by a unitless number ranging from 0 to 1. The clearness index for the selected site ranges between 0.552 and 0.689, as illustrated in Figure 8.
Apart from various factors, such as atmospheric conditions, air pollution, and cloud cover, the angle at which sunlight strikes a solar cell affects how much solar energy reaches its surface. This angle, known as the altitude or elevation angle, represents the sun’s vertical position relative to the horizontal plane and varies throughout the day as the sun moves across the sky. This angle is influenced by factors such as the observer’s geographical location, the time of day, and the time of year [24]. The solar azimuth angle (z) represents the angle formed by the projection of sunlight onto a line extending either north or south. This angle is determined within the horizontal plane and can be measured using two different conventions, either clockwise or counterclockwise [25]. The solar elevation and the solar azimuth variation for the selected site throughout the year are obtained using an online tool named ‘Solargis Prospect’, as shown in Figure 9.

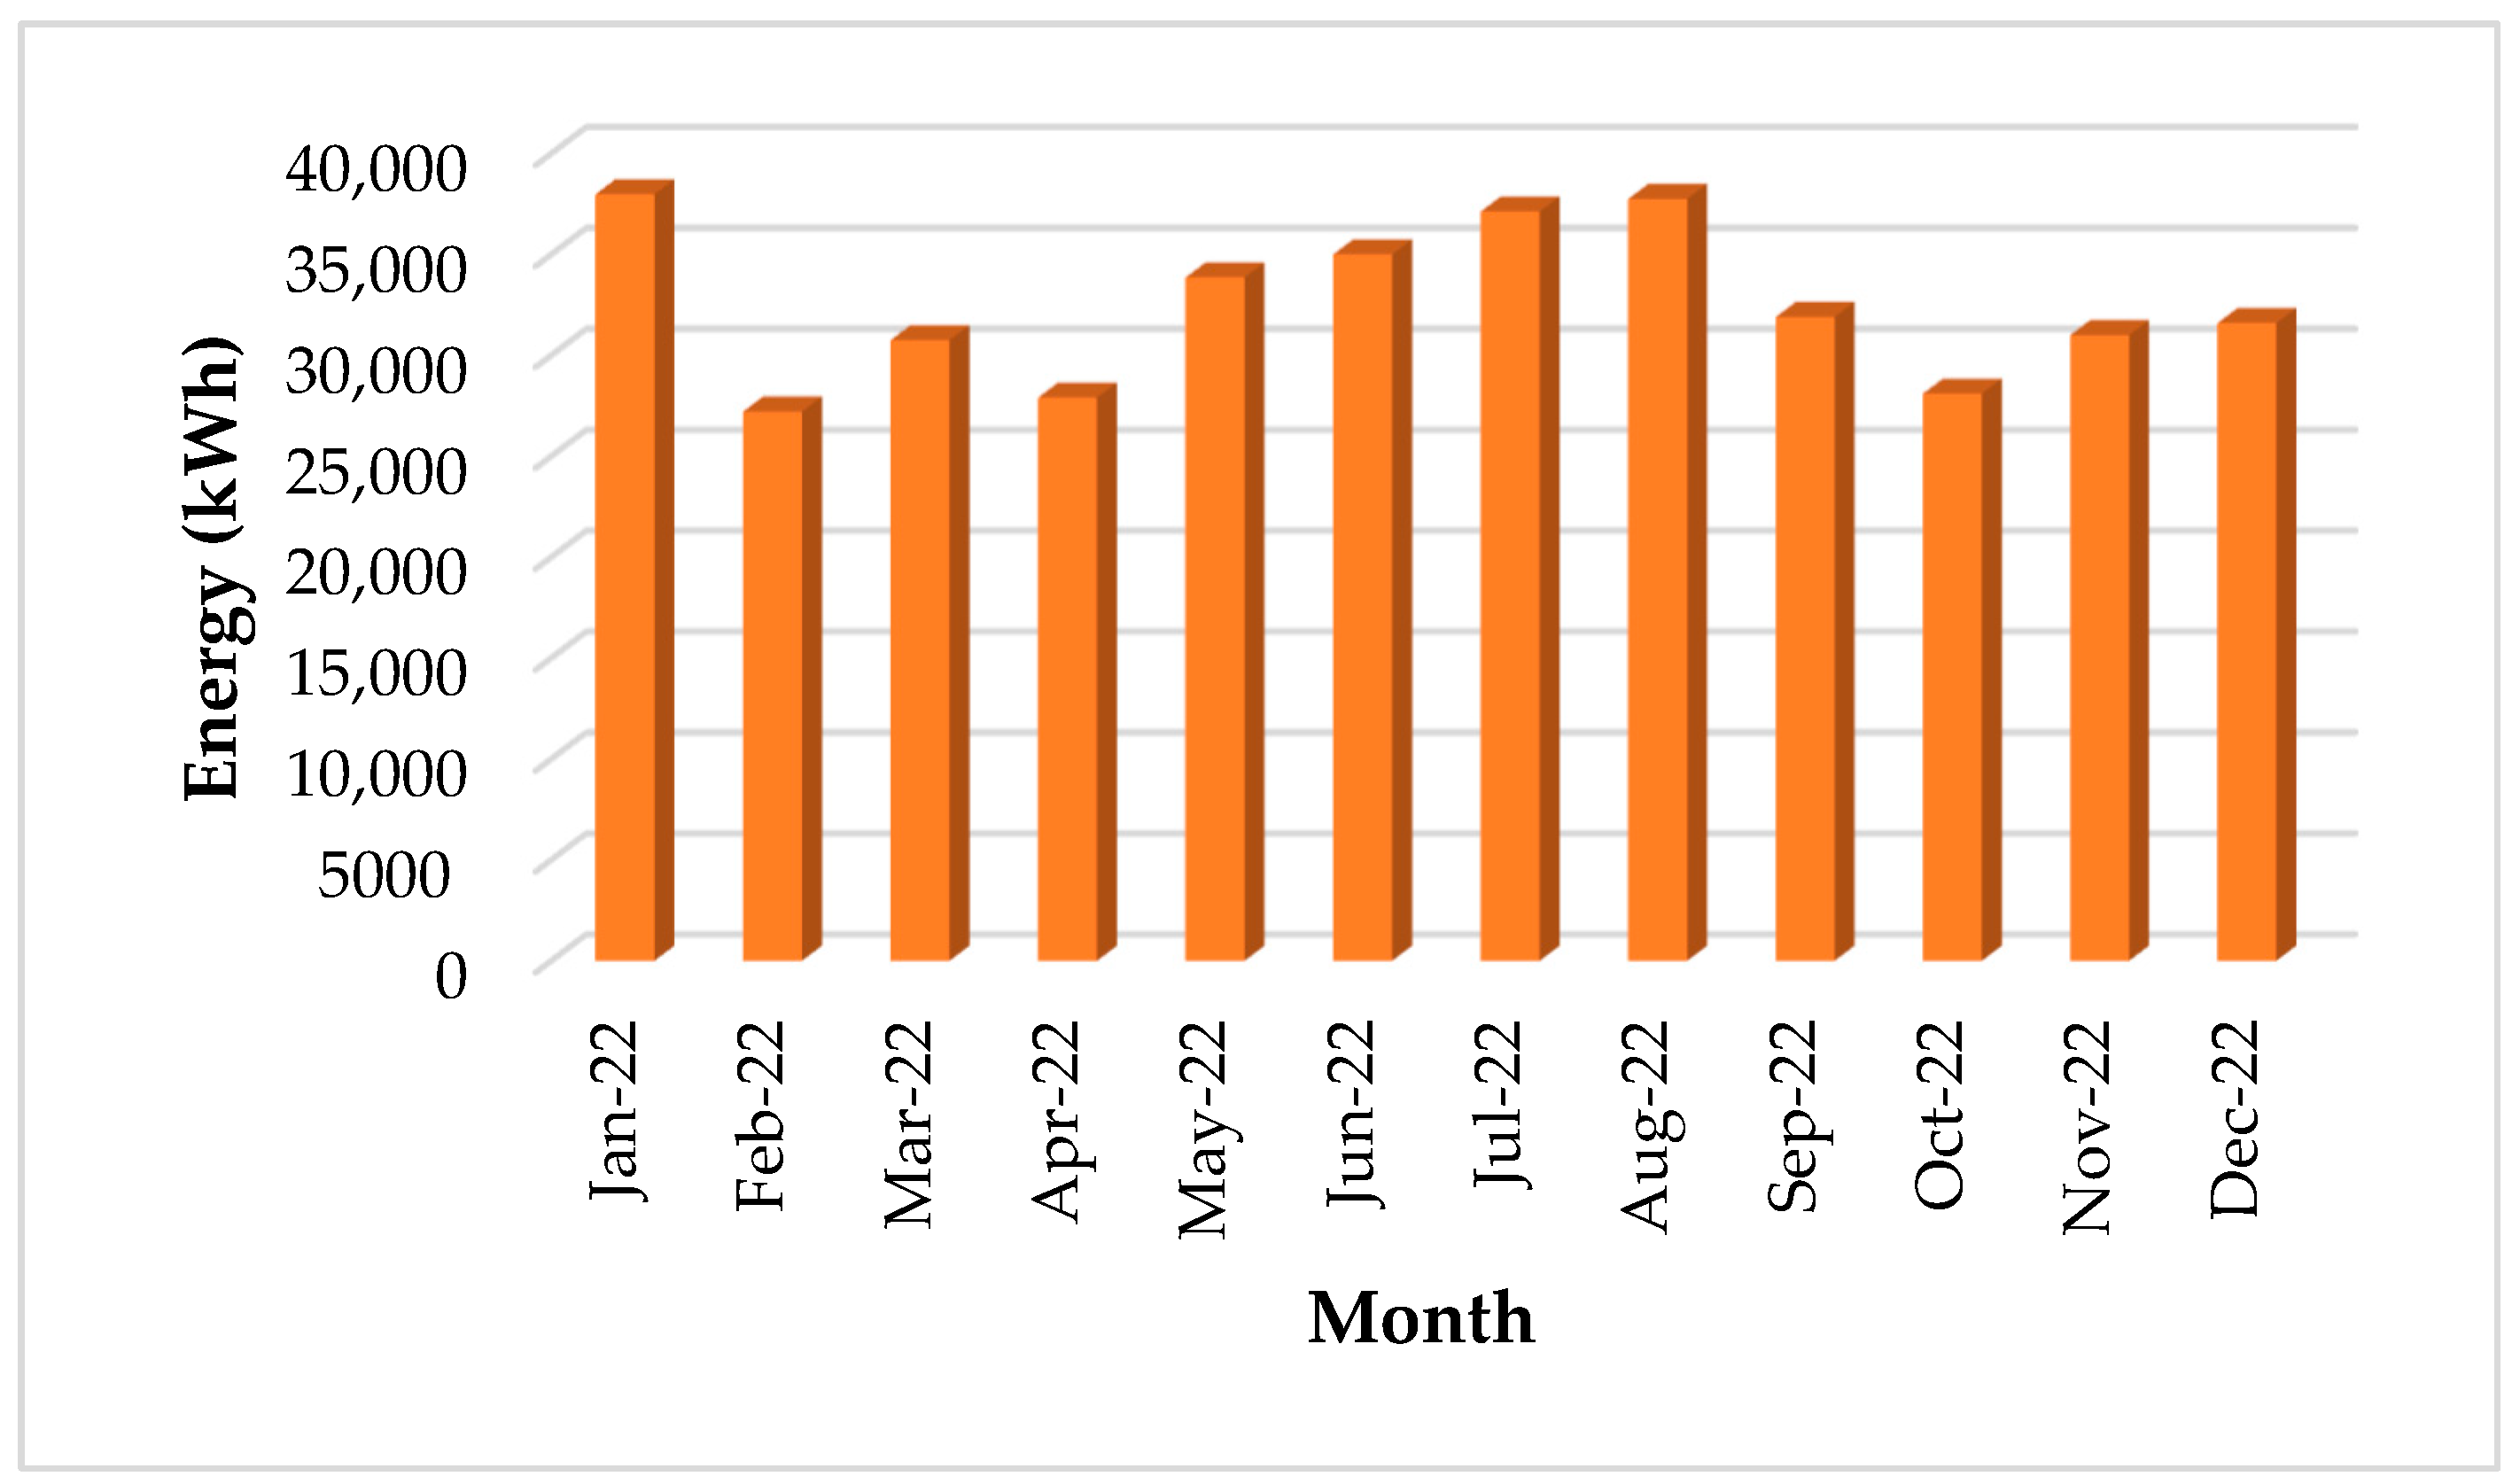
2.2. Electrical Load Analysis

The overall electrical load is segmented into two primary categories: the gas compressor station load and the staff colony’s residential load. The station load consists of air compressors, a discharge gas cooling system, control equipment for gas turbines, a fire suppression system, metering devices, etc. A breakdown of the total connected load is provided in Table 2.

2.3. Diversity Factor

In power distribution engineering, analyzing loads involves integrating the diversity factor to accommodate the probabilistic and temporal characteristics of multiple loads connected to a distribution feeder. The concept of ‘load diversity’ pertains to the idea that not all combined loads are simultaneously active at their maximum capacities.
Therefore, considering the temporal and probabilistic aspects of the loads allows for the sizing of power generation and distribution assets to be smaller than what would be required if all loads were activated simultaneously [27]. The diversity factor (DF) is given as follows:
D . F = max ( l 1 ( t ) ) + max ( l 2 ( t ) ) + + max ( l N ( t ) ) S u p ( l 1 ( t ) + ( l 2 ( t ) + + ( l N ( t ) )
where the various connected loads are l1, l2, , lN, and the numerator represents the cumulative non-simultaneous peak values of these loads, while the denominator employs the supremum function to denote the sum of the overall load. Therefore, the peak load for the selected is taken as 180.74 kW after accounting for the diversity factor, and the suggested HPS will be designed accordingly.
Figure 10 displays the monthly power consumption and corresponding load profile for 2022 based on the total connected load.

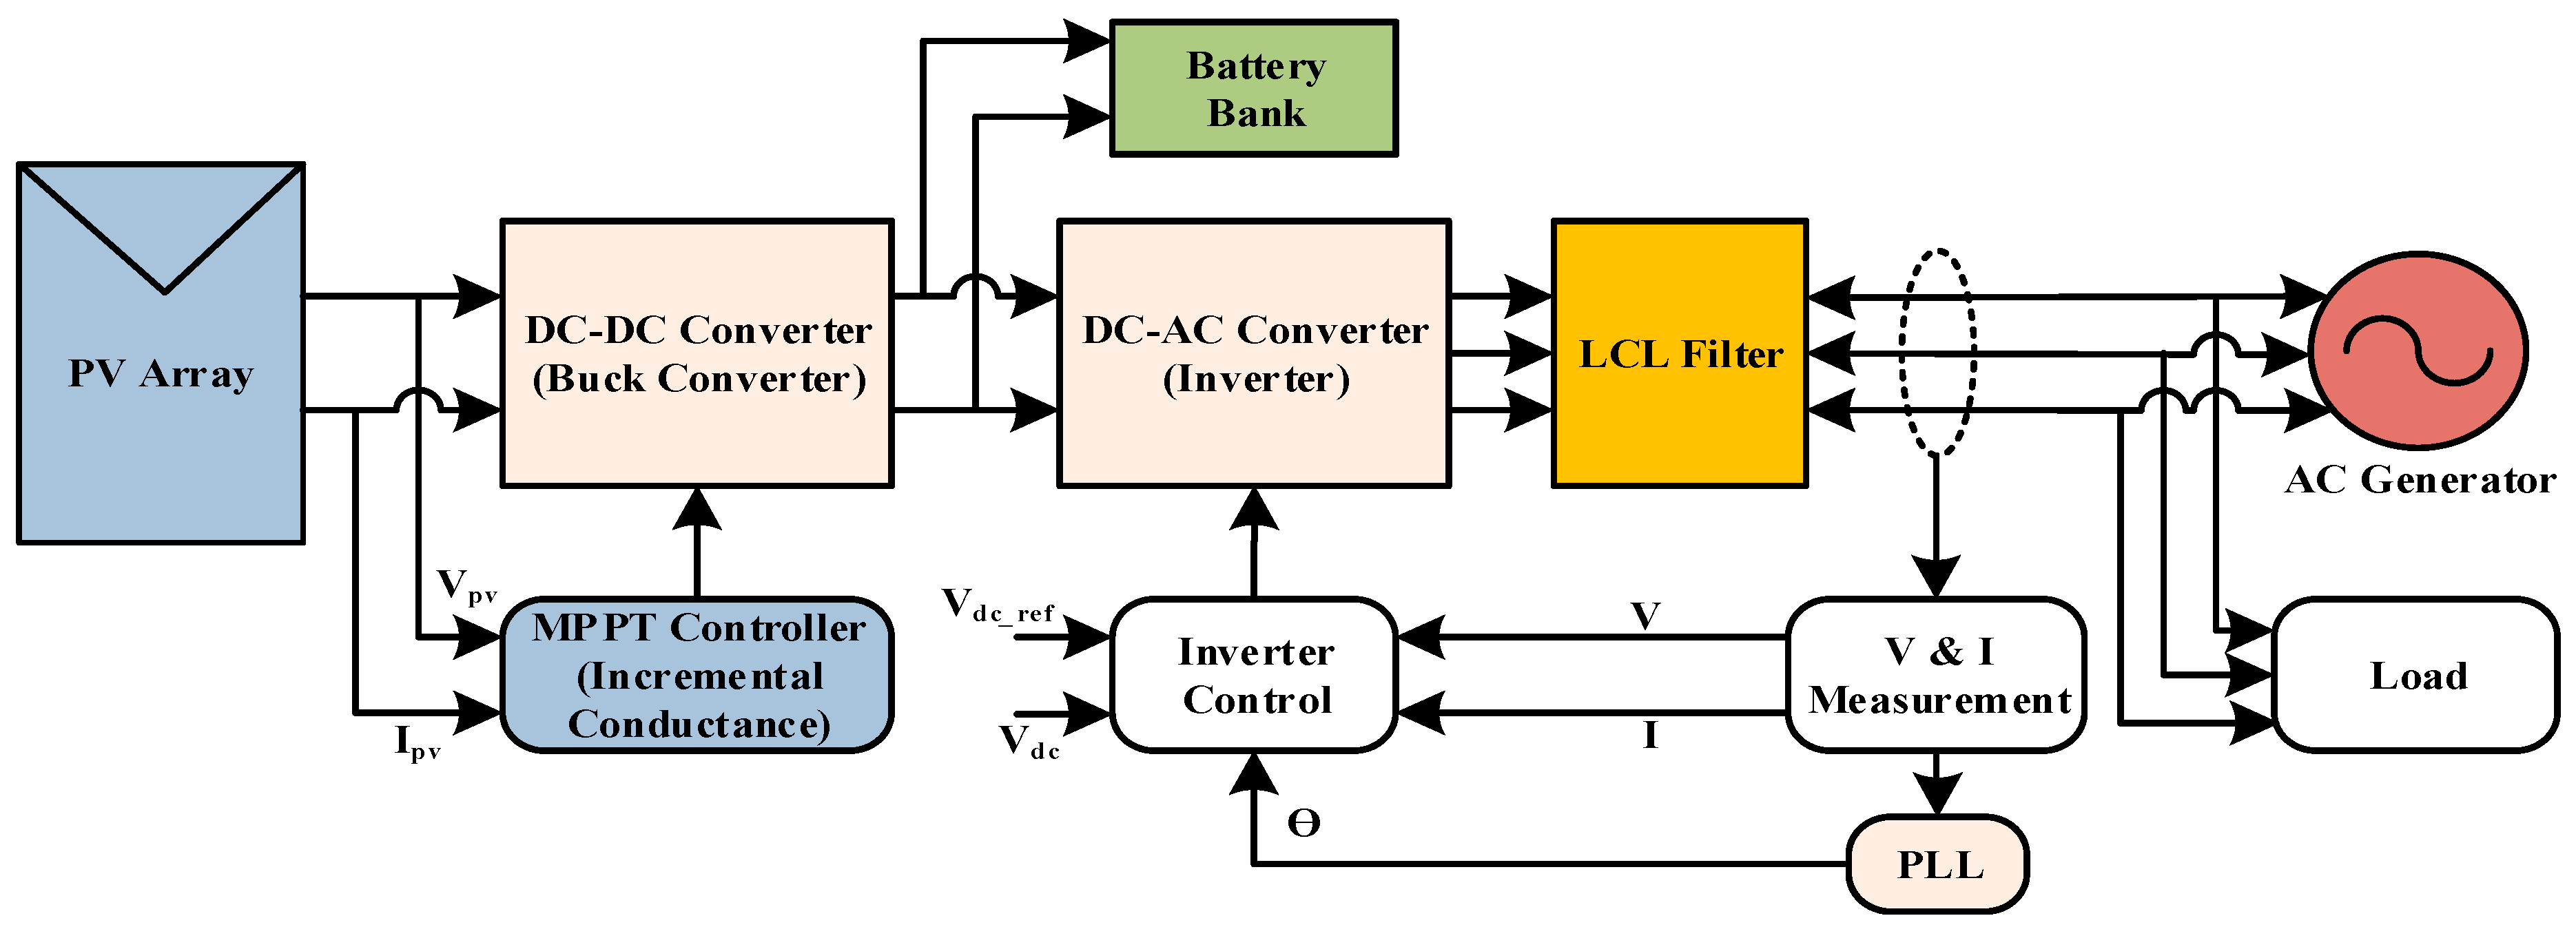
3. Proposed Hybrid Power System (HPS)

The HPS suggested for the selected site incorporates a DC power source comprising a PV system, MPPT controller, battery bank, DC-DC buck converter, DC-AC inverter, LCL filter, AC power source, and natural gas generator. Therefore, this system incorporates AC and DC buses, configured to offer operational flexibility and facilitate maintenance, ensuring uninterrupted power supply. The proposed HPS is engineered with backup resources to ensure reliable and consistent power delivery for the smooth operation of natural gas control stations. Figure 11 shows the block diagram of the proposed hybrid power system.

3.1. Mathematical Modeling of Proposed HPS Components

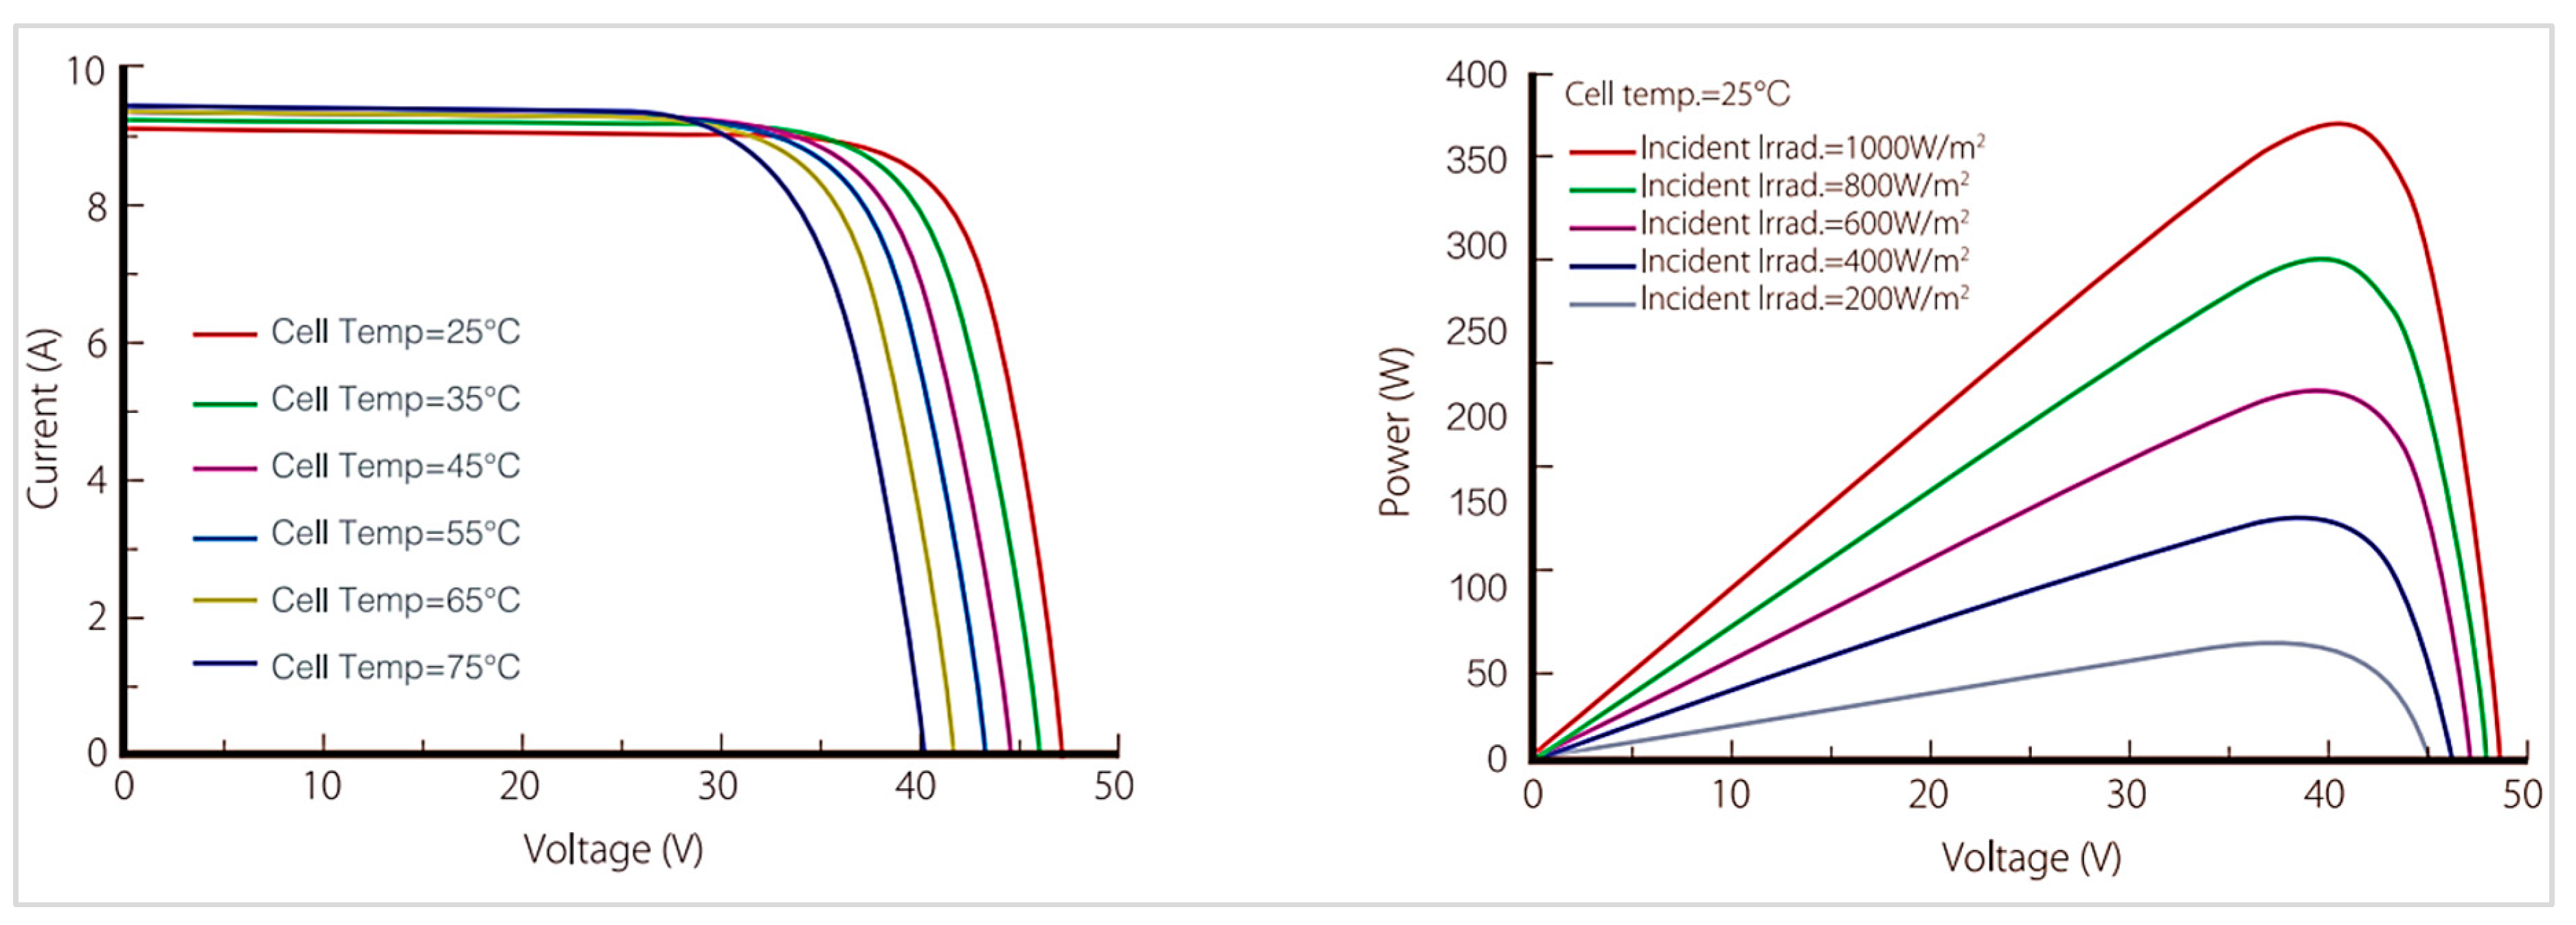
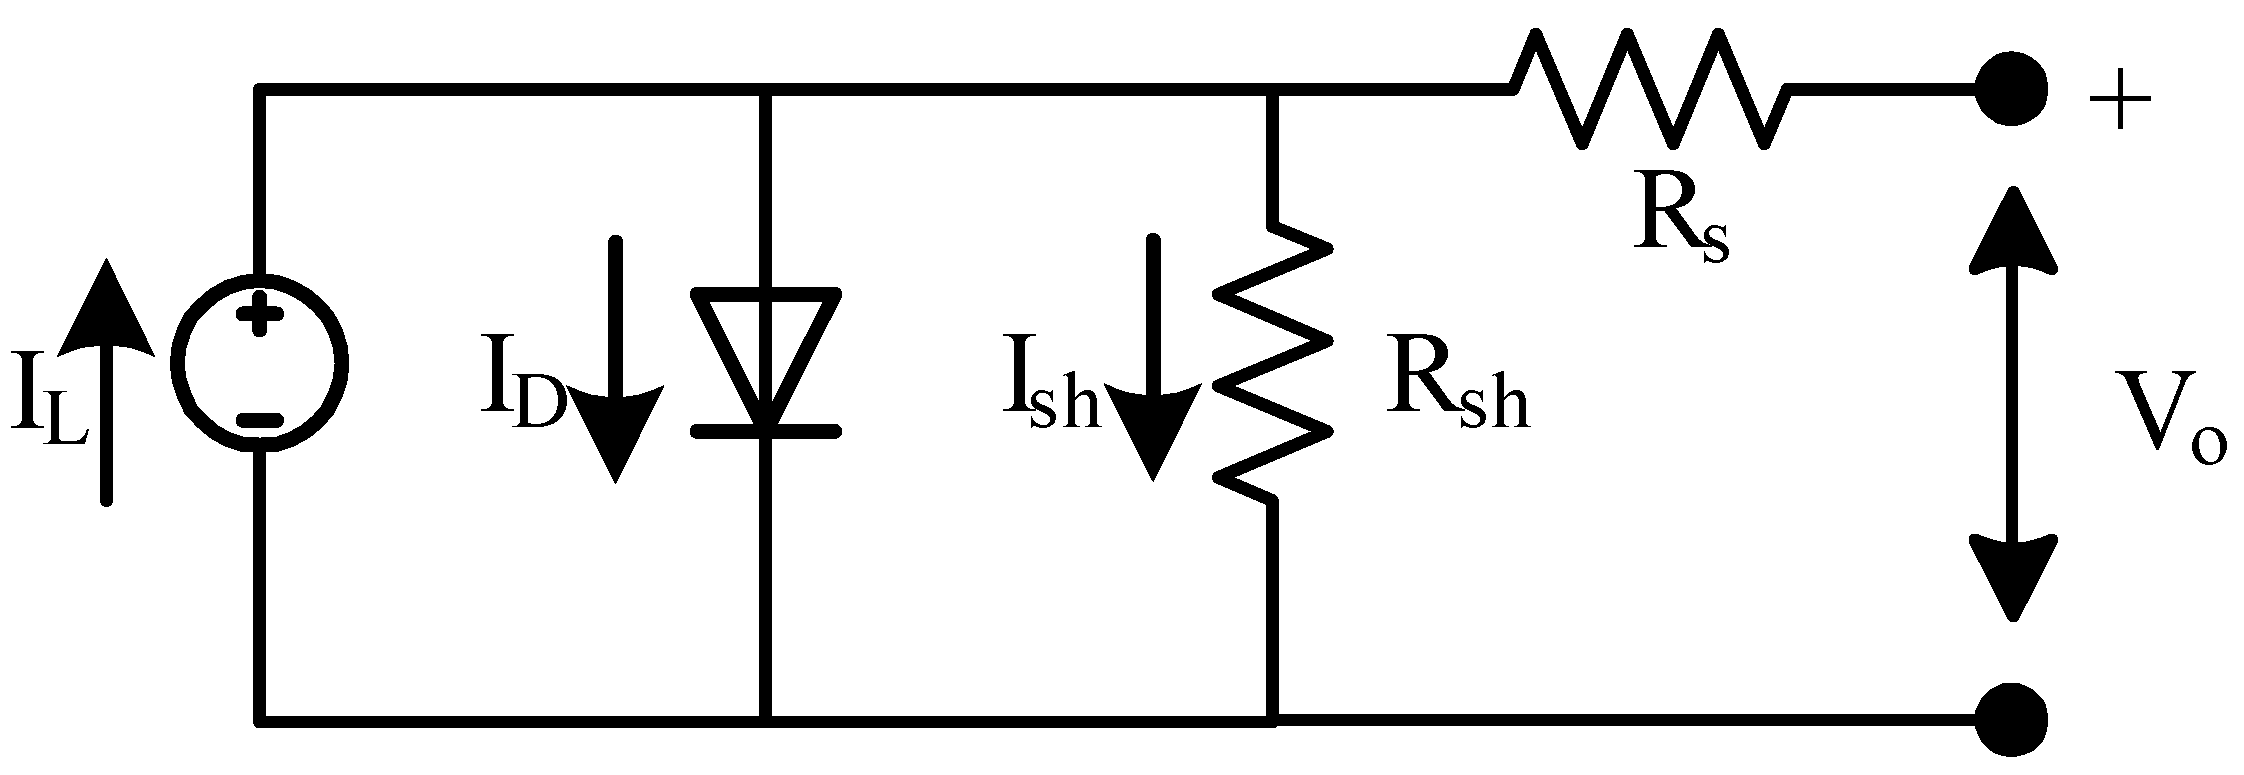
3.1.1. Photovoltaic System

A photovoltaic panel, also called a solar panel, transforms sunlight directly into electricity using the photovoltaic effect. This phenomenon involves the generation of an electric current and voltage in a material when exposed to sunlight. PV panels are made of multiple solar cells interconnected in a specific arrangement to achieve the desired voltage and current output. Figure 12 illustrates the equivalent circuit of the PV cell.
The diode represents the solar cell’s nonlinear behavior, permitting a current in one direction while blocking reverse flow. Given that solar cells do not operate ideally, a shunt resistance (Rsh) and a series resistance (Rs) are included in the circuit. Shunt resistance represents unintended parallel paths for the current flow within the solar cell, caused by material imperfections. When no load is connected, it allows the current to bypass the load, mitigating the effects of leakage currents. This ensures stable voltage and current characteristics, minimizing losses and maintaining efficiency in the solar cell’s operation. Meanwhile, series resistance accounts for internal resistance and interconnections between the solar cells within a module. The equations for the solar cell output current ‘I’ and light-generated current ‘IL’ are
I = I L I D ( V o + I R s R s h )
I L = [ I S C + K I ( T C T R ) ]
Here, ‘ID’ is the diode current, ‘ISC’ is the short circuit current, ‘KI’ specifies the solar cell’s short circuit current temperature coefficient, and ‘Tc’ and ‘TR’ represent the solar reference temperature and operating temperature. The equation for the diode current is given below.
I D = I o { exp [ e V b k T ] 1 }
where ‘Io’ represents the diode’s leakage or saturation current, and ‘k’ is the Boltzmann constant. So, the solar cell equation is derived as follows:
I = I o { exp [ e V b k T ] 1 } I L
A solar cell operates like a diode, with the current flowing in the opposite direction. Thus, the PV panel voltage, VPV, is
V P V = V O C × N S
where ‘VOC’ represents the open-circuit voltage and NS is the number of cells connected in series. And the power generated by the solar panels is given as follows:
P p v = V p v × I s c × G K d
where Kd represents the derating factor.

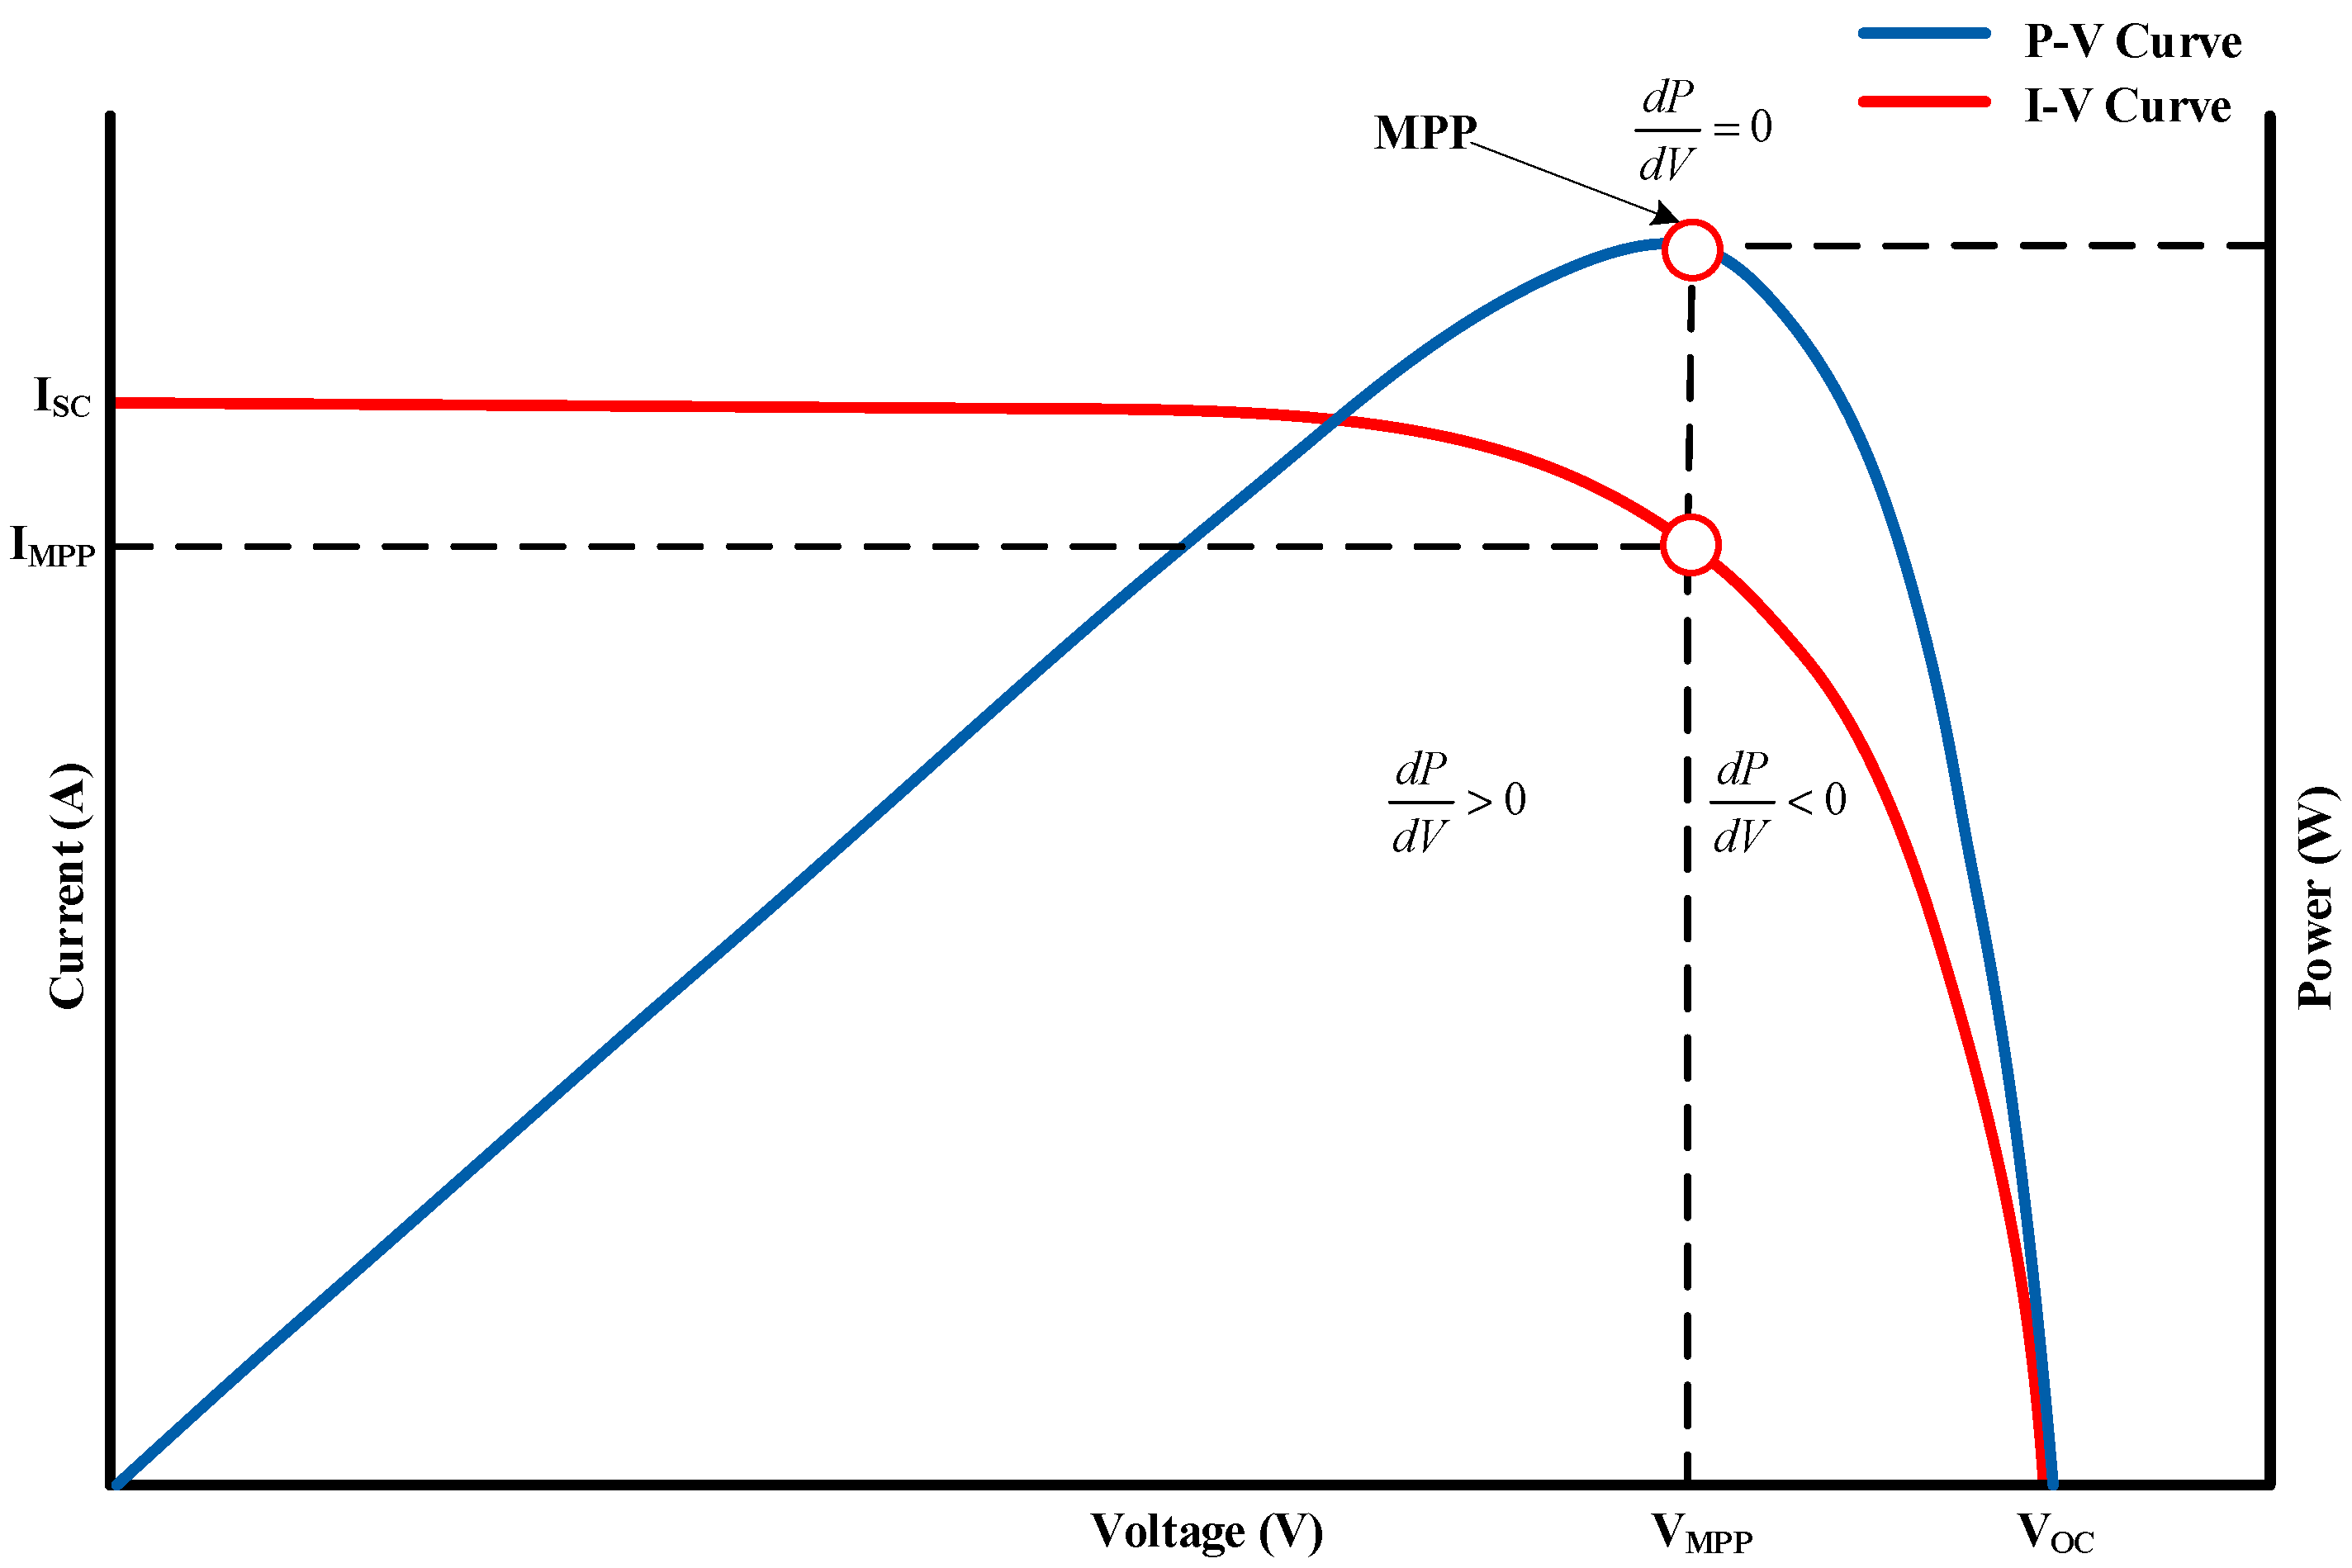
3.1.2. Maximum Power Point Tracking (MPPT) Control

The position of the sun and the direction of sun rays significantly impact the solar cells’ ability to produce electricity, and any changes in these factors directly impact the electricity generated by the solar cells. The relationship between I–V (current-voltage) and P–V (power voltage) is also nonlinear in the case of PV cells. As a result, the PV cells’ output varies continuously. A PV module’s output power is mostly affected by variations in the line and the load measured at its production without additional electrical control being needed [28]. The I–V and P–V curves of the PV module indicate that the PV module achieves its most optimized power output at a specific point, known as the maximum power point (MPP), since the power generated by the module on either side of the MPP is always less. Therefore, to enhance the conversion efficiency of the PV installation, it is important to track and ensure that PV modules operate at MPP.
An MPPT, or maximum power point tracker, is a DC-DC converter with an intelligent algorithm that tracks the output power of a PV array. Its role is to identify and maintain the optimum power output point for the PV cells, improving the overall efficiency of the solar installation process. Numerous techniques/algorithms exist for tracking the maximum power point (MPP), such as Hill Climbing, incremental conductance (INC), Perturb & Observe (P&O), and Neural Network Control. In this research article, the INC algorithm is used due to its superior performance in adapting to changing weather conditions, its accuracy in MPP tracking, and reliable robustness. Figure 13 illustrates the incremental conductance MPPT algorithm.
The INC method relies on the fundamental idea that the PV module’s P–V curve has a zero slope at MPP ( d P d V = 0 ). The algorithm compares the incremental conductance ( d I d V ) with the array conductivity ( I V ) to determine the MPP. The following is the basic equation that powers the INC’s operations:
d P d V = d ( V I ) d V = I d V d V + V d I d V = I + V d I d V
1   × d P d V = I V + d I d V
The incremental conductance is obtained by differentiating the PV module’s output power with respect to the voltage and equating it to zero. As d P d V = 0 at the maximum power point (MPP), the important relationships that determine how the INC algorithm functions are listed below in Table 3.
The I–V and P–V characteristics of the PV array used in this project under different temperature and solar GHI levels are shown in Figure 14.
Several factors affect the solar PV module’s performance, such as temperature and irradiance. The open-circuit voltage of a PV module changes with the cell temperature; as the temperature rises, the open-circuit voltage (Voc) decreases while the short-circuit current increases, consequently lowering the power output [30]. Solar panels operate most efficiently at approximately 25 °C (77 °F), as efficiency tends to decrease in both higher and lower temperature ranges. Similarly, temperature and irradiance influence the P–V curves of solar panels by affecting the voltage, current, and maximum power point of the panels. Higher temperatures typically lead to a decrease in the voltage and an increase in the current, while higher irradiance levels result in a higher output power.

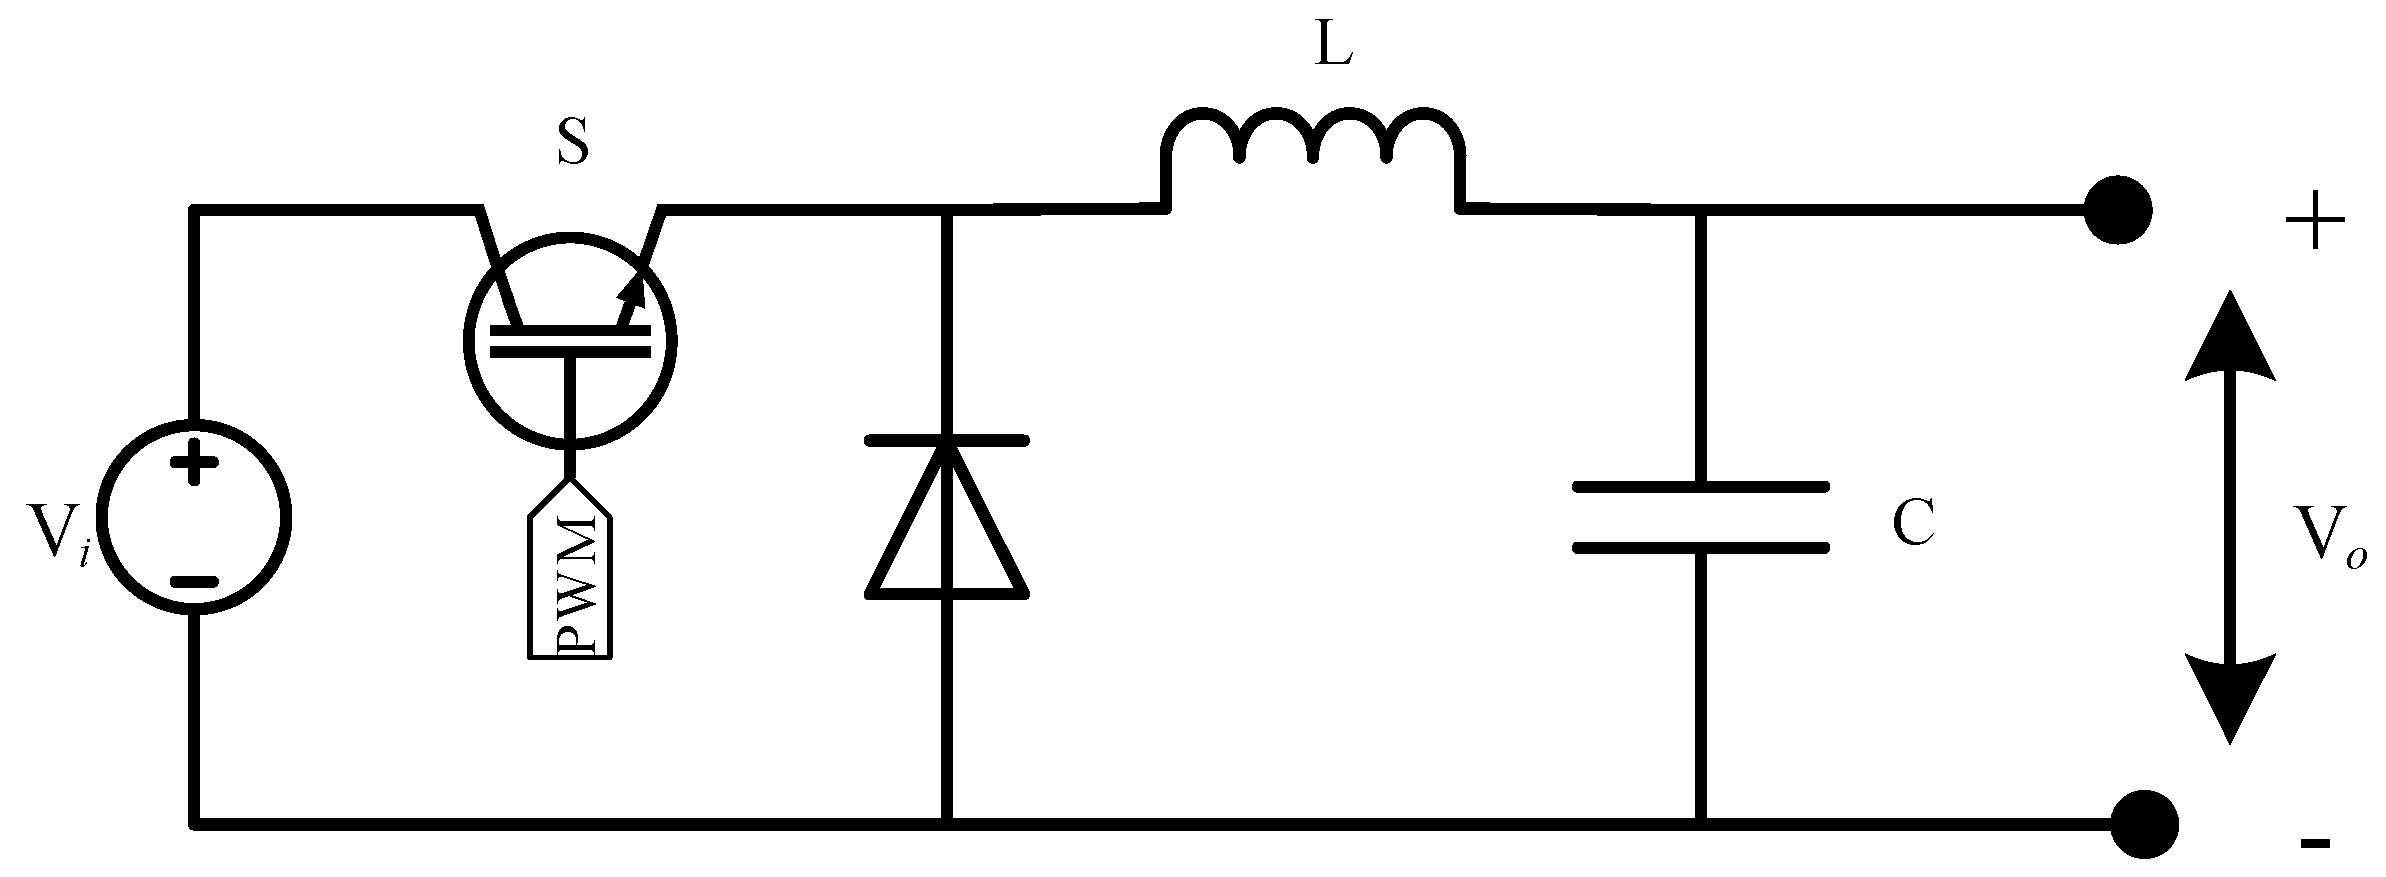
3.1.3. DC−DC Buck Converter

The proposed HPS incorporates a DC−DC converter as an integral multistage power processing system component. The converter is critical in achieving the maximum power point (MPP) of PV modules, generating a DC voltage, and is designed to handle power variations. Together with the DC−AC inverter, the DC−DC converter constitutes the multistage system, providing flexibility in operating the PV voltage over a broad range. Additionally, this configuration eliminates the direct link between the AC output and PV modules, preventing the induction of double-line-frequency ripple in a PV voltage caused by AC power fluctuations.
The DC−DC converter is a buck converter chosen for its high efficiency, uncomplicated configuration, and minimal voltage ripple. In this specific case, it plays an important role in maintaining the DC output voltage level by the inverter DC link, set at 360V DC. A buck converter steps down the voltage from its input (Vi) to produce a lower output voltage (Vo). The output voltage is controlled by regulating switch S’s duty cycle (D) and can be implemented using an IGBT, MOSFET, or transistor, as illustrated in Figure 15.
The duty cycle (D) is a scalar quantity with a value ranging from 0 to 1. The following are the key equations that describe the functioning and design of a buck converter:
D = V o V i ( max ) × η
L = V o × ( V i V o ) Δ I L × f s × V i
where ‘η’ is the efficiency of an inductor, ‘L’ is the selected inductor value for the buck converter, fs is the switching frequency of the converter, and ΔIL is the inductor ripple current, which can be calculated as
Δ I L = ( 0 . 2   to   0 . 4 )   × I o ( max )
Using the above expressions, the inductor value is calculated as 0.346 mH. Similarly, a capacitor is used in a buck converter, and its purpose is to reduce the ripples in the output voltage. Its value is calculated as 1.2 mF using the expression given below.
C = Δ I L 8 × f s × Δ V o

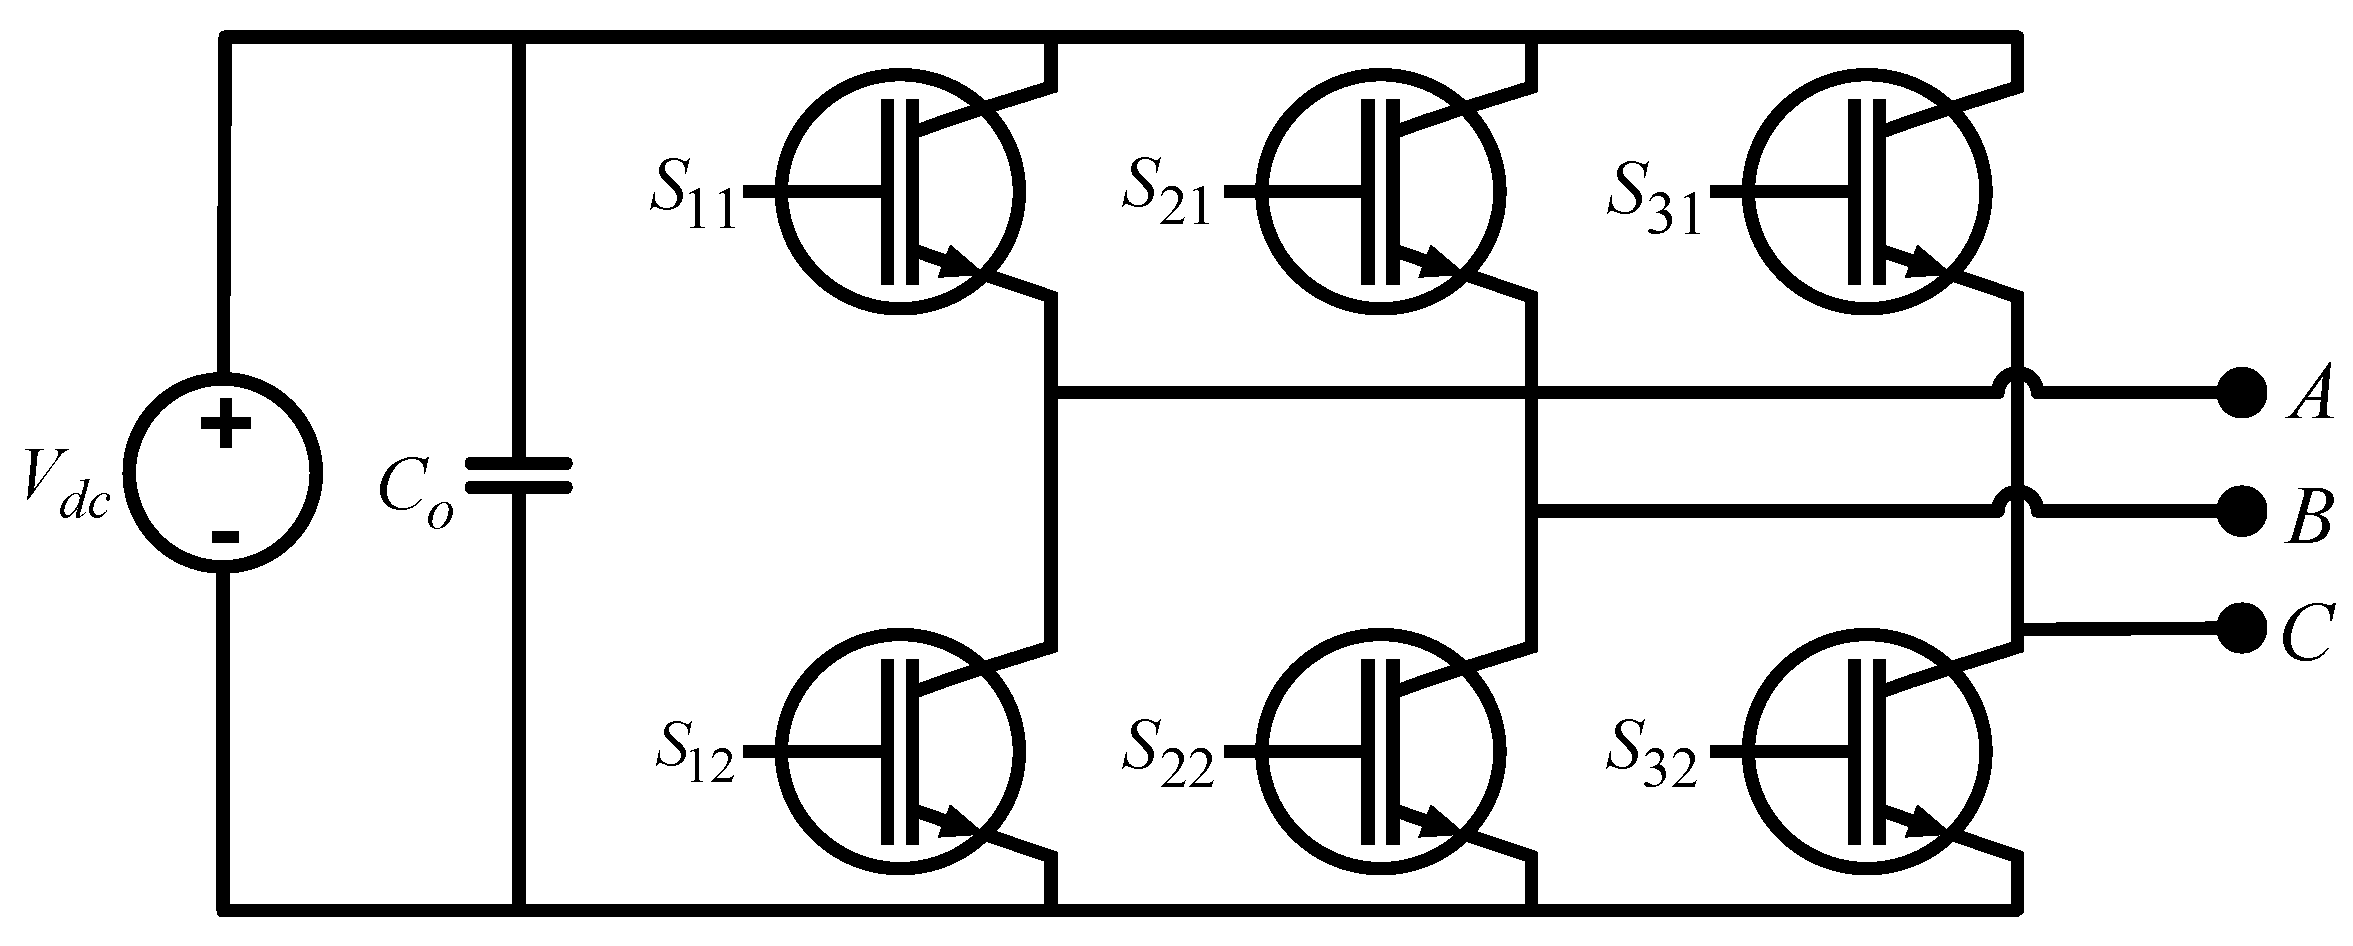
3.1.4. DC-AC Inverter
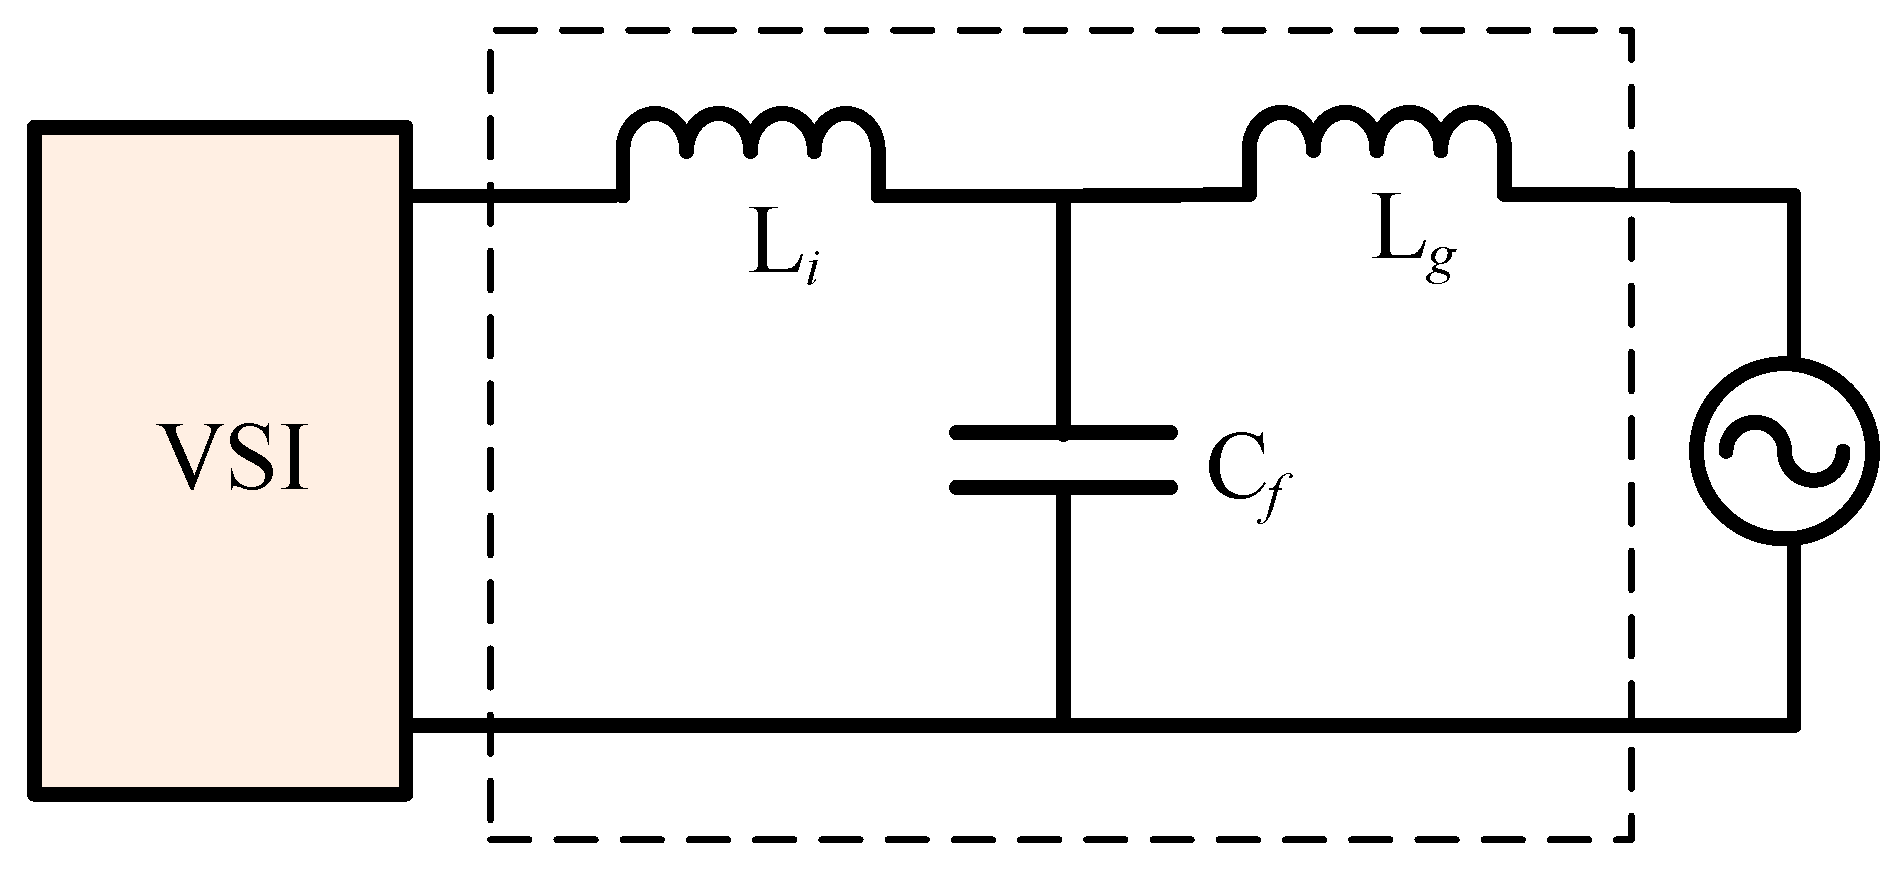
An inverter transforms direct (DC) electricity into symmetrical alternating (AC) electricity at the required voltage and frequency level using appropriate switching patterns and a control strategy. The buck converter provides a steady DC output, which is then supplied to the three-phase Voltage Source Inverter (VSI). The VSI transforms it into the desired AC voltage of 230 V (single phase). The sinusoidal pulse width modulation technique (SPWM) is selected from various PWM techniques to achieve suitable switching patterns and control strategies. This selection is based on its distinct advantages, such as simplicity, low Total Harmonic Distortion (THD), and better control schemes. By controlling the duty cycle of the SPWM pulses, the required output voltage waveform and a reduced THD can be achieved. The THD becomes an important factor to consider when dealing with nonlinear components, and most semiconductor devices, which are at the cores of renewable energy systems, exhibit nonlinear behavior. Integrating sinusoidal pulse width modulation (SPWM) with an LCL filter is a powerful approach to reduce the Total Harmonic Distortion (THD). SPWM ensures precise control of the output voltage, while the LCL filter, with its inductors, capacitors, and resistors, effectively acts as a low-pass filter to suppress higher-order harmonics. This combination results in a cleaner and sinusoidal output waveform, making it particularly valuable in applications with low distortion, such as renewable energy systems and power electronics. The circuit diagram of the three-phase inverter is shown in Figure 16.

3.1.5. LCL Filter

The LCL filter has been extensively applied in renewable energy systems due to its excellent high-frequency (HF) attenuation properties, compact size, and cost-effectiveness [31]. The LCL filter, shown in Figure 17, effectively attenuates harmonics, dampens resonance, enhances system performance, complies with grid standards, contributes to stability, offers flexibility in design, and ensures the reliability of renewable energy systems. It provides improved filtering compared to simpler LC filters, offering better damping of resonance peaks and enhancing the system’s overall efficiency. Moreover, the use of low-rated inductors and capacitors in LCL filters makes it more cost-effective and affordable. Hence, the LCL filter addresses power quality challenges in the context of renewable energy generation.
The design process for an LCL filter begins by calculating the inductor on the inverter (Li) side using the following equation:
L i = V d c 6 × f s × Δ I L  
where ‘Vdc denotes the DC bus voltage and ‘fs is the system frequency, while the inductor ripple current, ‘ΔIL’, is 10% of the maximum current and computed as
Δ I L = 0 . 1   × P nominal × 2 V  
Similarly, the value of the inductor on the generator side is calculated using the equation given below.
L g = r × L i
where the value of ‘r’ is the ratio of Lg and Li, and a value of r = 0.6 results in a 5% reduction in the power factor [32].
L g = 0.6 × L i
Ultimately, the objective is to design the filter capacitor (Cf) to limit inverter output voltage oscillations to a maximum of 5%, ensuring the stable operation of the hybrid power system. This involves calculating the capacitance using specific formulas.
C f = 0 . 05   × P nominal ω g × V 2 p h g
Similarly, it is important to analyze the resonance frequency (ωres) of the filter. Equation (19) is used to calculate the resonance frequency in radians.
ω r e s = L i + L g L i × L g × C f
f r e s = 1 2 π L i + L g L i × L g × C f
In the last step, the value of the damping resistor (Rf), connected in series with the filter capacitor to prevent resonance issues, is determined using Equation (21).
R f = 1 3   × C f × ω r e s
Using the above-given equations, the values of Li, Lg, Cf, fres, and Rf are calculated as 519 µH, 312 µH, 66 µF, and 1.41 MHz and 0.0573 Ω, respectively.

4. Optimization of Proposed HPS Using HOMER Pro

HPS optimization involves numerous factors, including system configurations, component sizing, project economics considering variable loads and component expenses, system lifespan, end-user energy expenditures, net present cost, annual operating costs, maintenance expenses, and the availability of renewable energy resources in the region. These factors are crucial for the overall design and functionality of the system and help decision makers pinpoint the most economically viable solutions customized to accommodate the specific electrical loads for which the hybrid system is being developed [33].
A ‘Hybrid Optimization Model for Multiple Energy Sources (HOMER Pro)’ is used to optimize the proposed hybrid power system for cost-effective solutions. This software simulates systems integrating one or more power sources like photovoltaics and wind turbines. It facilitates the design of both grid-connected and off-grid systems in the most economically efficient way by considering the mentioned factors. It explores various configurations to pinpoint the most economically efficient combinations that meet the specified electrical load requirements. The optimization analysis of HOMER is pivotal in addressing important design considerations, such as identifying the most cost-effective technologies, evaluating the impact on project economics caused by variations in costs or loads, optimal component sizing, and assessing the adequacy of renewable energy resources.
After analyzing the total connected electrical load of the selected site using the data from Table 1, a corresponding load profile was generated and exported to the HOMER Pro software, which facilitated the sizing of a PV system and natural gas generator and optimized the design of the proposed hybrid power system. The simulation incorporated solar global horizontal irradiance (GHI) data for the selected site (Figure 8) and specific PV modules, batteries, and converters. Figure 18 illustrates the schematic diagram of HOMER Pro’s optimized hybrid power system.
The system is designed to enable unlimited power generation using PV modules, aiming to optimize the system’s overall performance. HOMER Pro performed a total of 892 simulations, and the simulation results demonstrate that HOMER Pro presented different configurations using various combinations of available power sources. Table 4 presents the evaluation of optimized system configurations conducted by HOMER Pro. The optimal configuration selected includes PV panels, a converter, an energy storage system (ESS), which is a battery bank, and a natural gas genset, as it yields the least Net Present Cost (NPC) of USD 1.30 M and a cost of energy (COE) of USD 0.234, among all configurations. At the same time, the current actual cost of energy using only natural gas generators stands at USD 0.382. The optimal system also has the lowest annual operating cost of USD 63,253, which, in the present and actual cases, is USD 150,574, thus providing annual cost savings of USD 87,321.
The optimized system, designed for a 25-year life cycle in HOMER Pro, is projected to have a net present cost (NPC) of USD 1.30 million. It would yield a levelized energy (COE) cost of USD 0.2345 per kWh and incur an annual operating cost of USD 63,252.93, as depicted in Table 4. The optimal system design achieves a 79.2% renewable energy fraction, significantly reducing the non-renewable fraction from 100% to just 20.8%. This addresses cost inefficiencies, as illustrated in Figure 19, which also depicts monthly electrical energy generation.
The primary purpose of the natural gas generator is to serve as a backup power source when the primary PV system and battery bank cannot meet the load demands, primarily due to fluctuations in solar global horizontal irradiance (GHI) or during prolonged and severe weather conditions. The rest of this research paper focuses on dynamic modeling and analyzing the dynamic behavior of the proposed HPS using MATLAB.

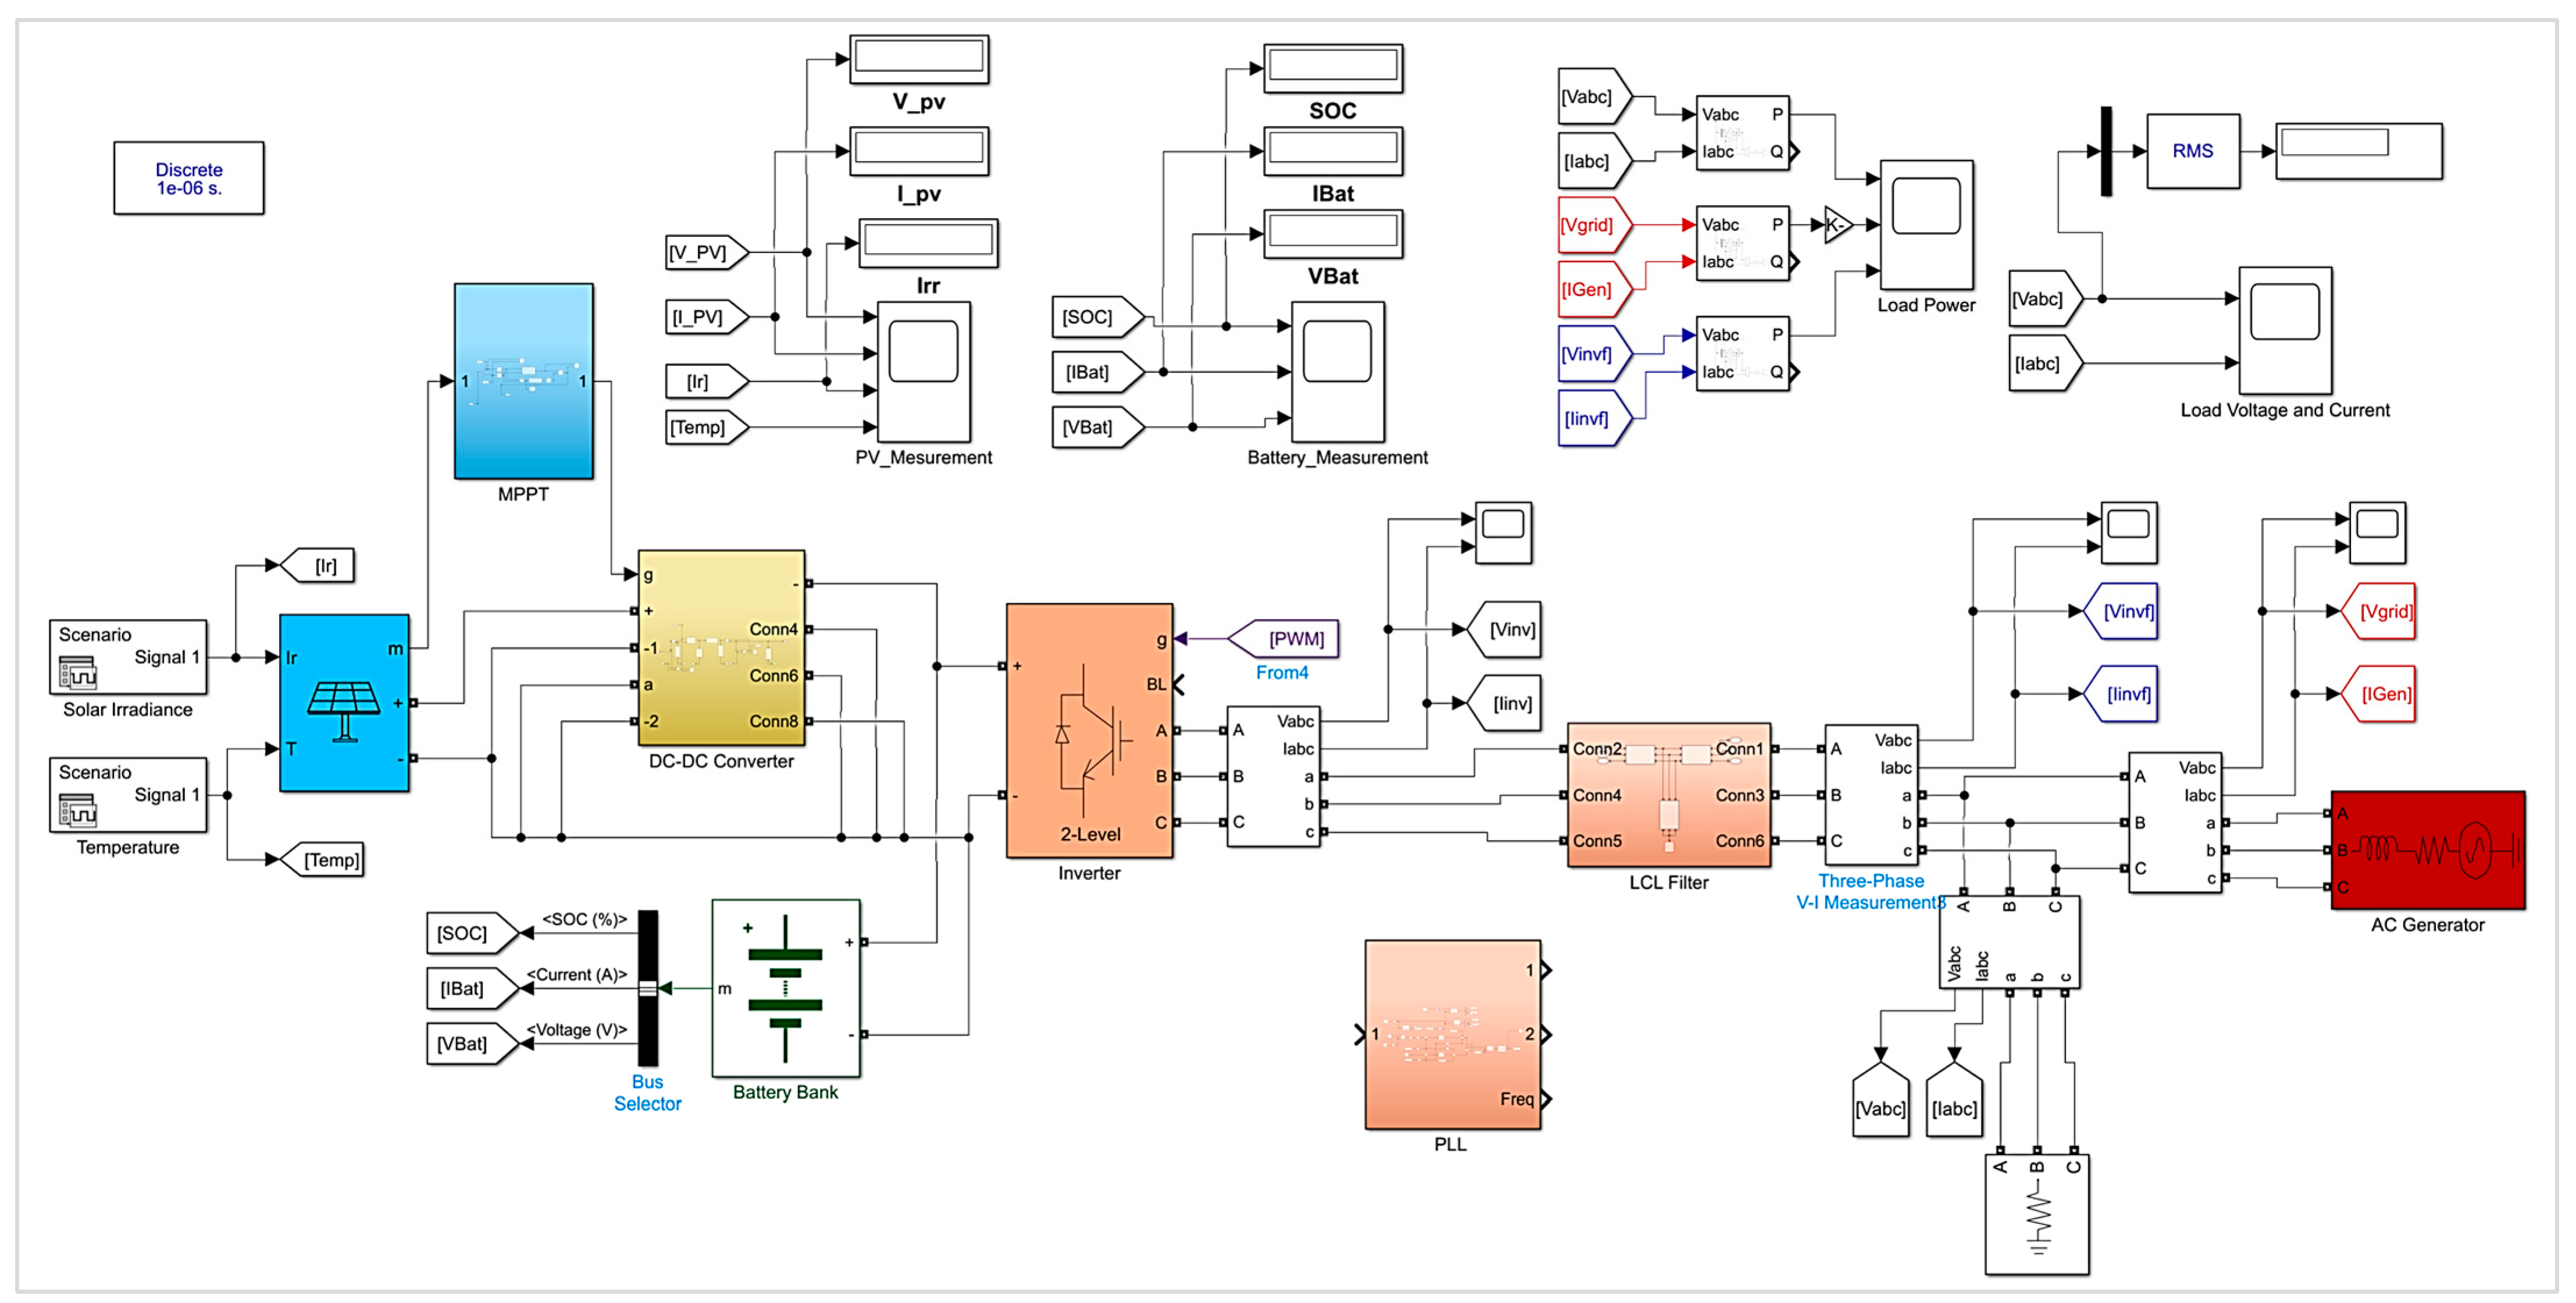
5. Dynamic Modeling of Proposed HPS in MATLAB/SIMULINK

Dynamic modeling and simulation are necessary steps in analyzing the performance and behavior of any system. To examine the dynamic performance of the proposed hybrid power system, with a specific emphasis on power quality, voltage transients, and load impact, simulations are conducted using MATLAB/Simulink. During this modeling process, careful consideration is given to the AM 1.5 spectrum, which is also known as Air Mass 1.5. It represents the average solar radiation reaching the earth’s surface under standard conditions and accounts for the absorption and scattering of sunlight as it passes through the earth’s atmosphere, providing a standardized reference for evaluating solar energy technologies. By incorporating the AM 1.5 spectrum into the simulation, the dynamic behavior of the hybrid power system can be accurately analyzed and optimized under realistic solar conditions. Hence, the initial value for irradiance is set at approximately 1000 watts per square meter (W/m2), reflecting standard solar radiation conditions. As for temperature, solar cell temperatures in the simulation may range from around 25 °C to 60 °C, representing typical operating conditions under sunlight exposure. The simulations covers a range of conditions tailored to the specific characteristics of the selected natural gas control station under discussion. The Simulink blocks used also incorporate the influence of real-time conditions, encompassing variations in solar irradiance, temperature, fluctuations in connected load, etc. Figure 20 displays the entire MATLAB/Simulink model, which is simulated to analyze the dynamic behavior of the proposed HPS.
Figure 21 demonstrates how changes in the temperature and solar GHI affect the output voltage and current of the PV array, providing insight into the dynamic response of the PV component within the proposed HPS. Initially, the solar GHI value is set at 1000 W/m2 in accordance with the AM 1.5 spectrum, concurrently setting the temperature at 25 °C. This serves as the baseline condition. Subsequently, the solar GHI value is reduced from 1000 W/m2 to 400 W/m2, indicating a dip in GHI, and its impact on the PV output is observed. Likewise, the temperature gradually increases from 25 °C to 55 °C to evaluate its effect on the PV voltage and current. It is worth noting that higher temperatures typically lead to a decrease in voltage, while higher irradiance levels result in a greater output voltage from the PV array.
Figure 22 illustrates that the primary focus is prioritizing power flow from the PV system to the load, with any excess power being used to charge the battery bank. Initially, under a constant solar GHI and temperature in the simulation, the battery bank charges. However, in instances of a decreased solar GHI, the battery bank ceases charging and assumes a backup role, supplying power to the load.
When the PV system output falls short of meeting the load requirement, the natural gas genset is used to supply the deficit, and any excess power is once again utilized to charge the battery bank. A phase-lock loop (PLL) is used to synchronize the natural gas genset and solar PV system, and it is sensitive to both frequency and phase. It operates as an electronic circuit incorporating a voltage or voltage-driven oscillator, continuously adapting to align with the frequency of an input signal. Hence, a stable three-phase output voltage and current are delivered to the connected load. Figure 23 shows the stable phase-to-ground voltage and current delivered to the connected load by the designed HPS.

6. Experimental Results and Discussion

The real-time validation of a proposed hybrid power system is crucial for ensuring its reliability and efficiency in real-world applications. This validation process is facilitated by employing Hardware-in-the-Loop (HIL) testing, which integrates physical hardware components with simulation models. OPAL-RT Technologies’ high-performance real-time OP5707XG simulator plays a key role in this process by emulating real-world conditions and interactions. The OP5707XG is a comprehensive simulation system that operates on Virtex-7 FPGA platforms. As shown in Figure 24, it utilizes a combination of Intel processors to facilitate real-time computation to handle extensive models. Additionally, an FPGA is employed to achieve an ultra-fast loop time, enabling swift switching frequency in real-time simulations [34]. It enables closed-loop testing by continuously exchanging data between the simulation model and the hardware components, allowing engineers to evaluate the system’s performance under various operating conditions and dynamic scenarios. Additionally, the simulator provides tools for fault injection, real-time visualization, and data analysis, empowering engineers to validate the system’s designs and implement appropriate control strategies for optimal performance and reliability. This process confirms the robustness and proper functioning of the system, as shown in Figure 11.
The experimental results obtained from OPAL-RT Technologies’ real-time OP5707XG simulator are displayed in Figure 25 and Figure 26, which involve testing and validating a Simulink model. Running a Simulink model on OPAL-RT Technologies’ OP5707XG simulator allows for the real-time validation of three-phase voltage and current waveforms. The results demonstrate the designed system’s ability to maintain a stable three-phase power supply even amidst variations in the input parameters, such as the solar global horizontal irradiance, temperature, and changes in the output load. The stability exhibited by the system under diverse operating conditions underscores its robustness and suitability for powering a critical infrastructure, ensuring uninterrupted operation and reliability in energy supply. The results show that the load receives a steady three-phase voltage and current, validating the system’s capability to supply reliable and consistent power to the selected control station for a natural gas pipeline as a case study.

7. Conclusions

In conclusion, this research article presents a novel approach to address the energy needs of remote natural gas pipeline control stations by designing and implementing a hybrid power system. This study underscores the importance of innovative energy solutions in remote locations and highlights the potential of hybrid power systems to provide a reliable and sustainable electricity supply for critical infrastructure. The proposed hybrid power system primarily comprises photovoltaic panels, a maximum power point tracking controller, a DC-AC inverter, a buck converter, a natural gas generator, a battery bank, and an electrical load. The optimal design is obtained using the HOMER Pro software, while the system’s dynamic modeling is performed in the MATLAB/Simulink environment to evaluate its response. Subsequently, experimental validation is executed through Hardware-in-the-Loop simulation utilizing the real-time OPAL-RT Technologies’ OP5707XG simulator. The main conclusions are as follows:
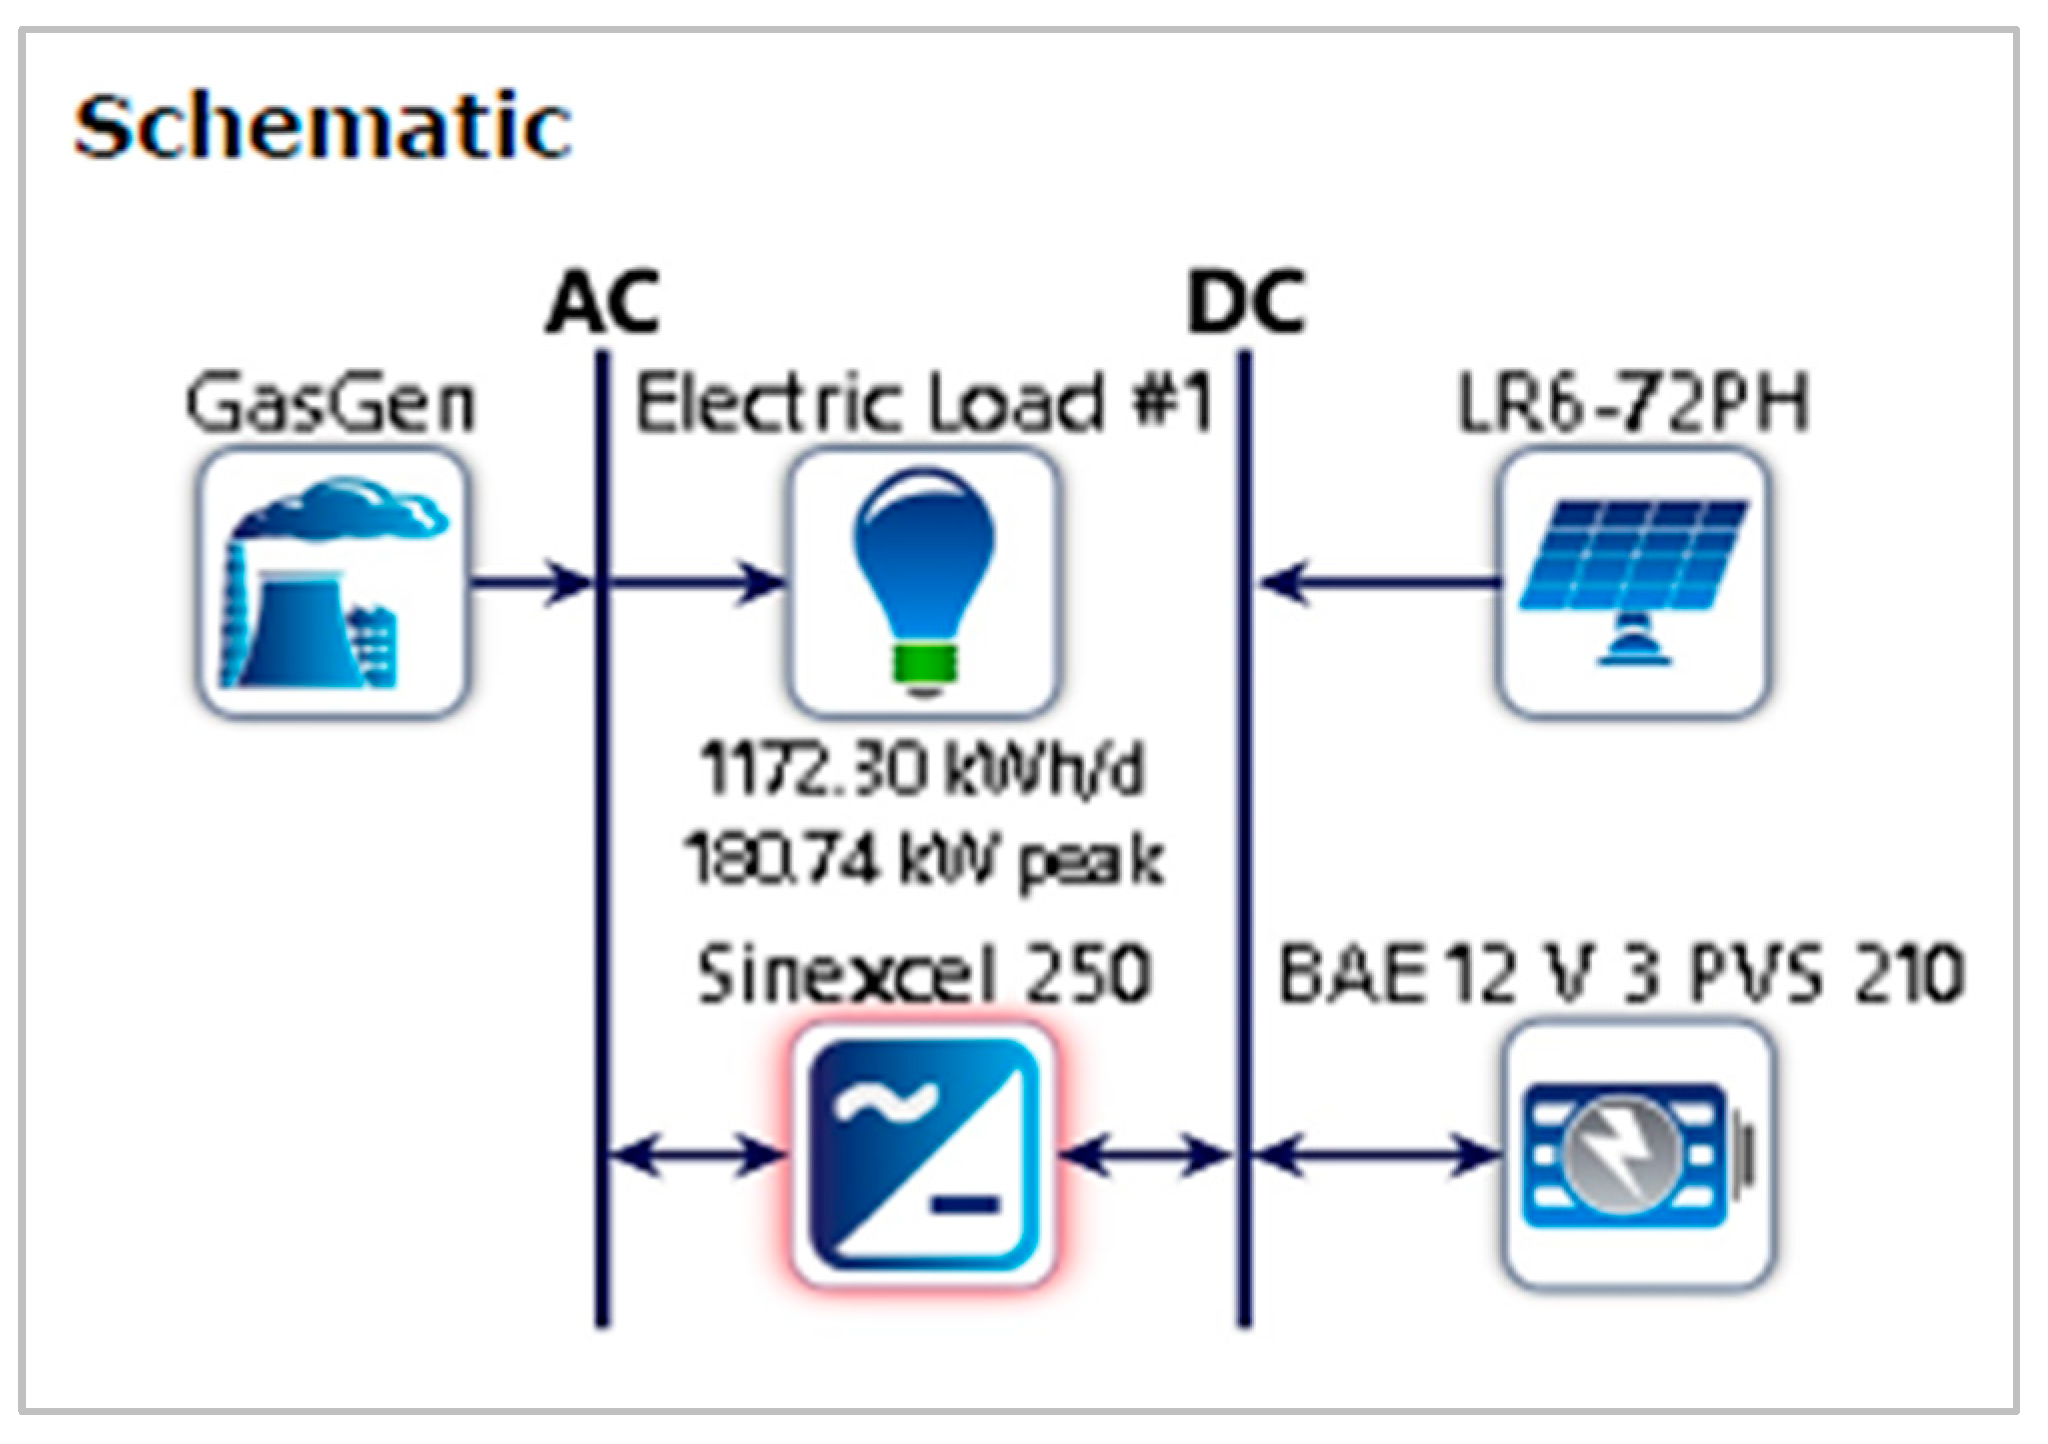
  • Given the abundant solar global horizontal irradiance resource in Pakistan, solar photovoltaic systems play a predominant role in contributing to the hybrid power system’s electricity supply. It addresses the unique energy demands of these facilities and underscores the financial benefits while aligning with broader energy sustainability goals.
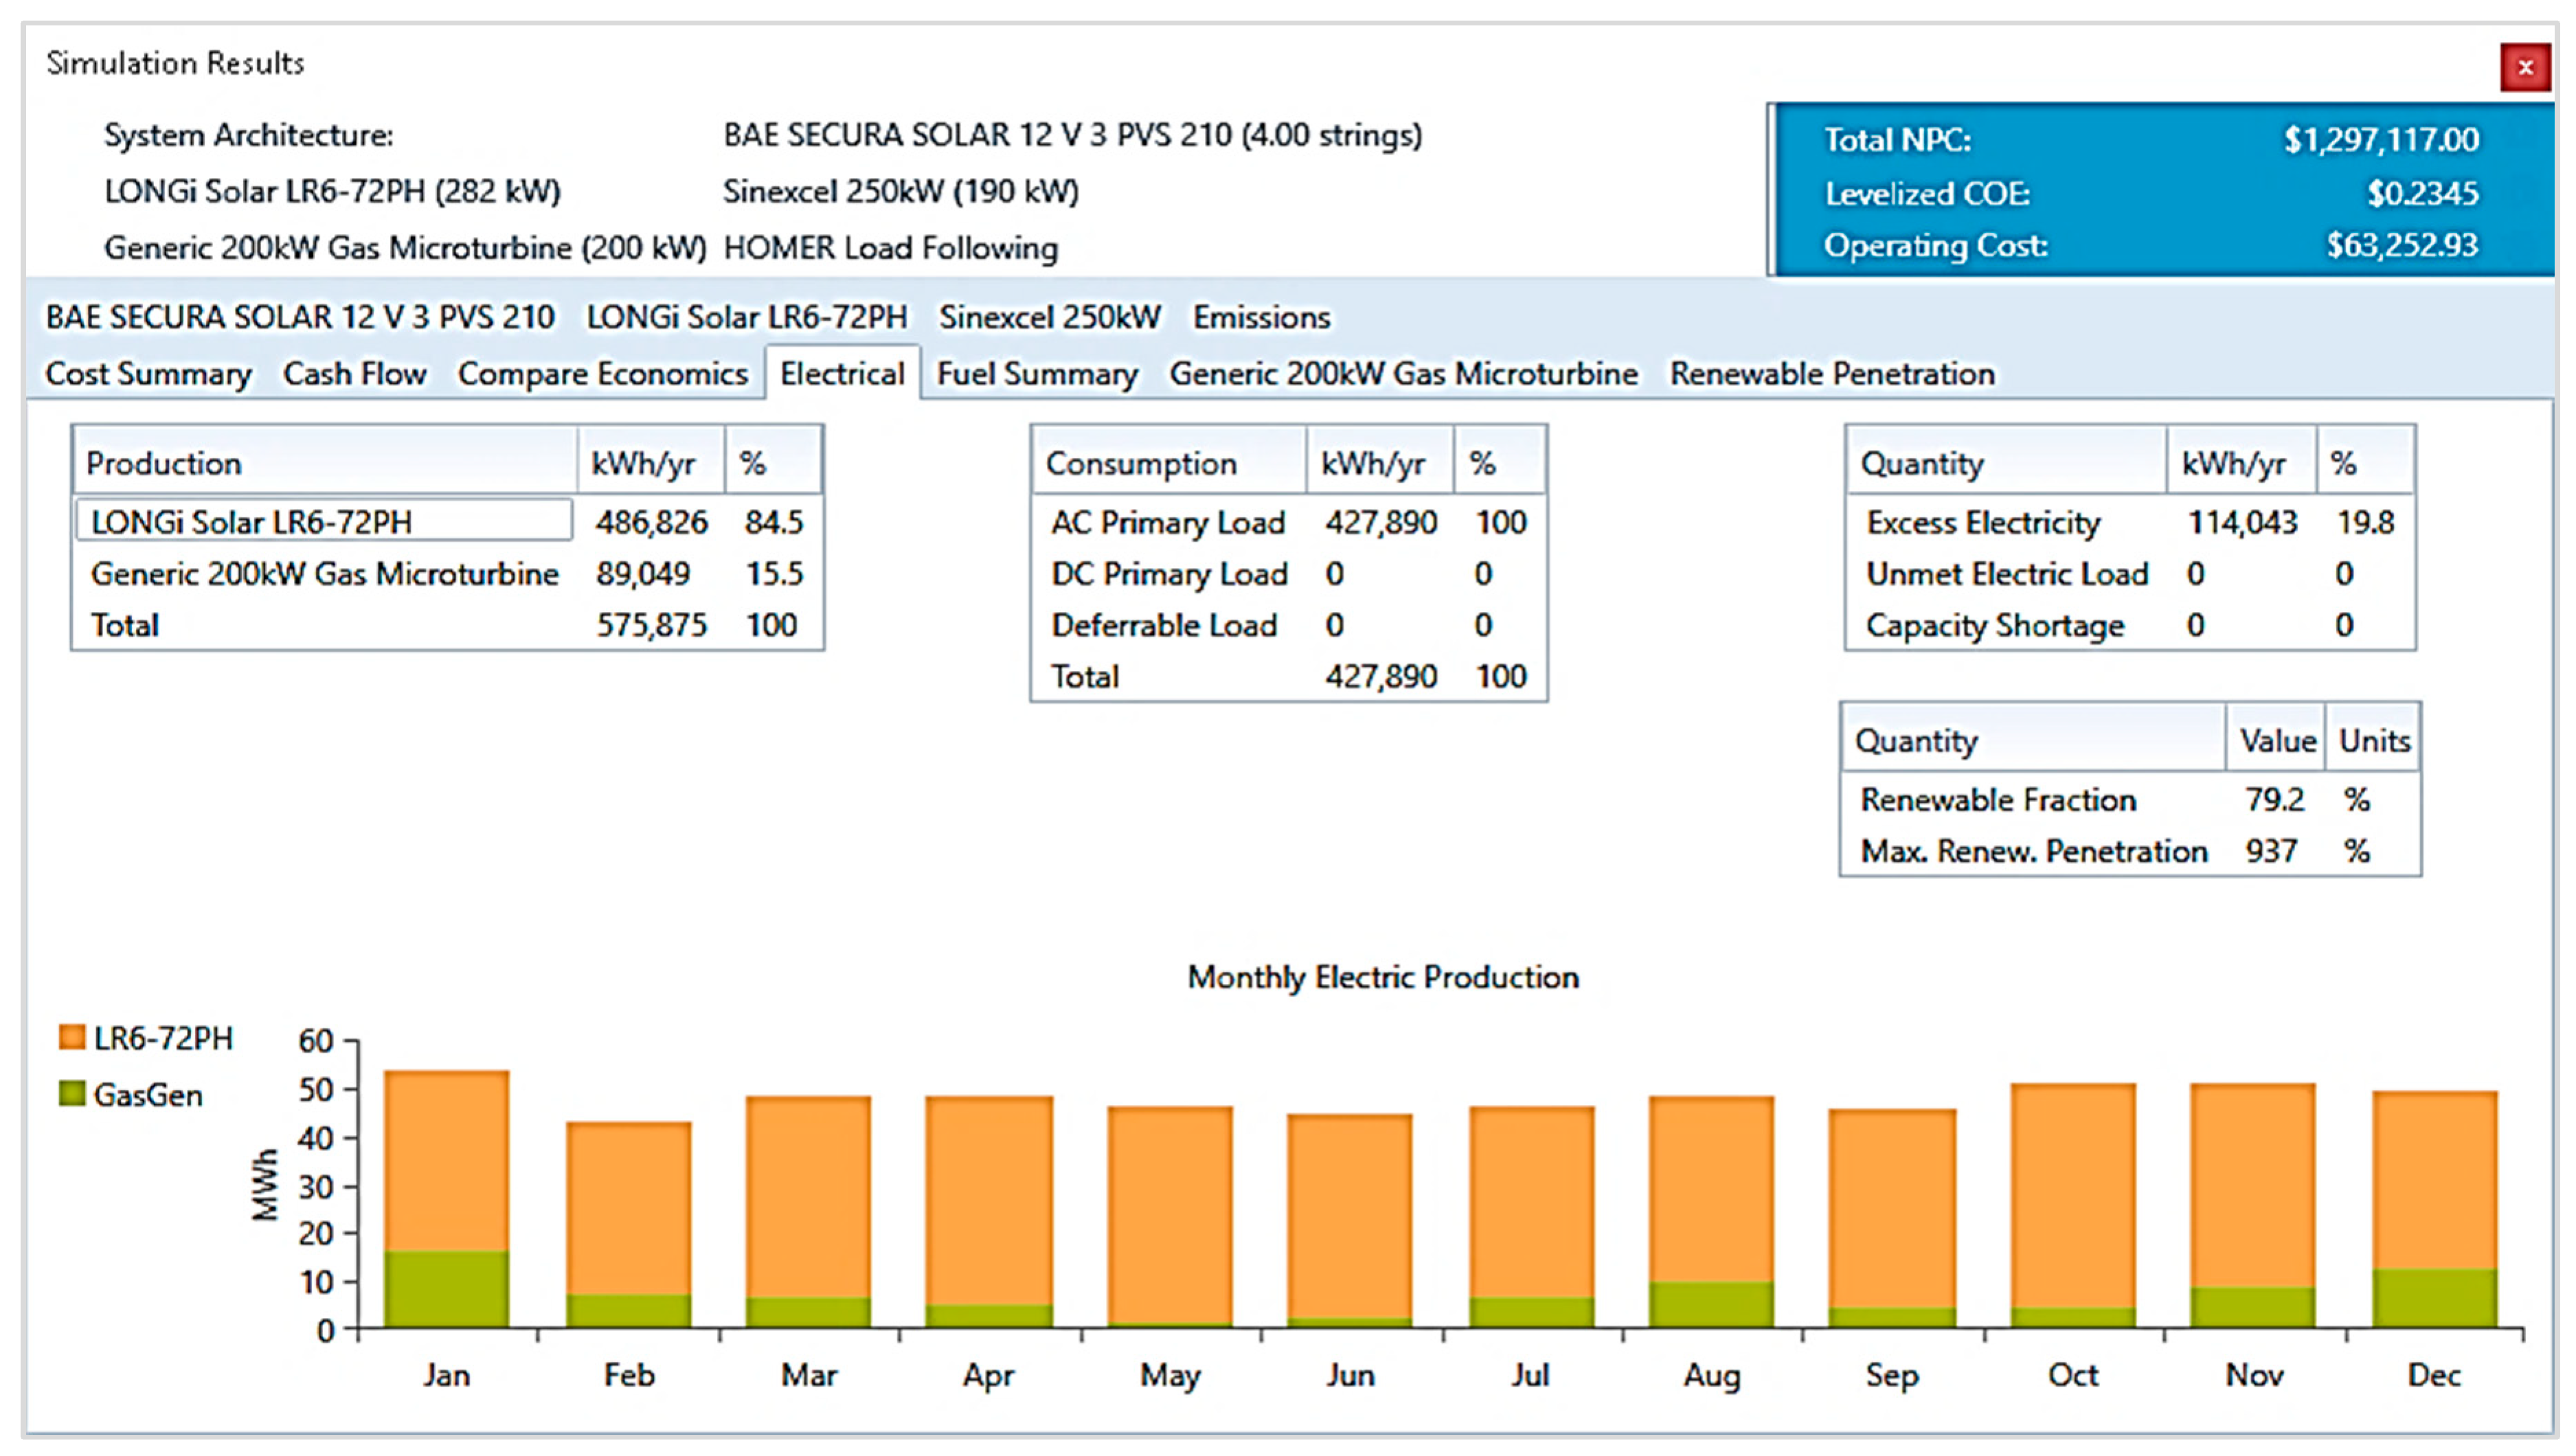
  • HOMER Pro performed a total of 892 simulations, and the designed optimal system features a 79.2% renewable energy fraction, reducing the non-renewable fraction from the prior 100% to only 20.8%, thereby addressing cost inefficiencies.
  • The designed hybrid power system provides a cost of energy of USD 0.234, presenting noteworthy cost savings of USD 0.148 when compared to the current actual cost of energy, which stands at USD 0.382. Likewise, with an annual operating cost of USD 63,253, the system achieves significant savings of USD 87,321 compared to the current actual cost of USD 150,574.
  • The dynamic modeling of an HPS coupled with experimental validation through Hardware-in-the-Loop and OPAL-RT Technologies’ high-performance real-time OP5707XG simulator substantiates the comprehensive performance of the proposed system. This validation confirms the designed system’s capability to supply reliable and consistent power and affirms the HPS’s capability to fully satisfy the energy demands of control stations in remote areas, promising environmentally friendly and economical energy while contributing to the enhanced sustainability of energy infrastructure.

Author Contributions

Conceptualization, M.W.; Methodology, M.W.; Software, M.W.; Validation, M.W.; Resources, M.W.; Writing—original draft, M.W.; Writing—review & editing, M.J. and A.A.K.; Supervision, M.J. and A.A.K.; Project administration, M.J.; Funding acquisition, M.J. All authors have read and agreed to the published version of the manuscript.

Funding

This research received no external funding.

Data Availability Statement

The original contributions presented in the study are included in the article, further inquiries can be directed to the corresponding authors.

Conflicts of Interest

The authors declare no conflicts of interest.

References

  1. Li, Q.; Wang, F.; Wang, Y.; Bai, B.; Zhang, J.; Lili, C.; Sun, Q.; Wang, Y.; Forson, K. Adsorption behavior and mechanism analysis of siloxane thickener for CO2 fracturing fluid on shallow shale soil. J. Mol. Liq. 2023, 376, 121394. [Google Scholar] [CrossRef]
  2. Ali, S.; Yan, Q.; Sajjad Hussain, M.; Irfan, M.; Ahmad, M.; Razzaq, A.; Dagar, V.; Işık, C. Evaluating Green Technology Strategies for the Sustainable Development of Solar Power Projects: Evidence from Pakistan. Sustainability 2021, 13, 12997. [Google Scholar] [CrossRef]
  3. Wang, F.; Xiao, Z.; Li, X.; Ren, J.; Xing, T.; Li, Z.; Li, X.; Chen, Y. Strategic design of cellulose nanofibers@zeolitic imidazolate frameworks derived mesoporous carbon-supported nanoscale CoFe2O4/CoFe hybrid composition as trifunctional electrocatalyst for Zn-air battery and self-powered overall water-splitting. J. Power Sources 2022, 521, 230925. [Google Scholar] [CrossRef]
  4. Anwar, J. Analysis of energy security, environmental emission and fuel import costs under energy import reduction targets: A case of Pakistan. Renew. Sustain. Energy Rev. 2016, 65, 1065–1078. [Google Scholar] [CrossRef]
  5. Bergasse, E.; Paczynski, W.; Dabrowski, M.; De Wulf, L. The Relationship between Energy and Socio-Economic Development in the Southern and Eastern Mediterranean. SSRN Electron. J. 2013. [Google Scholar] [CrossRef]
  6. Etokakpan, M.U.; Solarin, S.A.; Yorucu, V.; Bekun, F.V.; Sarkodie, S.A. Modeling natural gas consumption, capital formation, globalization, CO2 emissions and economic growth nexus in Malaysia: Fresh evidence from combined cointegration and causality analysis. Energy Strategy Rev. 2020, 31, 100526. [Google Scholar] [CrossRef]
  7. Akhtar, T.; Rehman, A.U.; Jamil, M.; Gilani, S.O. Impact of an Energy Monitoring System on the Energy Efficiency of an Automobile Factory: A Case Study. Energies 2020, 13, 2577. [Google Scholar] [CrossRef]
  8. Shar, A.M. Natural Gas Potential of Pakistan an Important Parameter in Mitigating Greenhouse Gas Emissions. Pak. J. Anal. Environ. Chem. 2020, 21, 209–218. [Google Scholar] [CrossRef]
  9. IEA. Energy Statistics Data Browser—Data Tools. Available online: https://www.iea.org/data-and-statistics/data-tools/energy-statistics-databrowser?country=PAK&fuel=Energy%20supply&indicator=CoalProdByType (accessed on 31 March 2024).
  10. Guo, B.; Ghalambor, A. Natural Gas Engineering Handbook; Gulf Publishing Company: Houston, TX, USA, 2012; pp. 277–279. [Google Scholar]
  11. Fetisov, V.; Ilyushin, Y.V.; Vasiliev, G.G.; Leonovich, I.A.; Müller, J.; Riazi, M.; Mohammadi, A.H. Development of the automated temperature control system of the main gas pipeline. Sci. Rep. 2023, 13, 3092. [Google Scholar] [CrossRef]
  12. Gudmundsson, J. Hydrate Non-Pipeline Technology for Transport of Natural Gas. Available online: https://citeseerx.ist.psu.edu/document?repid=rep1&type=pdf&doi=cd54d345cdfb6b6fab99a9a93a095dccd9837709 (accessed on 28 January 2024).
  13. Da Lio, L.; Lazzaretto, A. Remote Power Generation for Applications to Natural Gas Grid: A Comprehensive Market Review of Techno-Energetic, Economic and Environmental Performance. Energies 2022, 15, 5065. [Google Scholar] [CrossRef]
  14. World Bank. Access to Electricity (% of Population)|Data. Worldbank.org. 2018. Available online: https://data.worldbank.org/indicator/eg.elc.accs.zs (accessed on 30 November 2023).
  15. Muqeet, H.A.; Munir, H.M.; Javed, H.; Shahzad, M.; Jamil, M.; Guerrero, J.M. An Energy Management System of Campus Microgrids: State-of-the-Art and Future Challenges. Energies 2021, 14, 6525. [Google Scholar] [CrossRef]
  16. Energy and Economy. Available online: https://www.finance.gov.pk/survey/chapter_22/PES14-ENERGY.pdf (accessed on 30 November 2023).
  17. ieefa.org. Rising LNG Dependence in Pakistan is a Recipe for High Costs, Financial Instability, and Energy Insecurity. Available online: https://ieefa.org/resources/rising-lng-dependence-pakistan-recipe-high-costs-financial-instability-and-energy (accessed on 15 December 2023).
  18. Javed, H.; Muqeet, H.A.; Shehzad, M.; Jamil, M.; Khan, A.A.; Guerrero, J.M. Optimal Energy Management of a Campus Microgrid Considering Financial and Economic Analysis with Demand Response Strategies. Energies 2021, 14, 8501. [Google Scholar] [CrossRef]
  19. IEA. Annual Average Price of Electricity in Pakistan, 2019–2025—Charts—Data & Statistics. Available online: https://www.iea.org/data-and-statistics/charts/annual-average-price-of-electricity-in-pakistan-2019-2025 (accessed on 15 December 2023).
  20. Ahsan, L.; Iqbal, M. Dynamic Modeling of an Optimal Hybrid Power System for a Captive Power Plant in Pakistan. Jordan J. Electr. Eng. 2022, 8, 195. [Google Scholar] [CrossRef]
  21. Agajie, T.F.; Ali, A.; Fopah-Lele, A.; Amoussou, I.; Khan, B.; Velasco, C.L.R.; Tanyi, E. A Comprehensive Review on Techno-Economic Analysis and Optimal Sizing of Hybrid Renewable Energy Sources with Energy Storage Systems. Energies 2023, 16, 642. [Google Scholar] [CrossRef]
  22. Hussain, F.; Maeng, S.-J.; Cheema, M.J.M.; Anjum, M.N.; Afzal, A.; Azam, M.; Wu, R.-S.; Noor, R.S.; Umair, M.; Iqbal, T. Solar Irrigation Potential, Key Issues and Challenges in Pakistan. Water 2023, 15, 1727. [Google Scholar] [CrossRef]
  23. Deveci, M.; Cali, U.; Pamucar, D. Evaluation of criteria for site selection of solar photovoltaic (PV) projects using fuzzy logarithmic additive estimation of weight coefficients. Energy Rep. 2021, 7, 8805–8824. [Google Scholar] [CrossRef]
  24. Herrería-Alonso, S.; Suárez-González, A.; Rodríguez-Pérez, M.; Rodríguez-Rubio, R.F.; López-García, C. A Solar Altitude Angle Model for Efficient Solar Energy Predictions. Sensors 2020, 20, 1391. [Google Scholar] [CrossRef]
  25. Solar Azimuth Angle—An Overview|ScienceDirect Topics. Available online: https://www.sciencedirect.com/topics/engineering/solar-azimuth-angle (accessed on 2 January 2024).
  26. apps.solargis.com. Solargis Prospect. Available online: https://apps.solargis.com/prospect/detail/scRwdD0kCL2vzMj1/info (accessed on 4 November 2023).
  27. Heydt, G.T. Distribution Transformer Loading:Probabilistic Modeling and Diversity Factor. IEEE Trans. Power Deliv. 2022, 38, 842–849. [Google Scholar] [CrossRef]
  28. Kahani, R.; Jamil, M.; Iqbal, M.T. An Improved Perturb and Observed Maximum Power Point Tracking Algorithm for Photovoltaic Power Systems. J. Mod. Power Syst. Clean Energy 2023, 11, 1165–1175. [Google Scholar] [CrossRef]
  29. Solaris. Longi Solar HiMO1 LR6-72PH-365M 365w Mono Solar Panel. Available online: https://www.solaris-shop.com/longi-solar-himo1-lr6-72ph-365m-365w-mono-solar-panel/ (accessed on 27 March 2024).
  30. Martin, L.; Vladislav, P.; Pavel, K. Temperature changes of I-V characteristics of photovoltaic cells as a consequence of the Fermi energy level shift. Res. Agric. Eng. 2017, 63, 10–15. [Google Scholar] [CrossRef]
  31. Cai, Y.; He, Y.; Zhou, H.; Liu, J. Design Method of LCL Filter for Grid-Connected Inverter Based on Particle Swarm Optimization and Screening Method. IEEE Trans. Power Electron. 2021, 36, 10097–10113. [Google Scholar] [CrossRef]
  32. Reznik, A.; Simoes, M.G.; Al-Durra, A.; Muyeen, S.M. LCL Filter Design and Performance Analysis for Grid-Interconnected Systems. IEEE Trans. Ind. Appl. 2013, 50, 1225–1232. [Google Scholar] [CrossRef]
  33. Aghenta, L.O.; Iqbal, M.T. Design and Dynamic Modelling of a Hybrid Power System for a House in Nigeria. Int. J. Photoenergy 2019, 2019, 6501785. [Google Scholar] [CrossRef]
  34. ‘Flagship Real-Time Digital Simulator|Simulation Tools|OP5707XG’, OPAL-RT. Available online: https://www.opal-rt.com/simulator-platform-op5707/ (accessed on 22 January 2024).
Figure 1. Total energy supply (TES) in Pakistan [9].
Energies 17 01763 g001
Figure 2. Sources of power generation in Pakistan [16].
Energies 17 01763 g002
Figure 3. Cost of energy in Pakistan [19].
Energies 17 01763 g003
Figure 4. Solar insolation levels in Pakistan [22].
Energies 17 01763 g004
Figure 5. Schematic diagram of SNGPL’s overall operation.
Energies 17 01763 g005
Figure 6. An aerial view of the selected site on Google Maps.
Energies 17 01763 g006
Figure 7. Real-life perspective of selected site.
Energies 17 01763 g007
Figure 8. Solar global horizontal irradiance and clearness index of selected site.
Energies 17 01763 g008
Figure 9. The solar azimuth and solar elevation for the selected site throughout the year [26].
Energies 17 01763 g009
Figure 10. Monthly electrical consumption of selected site (year of 2022).
Energies 17 01763 g010
Figure 11. Schematic diagram of proposed hybrid power system.
Energies 17 01763 g011
Figure 12. Equivalent circuit of solar cell.
Energies 17 01763 g012
Figure 13. Incremental conductance MPPT algorithm.
Energies 17 01763 g013
Figure 14. Current–voltage and power–voltage characteristics of PV panel used [29].
Energies 17 01763 g014
Figure 15. DC−DC buck converter.
Energies 17 01763 g015
Figure 16. Three-phase multi-level inverter.
Energies 17 01763 g016
Figure 17. Configuration of LCL Filter.
Energies 17 01763 g017
Figure 18. HOMER Pro-optimized HPS configuration.
Energies 17 01763 g018
Figure 19. Electrical energy production results from optimal system.
Energies 17 01763 g019
Figure 20. Dynamic model of proposed HPS in MATLAB/Simulink.
Energies 17 01763 g020
Figure 21. (a) Variable solar GHI. (b) Variable temperature. (c,d) PV panel output voltage and current due to varying input variables.
Energies 17 01763 g021
Figure 22. (a) Battery bank % state of charge. (b) Battery bank voltage. (c) Battery bank current.
Energies 17 01763 g022
Figure 23. (a) Three-phase voltage (Vpeak) delivered to load. (b) Three-phase current delivered to load.
Energies 17 01763 g023
Figure 24. OPAL-RT real-time experimental setup.
Energies 17 01763 g024
Figure 25. OPAL-RT experimental result for three-phase output voltage delivered to load.
Energies 17 01763 g025
Figure 26. OPAL-RT experimental result for three-phase output current delivered to load.
Energies 17 01763 g026
Table 1. Modes of NG transportation: capacity–distance comparison [12].
Mode of TransportationCapacity (bcm)Distance (km)
LNG (Liquefied Natural Gas)1.0–10.01000–10,000
Gas to Liquid (GTL)0.1–1.05000–10,000
CNG (Compressed Natural Gas)0.1–1.0100–5000
Pipeline1.0–10.0100–1000
NGH (Natural Gas Hydrates)0.1–1.0100–5000
GTW (Gas to Wire)0.1–1.0100–5000
Table 2. Detail of total connected load at selected site.
System DescriptionNumber of UnitsRated Power of
Unit Load Installed
Total Connected
Load
hpkWhpkW
Discharge Gas Cooling (DGC) SystemFan Motors42518.6510074.6
Fan Motors24029.848059.68
Pump Motors0003022.38
Turbine PackageLube Oil Tank Heater00000
Evaporative Cooling Pump Motor20.750.55951.51.119
Turbine ShedInlet Fan Motors00000
Exhaust Fan Motor00000
Raw Water PumpPump Motor #121511.193022.38
Air systemAir Compressor Motors21511.193022.38
Power HouseRadiator Fan Motor10.750.55950.750.5595
Water Circulating Pump Motor110.74610.746
Auxiliary LoadResidential Load 75075
Total Connected Load278.84 KW
Table 3. Maximum power point tracking conditions.
ConditionConstraintDescription
d I d V = I V If P = MPPMPP achieved
d I d V > I V If P < MPPOperating point is left to MPP
d I d V < I V If P > MPPOperating point is right to MPP
Table 4. System optimization results in HOMER Pro.
System ArchitecturePV (kW)Gas Genset (kW)ESS (No. of Batteries)Converter (kW)NPC (USD)COE (USD)Operating Cost (USD/Year)Initial Capital (USD)
PV-Genset-ESS-Converter2822002801901.30 M0.23463,253479,414
Genset-ESS-Converter 20014066.81.85 M0.335125,403229,611
Genset 200 2.11 M0.382150,574165,350
PV-ESS-Converter582 12602012.12 M0.38395,462881,476
PV-Genset-Converter6.11200 1.422.12 M0.383150,989169,402
Disclaimer/Publisher’s Note: The statements, opinions and data contained in all publications are solely those of the individual author(s) and contributor(s) and not of MDPI and/or the editor(s). MDPI and/or the editor(s) disclaim responsibility for any injury to people or property resulting from any ideas, methods, instructions or products referred to in the content.

