1. Introduction
Fluid-induced vibration (FIV) refers to the dynamic reaction of a structure as it engages with the flow of a fluid. FIV indeed has the potential to cause damage to structures, including the risk of fatigue-related failure in structures like marine risers [
1] and extended flexible cylinders [
2,
3,
4]. Conversely, it can be employed for energy harvesting from the fluid motion [
5]. Vortex-induced vibration (VIV) is one of the most common phenomena in FIV [
6,
7]. VIV is a fluid–structure interaction (FSI) occurrence where the structure experiences vibrations due to the alternating forces generated by vortices being shed intermittently from the surfaces of a bluff body (e.g., a circular cylinder) [
8]. The behavior of VIV in a uniform flow for a circular cylinder is determined by factors such as the Reynolds number, structural damping ratio, mass ratio, and reduced velocity [
9]. VIV-based energy harvesting has gained significant attention because of its distinct characteristics, involving self-triggered oscillations within the synchronization or lock-in region. This occurs when the shedding frequency closely matches with the natural frequency of the structure [
10]. Typically, amplitude response is maximum in the lock-in region.
The vortex pattern downstream of a cylinder has been studied both experimentally and numerically by various research groups [
11,
12]. Based on the number of vortices shed per vibrating cycle, shedding modes are divided into three modes: (i) 2P mode; (ii) 2S mode; and (iii) P + S mode. Here, ‘P’ and ‘S’ represent the pair of vortices and a single vortex shed into the wake per oscillating cycle [
9]. Govardhan and Williamson [
11] observed that when the combined mass-damping parameter is high, the lower branch exhibits the 2S mode, while the upper branch displays the 2P mode. However, when the mass-damping parameter is low, the cylinder’s response in the lock-in region is categorized into three branches: the initial branch, the upper branch, and the lower branch [
13]. This configuration with three branches allows for the occurrence of transitions between 2P and 2S modes. In general, the 2P mode can effectively transmit energy from the fluid to the body’s motion when the amplitudes are relatively high within a specific range of reduced velocities.
Typically, most of the reported investigations of vortex-induced vibration have been conducted using a circular cylinder supported by a linearly elastic spring, in which the force was provided with the help of a spring-damper system. Nevertheless, recent research on fluid–structure systems featuring nonlinearity in their restoring forces has shown that these nonlinear forces can amplify the vibration amplitudes [
14,
15,
16]. One of the main features of a nonlinear restoring force is that it causes the object’s natural frequency to cease being constant; instead, it becomes a function of vibration amplitude. In 2013, Mackowski and Williamson [
17] conducted experimental research on the VIV amplitudes of a circular cylinder when it was supported by both linear and different types of nonlinear springs. Their findings indicated that it is possible to gain insights into and forecast the behavior of a nonlinear structural system by applying the principles learned from a conventional linear VIV system. They concluded that the introduction of nonlinearity into the spring system has the potential to result in a substantial enhancement of peak energy extraction efficiency. Barton et al. [
14] developed and assessed a mechanical energy harvesting device using a vibration table, excluding any fluid dynamic components. They incorporated magnets to introduce nonlinearity into the restoring force. Their results demonstrated that the inclusion of nonlinearity in the restoring force allowed the device to harvest energy over a broader range of frequencies. The study of vortex-induced vibration (VIV) in cylinders connected to nonlinear springs with either hardening or softening characteristics has only gained attention among researchers in the relatively recent past [
18,
19,
20]. It was observed that vortex-induced vibration energy harvesters equipped with hardening stiffness exhibit greater maximum voltage and displacement amplitudes compared to those with softening stiffness. Using passive turbulence control (PTC) and piecewise continuous restoring forces, Ma et al. [
21] conducted a VIV study on a rigid cylinder. They found that the nonlinear spring converter exhibited a significant performance improvement, achieving up to 76% better efficiency compared to its linear counterpart.
From the literature review, it is evident that the majority of VIV analyses involving non-linear spring systems have either been conducted as experimental studies or have utilized low-Reynolds-number [
9,
22] numerical analysis. In this study, we use the dynamic mesh method to conduct 2D simulations for an elastically mounted circular cylinder at high Reynolds numbers. Consequently, there is a notable absence of comprehensive investigations into VIV that consider the influence of nonlinear restoring forces. Therefore, in the current study, computational investigation of vortex-induced vibration for a cylinder elastically supported by both linear and cubic springs is carried out at high Reynolds numbers. The objective of the present study is to assess the impact of cubic stiffness nonlinearity on frequency response, amplitude response, force coefficients, and vortex shedding modes. The paper’s contents can be summarized as follows:
Section 1 introduces the topic and reviews the relevant literature, followed by a discussion in
Section 2 regarding the formulation and computational methods used to solve the interconnected solid–fluid equations and numerical validation of our methodology with experimental reported work. The results and findings are detailed in
Section 3. Finally,
Section 4 concludes our discussion.
2. Computational Modeling
This study utilized the Finite Volume-based solver ANSYS Fluent 2023 to carry out the simulations. Within the computational domain, the mass and momentum equations, together with the SST k-ω turbulence model, were solved. A wall function was used in the present model to connect the variations in flow variables between the viscous affected near-wall region with the fully turbulent region. The value of y+ was maintained below 5 to ensure accurate prediction of flow variations. The flow behavior was considered to be unsteady. In the study, all the simulations were performed using a pressure-based solver. The PISO algorithm was used for pressure–velocity coupling in all the simulations. The study utilized the Least Squares Cell-Based method for gradient calculations. For the discretization of flow and turbulence parameters, a second-order upwind scheme was applied. The time step used for the simulation was 0.001 to maintain the courant number around one. In the simulated cases, convergence was achieved for all the residuals by setting the maximal iterations of each time step to 50.
The equations used in the computational domain are as follows.
Momentum equation:
where
,
u represents the vector describing the velocity of the fluid, ‘
S’ corresponds to the tensor indicating the average strain rate,
μT denotes the turbulent eddy viscosity, and τ
R represents the turbulent or Reynolds stress tensor. Additionally,
I signifies the identity tensor, while
P and
ρ refer to the pressure and the air’s density, respectively.
The transport equations for
k-ω SST model:
where the turbulent viscosity is
and second invariant of the strain rate tensor
.
Here,
k and
ω denote turbulent kinetic energy and turbulent specific dissipation rate, respectively. In this context,
GK symbolizes the production of turbulence kinetic energy resulting from mean velocity gradients, and
cμ,
σK,
α,
β,
σω, and
σω,2 are parameters used for tuning the model.
F1 serves as the blending function. Moreover, there is another model constant denoted as
a1, and
F2 represents a secondary blending function. More details of the above equations can be found in reference [
23].
The structural equation governing the vibration of the elastically mounted cylinder, enabling transverse vibration in the y-direction, is as follows:
where
FL is the aerodynamic lift force, which is responsible for the cylinder’s motion and can be determined by integrating the pressure distribution over the surface of the cylinder. It is related to displacement y, lift force coefficient
CL, velocity
density
ρ of the fluid and incoming wind speed
U. The polynomial
represents the restoring force of the cylinder suspension.
To investigate the VIV of the cylinder, a dynamic mesh solver is essential to capture the displacement amplitude response accurately. Consequently, the simulations incorporated ANSYS Fluent’s 6DOF solver, which was implemented using a user-defined function (UDF). This UDF was employed to represent the physical properties of the cylindrical mass-spring-damper system and the net force acting on the cylinder. By utilizing the UDF and the dynamic mesh solver, the study could effectively analyze the behavior of the cylinder under VIV conditions.
2.1. Flow over a Fixed Cylinder
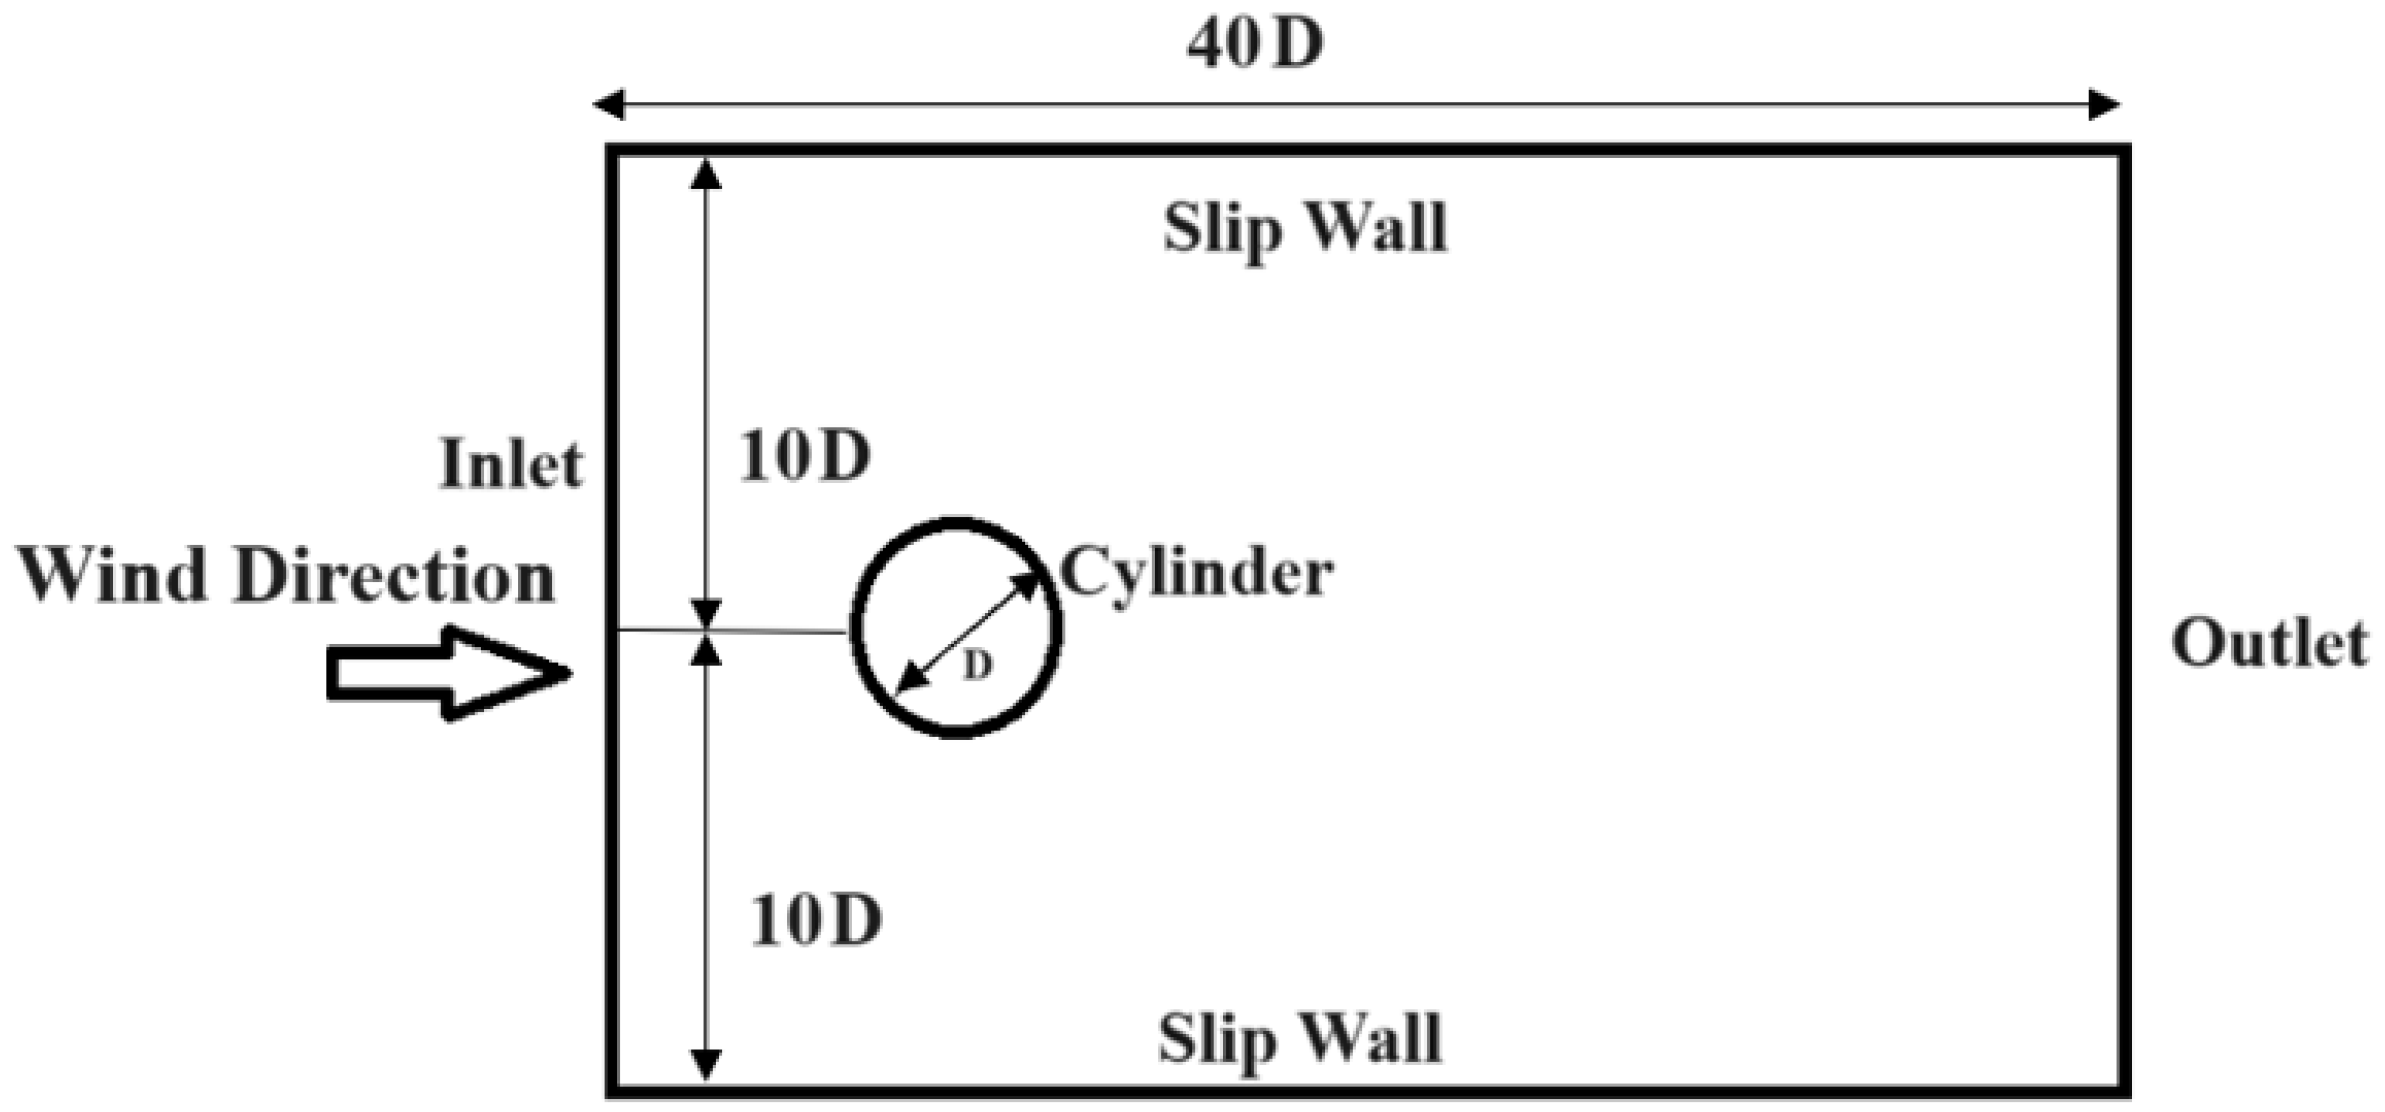
In the present study, the initial step involved examining the behavior of a stationary cylinder subjected to cross flow, serving as a test case for evaluating the effectiveness of the numerical modeling approach. The computational domain had a size of 40 D × 20 D, as shown in
Figure 1. The parameters used in this investigation were derived from the experimental research conducted by Ma et al. [
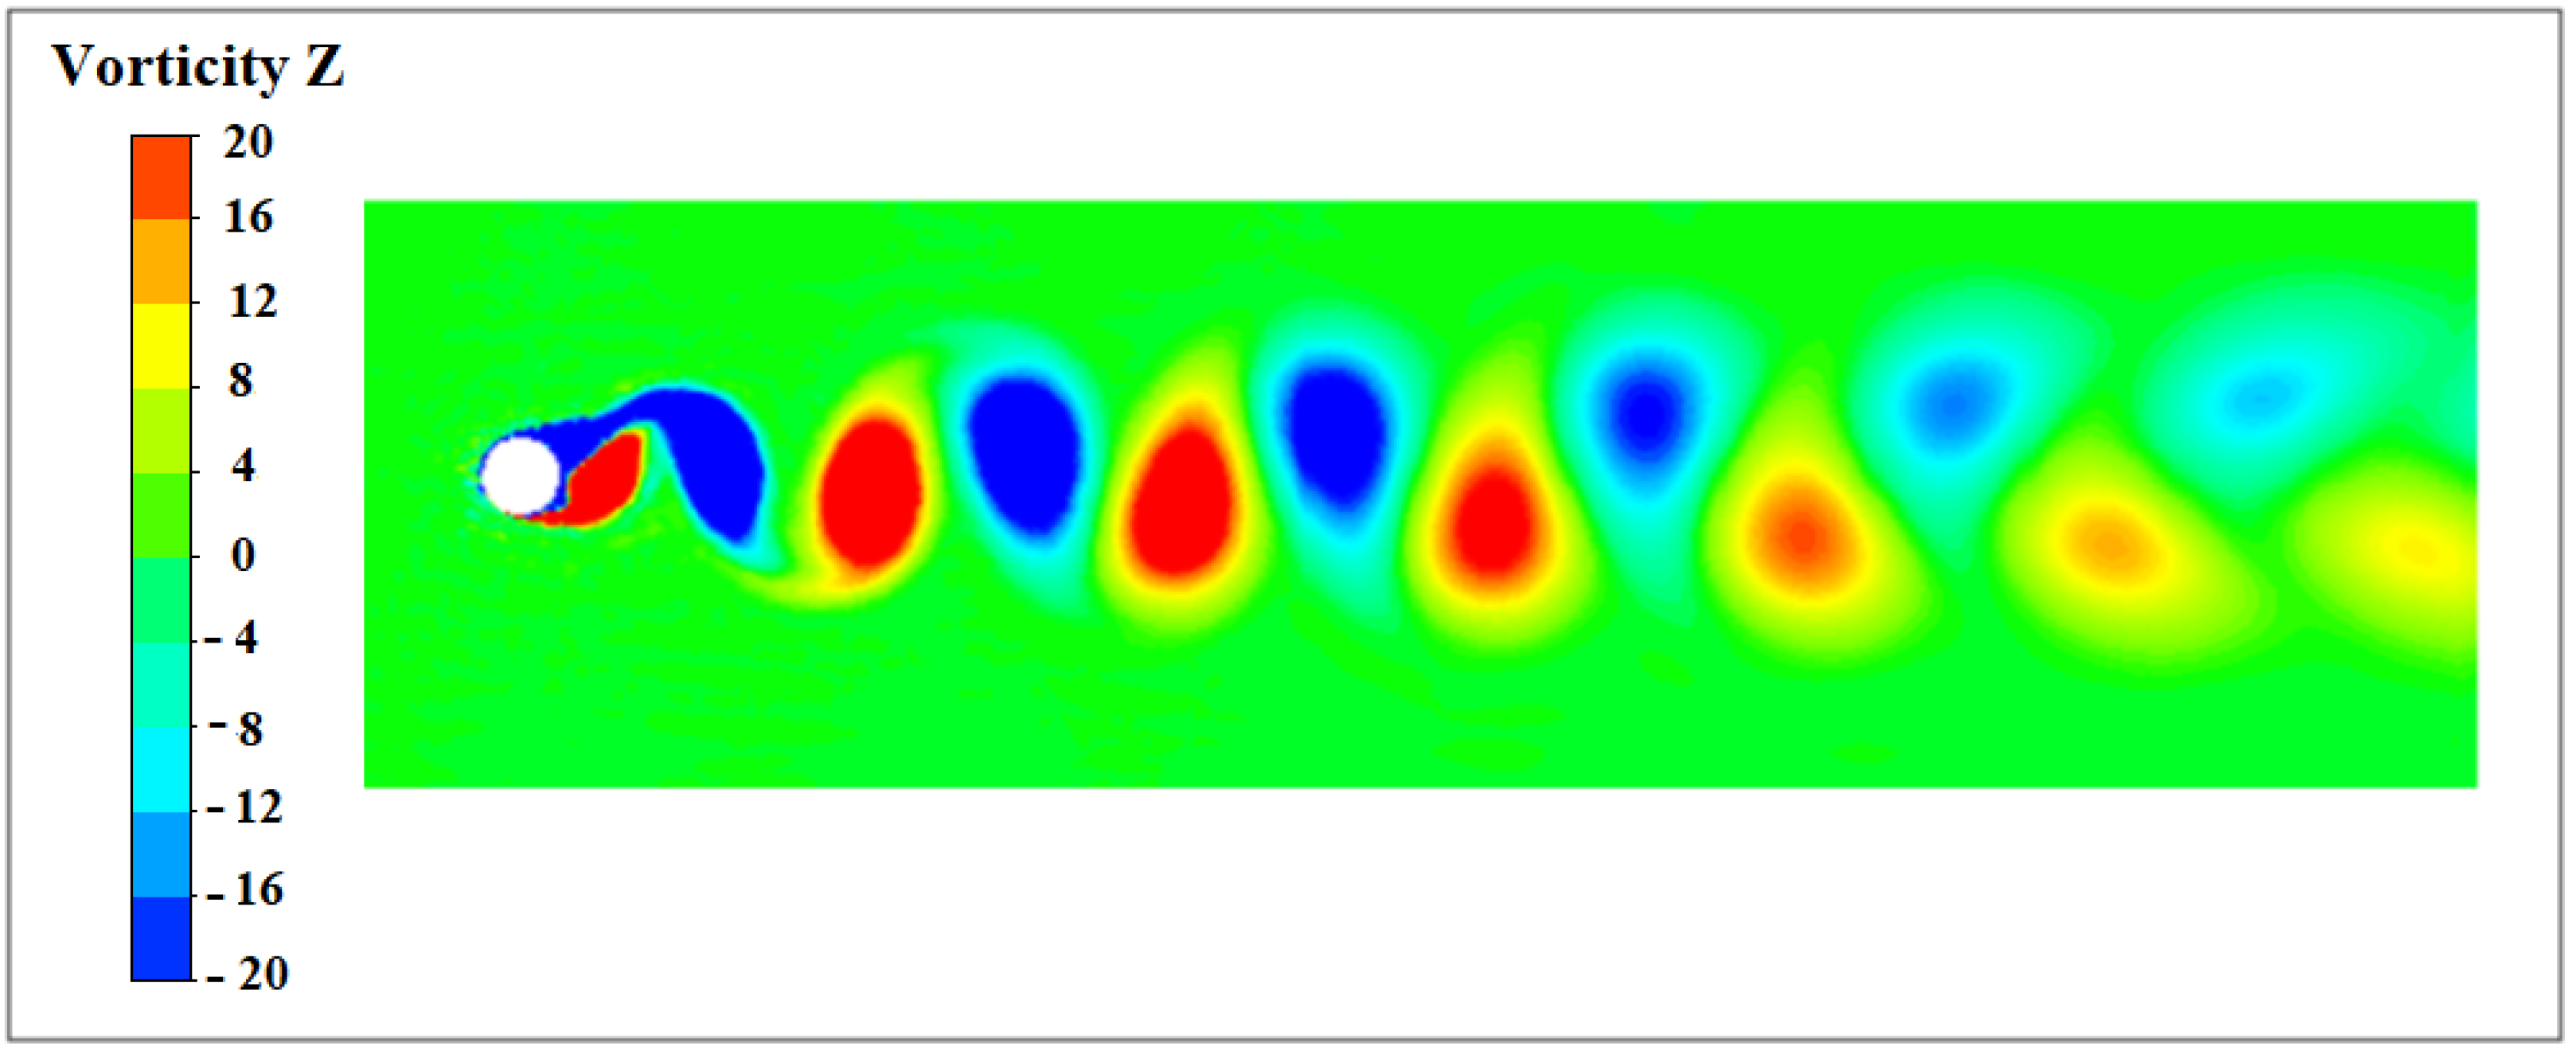
24]. The wake structures displayed a distinctive shedding pattern of alternating vortices emanating from the cylinder, leading to oscillating forces (
Figure 2). The experimental conditions corresponded to a Reynolds number of 10,000. When flow passes over a stationary cylinder, it triggers a vortex shedding phenomenon due to the variations in pressure on the cylinder’s surface. These pressure fluctuations result in alternating lift coefficients acting on the cylinder, thereby inducing lateral oscillations referred to as vortex-induced vibrations.
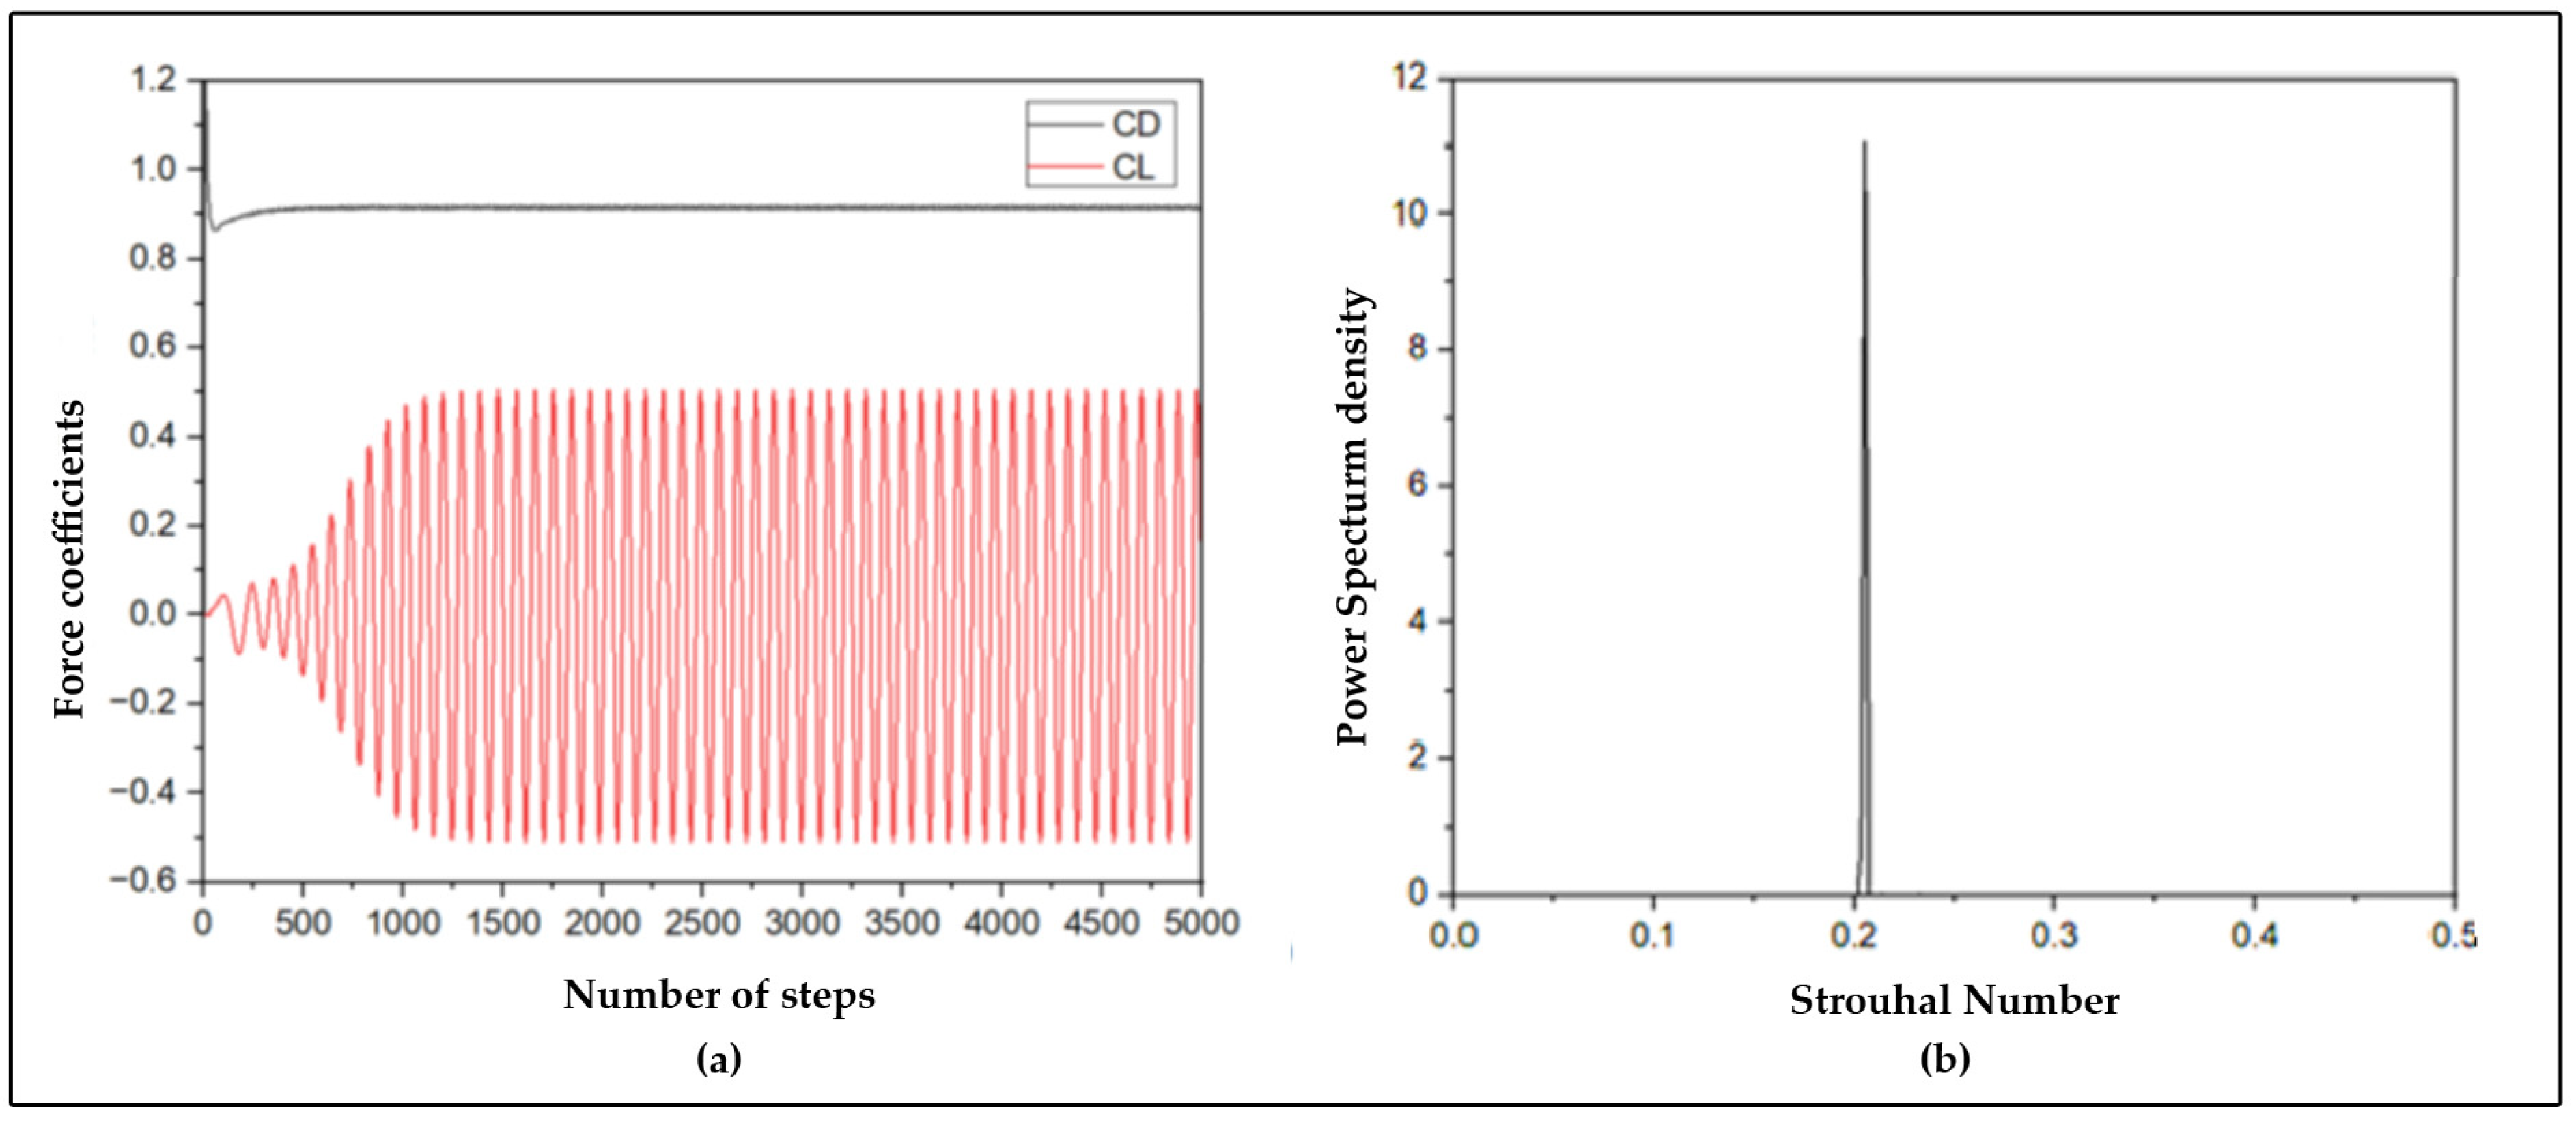
Figure 3 illustrates the force coefficients over time and power spectrum density of the lift coefficient against the Strouhal number (
St =
f D/U), as calculated using the
SST k-ω model (here, ‘
f’ stands for the vortex shedding frequency when the cylinder is fixed). The power spectrum analysis of the lift coefficient demonstrates that the lift force exhibited fluctuations at a Strouhal number of
St = 0.2, consistent with the findings reported by Ma et al. From the numerical analysis, the calculated RMS value of the lift coefficient and average value of the drag coefficient value were 0.312 and 1.09, which were calculated and compared.
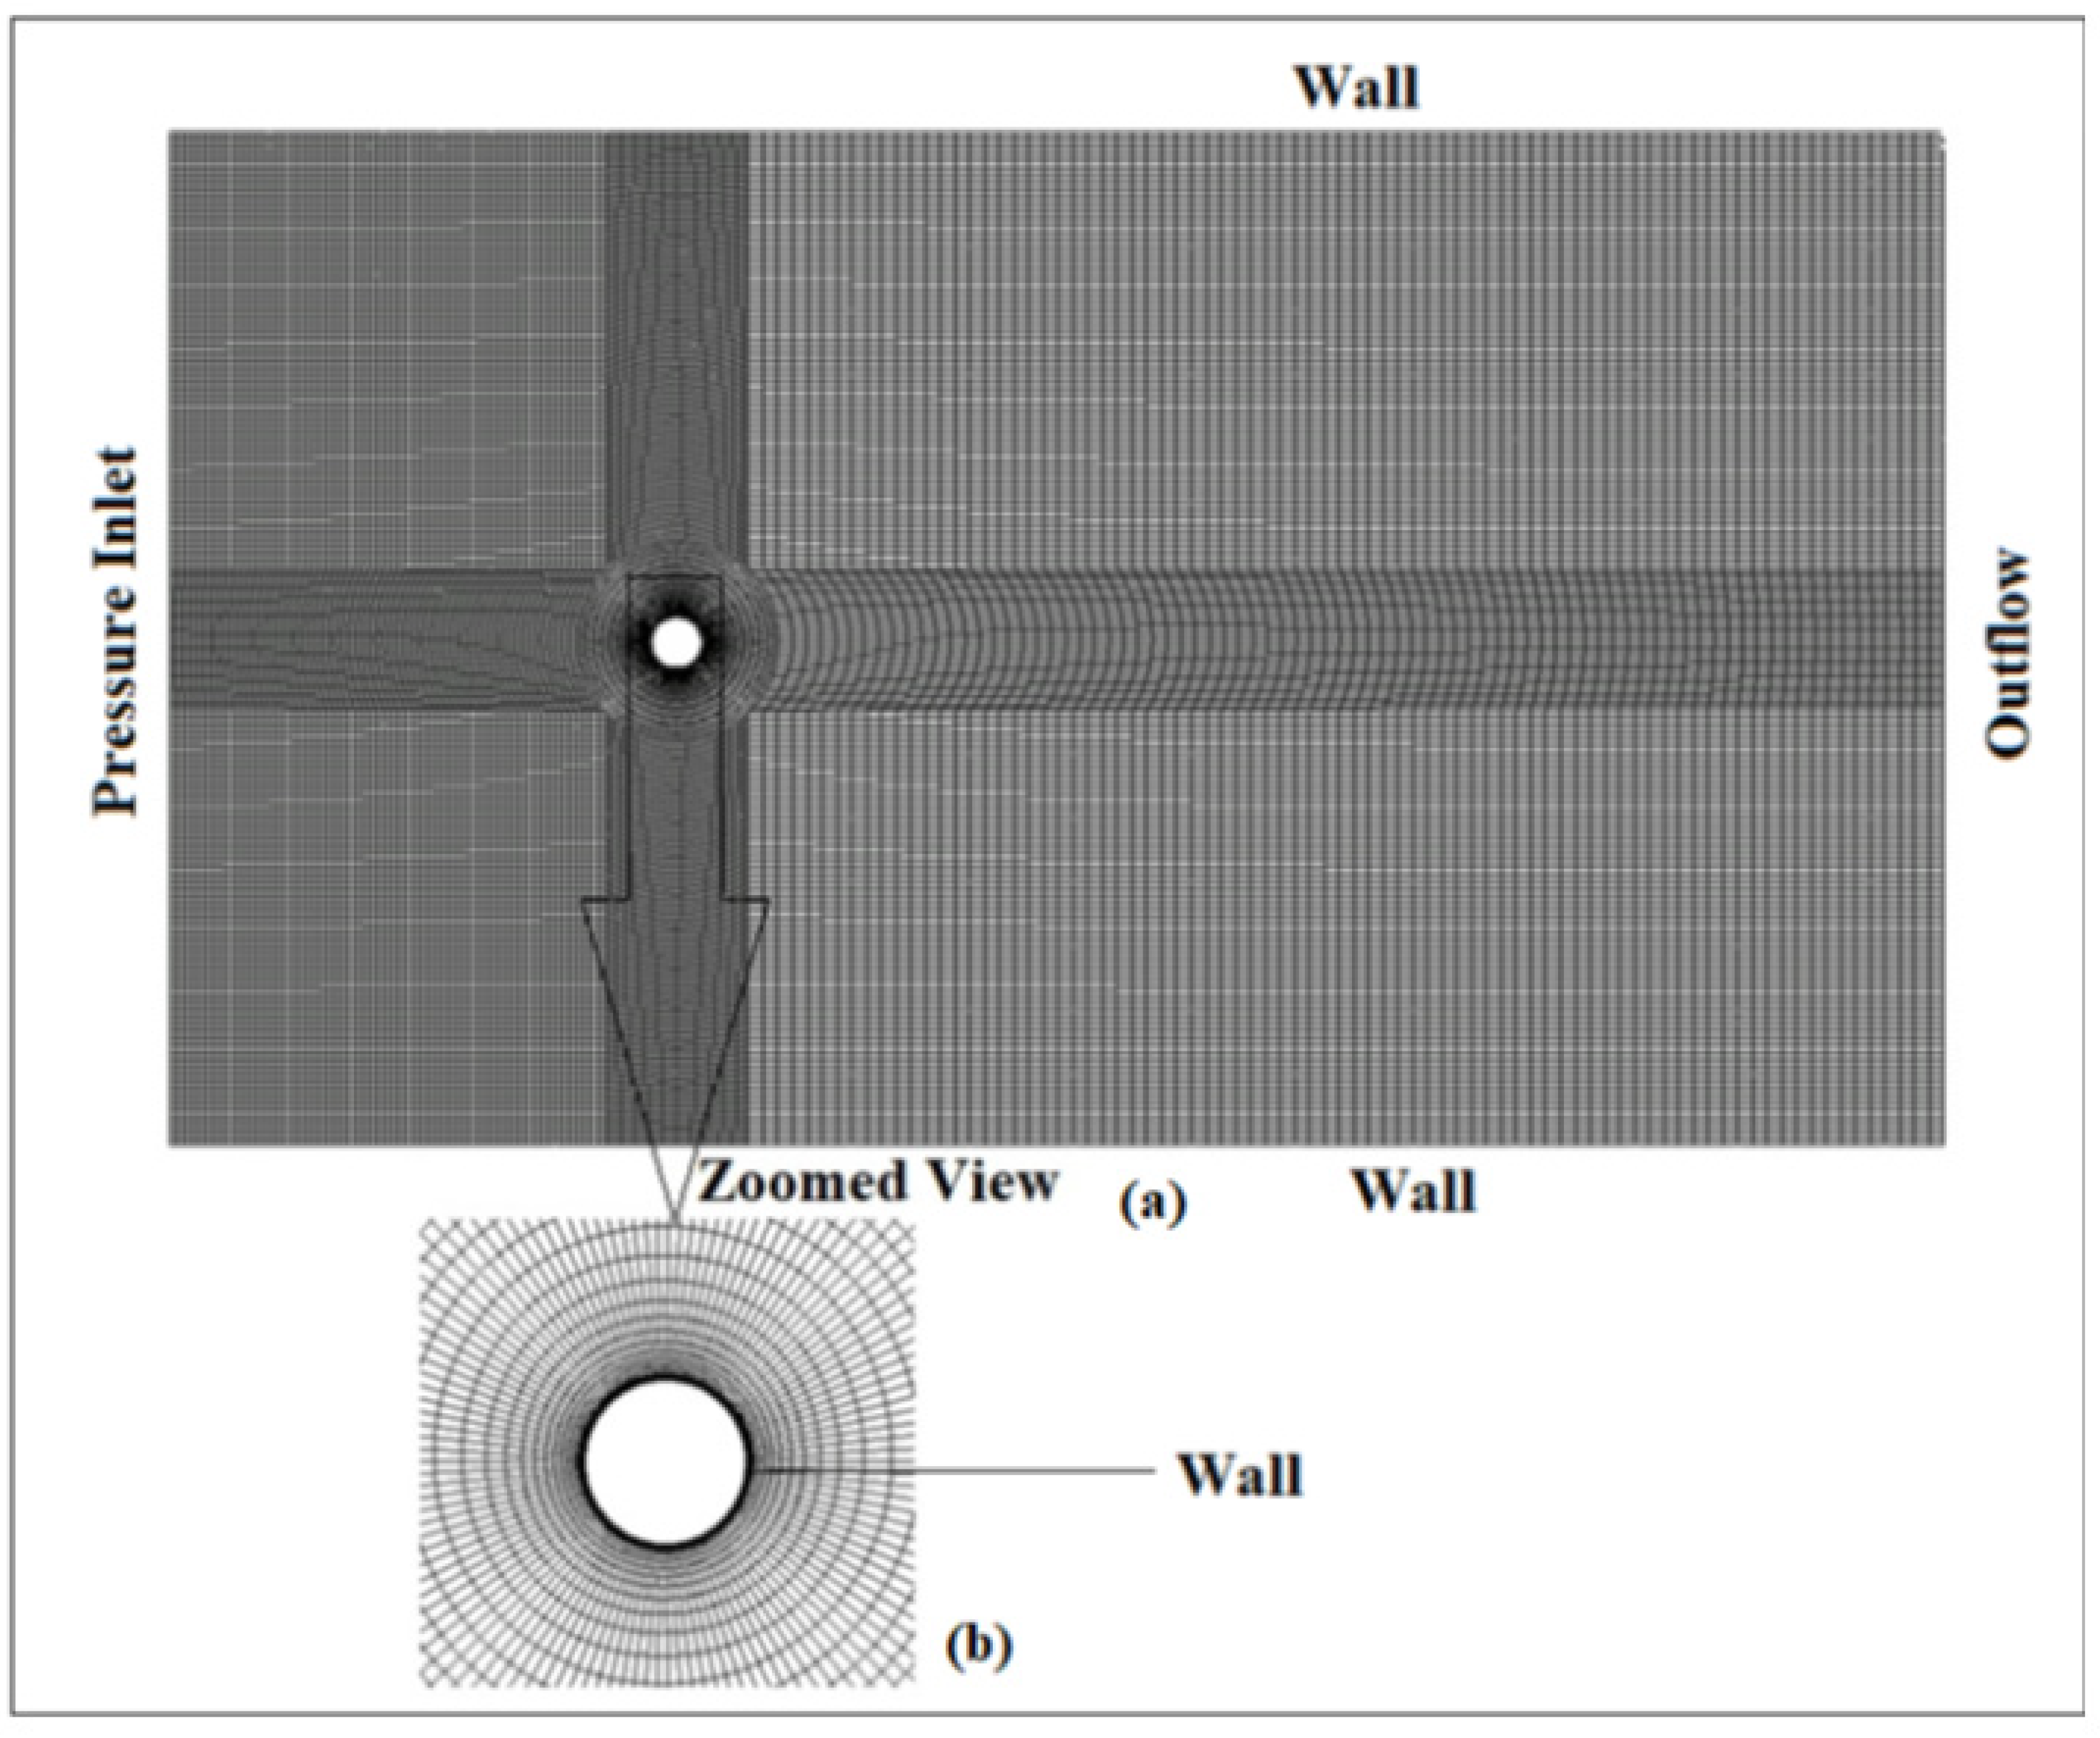
2.2. Computational Domain and Mesh
In the initial stage of this study, a cylinder was allowed to move in a cross-flow direction to examine the effects of vortex-induced vibrations. To analyze the lateral motion of the oscillating cylinder, considerable effort is needed during the mesh generation phase. Dynamic meshing is essential at every simulation step. The computational domain was constructed to accommodate the cylinders’ motion while ensuring cell quality remains uncompromised. The mesh generated for the simulation was with structured elements. The left side of the computational domain was defined with a velocity inlet boundary condition, while the right side was specified with an outflow boundary condition. The upper and lower boundaries of the computational domain were designated as symmetry, while the cylinder was defined with a wall boundary with no-slip condition.
To ensure the accuracy of the results and avoid errors caused by the grid resolution, a grid-independent study was conducted on the computational domains. The computational domain was discretized with three different levels of grids: coarse, medium, and fine. Independent mesh studies were conducted, in which reduced velocity
Ur = 5.84, Mass ratio = 11, and Reynold number,
Re = 10,000,
k3 = 0 (Linear case). Here,
fn is the natural frequency of the spring system,
D is the diameter of the cylinder, and
U is the wind speed. The physical parameters required for the study were taken from the reported work of Hover and Nguyen [
25,
26]. A uniform velocity of 0.3149 was used at the domain inlet. The value of the amplitude ratio obtained from different grid levels are displayed in
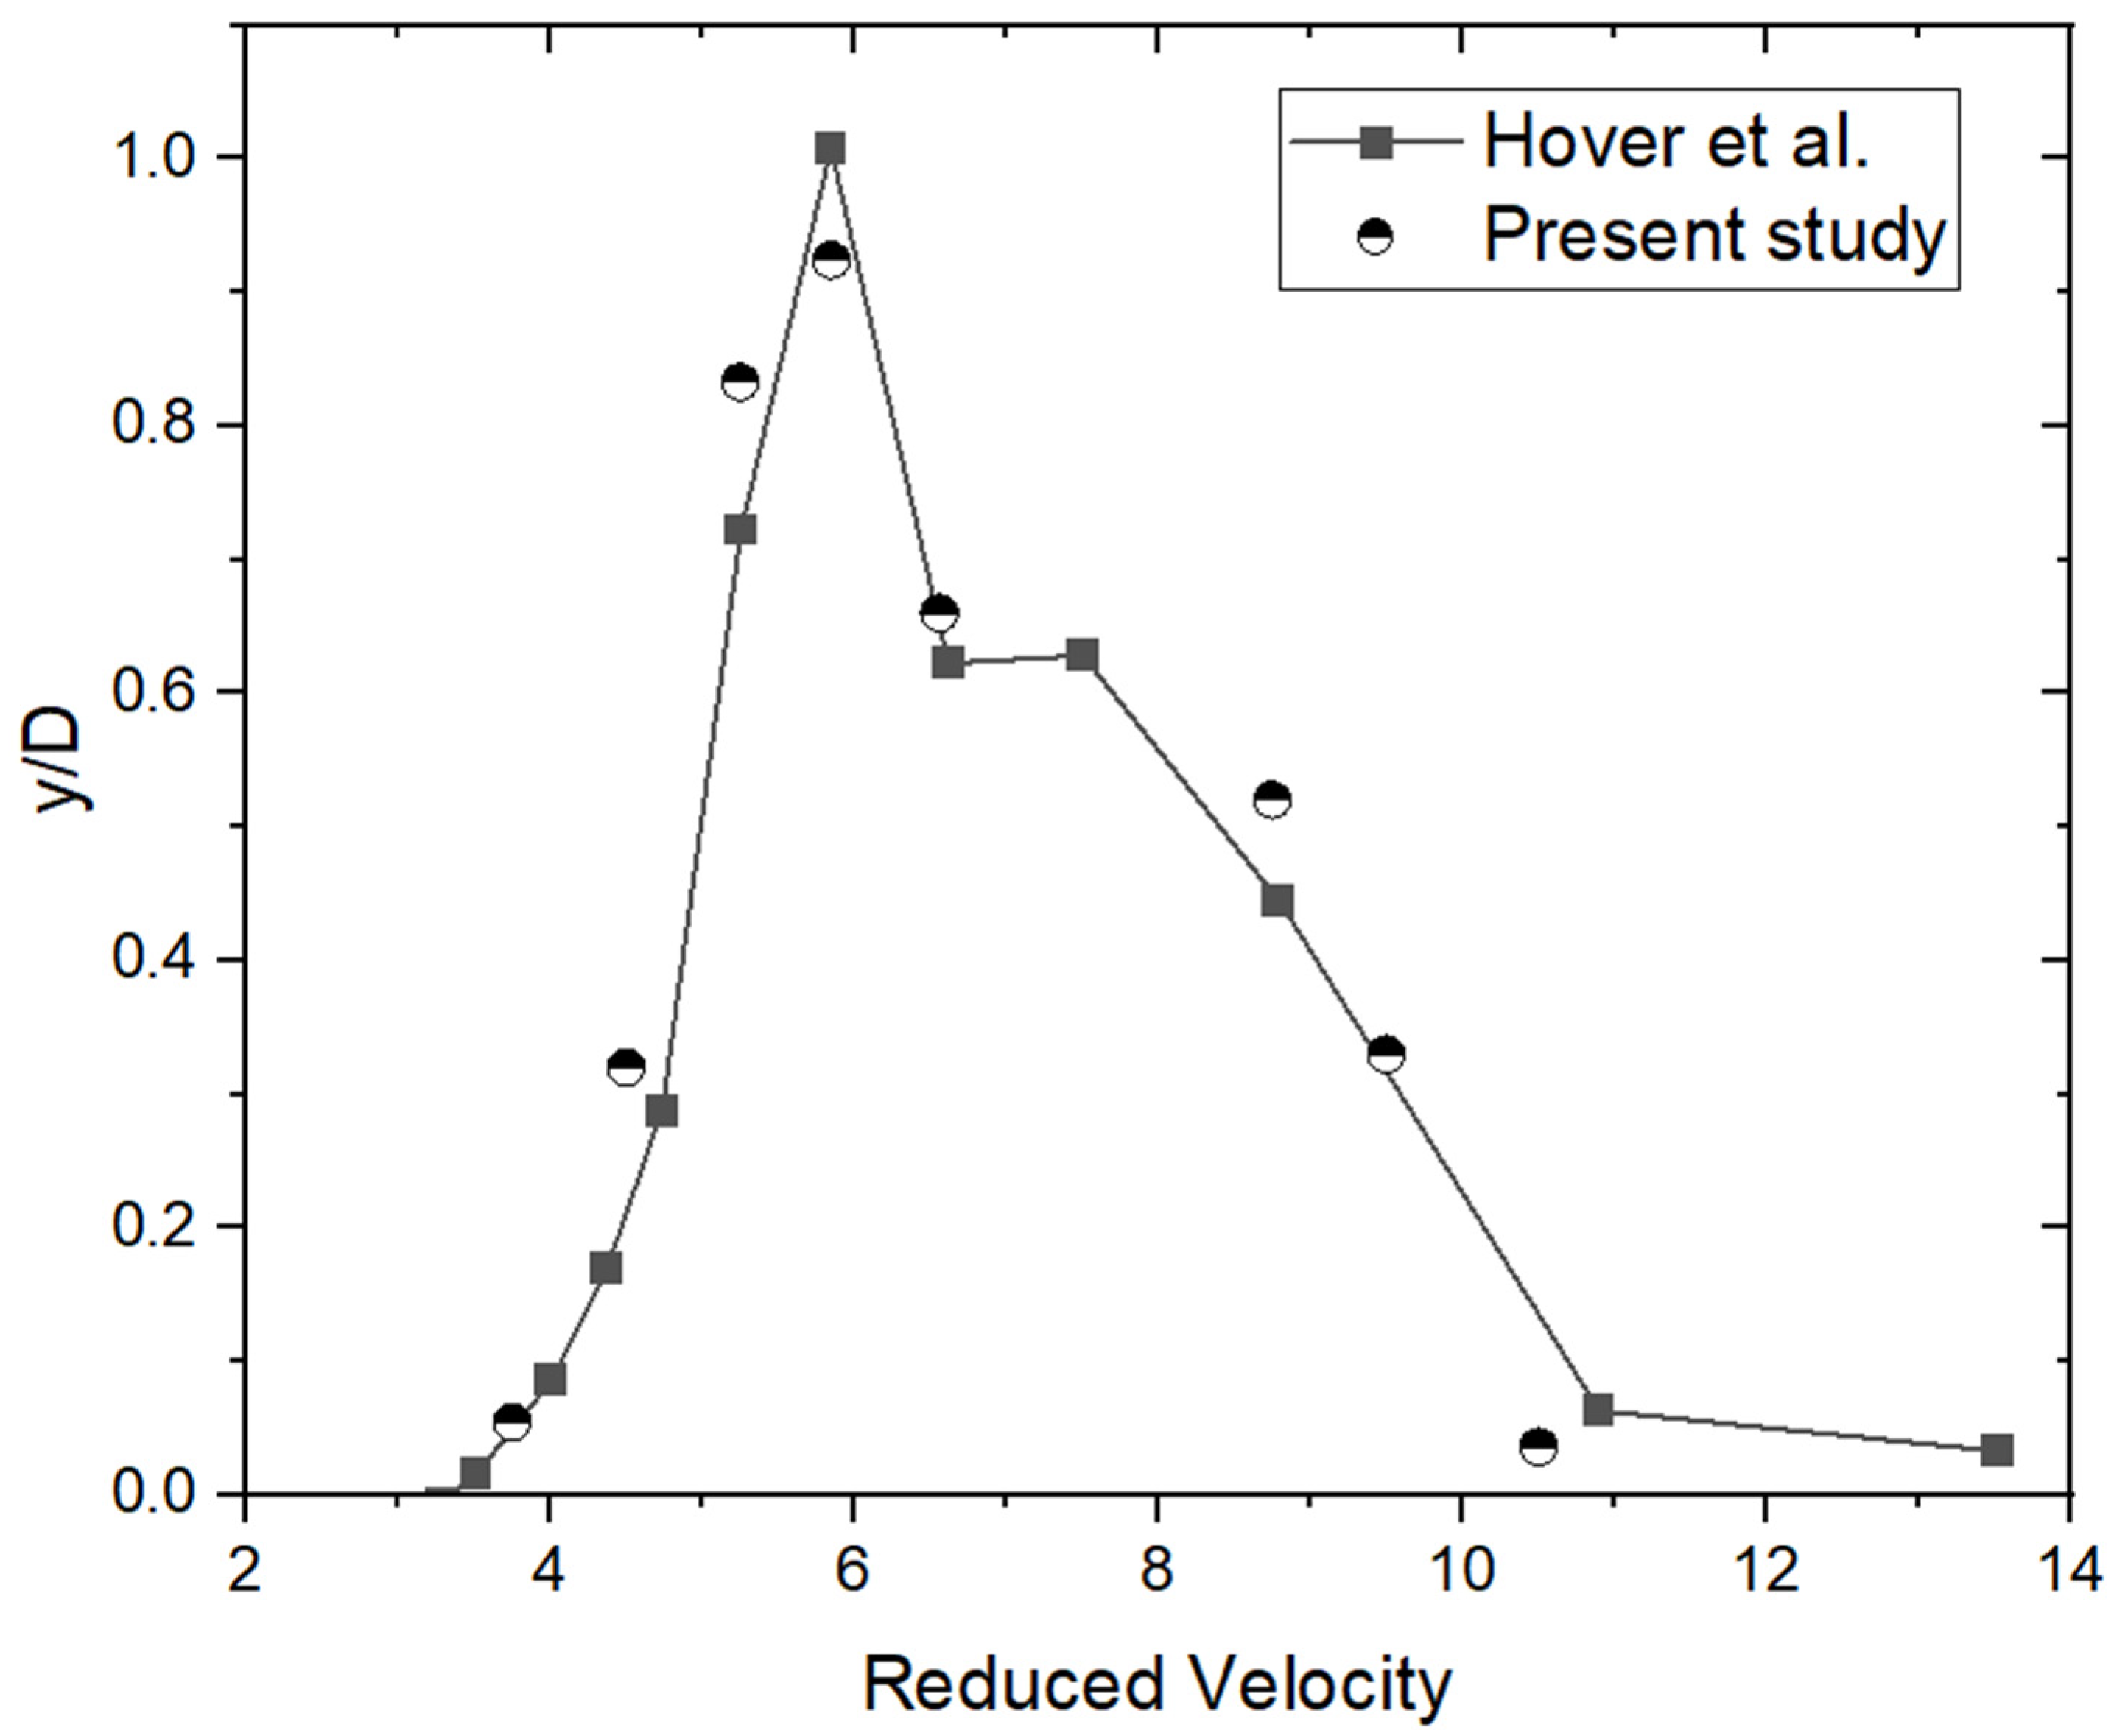
Table 1. The study revealed that there was a marginal difference in the value of amplitude ratio obtained from the coarse mesh in comparison to those obtained from the medium and fine meshes. However, the results obtained on the medium and fine grids exhibited nearly identical values. Consequently, it is evident that a medium-level grid refinement is sufficient for accurately predicting the vortex-induced vibration (VIV) analysis of the cylinder, and the solution on this domain can be considered grid-independent. Using a medium grid resolution, we performed a time step verification by testing four different time steps: 0.0005 s, 0.001 s, 0.002 s, and 0.005 s. The study indicated that a time step of 0.001 s is sufficient to achieve accurate solutions without requiring excessive computational resources. Subsequently, to validate the current numerical dynamic model, the results obtained from the present study were compared with those obtained from the experimental study of Hover et al. [
26] (
Figure 4).
2.3. VIV Analysis with Linear and Cubic Nonlinear Spring-Damper Systems
After the validation of flow around an oscillating cylinder, the study was extended to a case study, in which the cylinder was allowed to move in the
y-direction with both linear and cubic nonlinear spring-damper systems (
y and
y3 components).
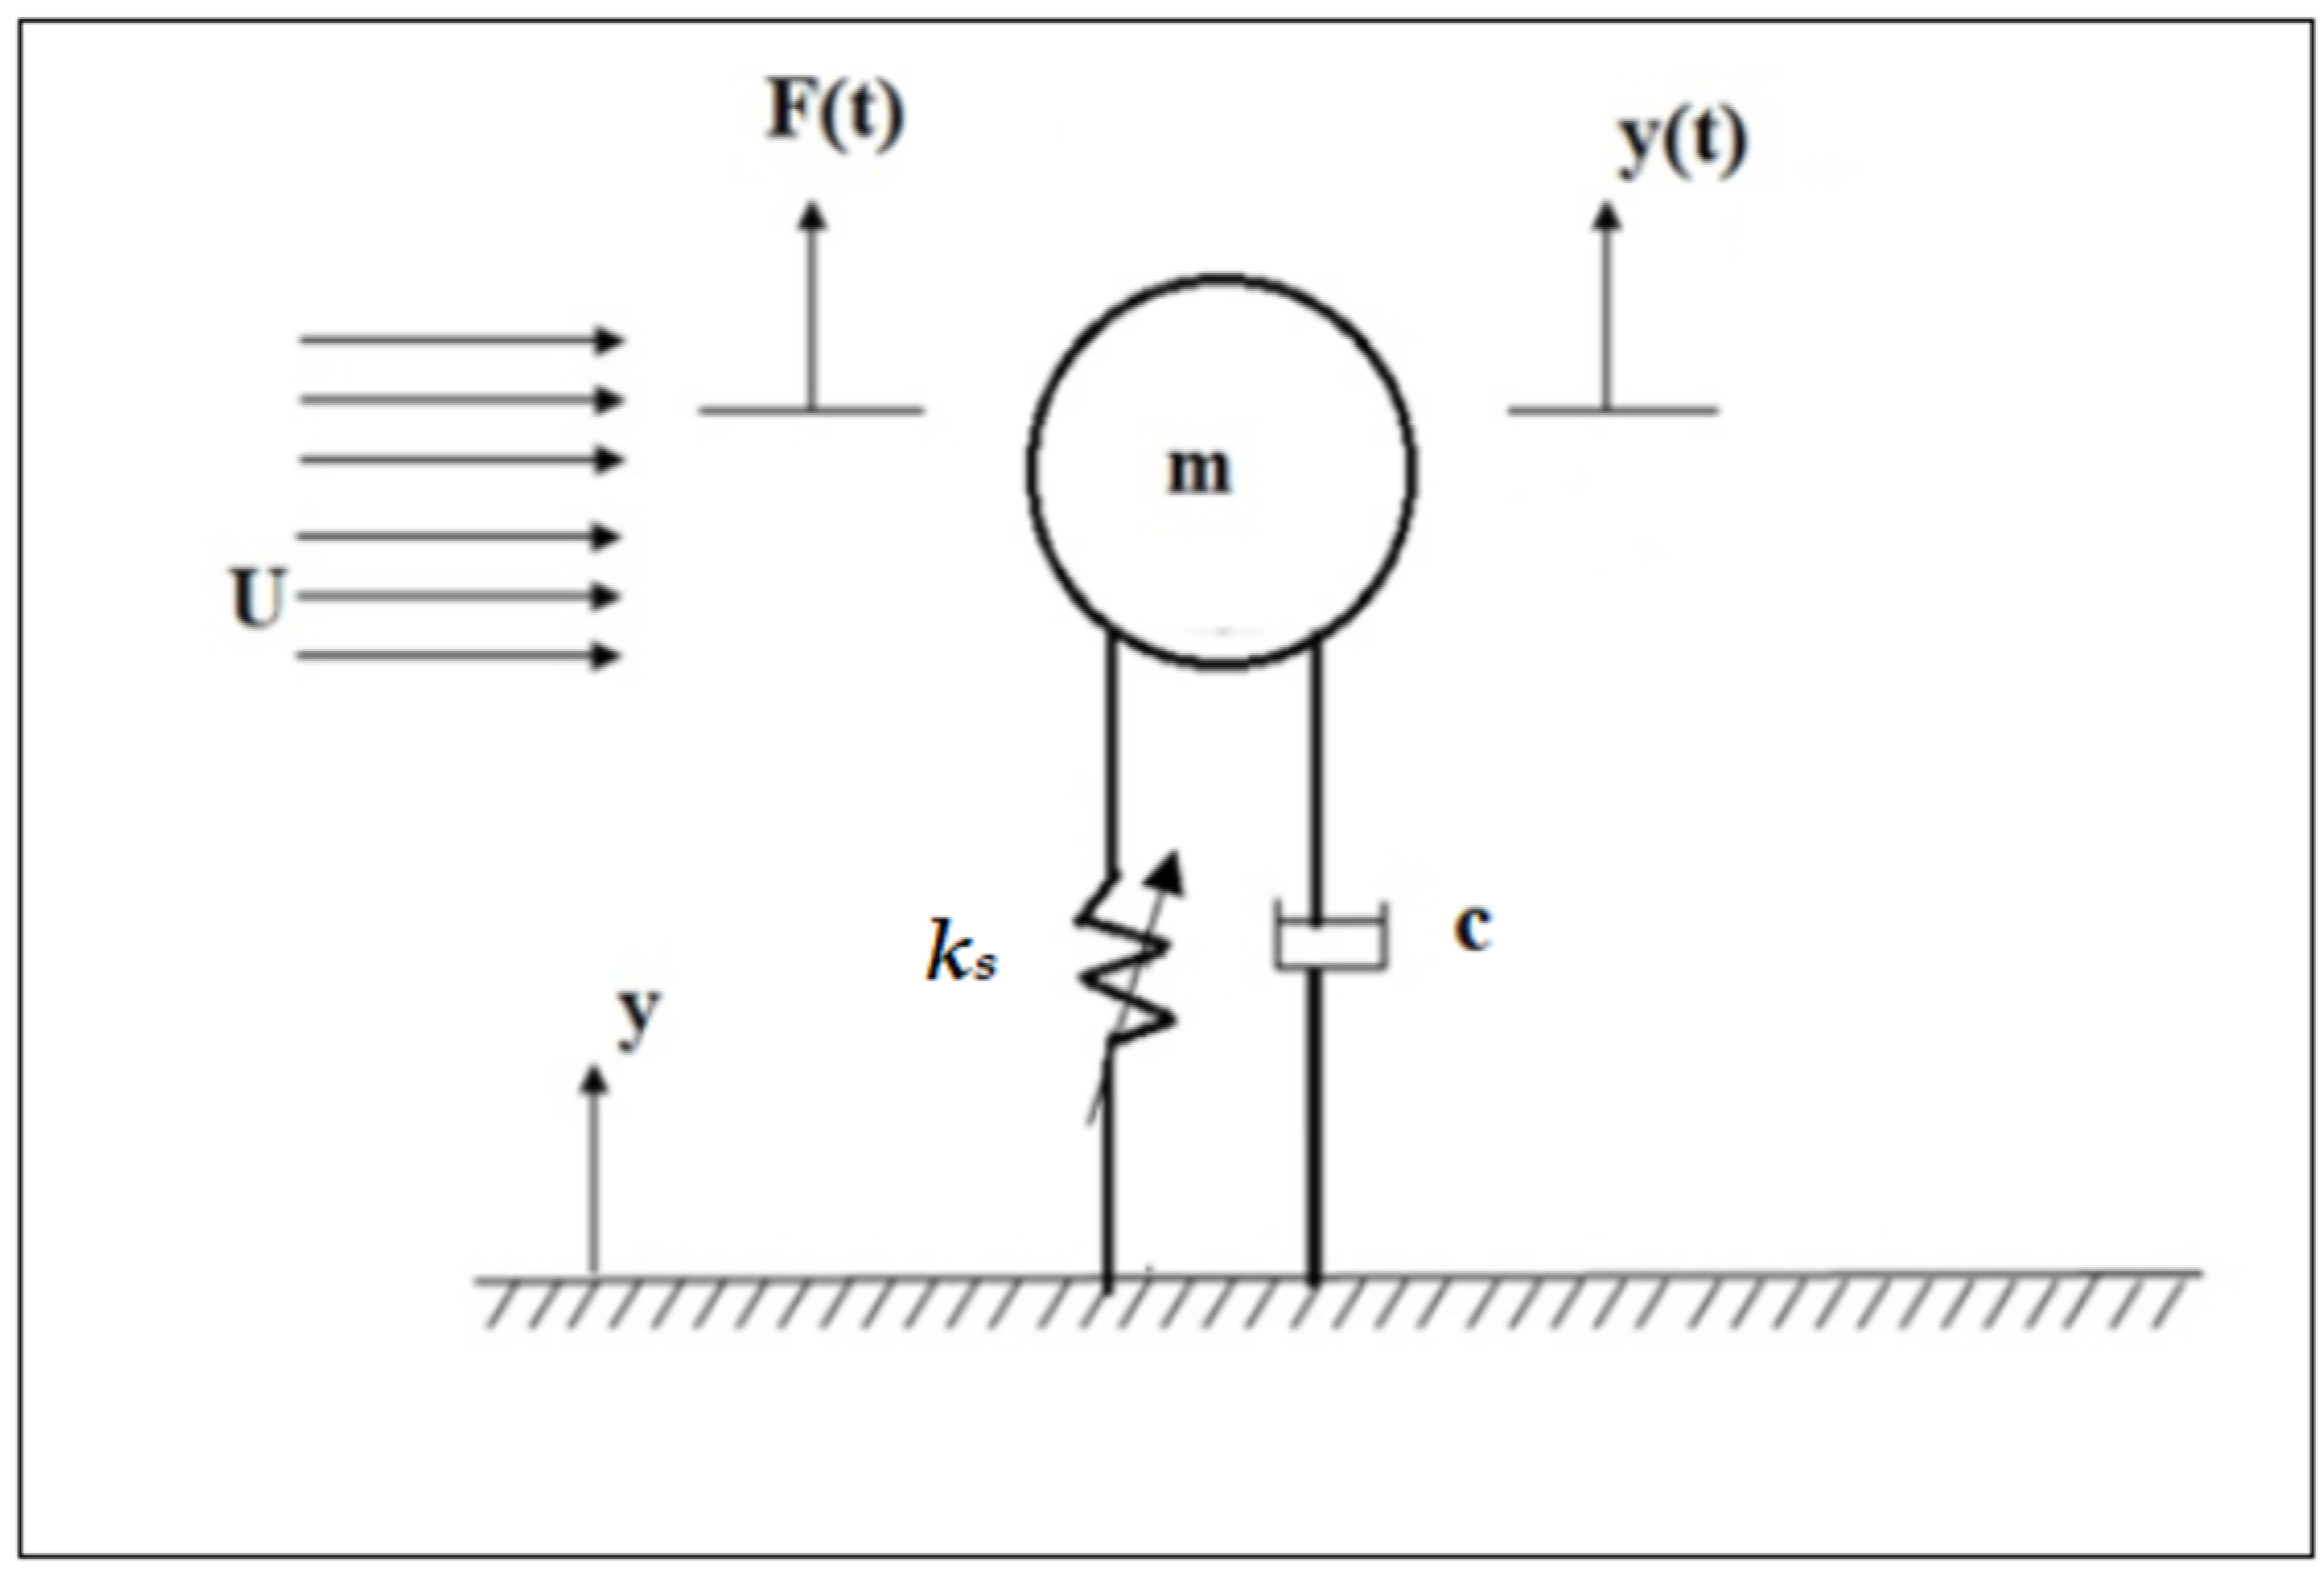
Figure 5 illustrates the schematic representation of an elastically supported 1DOF circular cylinder with a mass (
m) of 0.0078 kg, a linear spring constant (
k1) of 26 N/m, a cubic spring constant
k3 = 30,000 N/m and a damping coefficient (
c) of 0.0027 Ns/m. The length and diameter of the cylinder were 0.09 m and 0.06 m, respectively. In the diagram,
k1 symbolizes the effective linear stiffness while
c is the effective damping coefficient, including mechanical and electrical dampers (via a piezoelectric effect),
F is the lifting force and
U is the wind speed.
The numerical methodology employed in this study was consistent with the validated case described in the previous section. The simulations were carried out over a range of flow velocities, from 1 to 10 m/s, corresponding to Reynolds numbers between 4200 and 42,000. The grid independent mesh used for the present simulation, with a medium size, is shown in
Figure 6.
3. Results and Discussion
3.1. Amplitude Response and Response Regimes
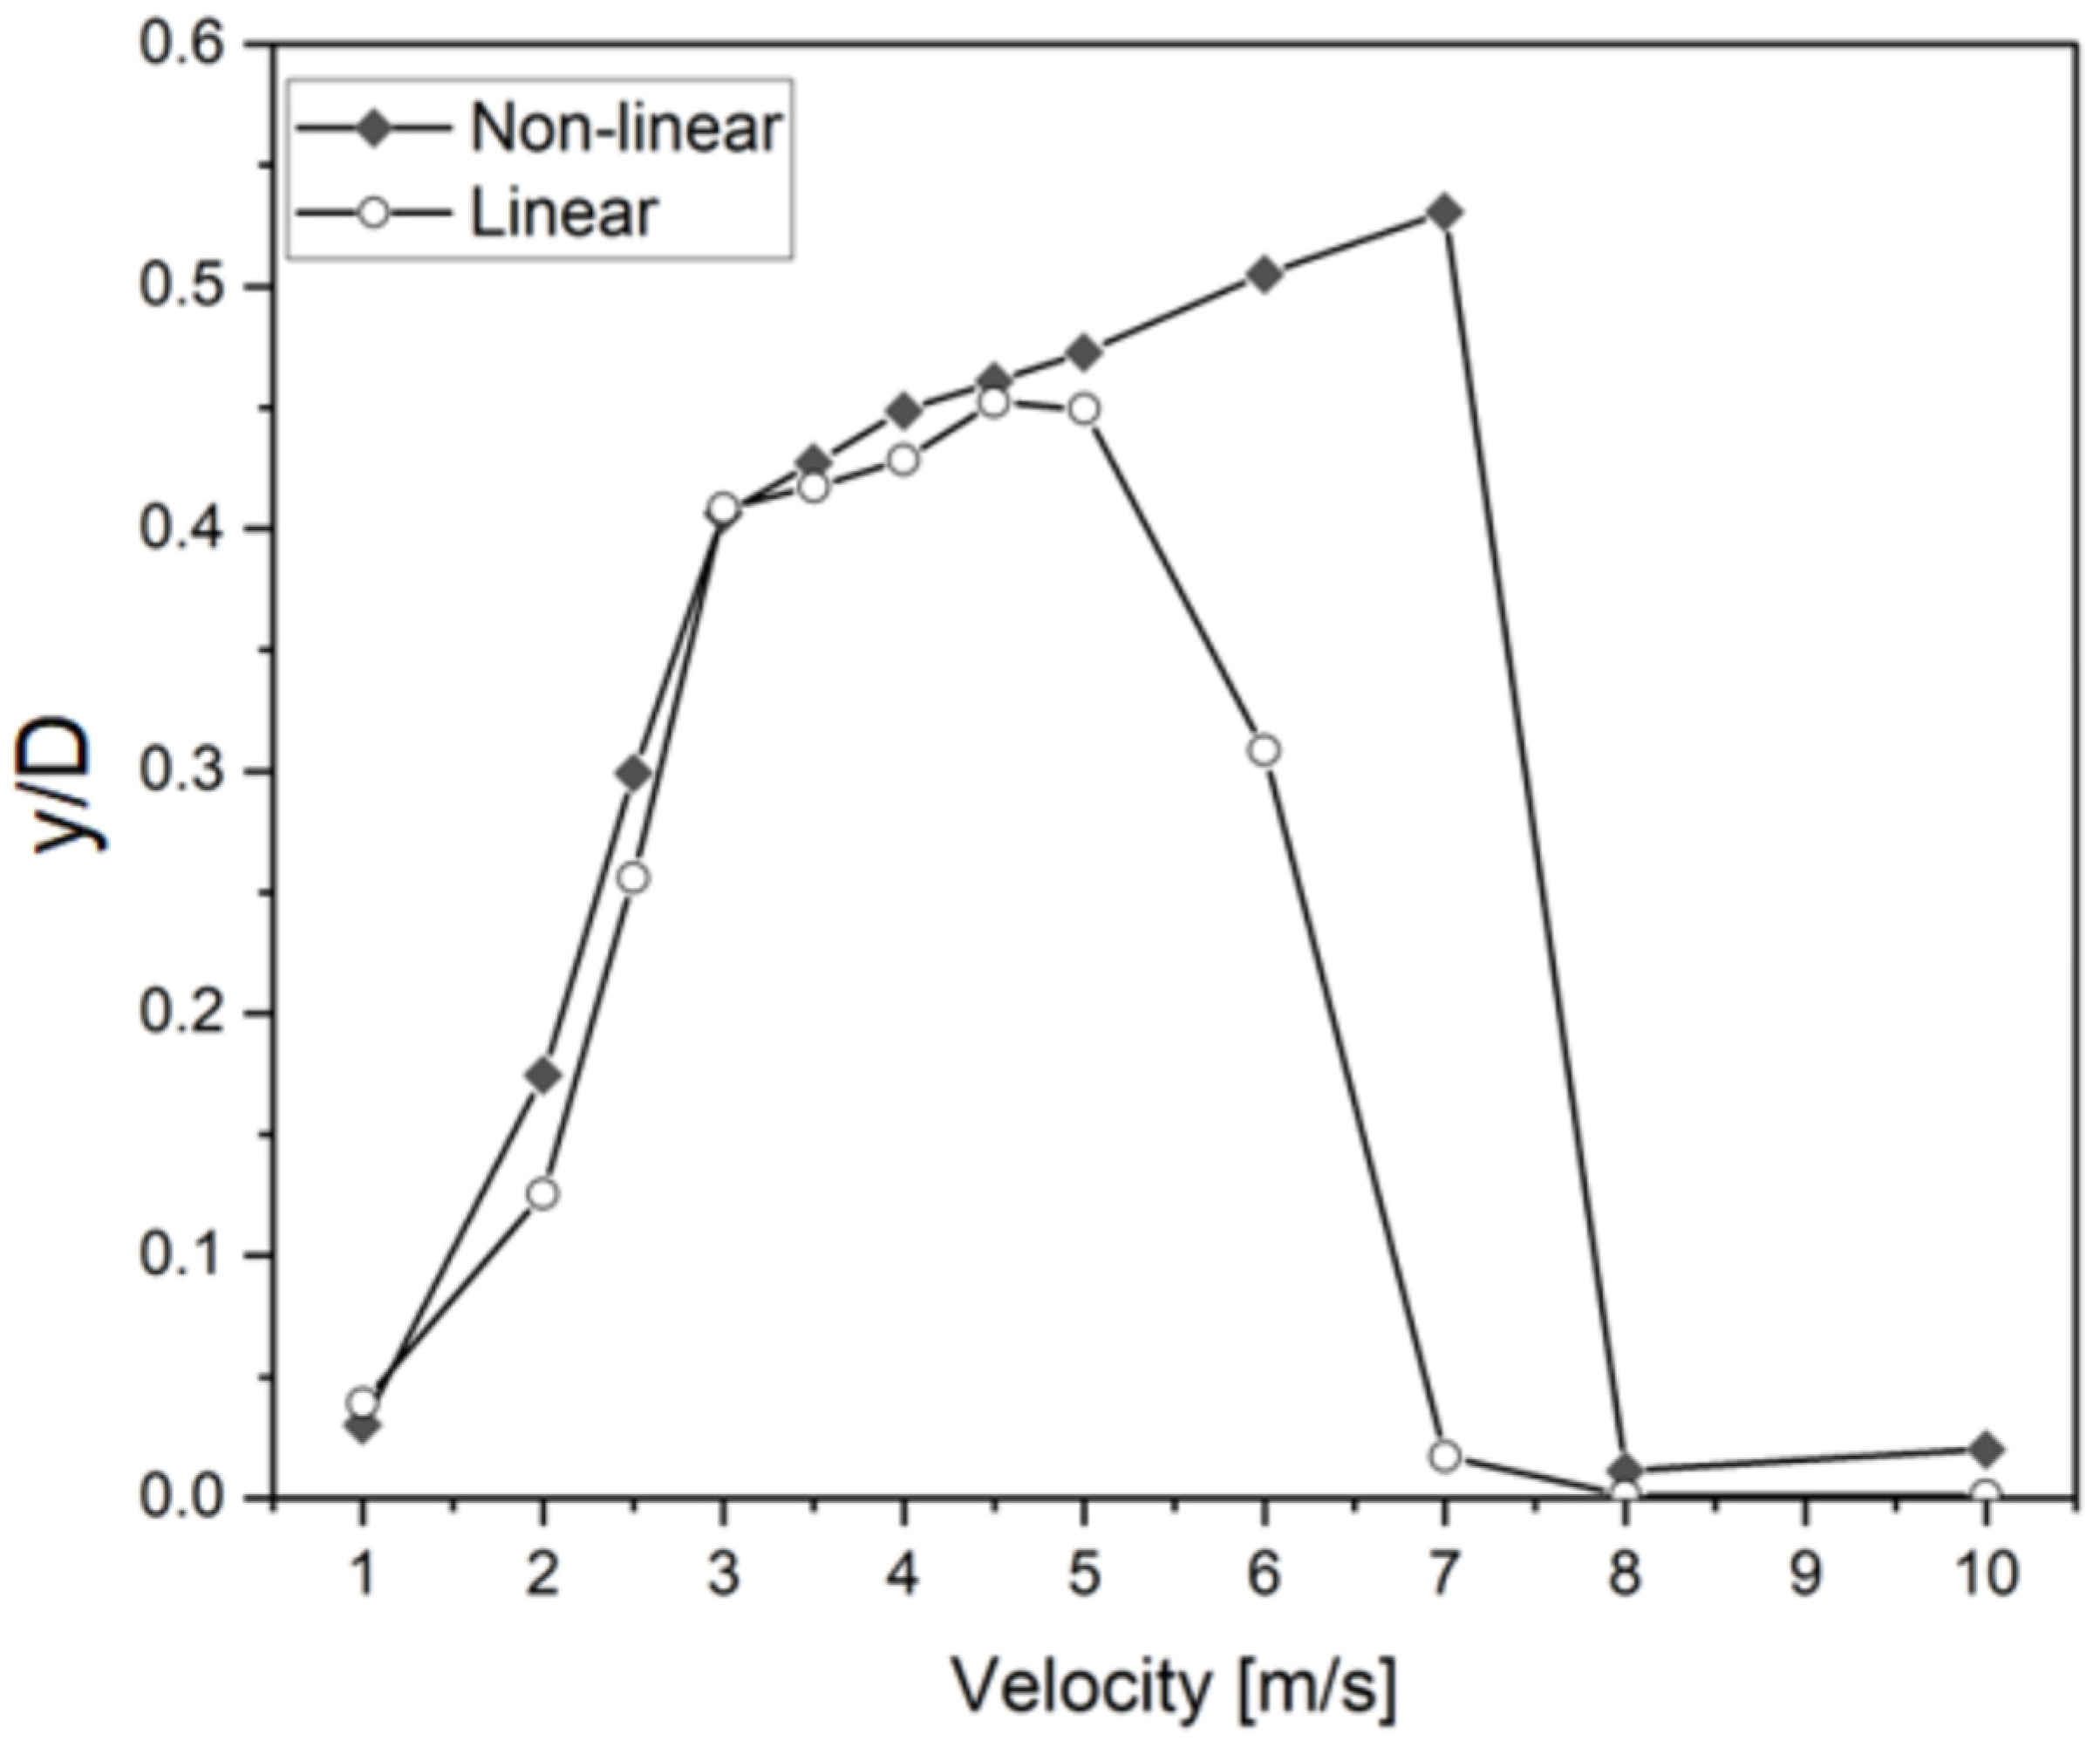
In the present study, we performed numerical investigations to compare the response amplitude of 1DOF VIV system with and without nonlinear spring by keeping the same structural properties. The study employed the simplest form of a nonlinear spring, which was characterized by a cubic position function. The strength of non-linearity was represented by k3. In the case of positive values of k3, the restoring force increased disproportionately as the spring was stretched, categorizing it as a hardening spring. Conversely, when k3 took on negative values, the restoring force decreased as the spring is stretched, classifying it as a softening spring. In the case of a cubic spring, the natural frequency was a function of vibration amplitude, unlike the constant value associated with a linear spring. In the present study, the comparative results are presented with respect to wind speed rather than reduced velocity or equivalent reduced velocity.
Figure 7 illustrates both the linear and nonlinear response amplitude achieved, with cubic term-springs at different wind speeds. For VIV with a cubic spring, the range of velocity widened, for which significantly larger amplitudes were observed. In the linear case, frequency synchronization was observed within the wind velocity range of 2.25 m/s to 5 m/s. The appearance of this region is due to nonlinear air–bluff body interaction. However, the response frequency was the same as the natural frequency for the linear spring mass oscillator. Conversely, in the case of cubic nonlinearity, frequency synchronization was detected across a broader wind velocity range, specifically from 2.75 m/s to 7 m/s. The maximum displacement amplitude was recorded as 27 mm for the linear spring and 31.8 mm for the nonlinear spring. It is evident from
Figure 6 that the nonlinear spring systems exhibited a significantly broader range of wind speeds at which they could vibrate compared to the linear spring system. In linear spring, the maximum displacement amplitude occurred when the wind speed was at 4.5 m/s (
Ur = 8.15). Beyond a wind speed of 5.5 m/s (
Ur = 10), displacement amplitude decreased gradually, indicating the presence of a desynchronization region. On the other hand, the addition of non-linearity steadily increased the vibration amplitude until the wind speed was 7 m/s (
Ur = 12.68), beyond which it abruptly decreased. This phenomenon was in contrast to the standard VIV system, where the vibration amplitude gradually diminishes as the cut-out speed is approached. In this case, the nonlinear spring induces a frequency broader-resonance (synchronization) region.
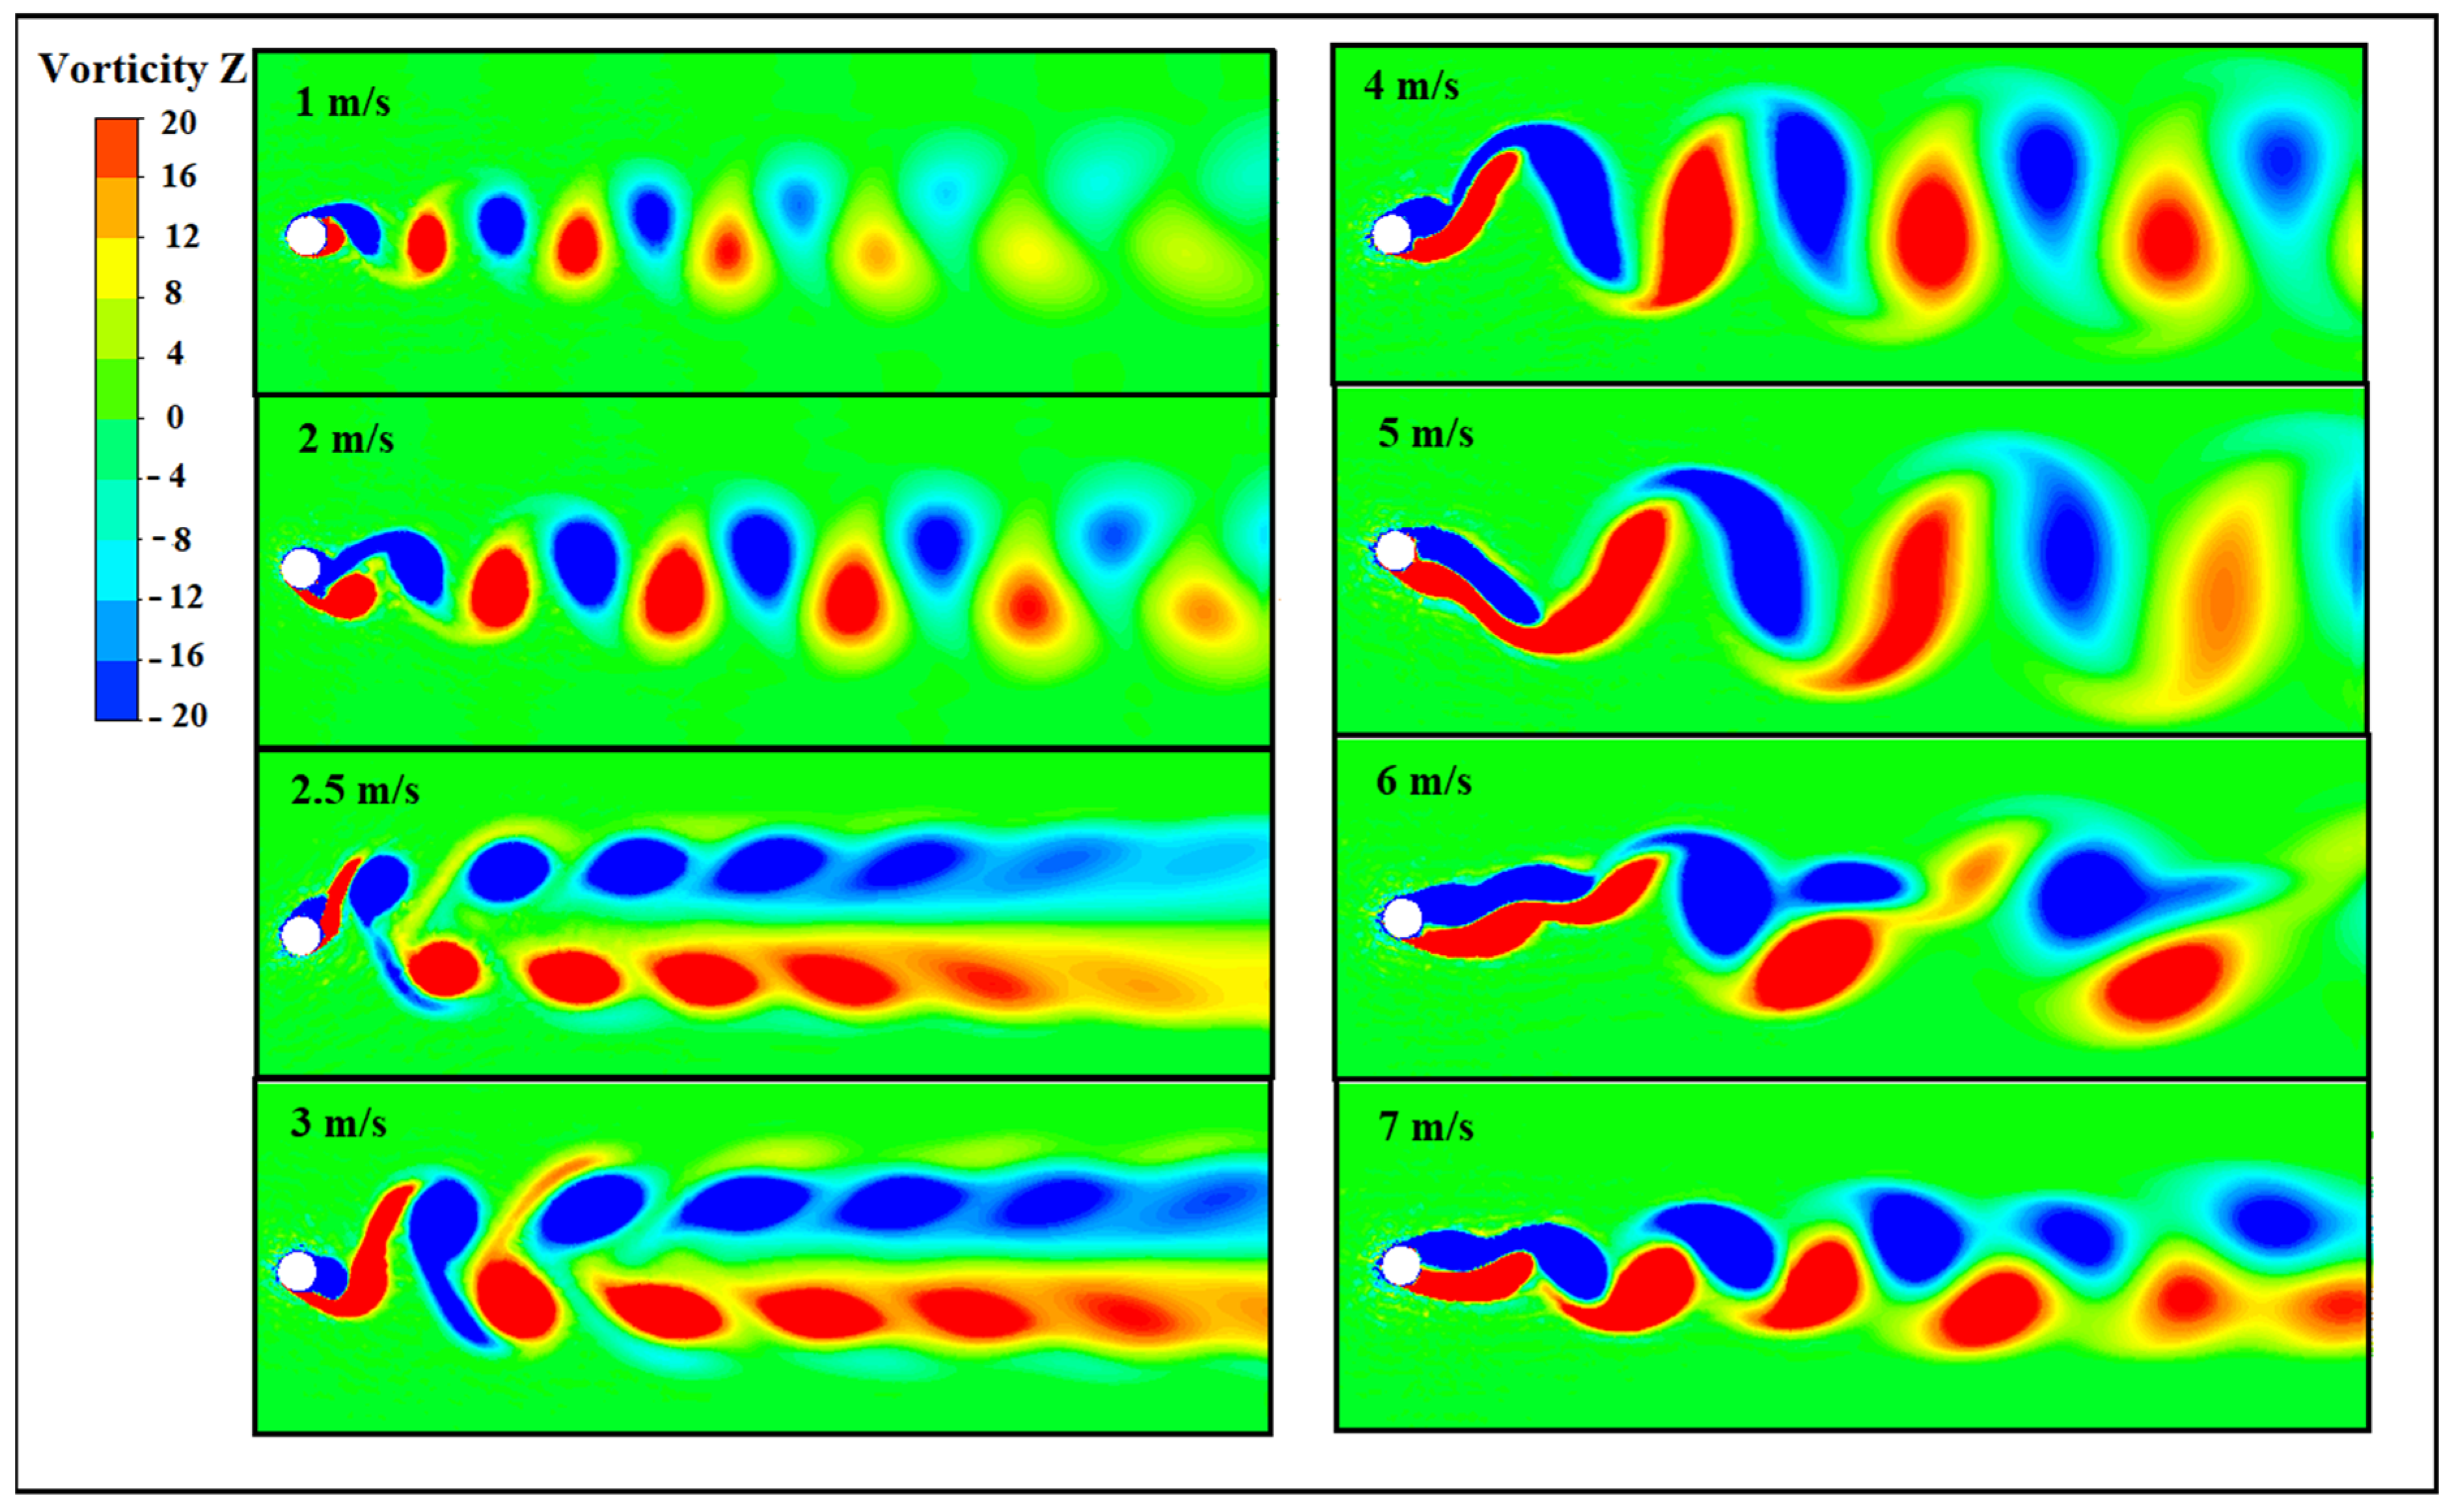
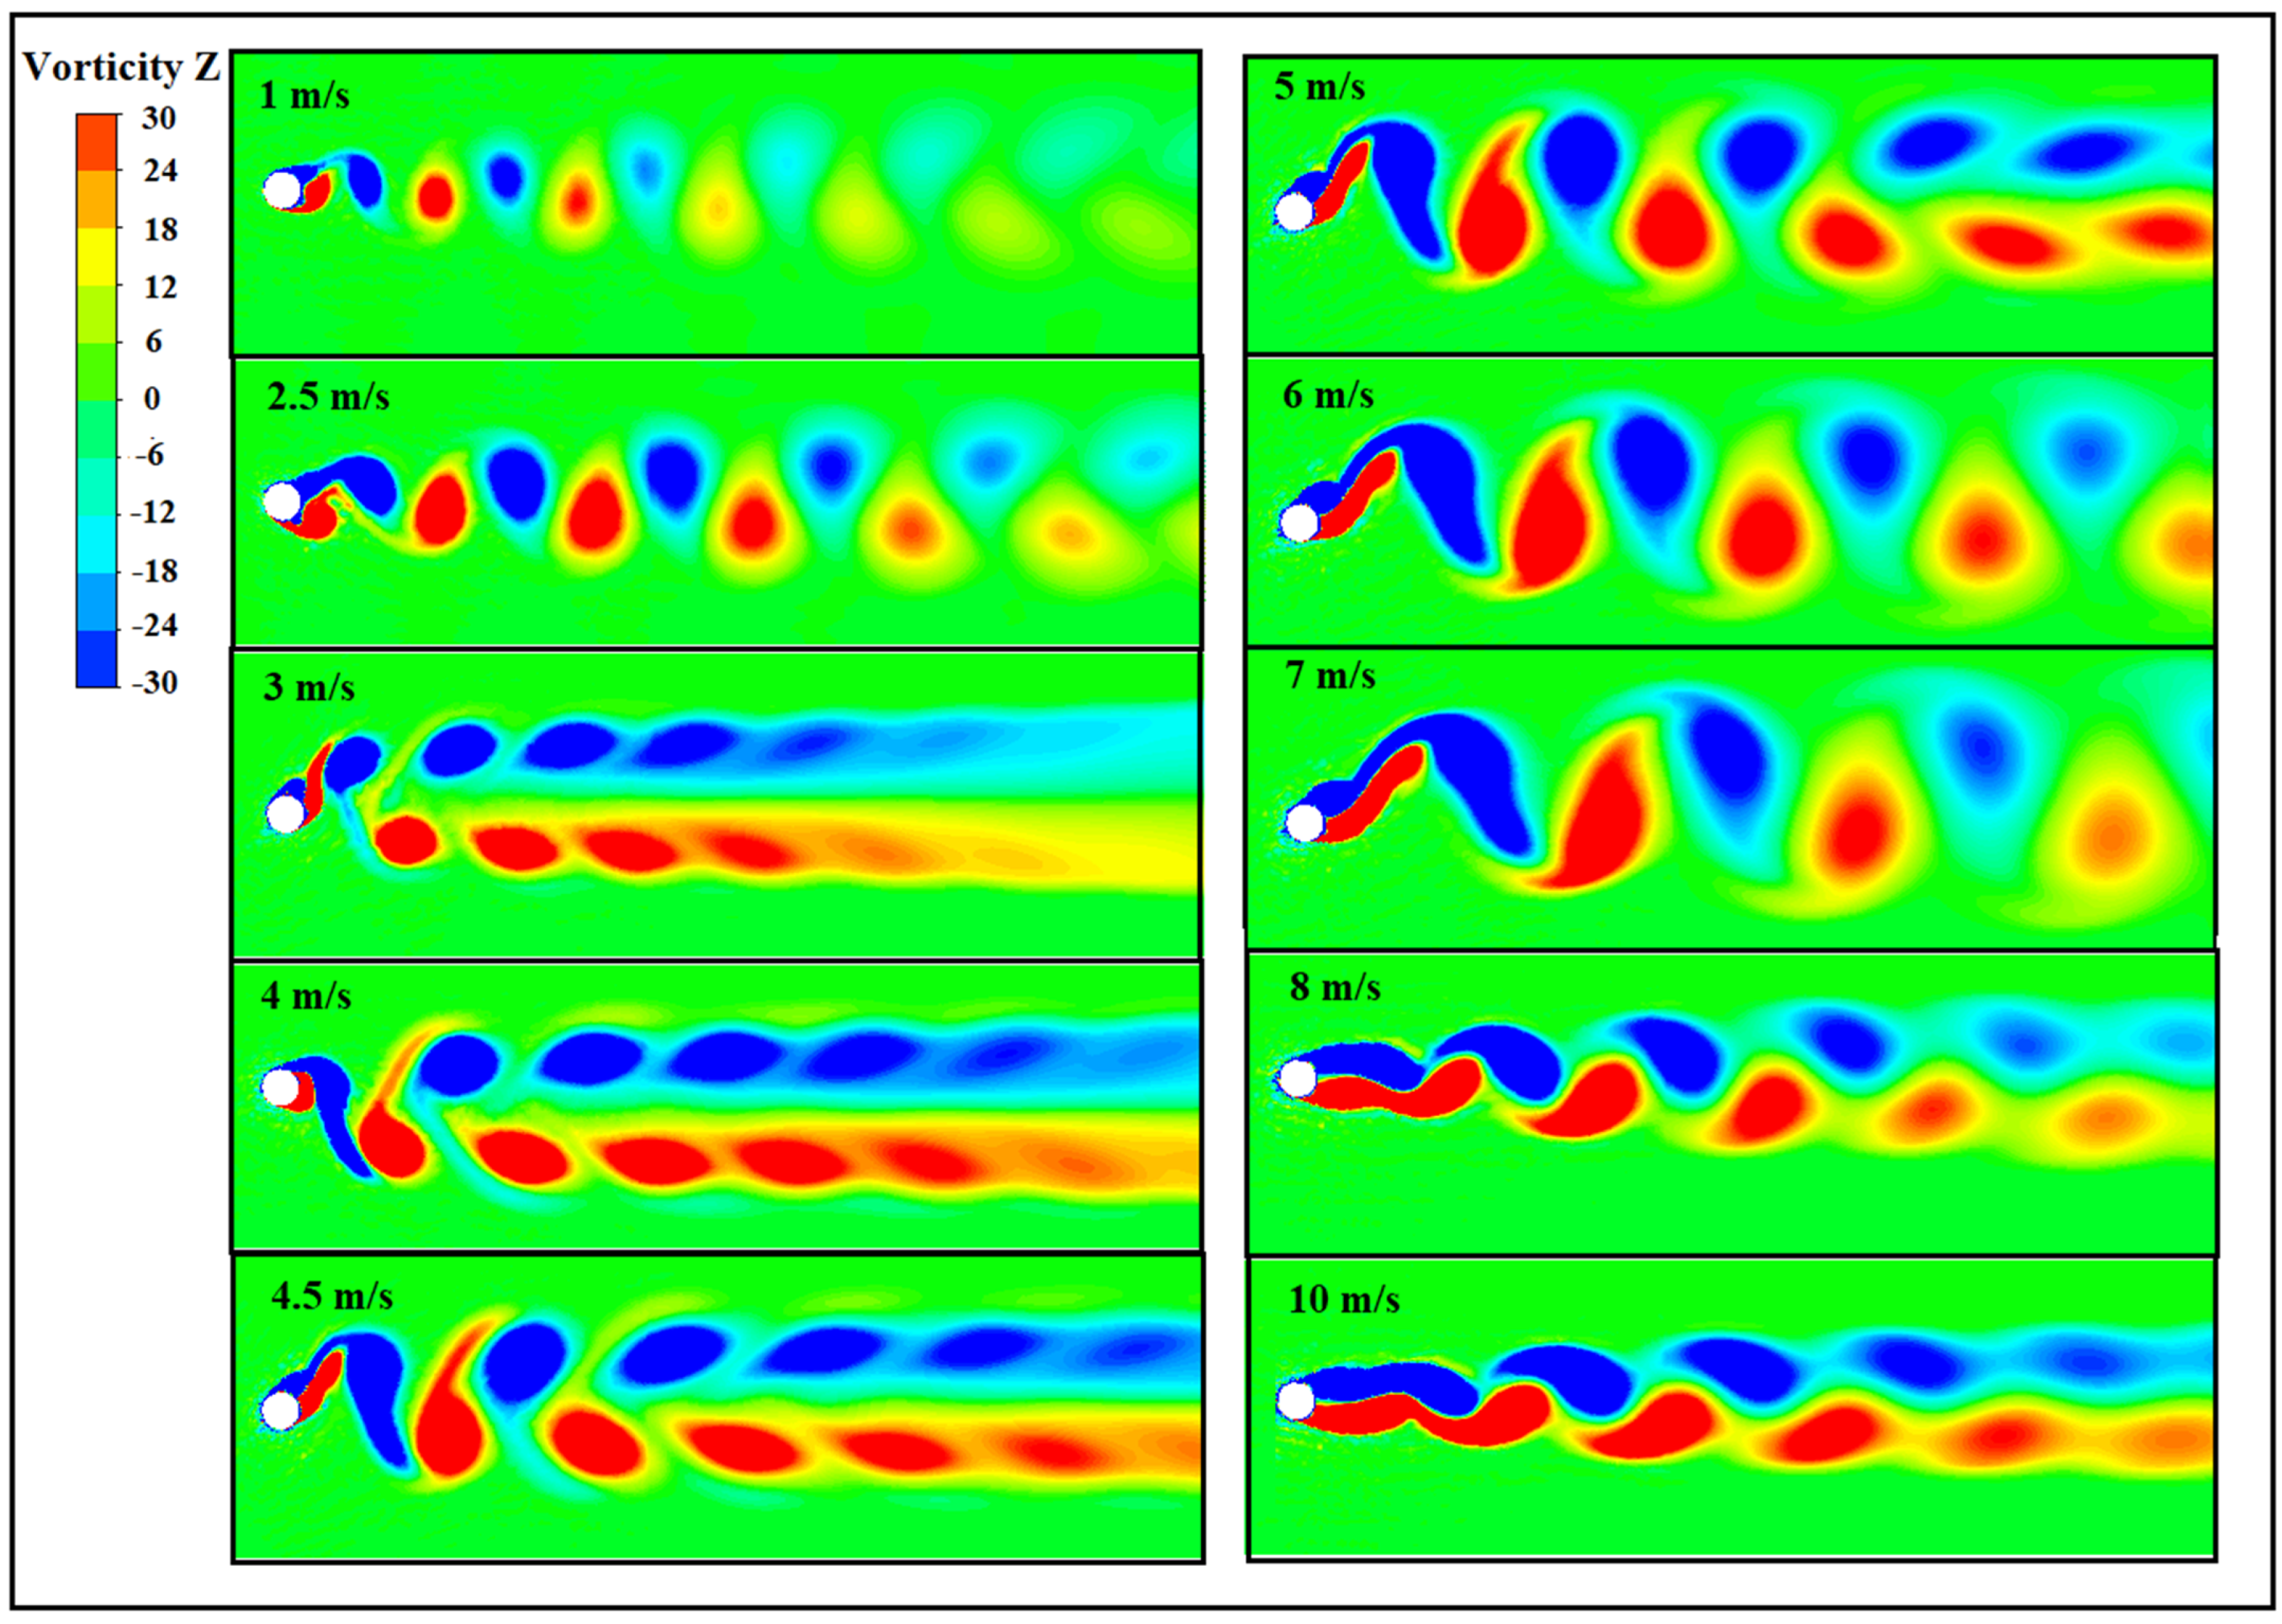
3.2. Vortex Shedding Patterns
The amplitude of oscillation and reduced velocity are the main source of vortex formation in the wake of the vibrating cylinder. The pattern of vortices formed behind the cylinder for linear and nonlinear cases for different wind velocities at time 20 s are depicted in
Figure 8 and
Figure 9, respectively. In both cases, a single-row vortex street (2S mode) is observed in the initial branch, characterized by a small response amplitude. As the cylinder moved downwards, it released vortices in a clockwise direction, and the opposite occurred when the cylinder moved upwards. It was observed that vortex shedding frequency was aligned with the natural frequency of the system when the wind velocity approached the upper branch, leading to a lock-in phenomenon. In both scenarios, the vortex shedding displayed a double-row configuration due to the increased vibration amplitude. It was observed that the presence of 2P mode in the flow resulted in the generation of high-amplitude oscillations.
In the linear case, the 2P mode was observed within a wind velocity range of 2.25 m/s to 5 m/s, while in the case of the nonlinear cubic spring, the 2P mode was observed within a wind velocity range of 2.75 m/s to 7 m/s. Further increasing the wind velocity to the desynchronized region caused a decrease in vibration amplitude, resulting in the narrowing of the wake behind the cylinder into a single-row configuration (2S mode) for both cases, as depicted in
Figure 8 and
Figure 9. In the cubic nonlinear spring case, at a wind velocity of 8 m/s, falling within the lower branch, the second vortex appeared significantly weaker in its position and shed rapidly. A similar occurrence was noted in the linear case when the wind speed surpassed 5 m/s.
In the desynchronized region, under the presence of resonance, the oscillation intensified gradually, resulting in the merging of vortices with the same sign and leading to a disordered wake pattern. This disorderliness in the wake resulted in a decrease in the lift force, causing a reduction in the oscillation amplitude. As the vibration amplitude diminished, the wake returned to its regular state, and the cycle of growth–decay recommenced.
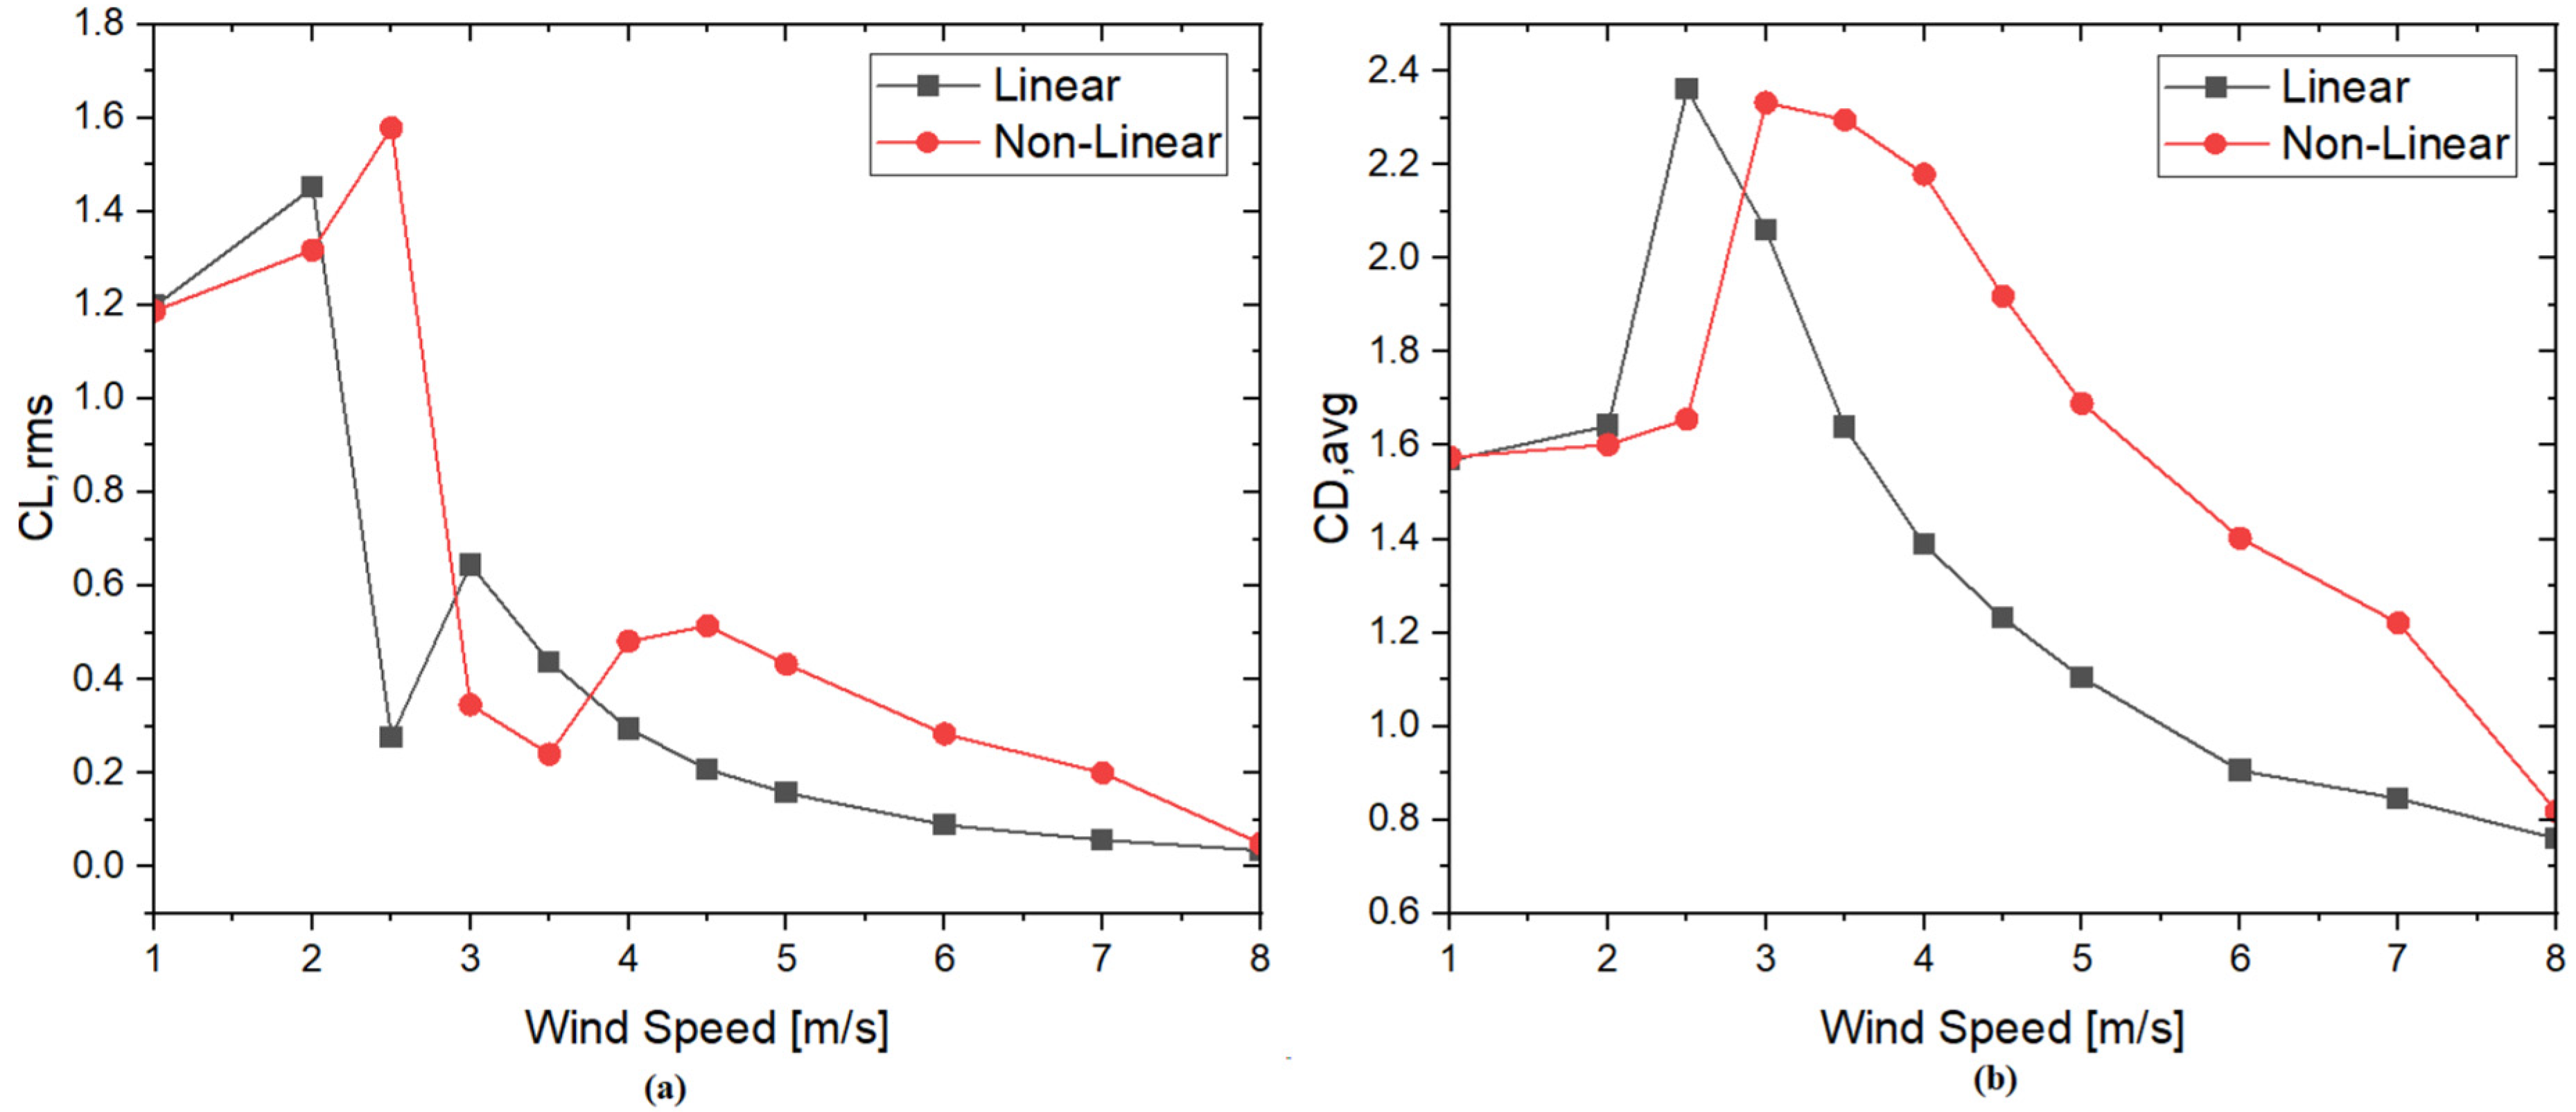
3.3. Effects on Force Coefficients
In the frequency synchronization phenomenon, the vibrating cylinder energizes parameters such as the coefficient of lift, coefficient of drag and amplitude. The lift coefficient exhibited a decline from its maximum to minimum value at a wind speed of 2.25 m/s (Ur = 4) in the linear case while in the cubic nonlinear case, this decline occurred at 2.75 m/s. It was noted that the lift coefficient was minimum at the starting of lock-in for both the cases.
Subsequently, it showed a consistent rise in value up to the upper branch. In the initial branch, the maximum root-mean-square (RMS) value of the lift coefficient was 1.451 for the linear case and 1.673 for the cubic nonlinear case. It was observed that there was a slight increment during desynchronization; as the wind velocity further increased, the lift coefficient began to decrease once again. Similar to amplitude response, the RMS lift coefficient moved towards a higher wind speed range when the VIV system operated with a nonlinear spring system. This phenomenon is clearly shown in the root-mean-square values of CL against the wind speeds (
Figure 10a). The average values of the drag coefficient obtained for both cases were in the same trend, as shown in
Figure 10b.
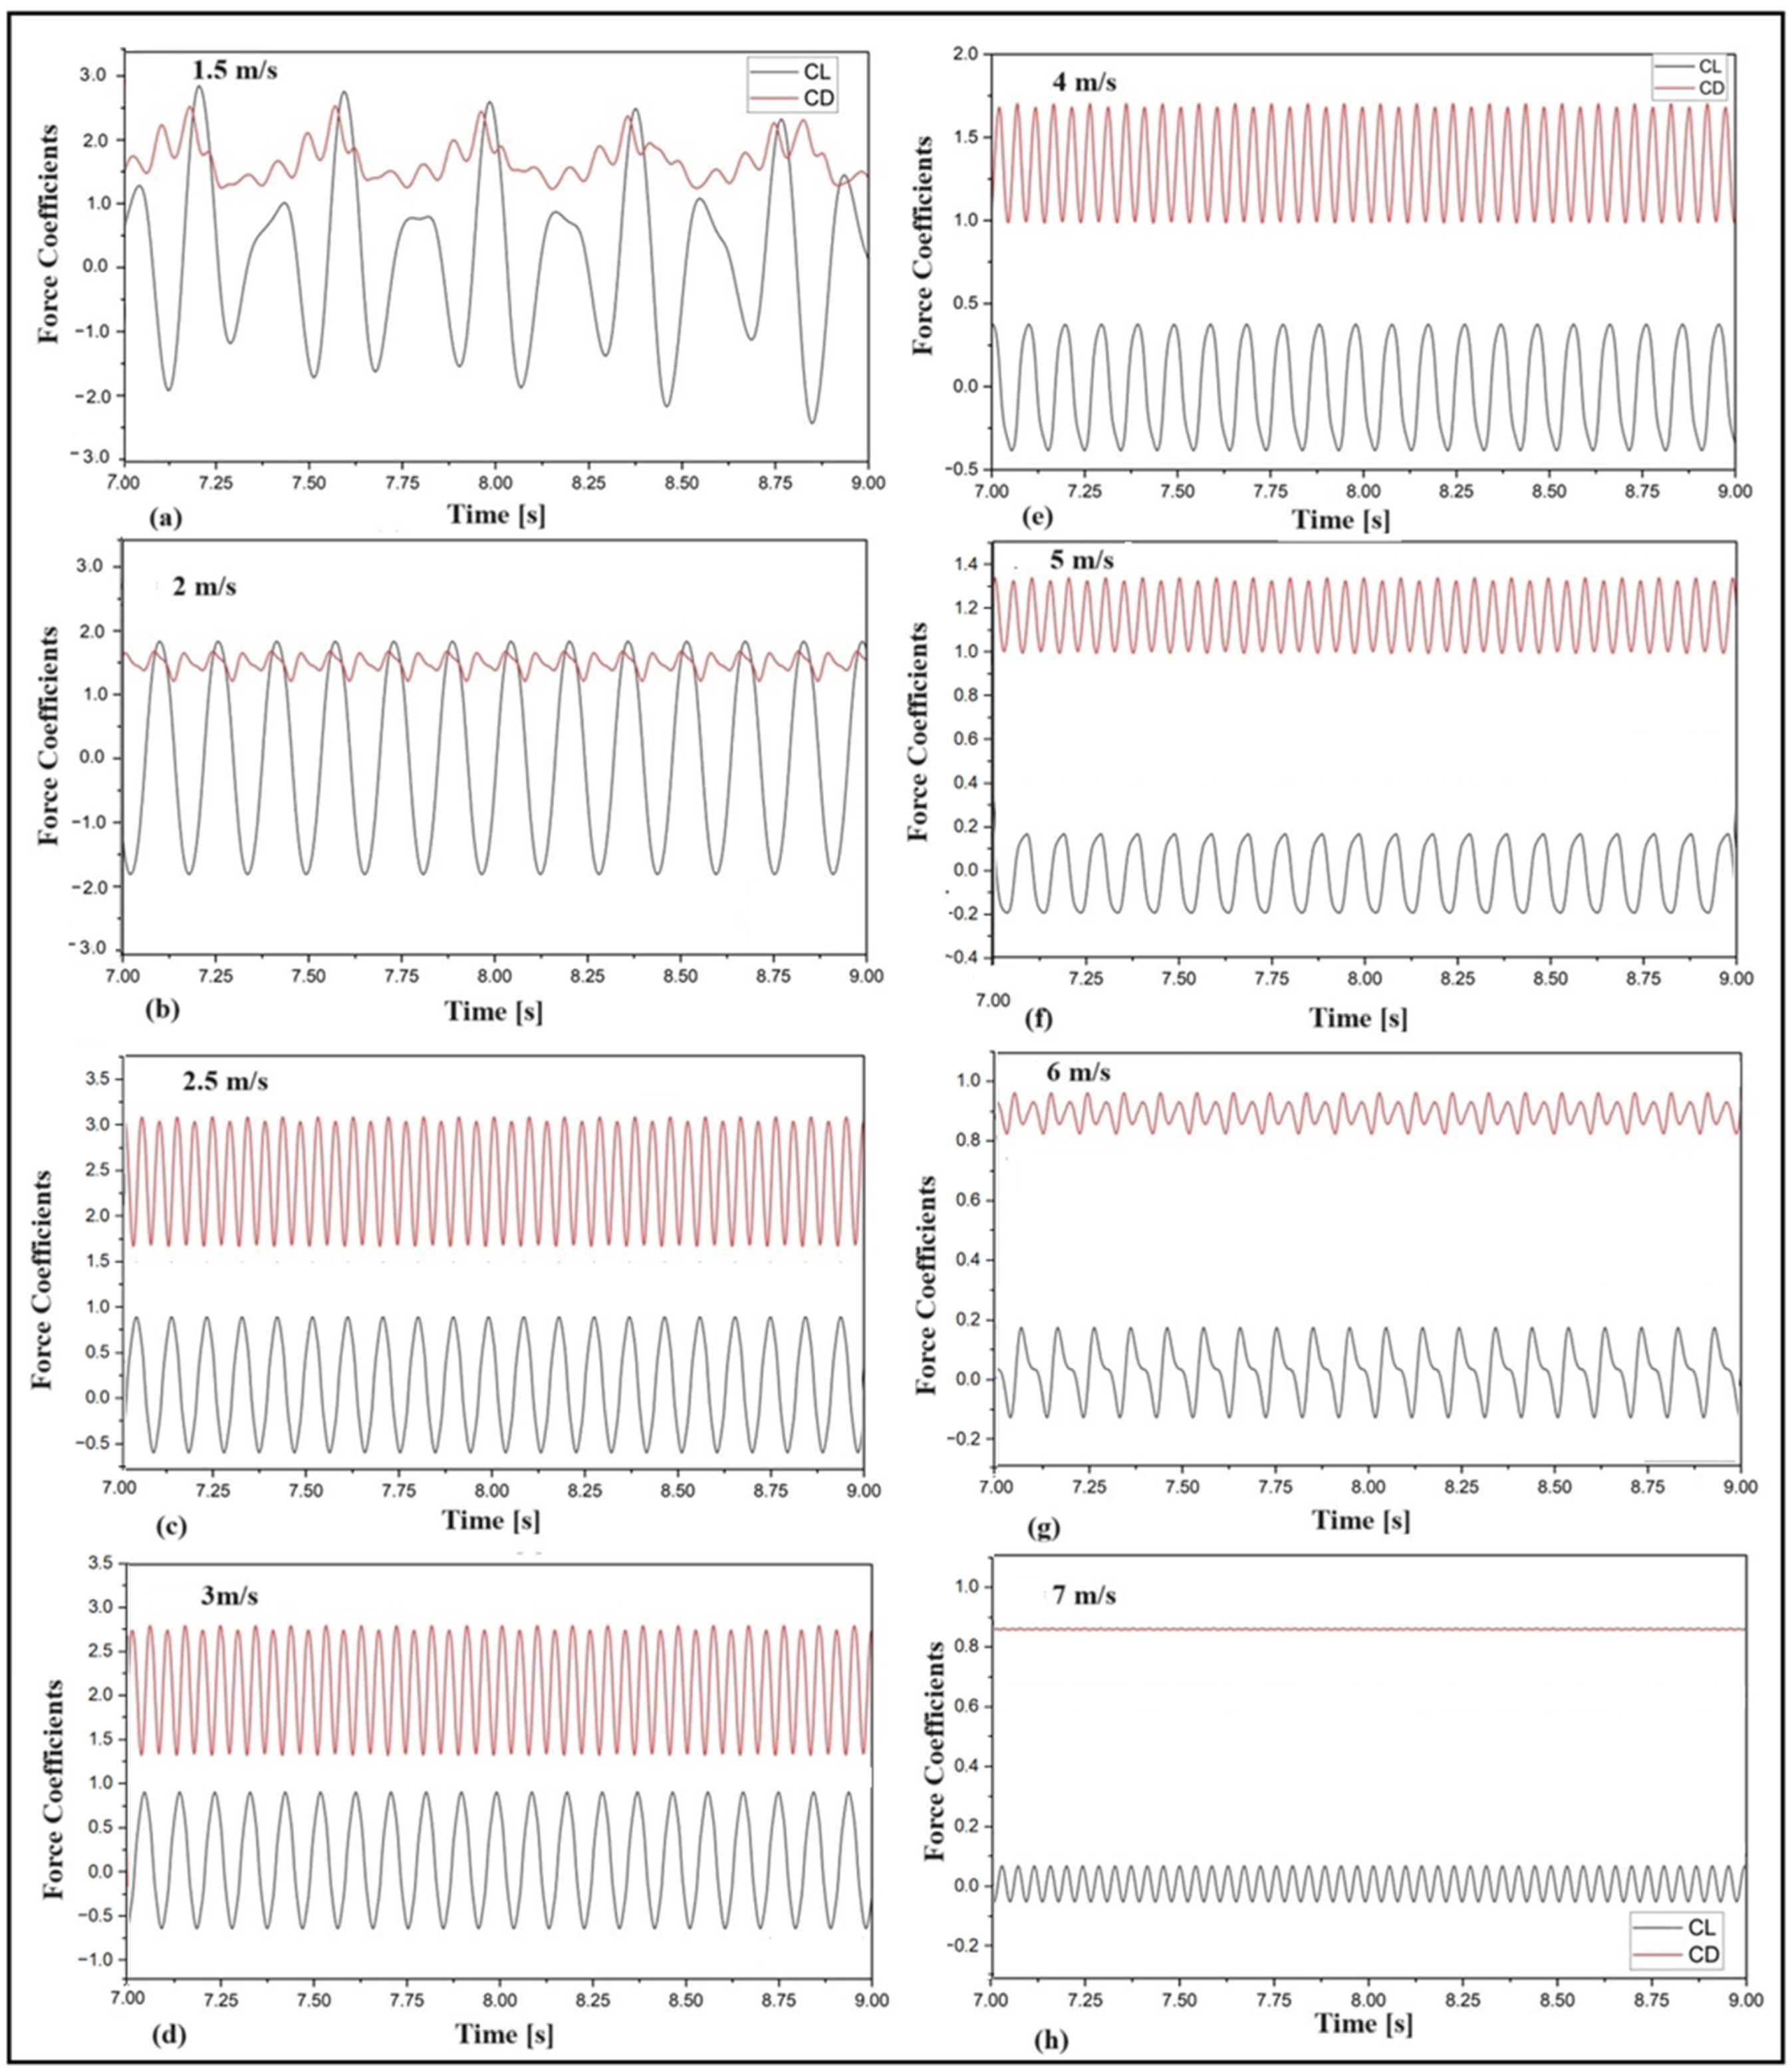
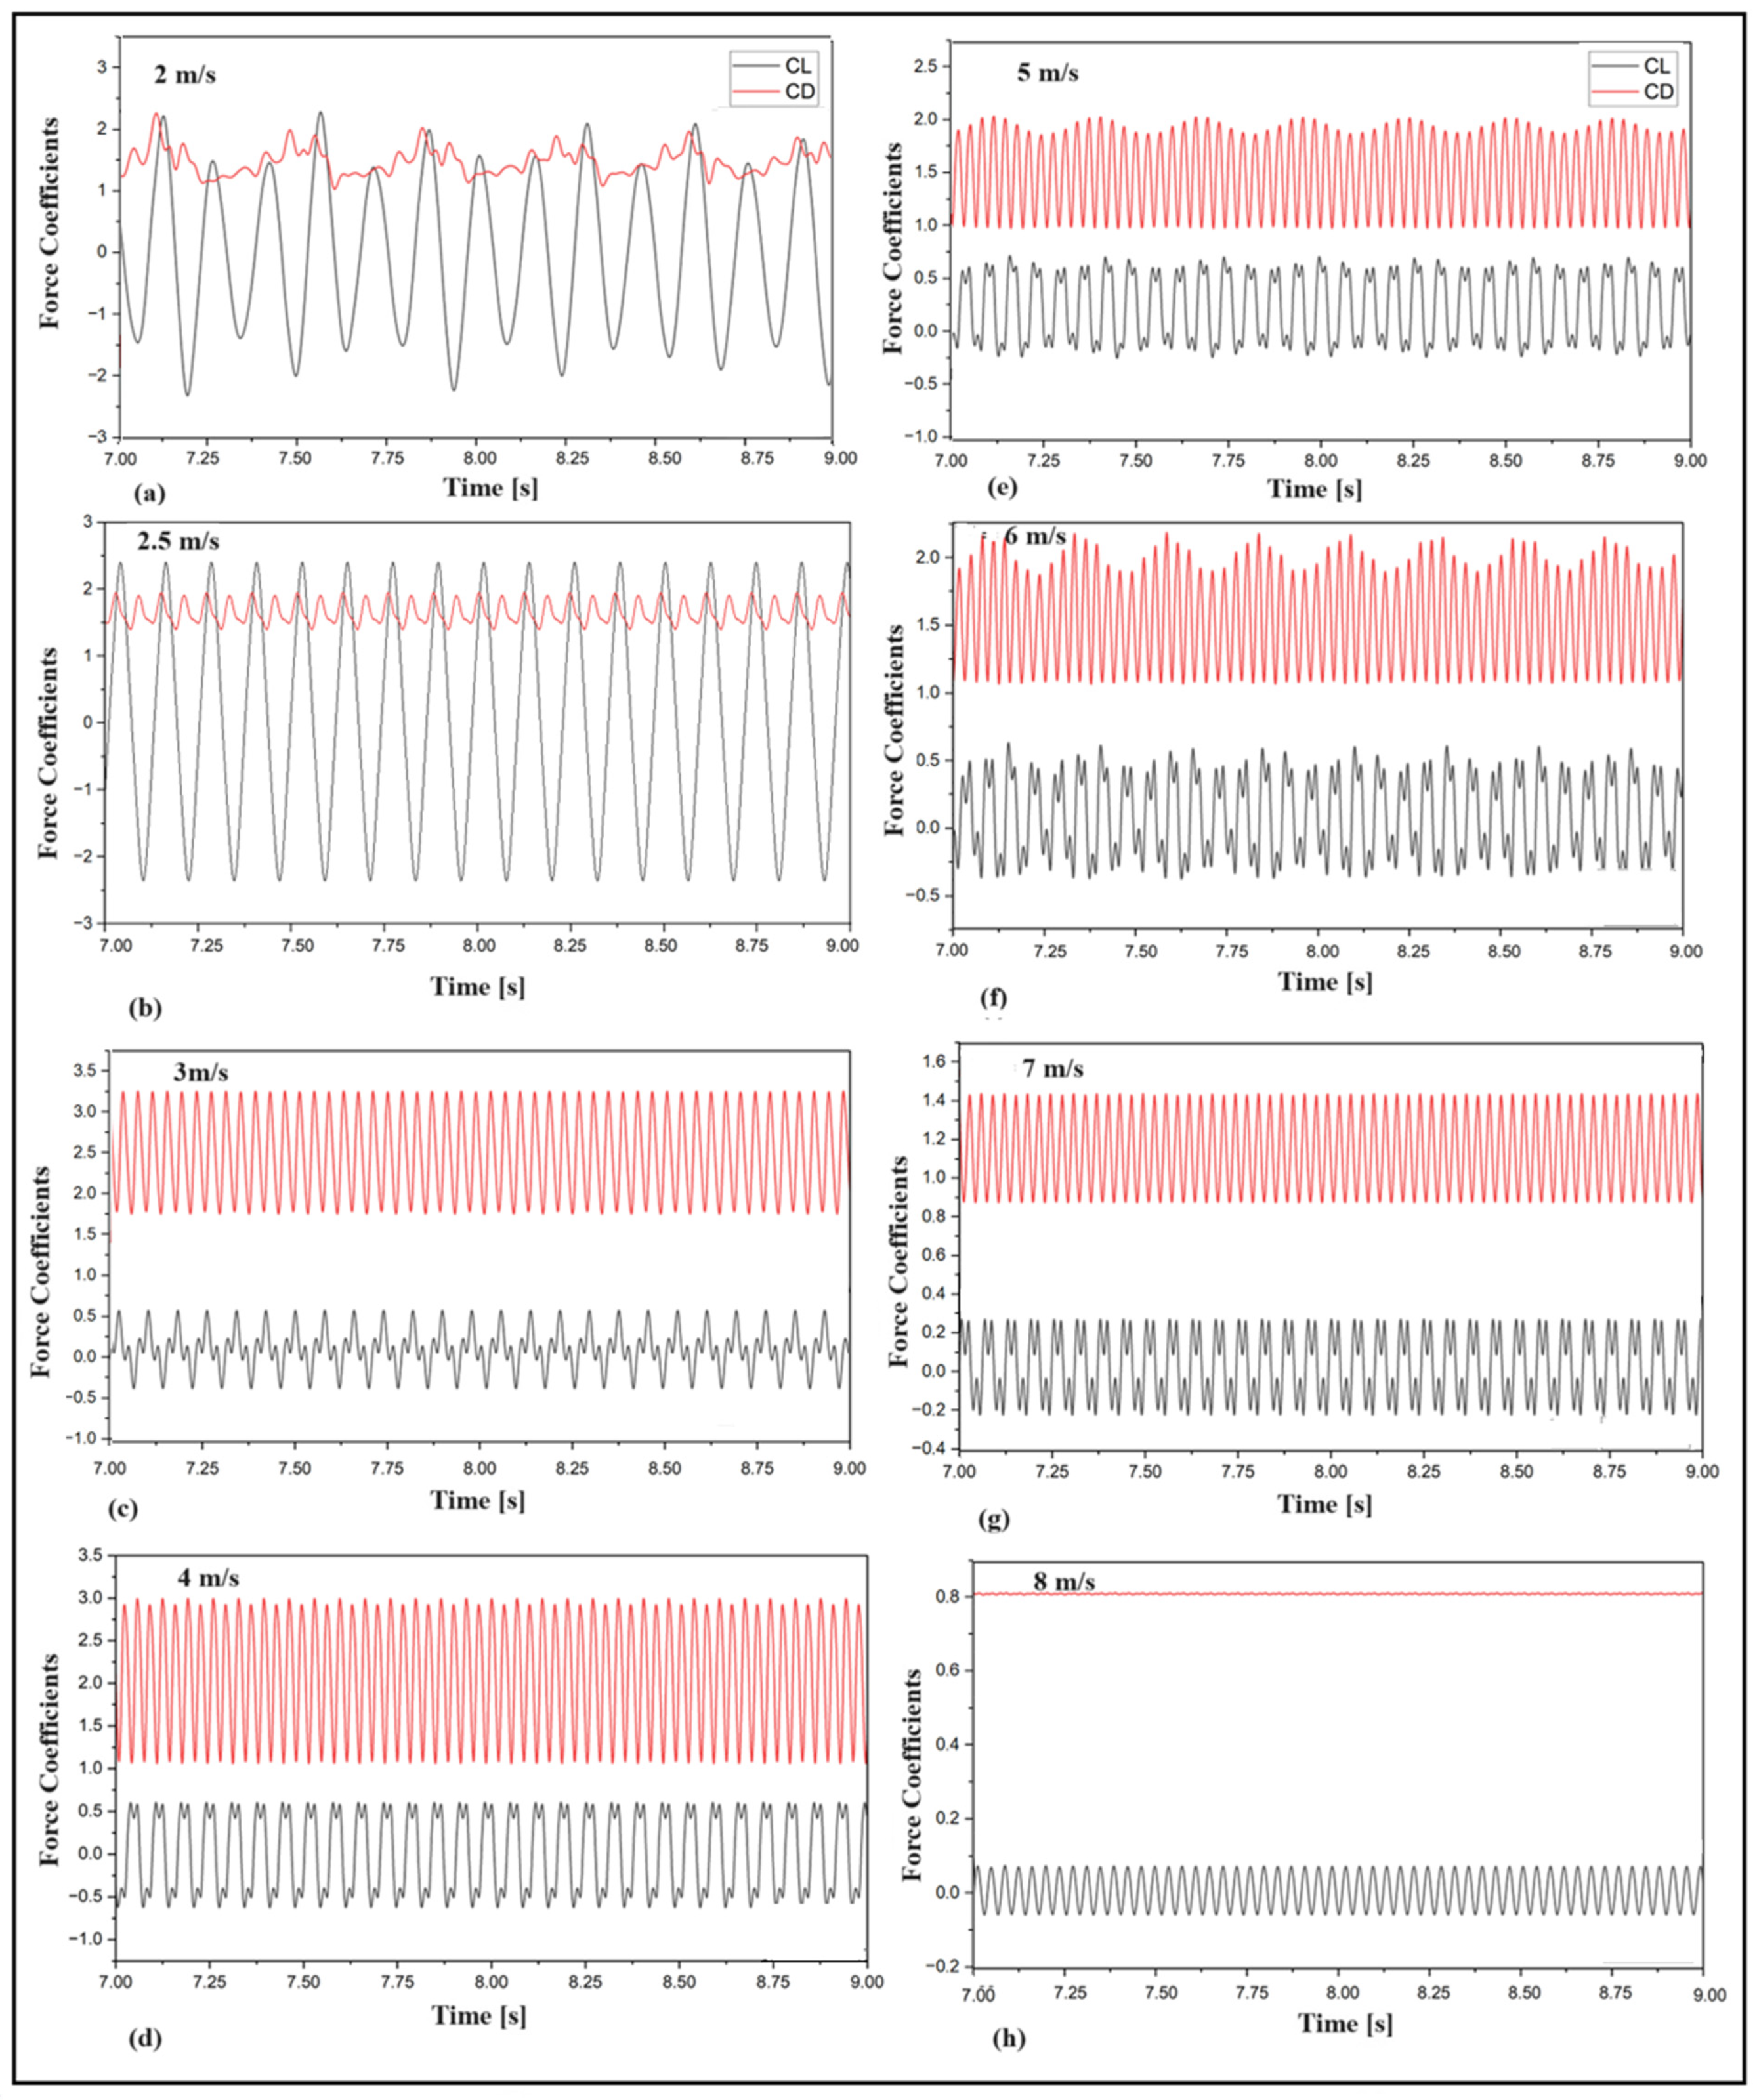
Figure 11 and
Figure 12 depict the time histories of the lift and drag coefficients recorded at various wind speeds. As demonstrated in the figures, the beating phenomenon observed in the initial branch was effectively captured for both cases. This phenomenon is depicted in
Figure 11a,b for the linear system (velocities below 2.25 m/s) and in
Figure 12a,b for the nonlinear system (velocities below 2.75 m/s).
The lock-in region was characterized by wind velocities ranging from 2.25 m/s to 5 m/s in the linear case and from 2.75 m/s to 7 m/s in the nonlinear case, respectively. Within this range, resonance occurred with a continuous increase in the drag coefficients due to the presence of high-intensity turbulence eddies, as shown in
Figure 11c–f and
Figure 12c–g. Within the lock-in wind speed range, there was an initial increase in the lift coefficient followed by a subsequent decrease as the wind speed continued to rise. Desynchronization can be clearly observed in
Figure 11g,h and
Figure 12h.
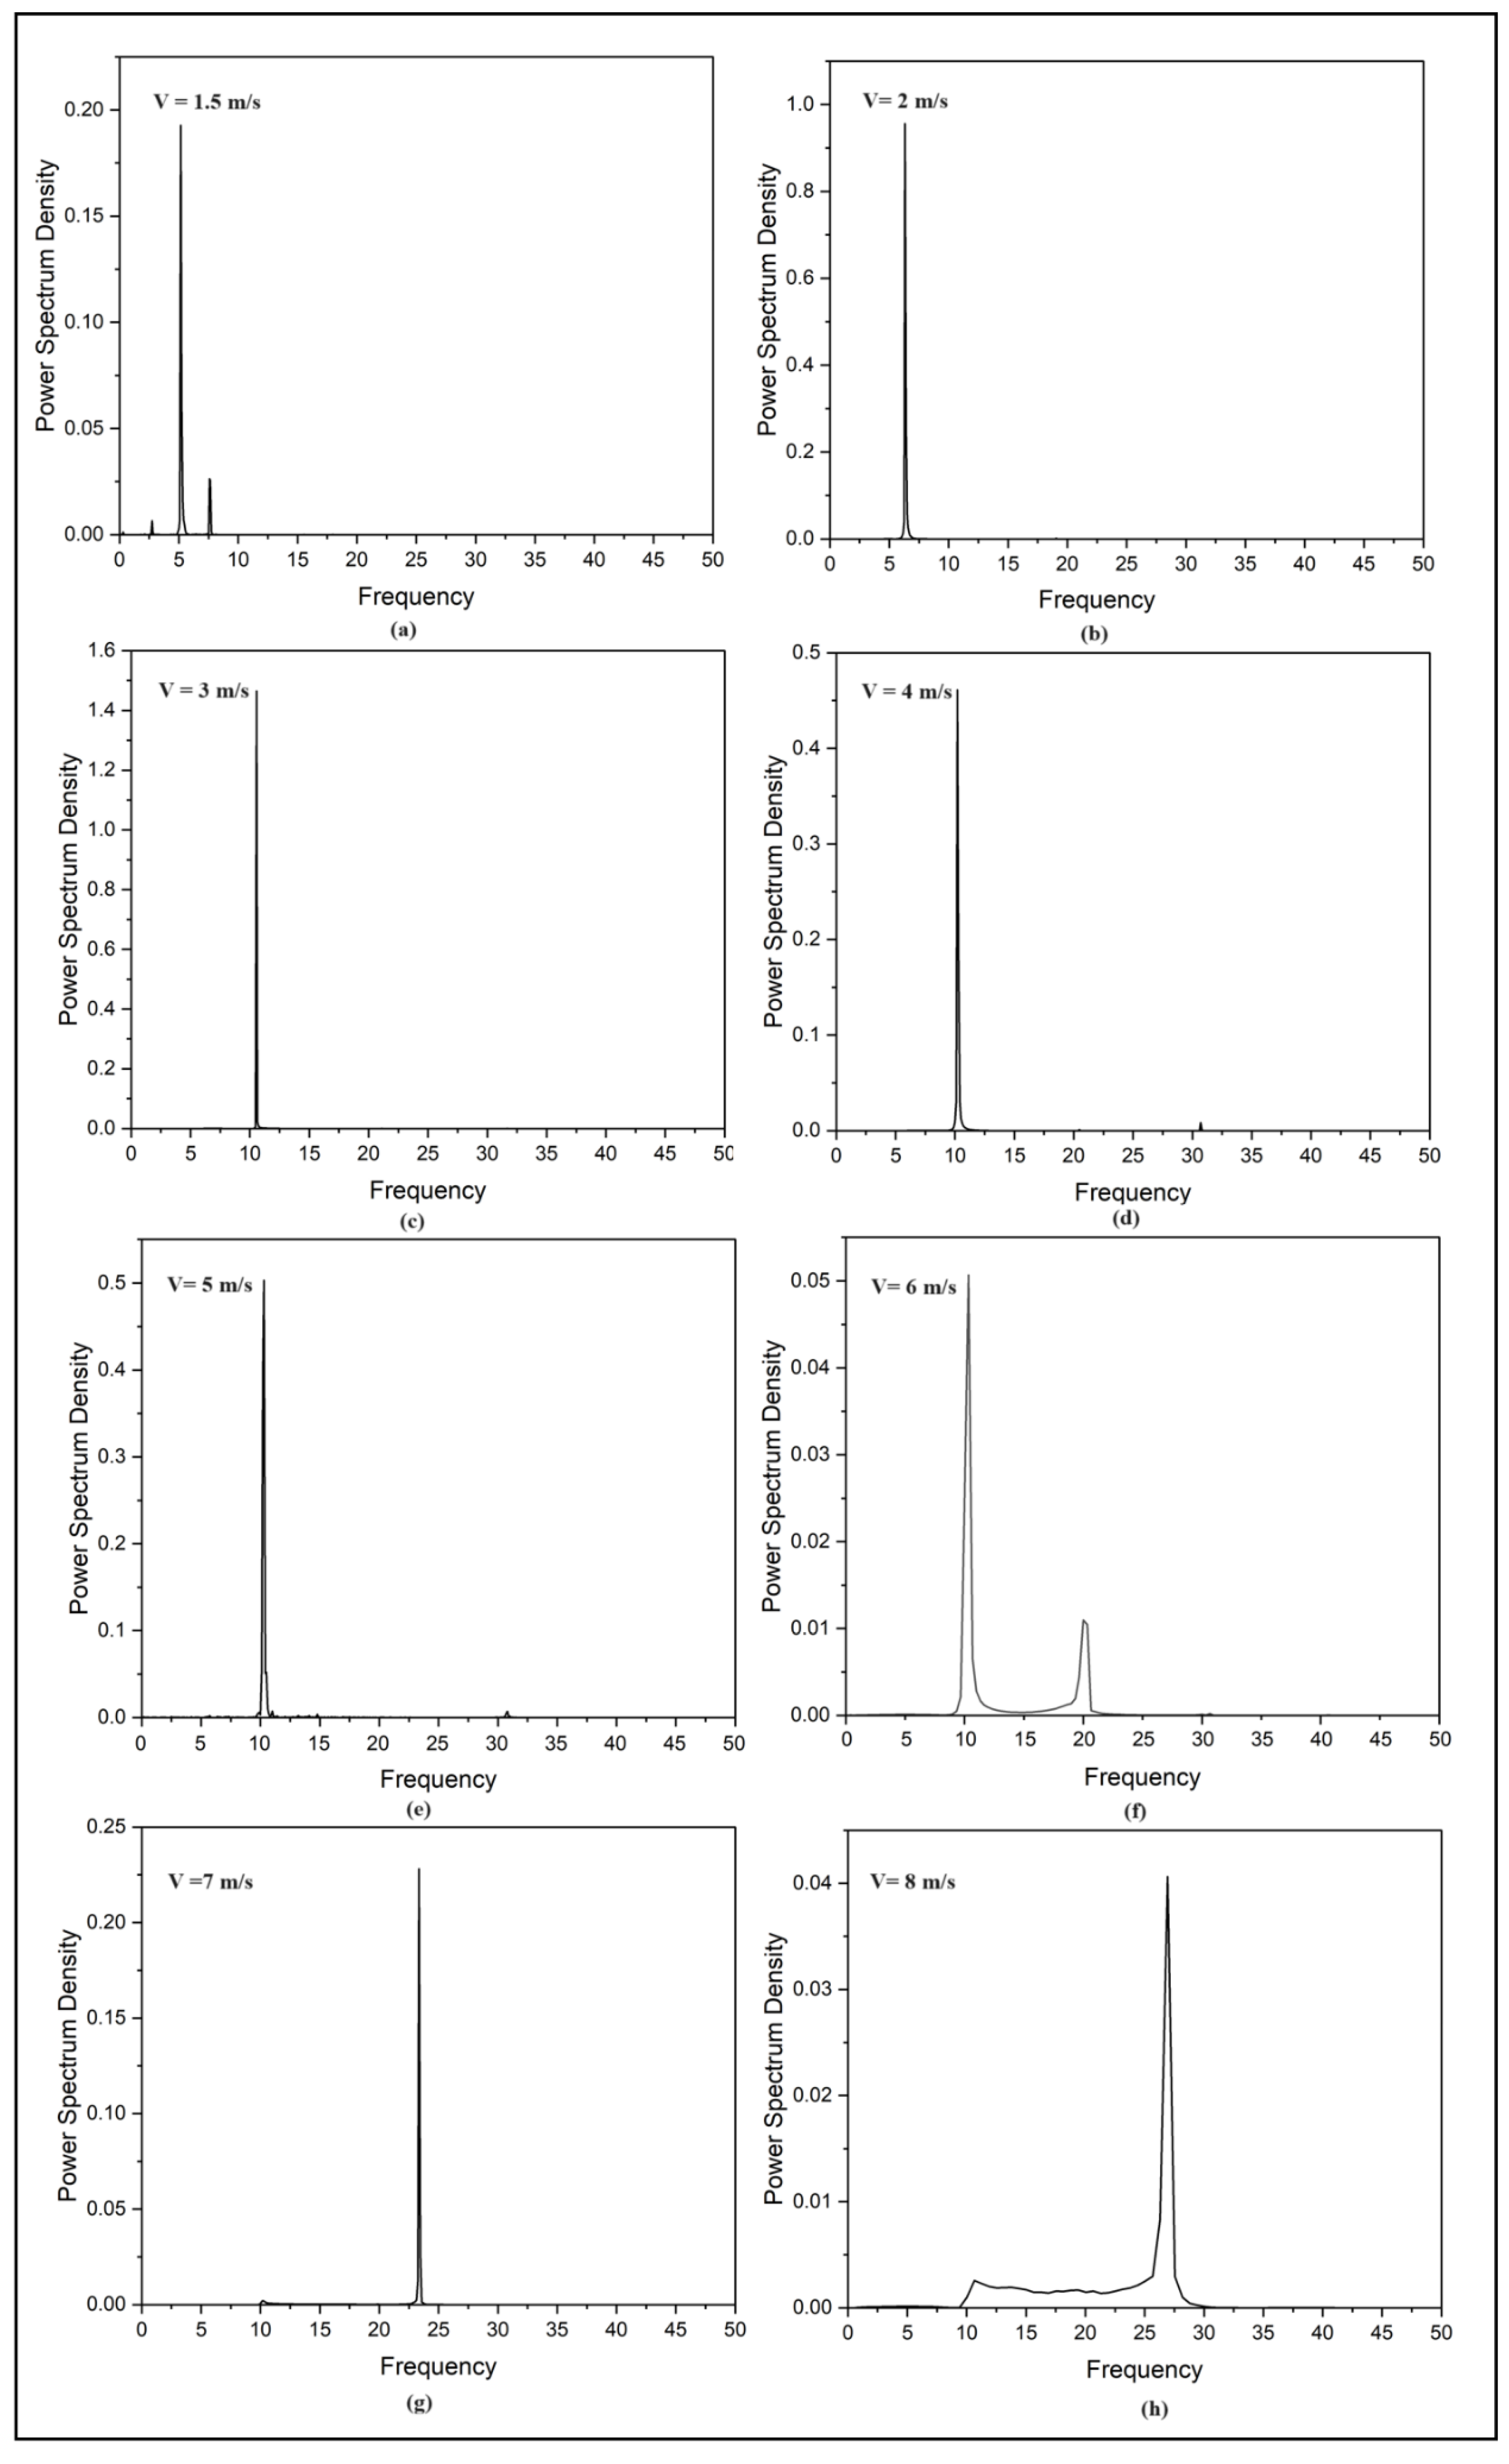
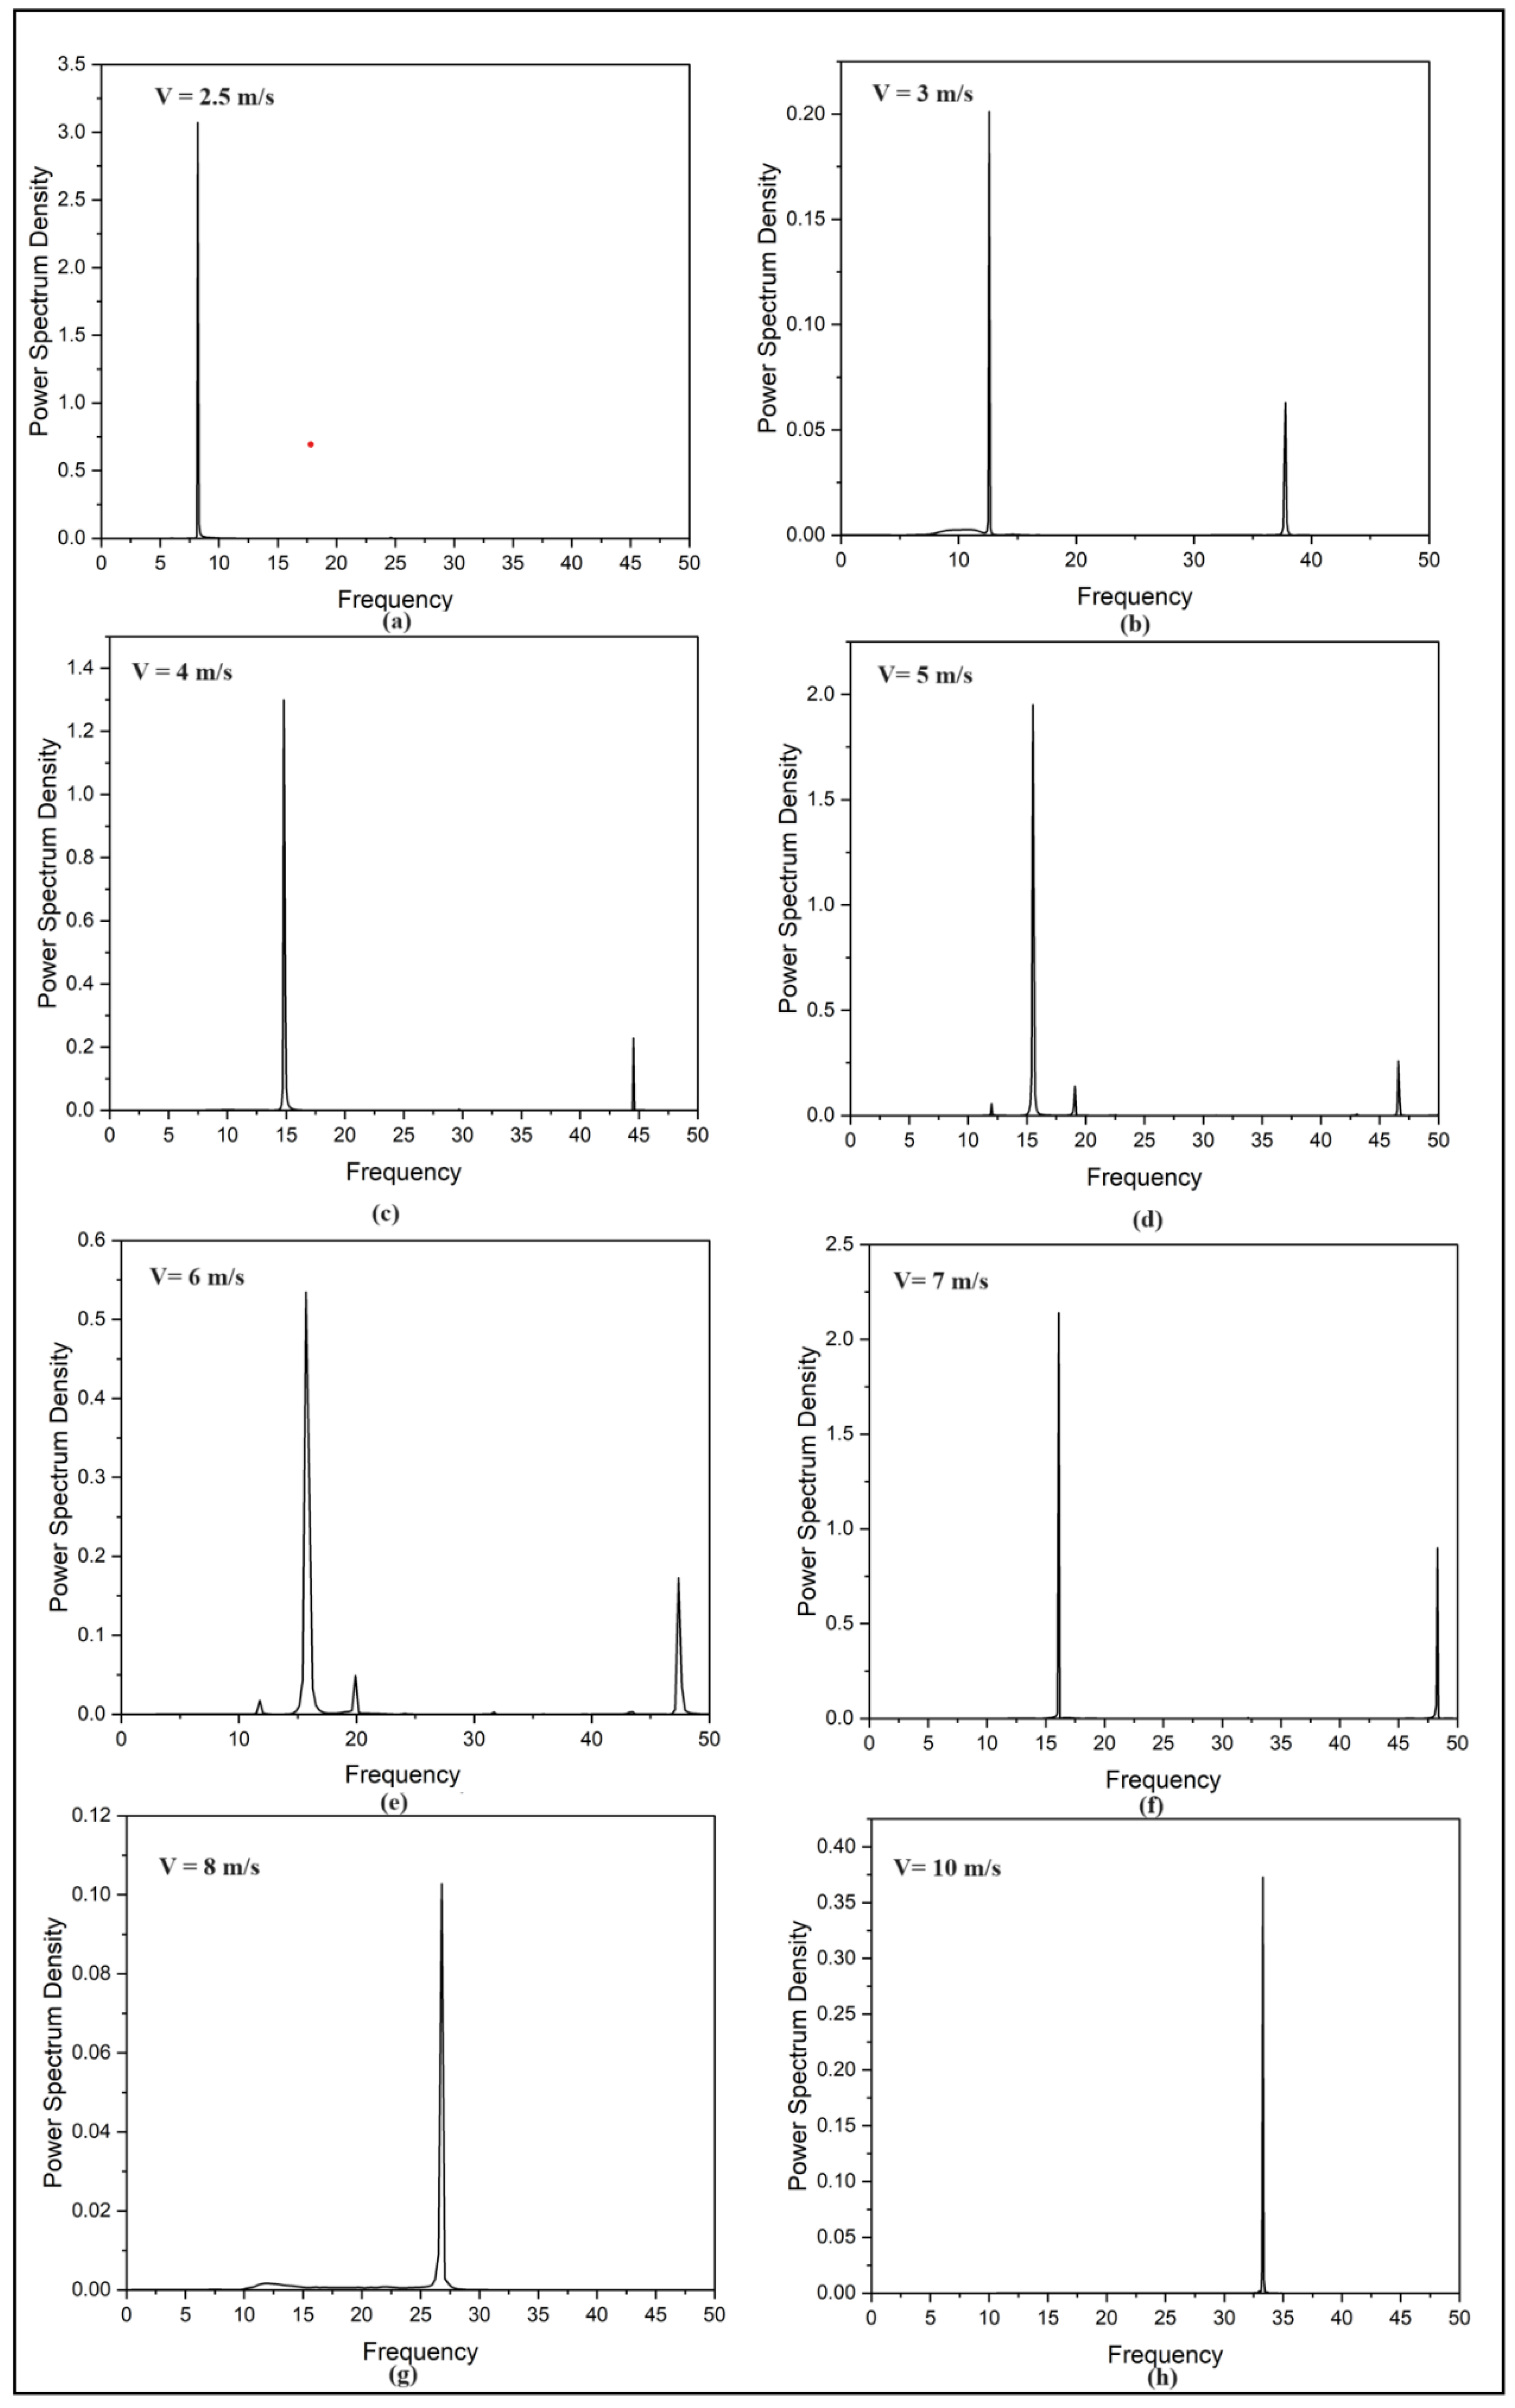
The Fast Fourier Transforms for the lift coefficient at various wind speeds were computed and are illustrated in
Figure 13 and
Figure 14. In the linear system, within the lock-in region, only one dominant frequency occurred, where the vortex shedding frequency locked with the natural frequency. It was observed that, at lower wind velocities, the cylinder vibration spectra exhibited two distinct peaks. One peak corresponded to the natural frequency of the system, while the other peak corresponded to the shedding frequency. As the wind speed increased, these two peaks merged into a single peak, and the oscillating frequency centered around the natural frequency. This observation is clearly depicted in
Figure 13a,c, which shows the plot of frequency spectrum of lift coefficients for wind speeds of 1.5 m/s (below lock-in) and 3 m/s (lock-in) for the linear case.
In this study, the value of the frequency ratio obtained during the lock-in period was 1.1. It is worth noting the presence of multiple frequencies during the beating phenomenon (
Figure 13a) and at the beginning of desynchronization (
Figure 13f).
On the other hand, in the cubic nonlinear system, two frequencies were obtained in the lock in period, as depicted in
Figure 14b–f. In a nonlinear cubic spring system, the natural frequency of the structure becomes dependent on the amplitude of oscillation. As the wind speed increases within the lock-in region, the system may undergo amplitude modulation (12.69 Hz to 16.09 Hz), causing variations in the vibration amplitude. These variations can lead to the emergence of multiple frequencies in the system’s response.
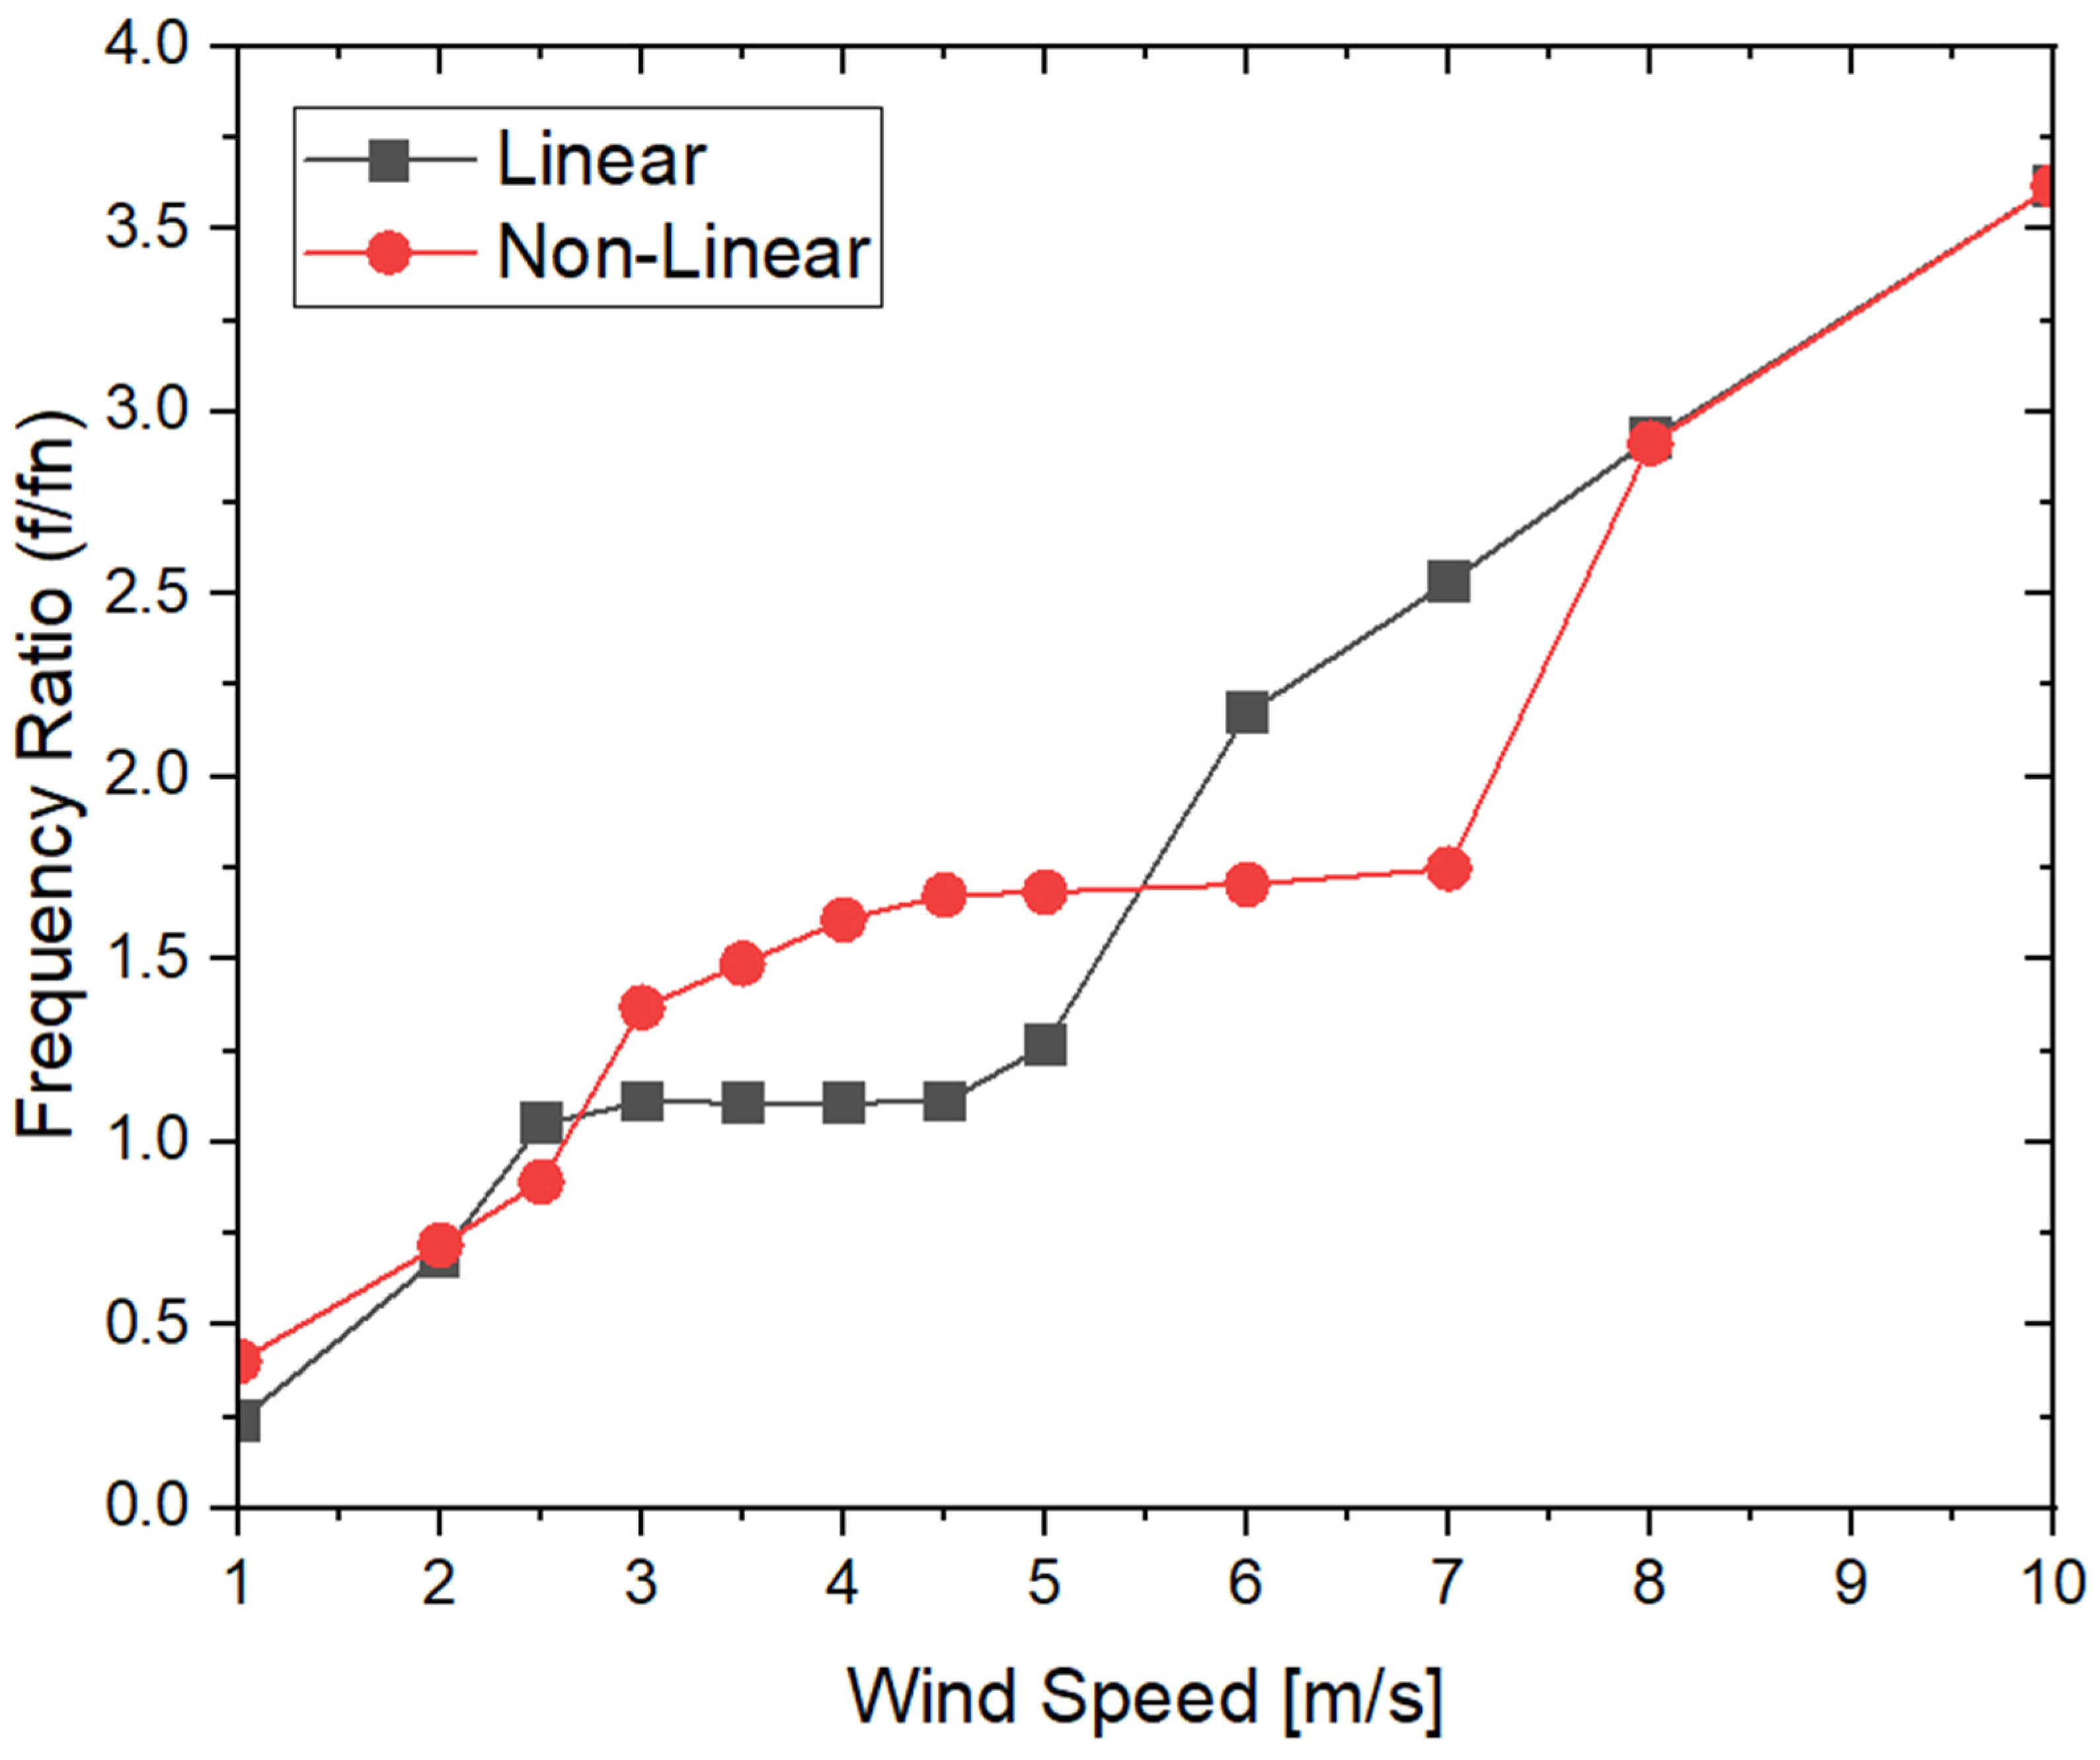
Figure 15 represents the corresponding frequency response obtained at various wind speeds for linear and nonlinear systems.
4. Conclusions
In this study, we investigated the fluid forces, vortex structure, and vibrational response characteristics of an elastically mounted circular cylinder with linear and non-linear systems. The cylinder underwent flow-induced vibrations within a Reynolds number range of 4200 to 42,000. The cylinder exhibited small-amplitude oscillations at shedding frequency below natural frequency. As wind velocity increased, there was a notable rise in oscillation amplitude, signifying the onset of the lock-in regime. During lock-in, the frequency of oscillation aligned with the natural frequency of the spring-mass system. A further increase in flow velocity led to the termination of the lock-in range, transitioning into a desynchronization region. While all these phases were observable in both linear and non-linear cubic systems, the range of wind speed varied in each phase when comparing non-linear cubic systems to linear ones. The results revealed that in the linear spring case, a single predominant natural frequency emerged, leading to resonance and an increase in cylinder response amplitude. The frequency ratio obtained was 1.1. However, in the cubic nonlinear spring system, the natural frequency varied with the amplitude of vibration, resulting in multiple frequencies in the lock-in region and a more complex frequency spectrum compared to a linear spring system. The results also indicate that incorporating a nonlinear spring significantly extends the range of wind velocities, in which significant energy extraction through vortex-induced vibration is achievable. This suggests the potential for enhanced energy harvesting capabilities in VIV systems with nonlinear spring configurations. The results highlighted that, when considering an energy extraction device functioning in realistic flow conditions, the extended range of flow speeds offered by nonlinear cubic spring systems is expected to offer a significant advantage. While the power generated by the vortex-induced vibration energy harvester (VIVEH) with a single cylinder system is relatively small compared to systems with non-linear spring arrangements or multiple cylinder setups, it still holds promise for powering small sensors or miniature devices. Note that in this paper, we discussed the mechanical energy absorbed by the nonlinear mechanical resonator while the electrical power would appear through linear piezoelectric coupling placed along the cantilever beam support of the cylinder (
Figure 5) to the final electrical circuit [
20]. To maximize the power output, careful consideration of various parameters such as mass, natural frequency, the Reynolds number, damping factor, and lateral distance between cylinders is essential. Additionally, exploring alternative setups like multiple cylinder arrangements, or various type non-linear springs, can enhance power generation [
27]. It is worth noting that the main limitation of linear spring-damper systems is their narrow operational range, restricted to specific wind speeds.


