Article

Pumped Storage Hydropower as a Part of Energy Storage Systems in Poland—Młoty Case Study

1
Mineral and Energy Economy Research Institute, Polish Academy of Sciences, 7A Wybickiego St., 31-261 Cracow, Poland
2
Faculty of Organization and Management, Silesian University of Technology, Akademicka 2A, 44-100 Gliwice, Poland
*
Author to whom correspondence should be addressed.
Energies 2024, 17(8), 1830; https://doi.org/10.3390/en17081830
Submission received: 24 January 2024 / Revised: 8 April 2024 / Accepted: 9 April 2024 / Published: 11 April 2024

Abstract

:
The increase in the share of renewable energy sources (RES) leads to a growing need for sources or systems/actions to stabilize the national energy grid. Such stabilizing actions include market tools, such as prices and demand-side response (DSR) tools, as well as flexible energy sources (e.g., gas). In addition, energy storage, where pumped storage hydroelectricity (PSH) accounts for 90% of global storage capacity, plays an important role. Therefore, the authors presented a detailed analysis of PSH in the context of the dynamic growth of installed capacity in renewable energy sources. They analyzed the economic viability of this type of power plant, with a particular emphasis on operational costs, energy production, and revenue. The Młoty case study and market data, including historical data on various PSH, were presented and analyzed. This study uses copulas, simulation, and statistical analysis. The authors proved that market prices and arbitrage actions alone are not sufficient to achieve profitability of the investment; however, additional benefits, such as fees for available power, enable the achievement of economic profitability. The reason for this is the fact that one of the main goals of PSH is to serve as a power reserve. In addition, this paper presents the analysis of the utilization of existing PSH in the form of full pumping and energy generation cycles (charging and discharging storage).

1. Introduction

With the worldwide increase in the share of unstable energy sources in the energy mix, the need to counteract the destabilization of the energy market increases. On the one hand, there can be organizational activities, such as dynamic energy sales tariffs and other measures controlling demand for energy, such as demand-side response (DSR) services, which temporarily reduce power consumption by energy consumers. On the other hand, activities related to the storage of electricity, which is stored on an industrial scale in pumped storage hydropower (PSH) and lithium-ion batteries, are also desirable [1,2].
Energy storage plays a key role in the development of renewable sources [3,4]. Pumped storage hydropower allows for the storage of electricity in the form of potential energy of water pumped from the lower reservoir to the upper reservoir. The stored energy is recovered by the water flowing in the opposite direction, supplying the hydro power units, and the produced electricity is returned to the grid (usually during times of increased demand for it). Pumped storage hydropower is still the most widely used storage technology in the world today. The total installed capacity in PSH was approximately 160 GW in 2021 (with a capacity of approximately 8500 GWh in 2020), which is more than 90% of the total global volume of electricity storage. In second place, there are lithium-ion batteries and their total installed capacity was close to 16 GW at the end of 2021, most of which was commissioned in the last five years [5].
According to [6], in Polish conditions, there is still no possibility of storing large amounts of electricity for the needs of the National Power System (NPS) apart from pumped storage power plants [7]. This sentence is highly debatable, because as mentioned earlier, in the last 5 years, there has been a dynamic increase in the installed capacity of lithium-ion batteries. The authors also note that despite the large possibilities of stabilizing the demand for electricity and reactive power compensation, no new PSH are currently being built in Poland.
The main role of the PSH is to remain available in the continuous mode for the possibility of intervention in the event of a disturbance or sudden unbalance in the power system [8]. Currently, due to the progressing energy transformation and the change in the structure of energy generation, new roles, such as generating revenues on the difference in prices of electricity taken from the grid and returned to the grid (pumping water at the lowest market prices and the lowest energy demand and generation at peak load of the National Power System) and providing storage capacity for high generation of energy from renewable energy sources (wind and PV), are added. Referring to the mentioned innovative changes, according to Dzikuć et al., the implementation of innovative solutions in the energy sector is a key element of low-carbon development [9].
Additional services which are already provided by PSH and whose importance will grow along with the dynamic increase in the capacity installed in RES are:
  • The ability to quickly change the operating mode along with dynamic changes in operating points,
  • Supplying power and reactive energy, and
  • Self-start capability, i.e., the ability to start a power plant without power from the NPS [10].
Based on the literature review, which is presented in the next chapter, it was concluded that research on the potential use of PSH for stabilizing the national grid with economic analyses in Poland need to be conducted. The usage of renewables is increasing, hence the need for energy storage. This, in turn, requires a detailed analysis of different investments, including pump storage hydropower. Therefore, the authors had to concentrate on one power plant as a subject for case study. Poland was chosen for this study due to its increasing investment in renewable energy, its geographic suitability for pumped storage hydropower projects, and the existing gap regarding the economic analysis of PSH in Poland.
PSHs have a unique range of operations required to stabilize the power system and cannot be treated solely by market price arbitration. Additionally, there is a lack of studies on the profitability of using PSH with mining operations and natural terrain features. This research is significant because it introduces new conclusions on economic analyses of PSH, referring to countries advancing in renewable energy development, thereby contributing to the international discourse on energy storage solutions.
Based on the above, the authors conducted research on the problem of PSH because the proposed type of economic analysis brings new conclusions and is important for many countries that develop RES. The use of renewable energy sources should also be related to energy storage. This article presents a case study, which can be a reference point for many pumped storage power plants around the world. Therefore, this paper provides contributions to the new body of knowledge from an international perspective.

2. State of the Art

The subject of renewable energy sources, especially pumped storage hydropower, is very important from the point of view of the world environment and the energy systems of given countries. Pumped storage hydropower is crucial for the modern energy landscape [11] due to its ability to store and release electricity as needed. It acts as an efficient energy storage solution, helping to balance the grid, stabilize the energy supply, and integrate renewable sources effectively. In the literature, many studies that address various aspects related to PSH can be found, and this chapter reviews the latest research on the topic of pumped storage hydropower. Firstly, this paper presents studies around the world, subsequently it focuses on research in Poland and in a country with similar climatic and geographic conditions—Germany.
When it comes to economic analyses, Chazarra et al. [12] present the topic of the economic viability of pumped storage power plants participating in the secondary regulation service. The authors analyze the economic viability of twelve pumped storage hydropower plants (the Iberian power system) equipped with different fixed-speed and variable-speed units and with and without considering hydraulic short-circuit operation. The same authors provide a similar analysis in another paper [13]. Abdellatif et al. [14] analyze the economic competitiveness of pumped storage power plants in Egypt. They define the main factors that influence the viability of building it in Attaqa Mountain. The authors conduct an economic analysis of pumped storage hydroelectric power plants (PSHPP) and also simple cycle gas turbine power plants. As a result, they determine the conditions under which PSHPP achieves noticeable competitiveness as an on-peak solution in comparison to traditional power plants. In the literature, there are more research on economic analyses of pumped storage powerplants, for example in abandoned coal mines [15,16], of Indian pumped storages schemes [17], of large-scale pumped storage plants in Norway [18], of such plants in China [19], in Korea [20] and many more papers [21].
Referring to more technical research, Bayazıt et al. [22] present a study on the transformation of multi-purpose dams into PSH using a GIS model. The main model’s goal is to find the optimal second reservoir place for the PSH transformation, but also to evaluate the theoretical hydroelectric energy potential. Some other authors [23]—Xu et al.—explore the regulation reliability of a pumped storage hydropower in the system that bases on wind–solar hybrid power generation. They adopted a mathematical model to investigate reliability of regulation. Five regulation indexes, which include firstly rise time, then settling time, but also peak value, and subsequently peak time and overshoot of the reactive power generator terminal voltage, and finally guide vane opening and angular velocity, were chosen to assess the PSSP’s regulation quality. Mennemann et al. [24] focus on predictive control of a variable-speed pumped storage hydropower. They developed a non-linear model predictive control strategy. Wu et al. [25] study the optimal location selection for offshore wind-PV-seawater pumped storage hydropower using a hybrid MCDM approach. Fu et al. [26] examine multi-objective optimization of guide vane closure scheme in clean pumped storage hydropower with emphasis on pressure fluctuations. Pérez-Díaz et al. [27] integrate fast-acting energy storage systems in existing PSHs. The aim of this work is to enhance the system’s frequency control. Holzer et al. [28] present generator design potential for full-size converter operation of large pumped storage hydropower. Subsequent research was conducted in Uzbekistan [29], and the authors—Mukhammadiev and Dzhuraev—discuss the possibilities of creating a PSH in Uzbekistan, referring to the water management of its hydro resources and their dispersal.
Focusing on practical computer simulations in research, Rezghi and Riasi [30] provide a numerical simulation to study the interaction effect of the hydraulic transient conditions of selected pump-turbine units in PSH taking into account the ‘S-shaped’ instability region. Savchyn and Vaskovets (Ukraine) [31] study the local geodynamics of the location of Dniester’s PSH. The aim of their work is to find out about the recent local geodynamic processes on the mentioned place which arise because of the additional man-caused load during the construction of hydrotechnical structures. Urishev [32] selects the parameters of pumped storage hydropower in large water pumping stations. Nasir et al. [33] present capacity optimization of PSH and its influence of an integrated conventional hydropower plant operation. Finally, it is worth noting that a fairly extensive study on pumped storage hydropower in the context of grid reliability and integration of different renewable sources can be found in the publication of Botterud et al. [34]
As indicated above, research in the field of pumped storage power plants is extensive. Therefore, this paragraph focuses on reviewing the latest research (from the past three years) on this topic specifically for Poland and Germany. Poland was selected due to the focus of this article, while Germany offers comparable climatic conditions and energy economy, including the production of energy from fossil fuels, similar operating hours for wind and PV (which are linked to economic conditions and the need for electrical energy storage capacity). Wessel et al. [35] present the economic feasibility of semi-underground pumped storage hydropower plants in open pit mines in Germany. On the other hand, there are some papers on the topic of the implementation of pumped storage power plants in underground mines, for example [15,36] in Germany, and [37,38,39,40] in Poland. Kozieł et al. [41] discuss optimization of the wind farm structure through the use of PV installations and the use of pumped storage power plants. Richter et al. [42] present the topic of economic and sustainable energy transition enabled by this type of hydropower plant. Tedla et al. [43] discuss the role of pumped storage hydropower in improving the integration of renewable sources generation in the case of Germany. When it comes to Poland, Kubiak-Wójcicka and Szczęch [44] characterize the current condition and the perspectives for the development of the usage of rivers in Poland for production of electricity. The same authors in another publication [45] conduct a case study of hydropower plants in Poland in the context of the dynamics of electricity generation with reference to the changes noticed within the climate. Kuta [46] conducts research on the project of mobilized thermal energy storage and geothermal sources. Tyryk [47] describe the research of simulation of a static excitation system of a hydro generator of a pumped storage power plant in Żarnowiec (Puck County, northern Poland). Lewandowski et al. [48] discuss the possibilities and technical and economic benefits of PSHs in Poland. Igliński et al. [49] assess the potential of hydropower for water damming, highlighting its chance for energy transformation in Poland. Twaróg [50] conducts research on modelling of the Solina-Myczkowce pumped storage power plant which is a complex of two hydropower plants on artificial water reservoirs on the San River in Solina (Podkarpackie Voivodship).
As the above literature review demonstrates, research on PSH encompasses a broad scope. However, there is a notable gap in research regarding Poland specifically; this area remains largely unexplored. Consequently, it is evident that further investigation into this topic is warranted. This is particularly pertinent given the comprehensive analysis undertaken, which considers various aspects of PSH utilization, including technical considerations, national grid integration, and economic viability within the market. The evaluation indicates that owners face practical constraints in achieving more favorable economic outcomes compared to already operational PSH facilities. Additionally, certain crucial factors, such as financial risks and realistic pumping periods, have not been adequately addressed by previous studies. These factors significantly influence outcomes, often manifesting as probability distributions.
Drawing from the insights gleaned from the literature review, it is clear that researching the potential utilization of PSH to stabilize the national power grid, coupled with rigorous economic analyses, holds significant merit, especially in the context of Poland. The escalating share of renewable energy in Poland’s energy mix underscores the pressing need for energy storage solutions and economically viable alternatives—PSH emerges as a promising solution in this regard. Therefore, conducting an in-depth examination of PSH is imperative, given the dynamic expansion of renewable energy capacity and the pivotal role of economic feasibility. Such an analysis should incorporate real-world data concerning operational costs, energy generation, and revenue streams to provide comprehensive insights into the economic viability and practical implications of PSH deployment.

3. Materials and Methods

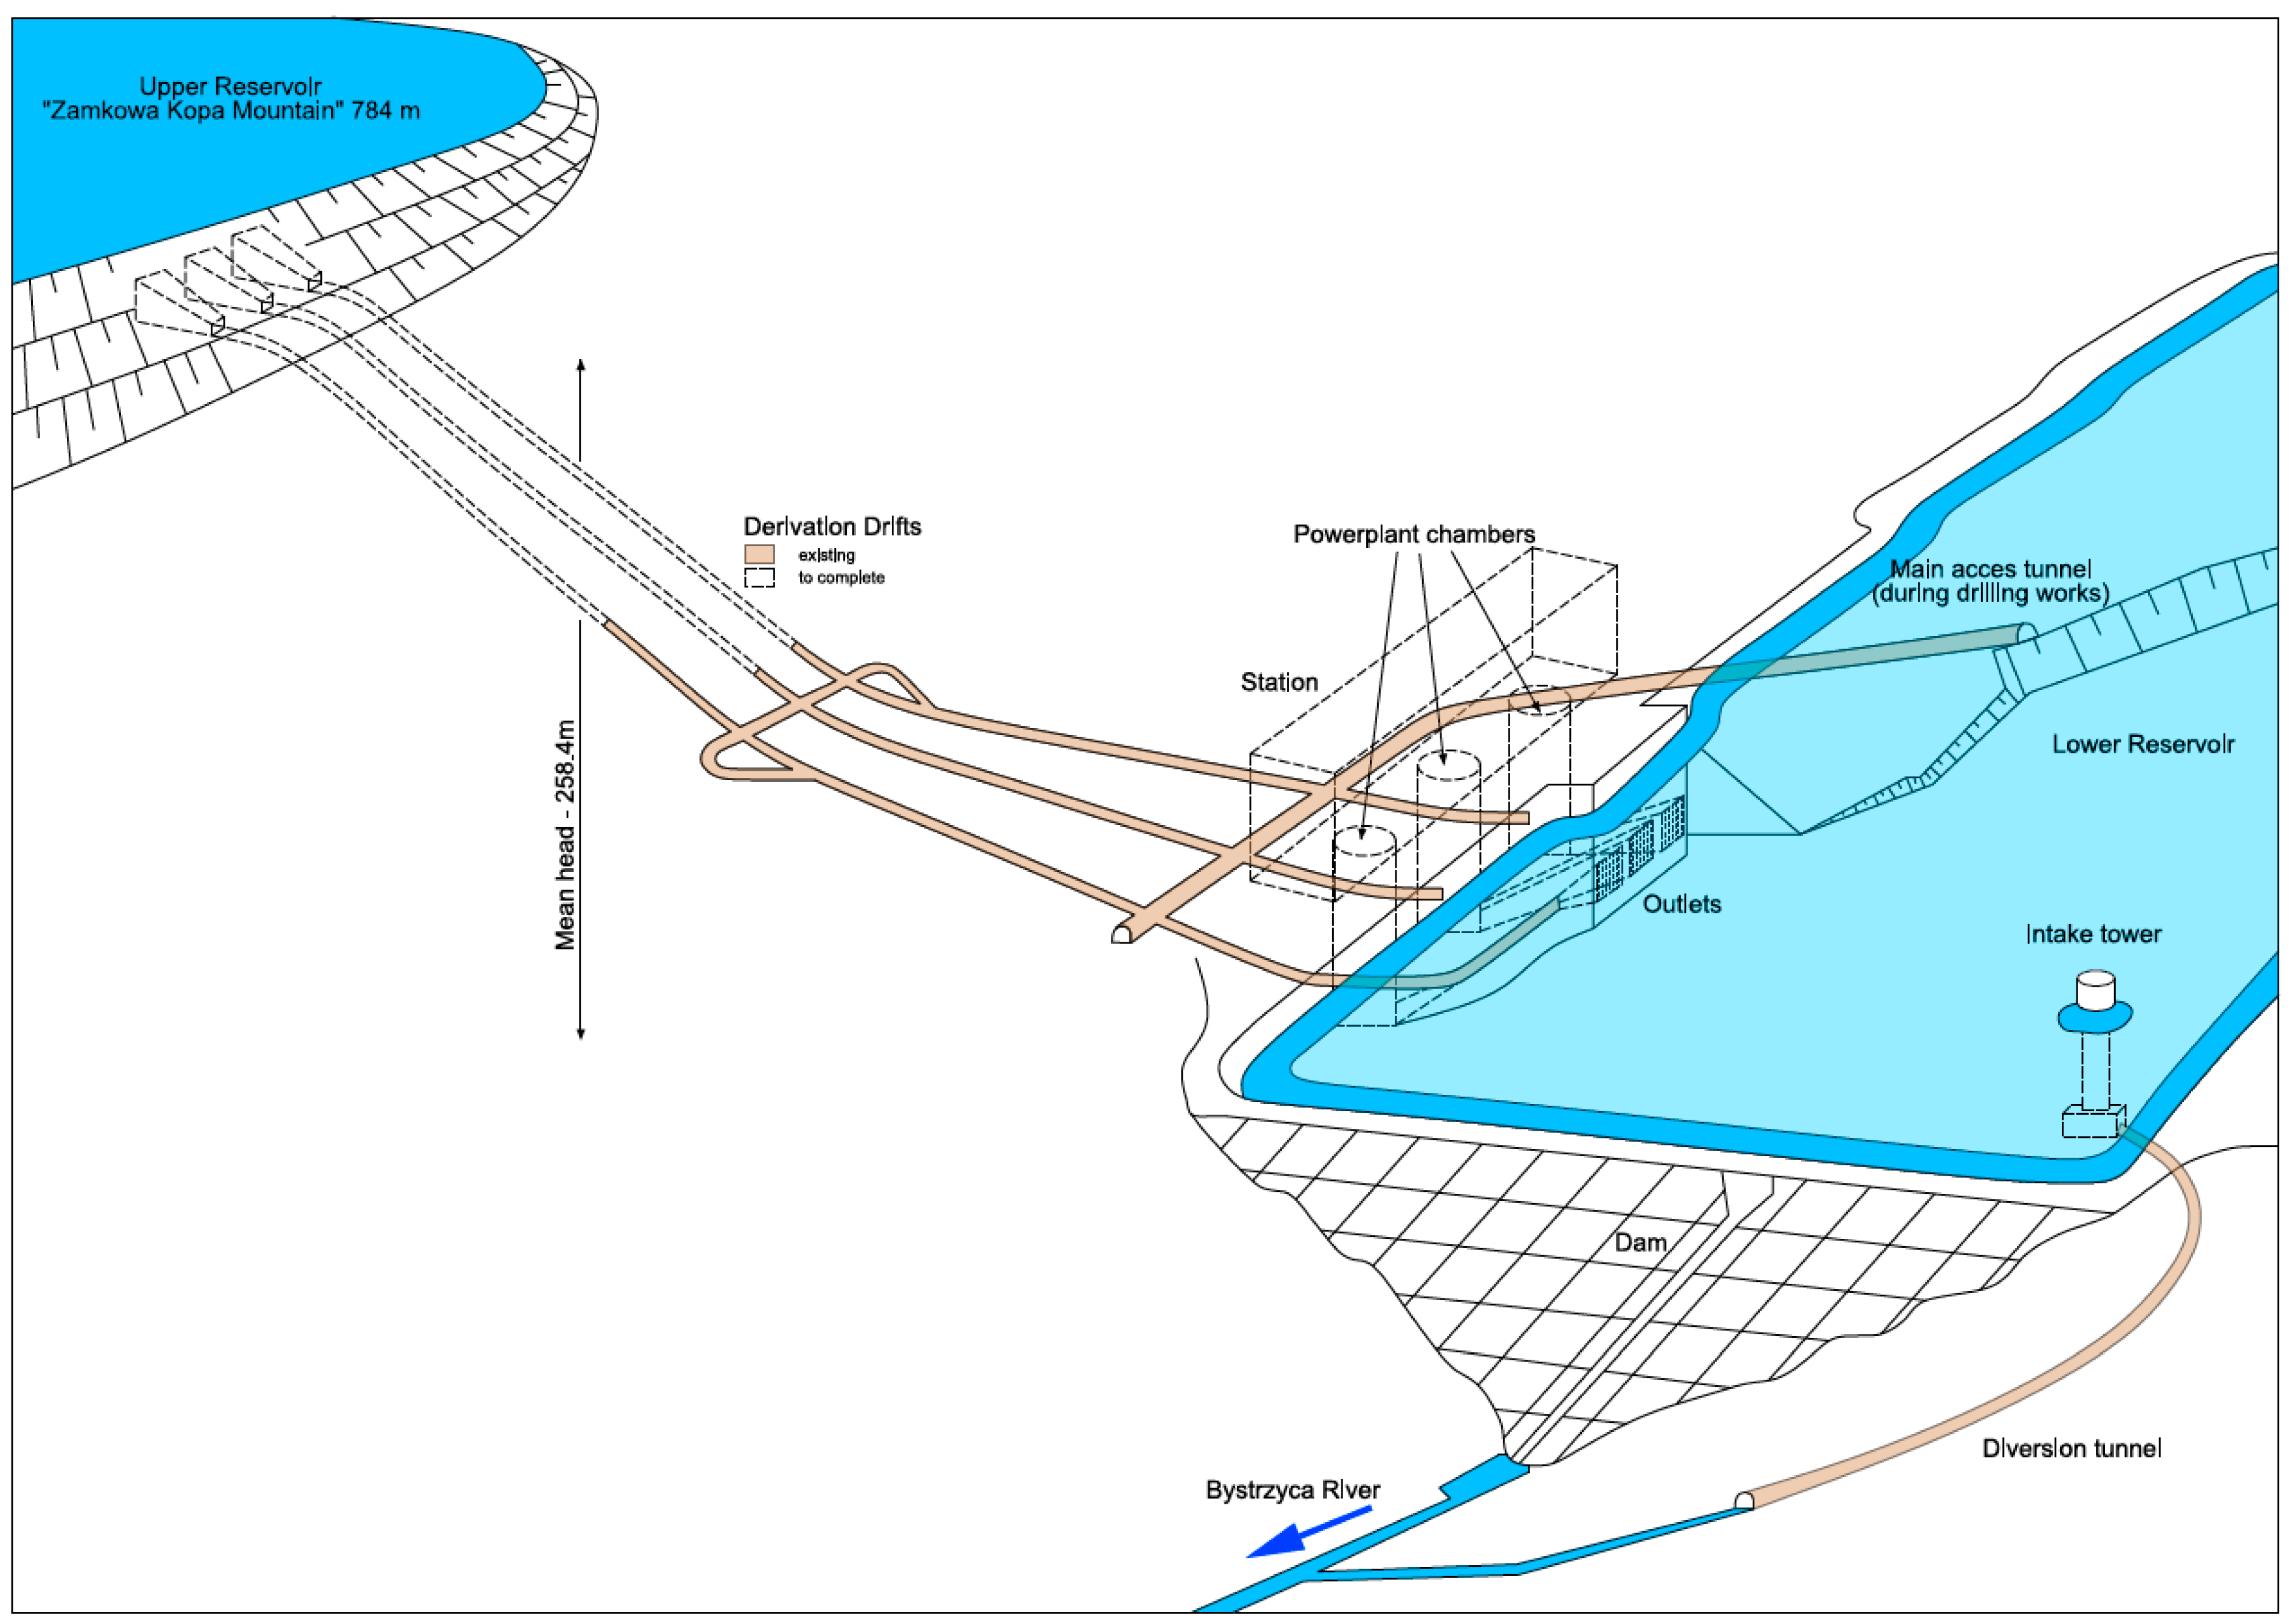
3.1. Characteristics of PSH Młoty—The Main Object of the Analysis

The construction of the PSH Młoty power plant, located in the Bystrzyckie Mountains in the town of Młoty, Lower Silesian Voivodeship, was initiated in the early 1970s. Security works were completed between 1988 and 1989, after which all construction activities were suspended indefinitely [51].
According to the project, the upper reservoir will measure approximately 1241 m in length, 417 m in width, and 22 m in depth, with a total capacity of approximately 6 million m3. The average height of the waterfall is designed to be 258 m. The lower reservoir will be formed by dividing the Bystrzyca river valley, bordered by the Kopa Zamkowa hill (784 m above sea level) to the southwest, and the slope of Równia Wójtowska to the north and northeast. It will have a width ranging from 400 to 800 m and a maximum length of 2.5 km. The total capacity of the lower reservoir is estimated at 13 million m3, with a usable capacity of 6.3 million m3. Figure 1 illustrates the investment scheme. The dam, as per the design, will reach a height of 20 m and span 240 m at the crest. Additionally, the lower reservoir will serve as flood protection, capable of accommodating a flood wave with a capacity of 2.2 million m3 [10].
The characteristic flows of the Bystrzyca Łomnicka river in this place are:
-
Maximum flow: 25.8 m3/s,
-
Minimum flow: 0.02 m3/s, and
-
Average: 0.66 m3/s.
The area of the catchment area limited by the dam—approximately 40 km2 [52].
Several tests of the lining of the excavations of PSH Młoty (the last one in 2017) showed their varied technical condition. Within the area of the planned power plant, there are workings protected by lining of varying technical condition. Sections secured with a concrete lining are in good technical condition (i.e., they do not require additional, costly works in the event of resumption of construction), while the steel lining (derivative adits) is in poor technical condition in most places and requires additional funds for renovation [51,52].
The continuation of the PSH Młoty project is also in line with Order No. 351 of the Prime Minister of 28 December 2021, on the appointment of the Expert Team for the Construction of Pumped Storage Hydropower [53]. The preliminary schedule, presented in [10], plans 2 years of preparatory work related to: preparation of the feasibility study (works in progress—state for the first quarter of 2023), characterization of the conditions for connection to the NPS, obtaining an environmental decision, water and geodetic permits, and the right to real estate [54]. The process of building, related to the completion of mining works (adits and tunnels), the construction of the dam and the installation of power and mechanical equipment, would take 5 years.

3.2. Energy Market and PSH Facilities in Poland—Technical Aspects

The potential operation of PSH Młoty can be assumed based on data on the operation of already existing PSHs in Poland, the characteristics of which are presented in the table below (Table 1).
For the purposes of the economic analysis and estimation of the costs of resuming the construction of PSH Młoty, data from three existing PSHs—Żarnowiec, Porąbka-Żar and Żydowo (these are all Polish hydroelectric power plants operating strictly as PSH power plants)—from the last three years (2021–2023) from Polskie Sieci Elektroenergetyczne SA were analyzed [56].
RTE year = EG year EC year
where
  • RTE—round-trip efficiency, %;
  • EG—gross electricity generation, MWh;
  • EC—electricity consumption, MWh.
The current layout of the transmission network in the Dolnośląskie voivodship does not allow for the transfer of power from/to the power plant. In the considered area, there is a 220 kV network with one line Świebodzice–Ząbkowice–Groszowice. The capacity of this route, despite the planned modernization increasing the permissible current carrying capacity of the line, will be insufficient for reliable cooperation of the Młoty power plant with the grid. Therefore, in the new edition of the development plan for 2023–2032 Polskie Sieci Elektroenergetyczne plans to introduce an additional investment related to the construction of the 400 kV line Świebodzice–Ząbkowice–Dobrzeń together with the extension of the 220/110 kV Ząbkowice substation with a 400 kV switchgear [57]. This investment will provide adequate transmission capacity. It is also worth mentioning that it was already considered by Polskie Sieci Elektroenergetyczne, e.g., due to the improvement of the work conditions of the transmission network in this area of Poland [10].

3.3. Efficiency including Comparison to Lithium-Ion Storage

Depending on the equipment characteristics, pumped storage power plants are characterized by energy conversion efficiency (1), from the point of view of the power grid, at the level of approx. 65–80% [58]. Other studies report an average efficiency of PSH up to 81% [59]. RTE efficiency is the percentage of electricity provided into storage that is later restored. The higher the efficiency, the less energy is lost in the storage process. According to U.S. Energy Information Administration (EIA) [60], in 2019, battery storage facilities operating on an industrial scale in the USA had an average monthly efficiency of 82%, while pumped storage hydropower operated with an average monthly efficiency of 79% in the same period. Other authors present data on efficiency at the level of 86–88% for lithium-ion technologies and 80+% for pumped storage power plants [61].
Table 2 presents the comparison for PSH Młoty with the designed capacity of 750 MW or 3.5 GWh, respectively, with a round-trip efficiency of 77.3% with relation to lithium-ion batteries. For the purpose of estimating capital expenditures and operating costs, the study from 2021 was used [61]. They were also confronted with other items, which largely confirm the assumed amounts of annual costs and CAPEX [62,63,64].The values of capital expenditures and annual operating costs were estimated on the basis of the assumptions from Table 2.

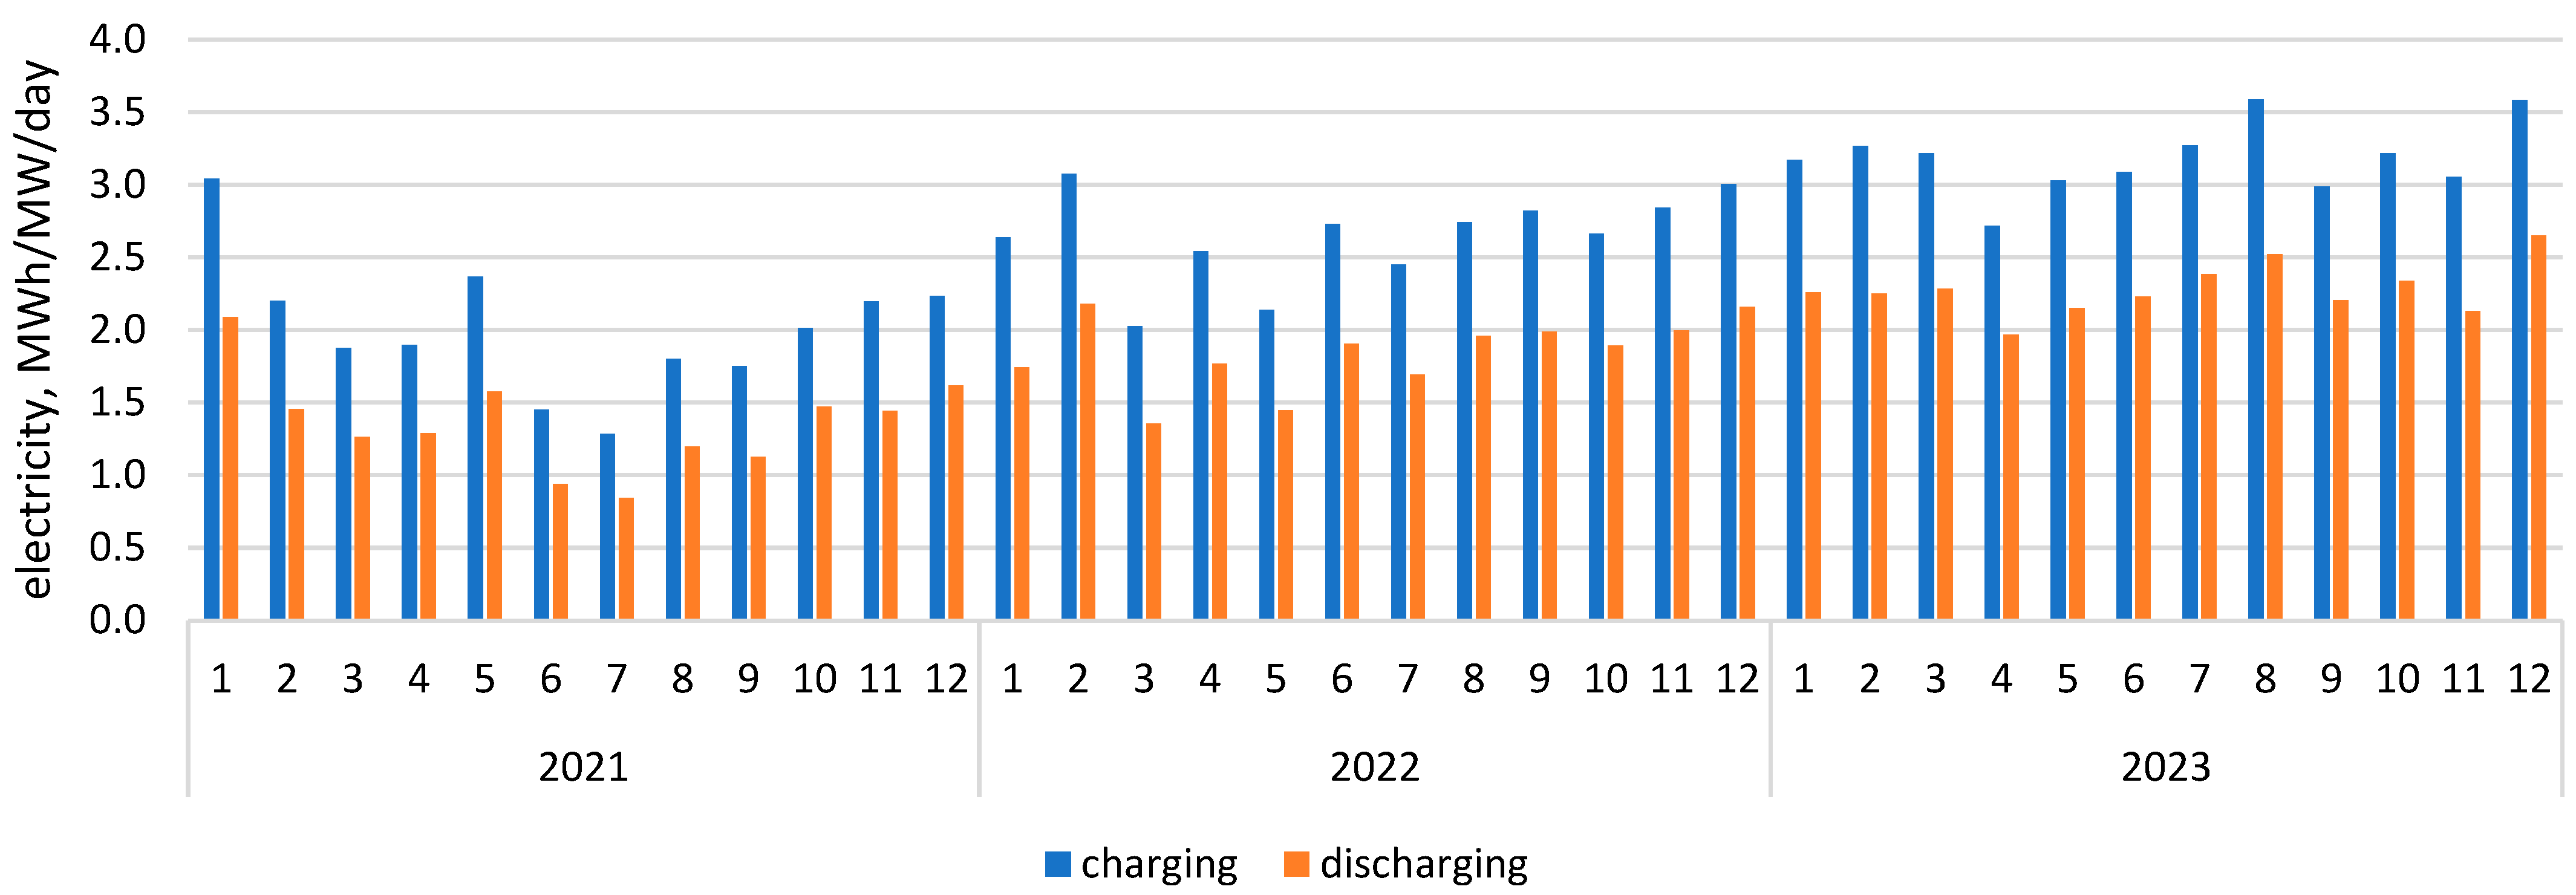
3.4. Number of Cycles and Energy Production

For the purpose of estimating the annual energy production in the Młoty PSH, the effective (converted) annual number of cycles of the PSH in Poland was calculated (3). With a 40-year lifetime of the installation and 15 thousand of cycles in this period [65], the annual theoretical number of cycles was assumed as 365.
NEC   year = τ = 1 nh EG 3 ( year , τ ) SC 3 · 365
where
  • NEC—Annual mean number of effective cycles per day;
  • year—2021, 2022, and 2023;
  • SC3—Summed storage capacity, MWh;
  • nh—Number of hours (τ) in the period.
The predicted annual energy production in PSH Młoty was calculated from the Formula (3).
EEG   year =   NEC ·   TEG   year
where
  • EEG—Expected Yearly Energy Generation, GWh;
  • TEG—Theoretical Yearly Energy Generation, GWh;
  • y—year.

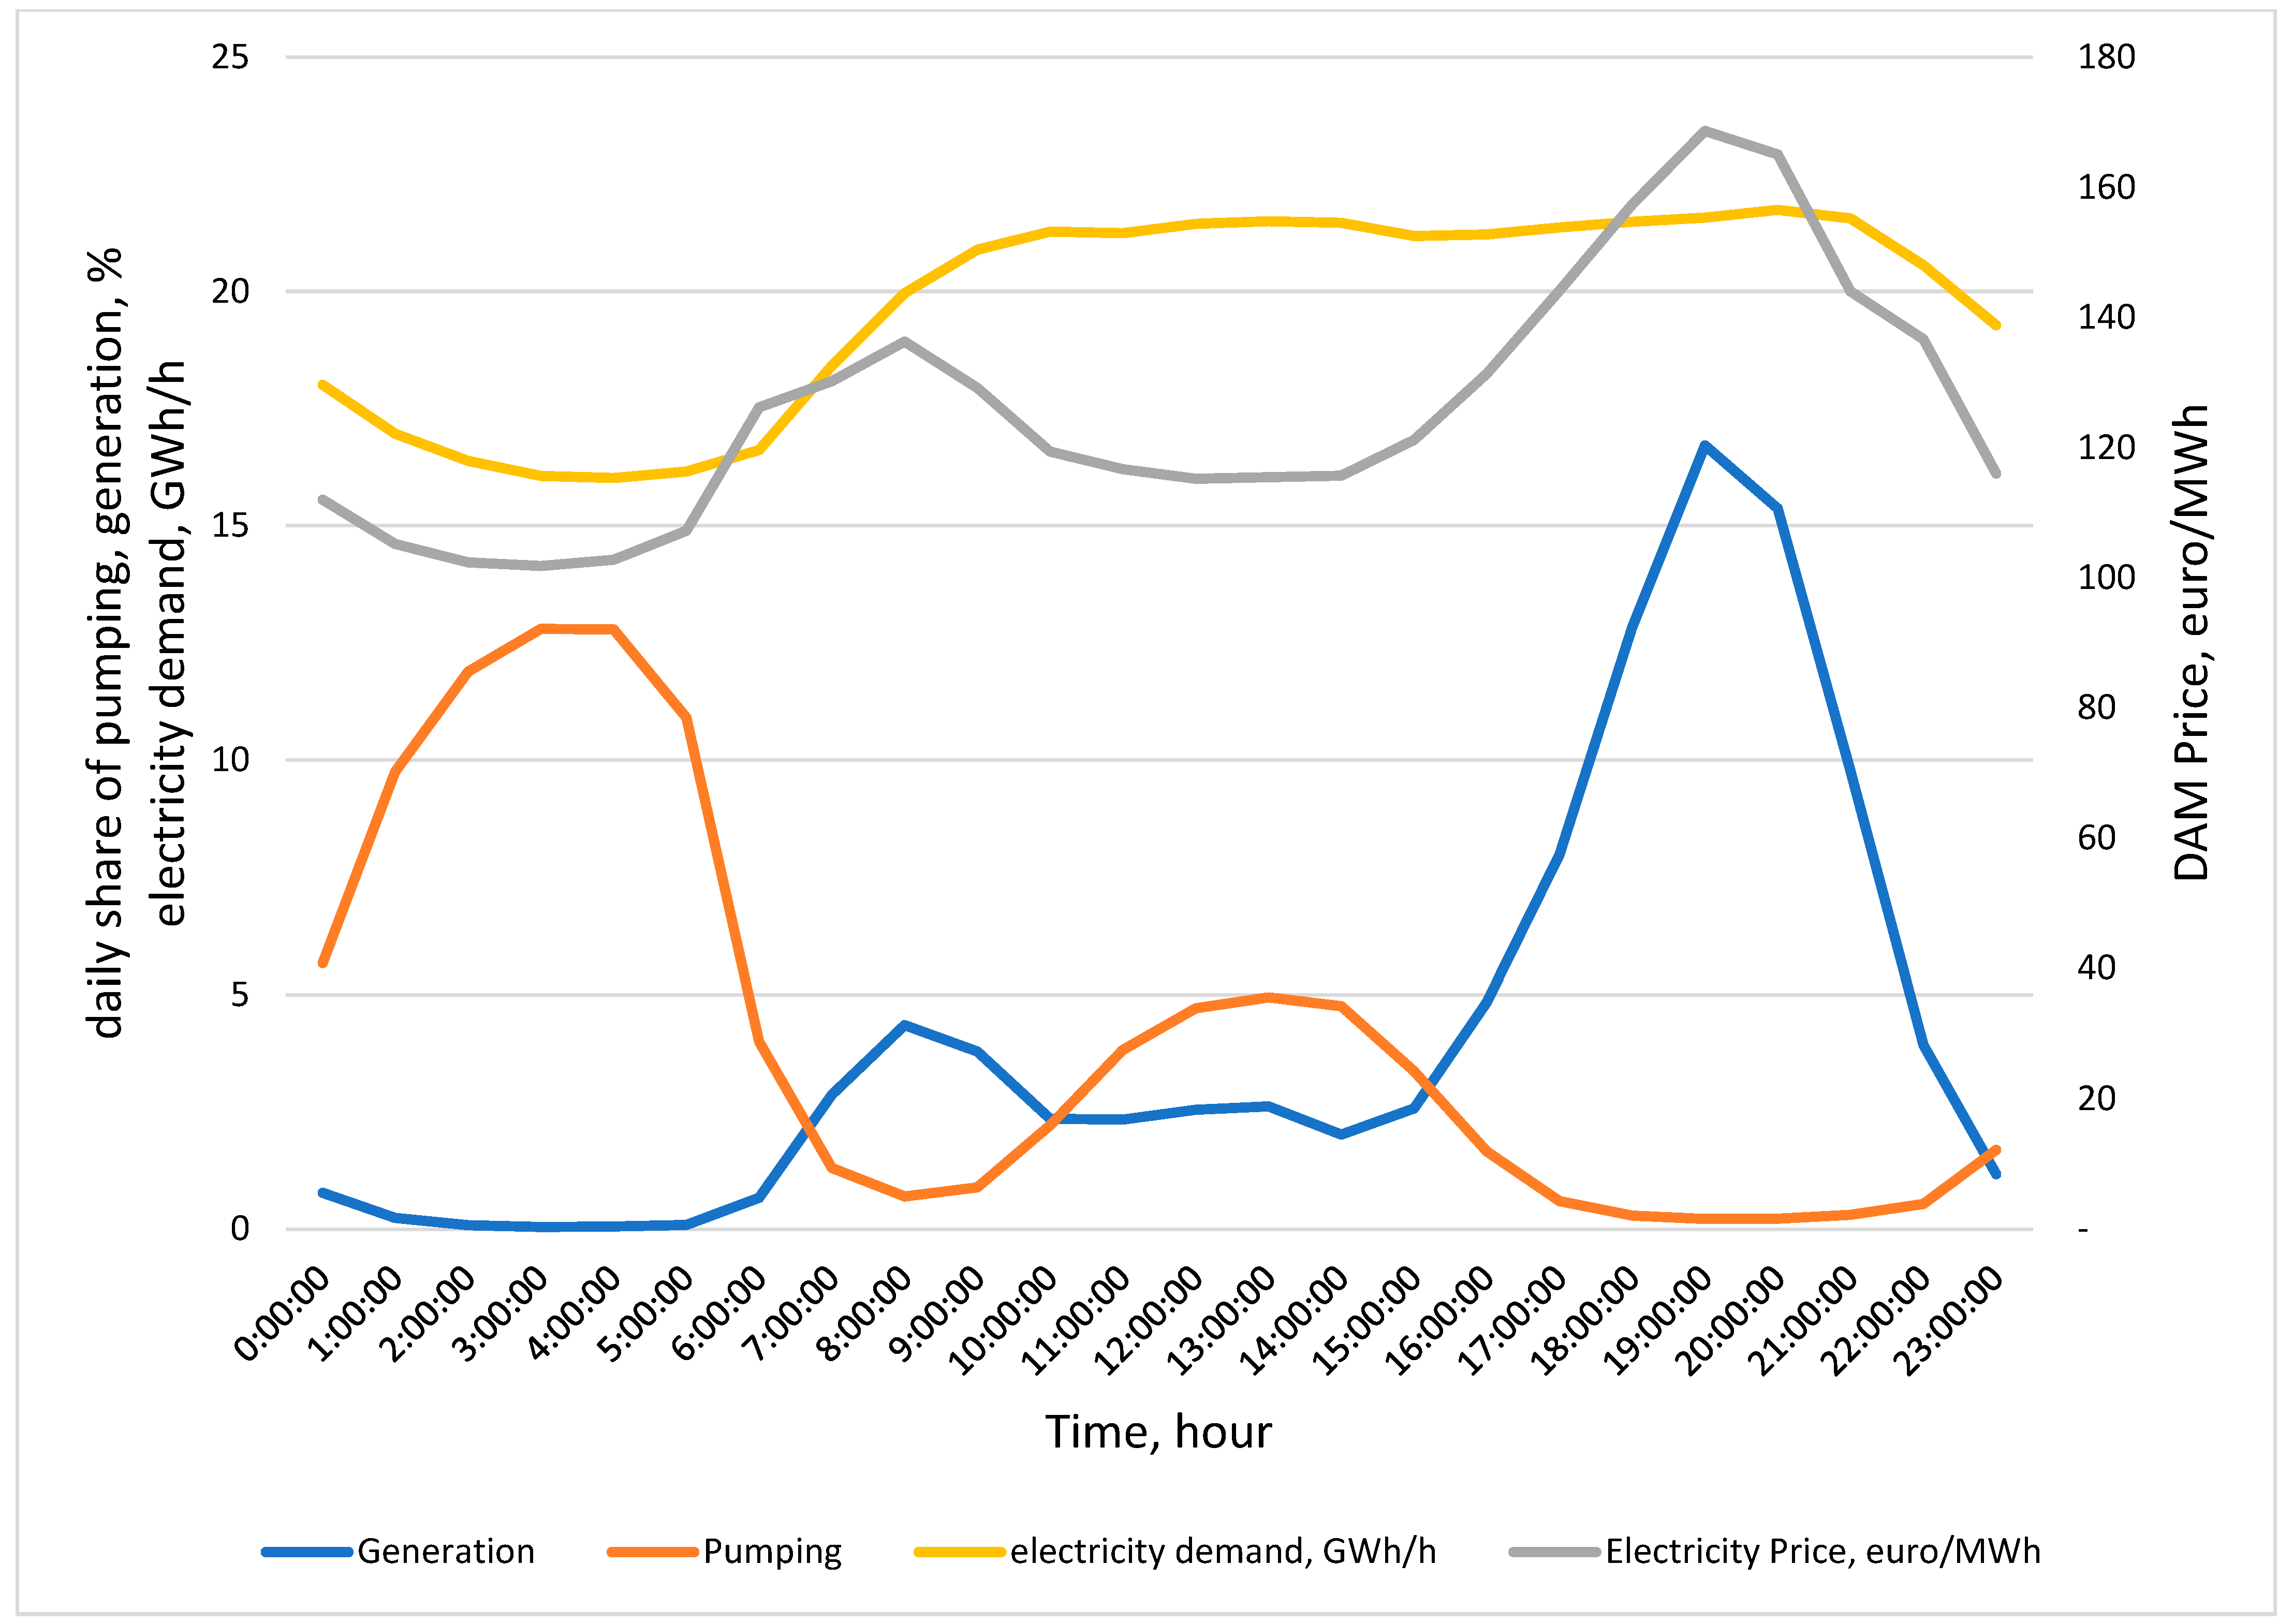
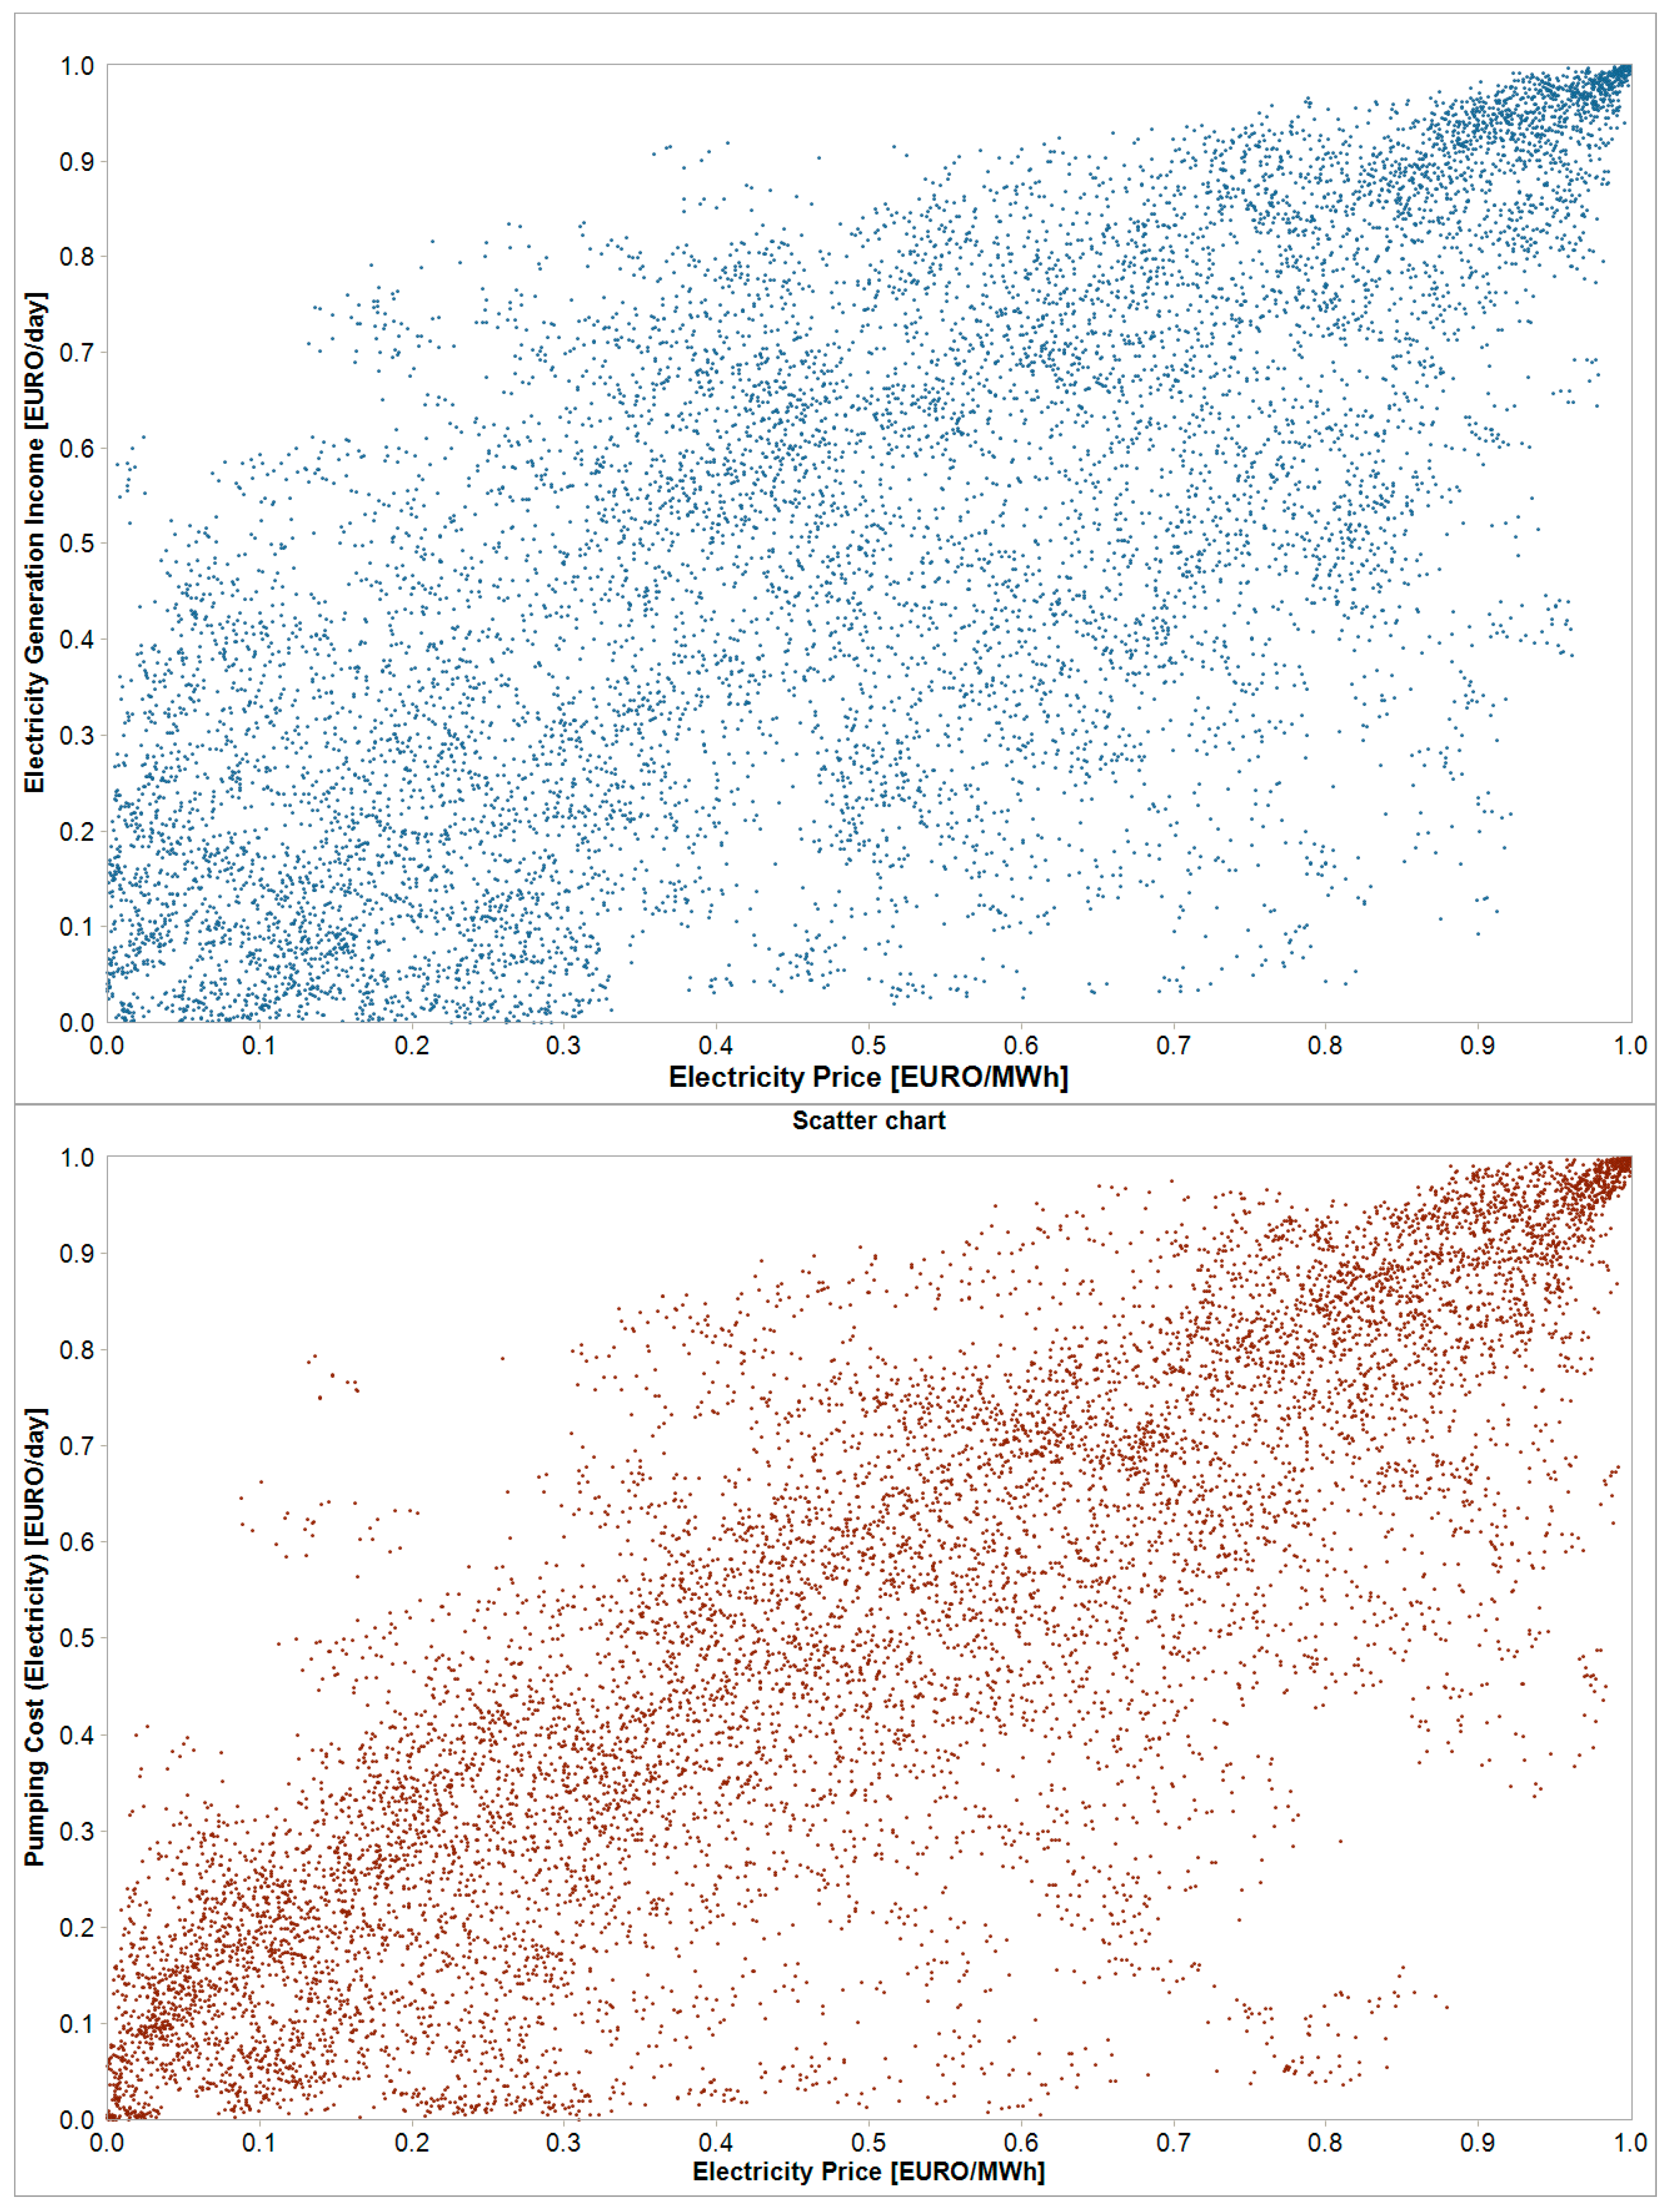
3.5. Work Loading—Pumping, Generating Cycles and Energy Price Distributions

Figure 2 shows the share of pumping and generation against the background of average hourly energy prices for three selected power plants. The most pumping (over 60% of the volume of accumulated potential energy expressed in MWh) takes place between 01:00 a.m. and 06:00 a.m., i.e., during the lowest demand for energy within the NPS. Then, pumped storage power plants return energy (13.4% of the generation volume) to the grid as part of the so-called the morning rush hour to switch back to the pumping mode in the following hours. Between 11:00 a.m. and 3:00 p.m., for the most part, surplus electricity is mostly accumulated (17.8% of daily pumping vs. 9.8% of daily generation), mainly from PV (this source recorded the largest increase in power installed in Poland last year). In the following hours (evening peak), pumped storage power plants in Polish conditions give the largest volume of energy (reaching 67.5%) to the grid. The energy delivery period also overlaps with the highest prices on the Day-Ahead Market on the Polish Power Exchange (TGE).
Figure 3 shows the annual distribution of pumping and generation in the form of average daily productivity (the amount of energy produced in MWh on one MW of installed capacity). A noticeable advantage in the winter months, which overlaps with the increased demand for electricity in the National Power System, can be observed.

4. PSH Młoty Economic Efficiency Analysis

4.1. Concept of Economic Analysis

Economic efficiency analysis was performed using the NPV and IRR methods. NPV measures the present value of total cash flows, taking into account the risk (included in the discount rate) of their realization. IRR, in turn, allows you to indicate the limit rate of return, expressed as a percentage, for a NPV = 0. With a NPV > 0 and IRR greater than the discount rate, we obtain a clear decision criterion regarding the economic viability of the investment.
The basis of the above estimation of economic efficiency ratios was the calculation of free cash flows in the FCFF approach (free cash flow to firm), with the reference level of the discount rate corresponding to the WACC of 8%.
The calculation of the economic effectiveness of the analyzed project was supported by the Monte Carlo simulation method. With its help, it is possible to analyze many scenarios simultaneously, while maintaining fundamental relationships between the decision variables. Deterministic, scenario-based methods or methods limited by the range of variability of sensitivity analysis parameters do not offer such possibilities.
What is also important, the use of MCS allows for presenting the economic efficiency of the project in terms of the distribution of forecast (output) variables (NPV and IRR) and the probability of realizing positive discounted cash flows (values). In addition, the rationale for using this approach was the relatively high uncertainty regarding key decision variables (electricity price, capital expenditures, operating costs) and the intention to present (in the efficiency of interdependence) calculation specific variables that represent specific decision behaviors that maximize the operational efficiency of PSH Młoty, that is, the sales mechanism at maximum market prices and energy purchases at local minimums. It is worth mentioning that the correlation between high prices (revenues) and low prices (costs) as well as medium ones is of key importance, influencing the spread between them, which in turn has a decisive impact on the net cash flows.
In this approach, the price forecast is important, although not decisive.
The group of key uncertain variables includes:
  • Revenues in the production phase,
  • Operating costs in the pumping phase, and
  • Market electricity prices on the Polish Power Exchange (TGE).
The Monte Carlo simulation made it possible to present uncertain variables in the form of their statistical distributions. In this case, an empirical copula was used as a mathematical model. The individual models of variables have been linked to each other by correlation patterns in the sense of a copula, defined based on data for the years 2021–2023 (1102 observations). Since very large fluctuations of variables can be observed in this period, it was assumed that these data are able to represent the identified relationships also for future periods (daily price fluctuation in the range of 12–485 EUR/MWh). In this MC simulation and our model, all critical operating parameters (not only prices) of PSH plant are flexible and related with the production scale; they are mathematically (functionally) related.
The D-dimensional copula (C) can be expressed in general as F x 1 ,   x 2 ,   , x d   = C F 1   x 1 , F 2   x 2 , F d   x d , where F 1 , F 2 ,…   F d are the copula’s marginal distributions [67]. The underlying assessment for calculation of the empirical copula is based on the binomial model and order statistics. The empirical copula is not a fitted mathematical model, but rather an empirical model, meaning its shape is entirely driven by the data and there are no underlying model assumptions except that of the randomness of the data [68,69].
Basic relations between electricity prices, pumping costs, and electricity production reveal the following scatter plots (Figure 4). Irregular correlation patterns, indicating a lack of linearity between the variables and a large proportion of variable randomness, can be seen. The lack of strong mathematical relationships between the analyzed variables, in turn, reveals areas of specific operation of PSH as a player on the capacity market. As one may see the correlation pattern is more concise in the case of the pumping process, which means that price and capacity services regime play an important role in selecting the moment and time of pumping. It is also worth mentioning that having in mind capacity services obligation, the ‘space’ for optimization the effect of TGE arbitrage is reduced.
For better understanding the relation between above copulas and single parameters relations, the Spearman rank order correlation matrix was shown in Table 3 which represents the correlation statistics for electricity generation income [EUR/day], pumping cost and average electricity market prices for a specific day in the range of the data set.
The highest correlation coefficients are between the average electricity price, pumping cost and generation income. The higher the correlation coefficient, the more regular and normal is the shape of the empirical copula.
The assessment of economic efficiency was presented for three scenarios in which the share of the market component (energy sales by the Polish Power Exchange—TGE) in total revenues was successively reduced:
Base scenario—assumes full use of provision of capacity services and sale of surplus energy produced, but not received on Polish Power Exchange Polish Power Exchange (TGE),
Active scenario—assumes full use of provision of capacity services and sale of 80% of surplus energy on Polish Power Exchange Polish Power Exchange (TGE),
Passive scenario—assuming the sale of only 60% of energy on Polish Power Exchange Polish Power Exchange (TGE) and full use of the provision of capacity services subsidy.
The purpose of the scenario analysis was to present the deteriorating economic efficiency of the project as a result of the decrease in the share of energy sales on the Polish Power Exchange (TGE) and to emphasize the significant role of the capacity market in the assessment of large-scale energy storage.
Evaluation of the economic efficiency of PSH Młoty assumes a 20-year period of a detailed FCF cash flow forecast and 20 years of estimation of cumulative FCF based on the perpetual annuity model with Terminal Value (TV) for this investment. Assumption of 40 years of installation life based on [61], although PSH may have a longer service life [70].
Estimating the FCF for the 20-year period of the detailed forecast was each time reduced to determining the value of revenues (R), cash operating costs (OPEX), profits (EBITDA, EBIT), taxes (T) and finally—NOPAT (net operating profit after taxes). NOPAT was then adjusted for:
  • Amortization and depreciation of fixed assets: Am,
  • Capital expenditures: CAPEX,
  • Net working capital: NWC, and
  • Residual value: W.
The calculation of profits and cash flows was performed using the following equations:
EBITDA = R OPEX ,
EBIT = EBITDA Am ,
NOPAT = EBIT T ,
FCF = NOPAT + Am CAPEX NWC + W .
All these numbers were given in EUR.
The Terminal Value was in turn estimated using the following formula:
TV = Aver ( FCF 21 : FCF 25 ) d
where
  • TV—the quotient of the average FCF cash flows after the detailed forecast period;
  • TEG—discount rate assumed in the analysis: 8%.
NPV (net present value) was the sum of the discounted FCF free cash flows in the detailed forecast period and the discounted TV at the moment of making the decision.

4.2. Capital Expenditures

Based on literature data [51,61,65], we have estimated basic capital expenditures for PSH Młoty. The total capital expenditures for the project have been calculated at a level of EUR 1332.5 million. These include expenditures related to the development of the necessary infrastructure of the power plant in the amount of EUR 1070 million, expenditures for recreating (capital repairs, overhauls, and refurbishments) of EUR 155.5 million, and a reserve for unexpected expenses and possible price increases in the amount of EUR 107 million. This reserve was calculated on the most uncertain outlays in the construction phase. The structure of capital expenditures for the PSH construction phase is presented below [EUR million]:
Reservoirs:325.0
Tunnels:107.0
Powerhouse and BOP (Balance of Plant) electromechanical:374.5
Other expenditures:107.0
Capital repairs and overhauls:75.2
Capital refurbishments:60.2
The net working capital requirement was defined as a function of inventories, short-term receivables turnover, and short-term liabilities rotation cycles. These cycles were assumed as 30 and 25 days, respectively.

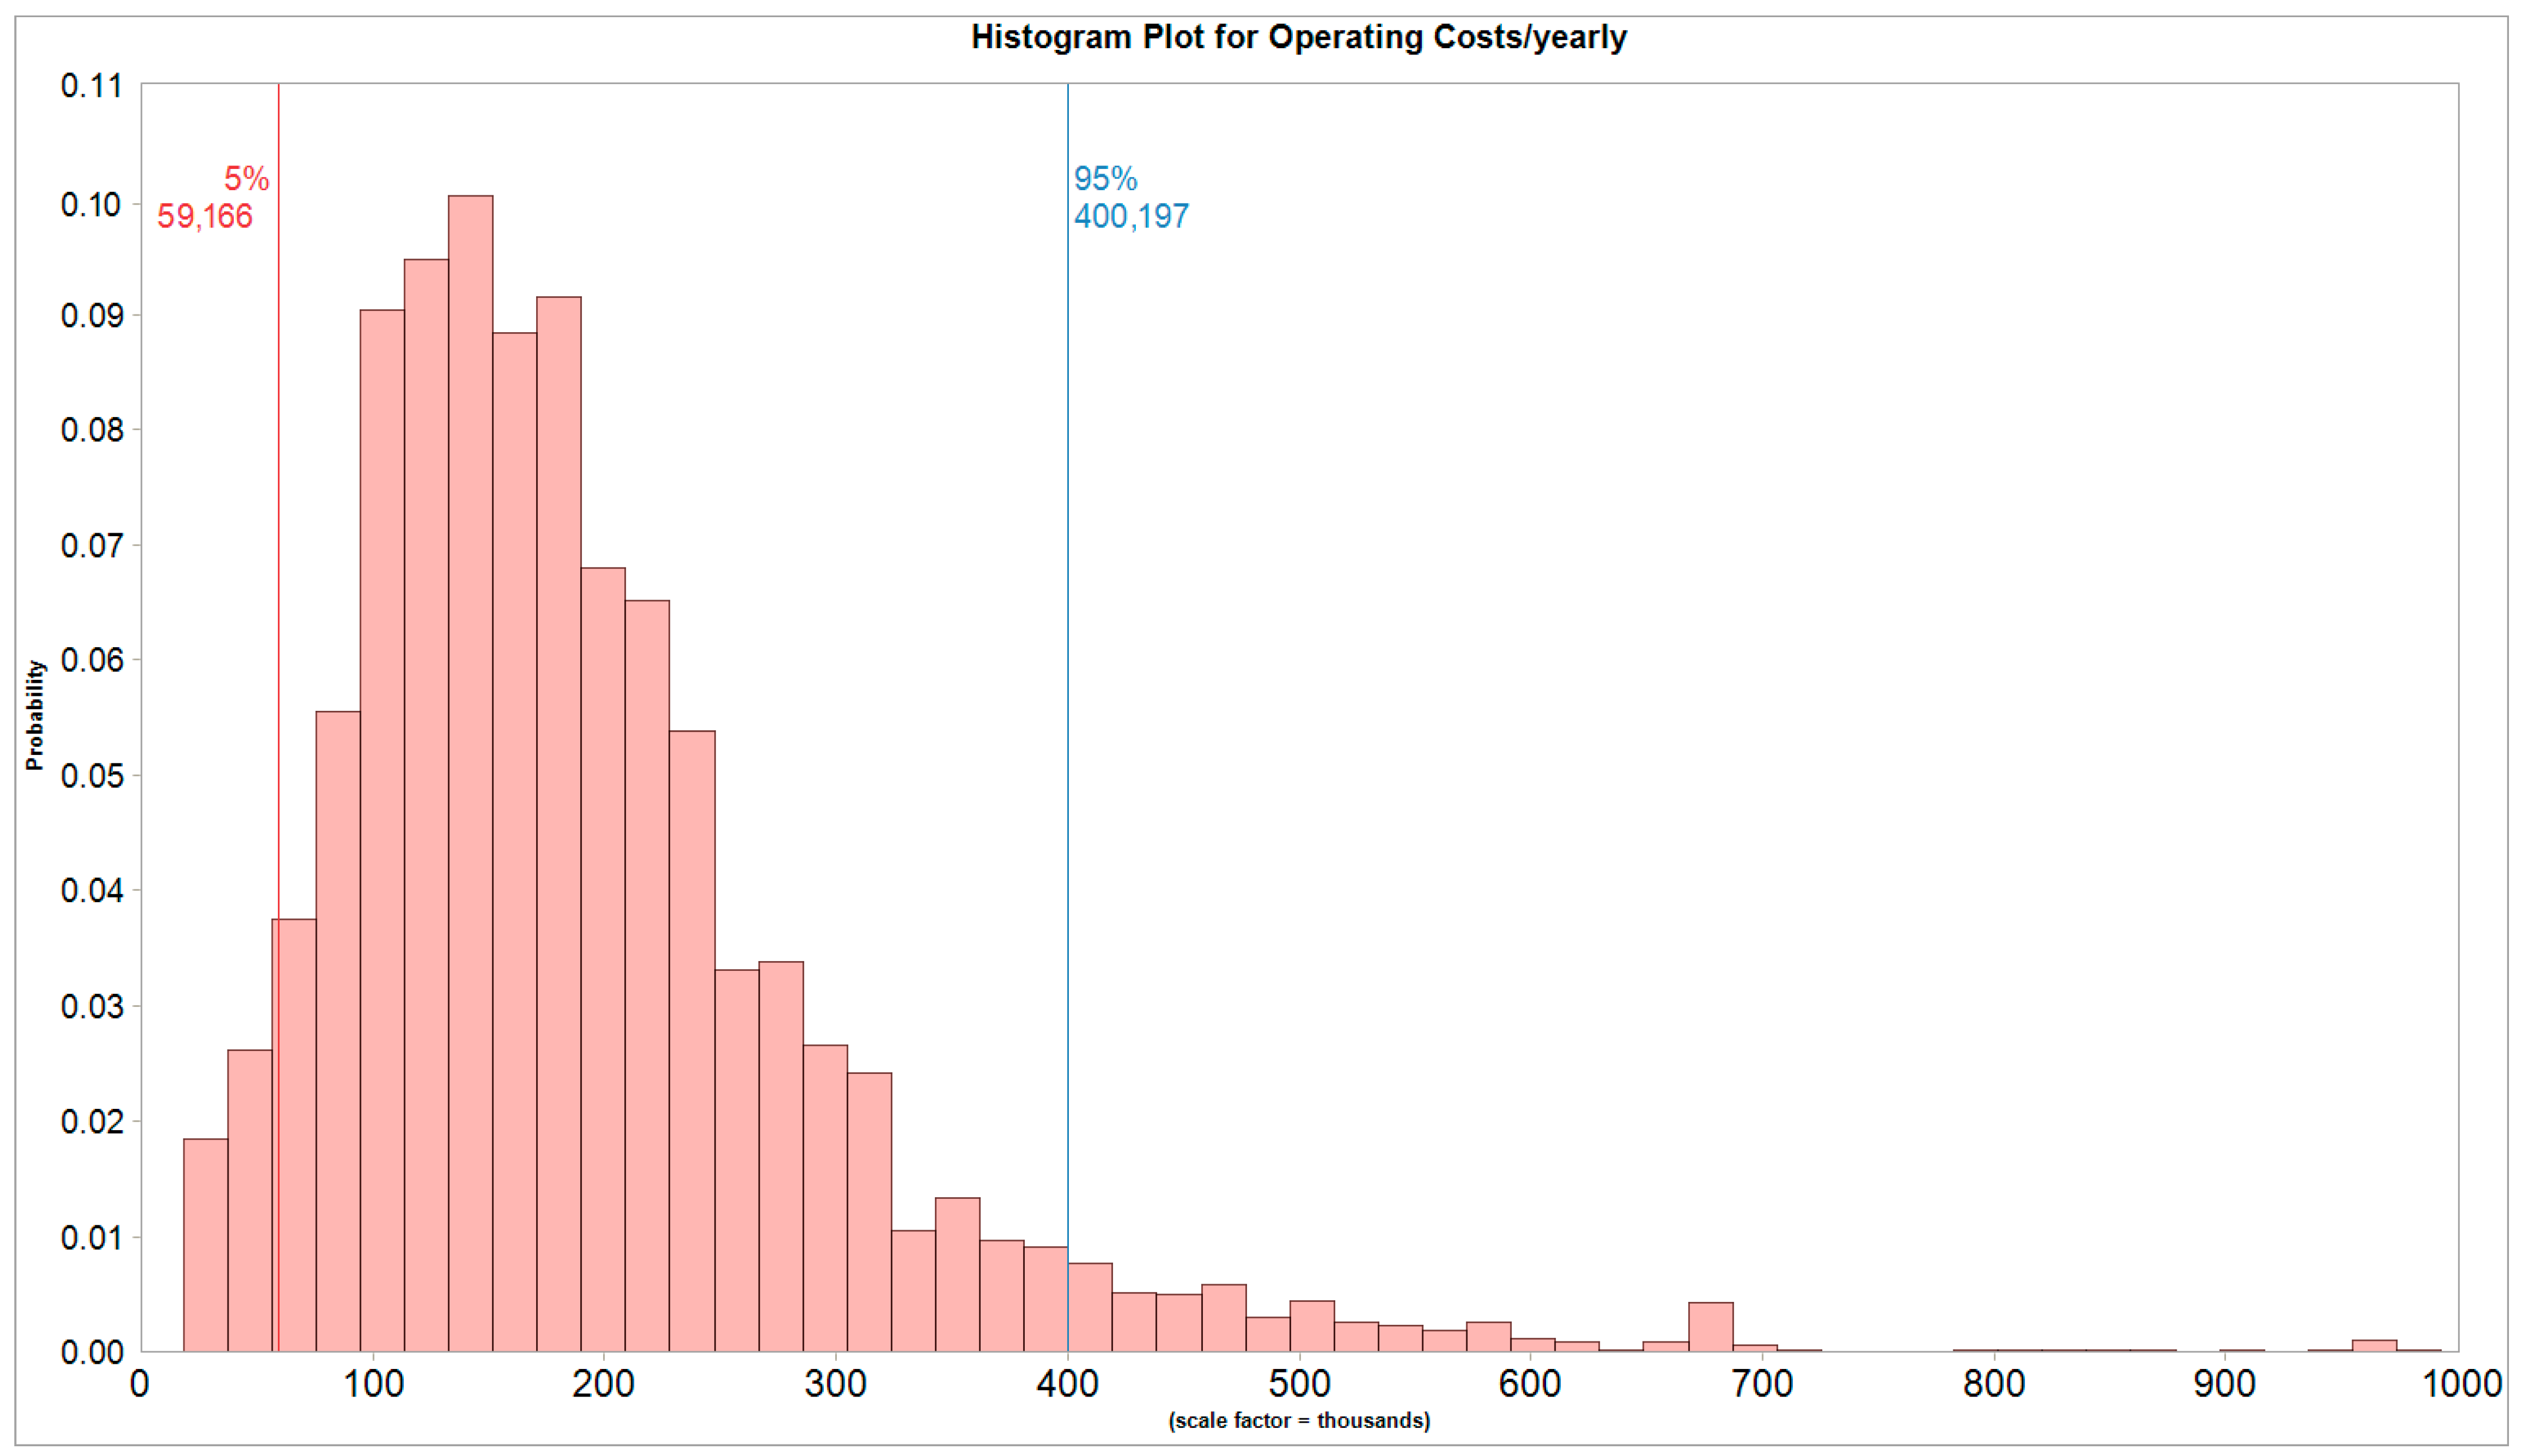
4.3. Annualized Operating Costs

The operational costs of the project consisted mainly of the costs of purchasing electricity for pumping water to the upper reservoir, calculated on the basis of the hourly schedule of pump operation [MWh] and the price of electricity [EUR/MWh] in the hours of electricity demand, and other variable costs calculated as load of approx. 0.6 EUR/MWh of electricity produced. To establish the reference daily electricity price, for simplification, we had to average the series of hourly market electricity prices from the last three years, what is represented in the first part of the Equation (10). These prices were compared with daily average electricity consumption for the pumping process.
Fixed costs, in turn, included the costs of employment, material security, and the purchase of necessary external services constituting a permanent element of the power plant’s operations. Fixed costs also indirectly included depreciation of fixed assets, which was based on balance sheet depreciation rates for a given group (item) of investment expenditures. The formula for the value of total operating costs per year is as follows:
OPEX   t = n = 1 mn ( d = 1 365 ( h = 1 24 mEC h · DAMP h , n ) ) mn + FC + VC  
where
  • OPEX—operational costs of PSH Młoty, EUR/year;
  • n—[1,2,3…mn] iterations;
  • t—years of analysis [1,2,3…40];
  • mEC(h)—average hourly electricity consumption, MWh;
  • DAMP(h,n)—day-ahead price of electricity from three years data set, EUR/MWh;
  • FC—fix costs, EUR/year;
  • VC—variable costs, EUR/year;
  • mn—maximum number of iterations: 10,000;
  • d—number of days;
  • h—number of hours.
Figure 5 presents the resulting distribution of operating costs for the base scenario. The average value was EUR 190.4 million, while the cost values for the 0–90% range correspond to the range of EUR 59–400 million yearly throughout the analysis period.

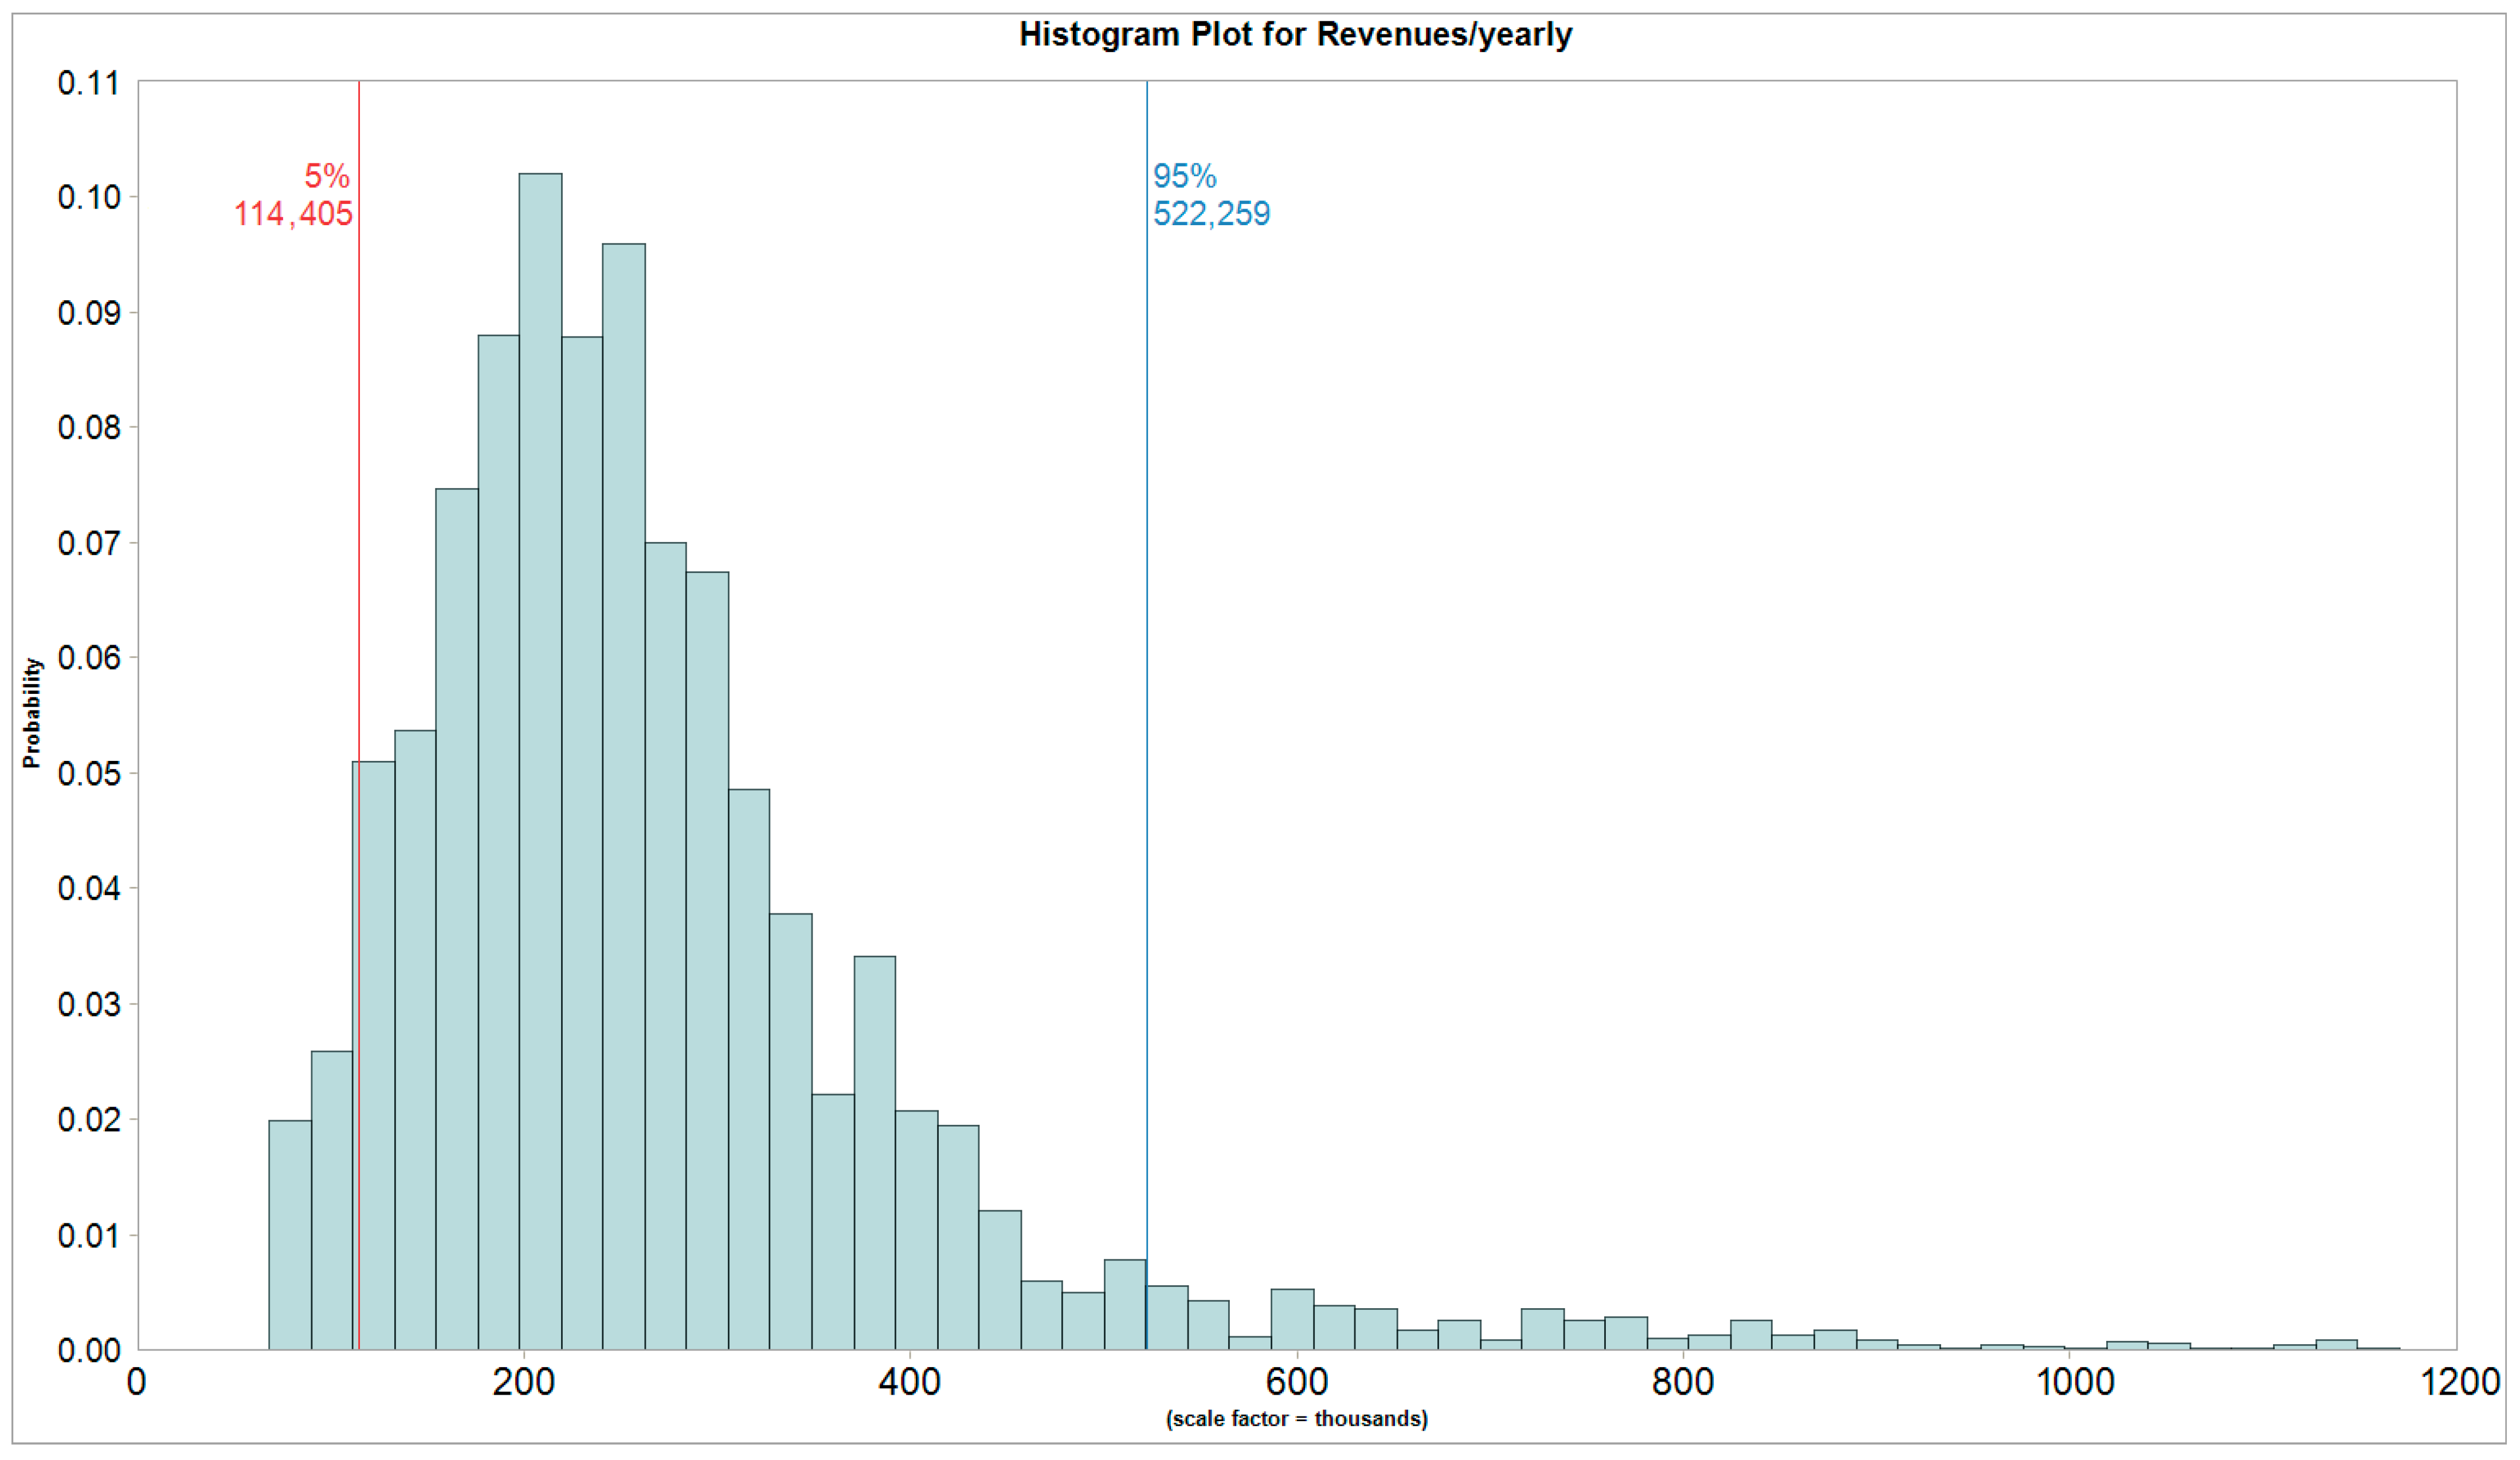
4.4. Annualized Revenues

We have assumed that, depending on the description of the scenario, PSHs can generate revenues from two sources:
The Polish Power Exchange (TGE), and/or
Provision of capacity services in a range of 0–750 MW (CS).
Revenue from the sale of electricity on the market was calculated using the Formula (10). Based on PSE data for three PSHs (Porąbka-Żar, Żarnowiec and Żydowo), the hours of generation mode in the last three years were averaged for every single day; and these volumes of daily averaged electricity production were compared with the determined average daily prices on the Polish Power Exchange (Day-Ahead Market) as a base reference for revenue assessment. Then, with use of Monte Carlo simulation, we have produced 10 thousand outputs to build the plot for daily revenues.
REV   t = n = 1 mn ( d = 1 365 ( h = 1 24 mEG h · DAMP h , n ) ) mn + CS
where
  • REV—revenues from PSH Młoty, EUR;
  • n—[1,2,3…mn] iterations;
  • t—years of analysis [1,2,3…40];
  • mEG(h)—average hourly electricity generation, MWh;
  • DAMP(h,n)—day-ahead price of electricity from three years data set, EUR/MWh;
  • CS—capacity services, EUR/year;
  • mn—maximum number of iterations: 10,000;
  • d—number of days;
  • h—number of hours.
In addition, revenues resulting from the capacity market (CS), which is a market mechanism designed to provide the country’s energy security and continuity of electricity supplies, were encountered. Participating in the capacity market means that the generating units, covered by it, are obliged to be ready to generate electricity and deliver it to the system during the call-up period for appropriate pay. In December 2022, PGE Energia Odnawialna contracted three generating units in the main auction of the capacity market for the supply year 2027 [71]. The system operator (PSE) initially concluded contracts for the provision of capacity services by the Porąbka-Żar, Solina and Tresna power plants with a guaranteed price of PLN 406.35/kW/year (EUR 90.3/kW/year). On this basis, the price for the provision of capacity services was assumed and various variants of possible contracts were analyzed (from 0 to 750 MW).
Figure 6 presents the resulting distribution of revenues for the baseline scenario. The average value was EUR 267.2 million, while the cost values for the range of 0–90% of all observations ranged from EUR 114 to 522 million yearly throughout the analysis period.

5. Results

Here, we present the results of the economic evaluation of the analyzed scenario, reflected in the values of the NPV and IRR distributions.
Figure 7 shows the distribution of the resulting NPV. The expected NPV for the base scenario was EUR 884.4 million, and the probability of achieving a NPV > 0 resulted at 91%. The obtained distribution is relatively symmetrical, although with a significant concentration of observations round the central values (skewness of 0.6, kurtosis close to 6).
The expected value of the internal rate of return was 11.1% (at the discount rate of 8%). The 90% confidence interval for the IRR includes observations for the range of values 2.1–19.3%. The distribution has a slight right-sided asymmetry. In this context the expected IRR is greater than the discount rate and supports possible investment decision. It is also worth mentioning that with certainty over 97% one can be sure that the IRR will be positive, and with the portability over then 74% the IRR will be higher than the discount rate (Figure 8).

6. Discussion

The study of Chazarra et al. [12] evaluated the economic feasibility of twelve closed-loop and daily-cycle pumped storage hydroelectric plants equipped with different technologies. Results indicate that most of these plants have theoretical payback periods shorter than their operational lifetime if the investment cost remains below 2.5 MEUR/MW. The authors concluded that therefore economic viability is not discarded. Pumped storage hydroelectric plants utilizing variable speed technology and full converters, especially those capable of hydraulic short-circuit operation, show the shortest pay-back periods. The study also demonstrates that incorporating variable speed technology or hydraulic short-circuit operation significantly reduces the pay-back periods. Furthermore, the optimized PSHP models project higher potential income compared to existing PSHPs in the Iberian system, emphasizing their economic potential.
In our work, we did not analyze various PSHs operating technologies (e.g., variable turbine speed). This may be a topic for further research direction. In our work, we also proposed capital expenditures below EUR 2.5 M/MW and an analysis period in which the investment (in over 90% of simulations) is profitable.
Abdellatif et al. [14] in their study, explored the economic competitiveness of pumped storage hydroelectric power plants compared to steam cycle gas turbine (SCGT) power plants. The findings indicate that the plants of the first type one do not exhibit absolute economic superiority over the other type of plants; however, the viability of constructing the first type of plants varies based on different factors and conditions. Specifically, in Egypt’s electricity sector, where fuel prices for steam cycle gas turbine plants are subsidized by the government, there is currently no urgent need to invest in PSHPPs like those in the analyzed Attaqa Mountain. The economic advantage of pumped storage hydroelectric power plants technology becomes apparent when international fossil fuel prices are considered, alongside the significant foreign currency expenditure associated with fuel imports for non-electricity sectors. Enhancing hydroelectric power plants competitiveness can also be achieved by reducing pumping costs, a strategic decision that can be influenced by government policies. Also, according to authors, hydroelectric power plants become more competitive when installation limitations and conditions in Egypt are relaxed. To fully exploit the benefits of pumped storage hydroelectric power plants as a clean energy source, the study suggests implementing a dual-tariff structure to maximize economic advantages and promote sustainable energy development.
The results presented in the aforementioned article by Abdellatifa et al. [14] served as one of the inspirations for our article, particularly regarding the economic complexity of utilizing controlled and flexible sources versus large-scale electrical energy storage. Our inspiration stemmed from focusing on PSH rather than balancing sources, as seen in articles such as that by Kryzia et al. [72] Additionally, we analyzed the electricity market (relatively similar to that in Europe [73]) and the capacity market in Poland [74,75].
In another study, Richter et al. [42] focused on studying and achieving a 100% renewable electricity system for Germany. They focused on different ways of producing renewables energy, but mainly on pumped storage hydropower plants. The findings highlight that pumped storage hydropower emerges as the most cost-effective and sustainable energy storage technology, maximizing the efficient utilization of renewable energy sources and minimizing carbon emissions. The study emphasizes that optimal locations for pumped storage schemes, such as those in Norway with favorable rock formations and topography, offer the lowest costs and highest efficiency. Research demonstrates that upgrading existing pumped storage schemes in the Alps and implementing underground pumped storage hydropower in areas lacking suitable topography can provide cost-effective solutions for energy storage and capacity expansion compared to alternative technologies. The study advocates for an asymmetric storage approach, leveraging passive energy storage in existing hydro reservoirs and constructing new pumped storage schemes, to optimize resource utilization and mitigate overproduction, representing the most economical strategy. Overall, the results of this research provide compelling evidence to policymakers and stakeholders, demonstrating that hydropower storage schemes are vital for sustaining the transition to a fully renewable energy system while offering critical benefits for electric system stability and mitigating system expenditures.
Comparing the analysis conducted by Richter et al. with our own analyses, we also operate with the aim of increasing the share of renewable energy sources (RES). This requires more pumped storage hydroelectricity (PSH), as demonstrated in the work of Olczak and Matuszewska [7]. Additionally, we intend to utilize low-cost technology in mountainous regions within our proposal. Nevertheless, doubts have been raised regarding the economic feasibility.
Cooperation in the power system of pumped storage power plants with thermal power plants and uncontrollable renewable energy installations was described and studied by Lewandowski et al. [48]. This brings measurable technical and economic effects related to the reduction in operating costs in thermal power plants as a result of, among others, the so-called “calming” of the operation of thermal power plants and limiting the forced operation of thermal units to a technical minimum in the event of excess power generated by uncontrollable RES installations. The authors emphasized that the successful introduction of technical solutions enabling the operation of hydro units in the low load range significantly improved their controllability, but the production efficiency in this area remained very low. In the conclusions of the work, the authors stated that regardless of the solutions implemented in thermal energy based on solid fuel, the role of pumped storage power plants in developed power systems is constantly increasing. The use of regulation of active power consumed in pumping operation opens new regulatory possibilities in the operation of the power system, strengthens the position of pumped storage power plants on the energy market and reduces the costs of generating electricity in the system. Hydroelectric power plants connected to the grid of electricity distribution systems have significant regulatory power and the ability to store energy in water reservoirs. The use of these resources and, where possible, their increase by retrofitting pump units with variable-speed systems would bring significant technical and economic effects both in area power systems and in water management in the region, which is very important.
As the authors pointed out, the construction of new PSHs is necessary in the context of the development of renewable energy sources and the presence of large thermal units in the Polish power system with limited flexibility of the operating system. The use of regulation of active power consumed in pumping operation and retrofitting pump units with variable-speed systems may be another advantage in assessing the economic result and constitute a direction for further research.

7. Conclusions

In conclusion, we state that the economic efficiency of the PSH Młoty can be positive. The expected NPV for the analyzed scenario was assumed at EUR 884.4 million, with the probability of achieving a NPV > 0 of 91%. The probability of the IRR allowing for successful investment decision is over 74%. The economic effect is influenced more by the volatility of the electricity price than a function of its reference value. The electricity price is the fundamental component of the operational costs of the pumping process.
For the distribution of the resulting NPV for the alternative scenario (Appendix A, Figure A1) the share of revenues from the Polish Power Exchange (TGE) reaches only 60%. The expected NPV for this scenario was EUR 226.6 million, and the probability of achieving a NPV > 0 was approximately 68%. However, the expected value decreases significantly compared to the scenario that assumes full use of the capacity services with reduced electricity selling strategy on the TGE.
In turn, distribution of the resulting NPV for the scenario (Appendix A, Figure A2), where 100% of total revenues are the result of capacity services, is negative and was EUR −769.4 million, and the probability of achieving a NPV > 0 was less than 15%. The expected NPV is negative, and the investment decision would be negative too.
Price arbitrage alone is not sufficient to achieve economic viability, but is the most influencing component of the net present value. The revenues from capacity market play a fundamental role, but with no fully effective price arbitrage, the range of the net revenues and cash flows is very limited.
The investment decision is therefore ambiguous in the baseline scenario. With the IRR lower than the discount rate, the NPV is negative in the first period of the analysis and significantly positive in the second. In order to clarify the existing doubts, it would be necessary to consider assessing the project using the real option method and/or it would be necessary to optimize the investment approaches for different assumptions as to the scale and business model of this power plant operation (e.g., by building our own RES plant).
The direction of further research is also related to this issue, i.e., the impact of increasing the production of electricity from renewable energy sources on the potential economic profitability of building a new PSH plant.

Author Contributions

Conceptualization, J.K. and P.O.; methodology, J.K., M.K. and P.O.; software, M.K.; validation, J.K., K.S. and M.K.; formal analysis, M.K. and K.S.; investigation, P.O.; resources, J.K.; data curation, J.K.; writing—original draft preparation, K.S., J.K, M.K. and P.O.; writing—review and editing, K.S.; visualization, J.K., M.K. and P.O.; supervision, P.O.; project administration, J.K.; funding acquisition, M.K. All authors have read and agreed to the published version of the manuscript.

Funding

This research received no external funding.

Data Availability Statement

The original contributions presented in the study are included in the article, further inquiries can be directed to the corresponding author.

Conflicts of Interest

The authors declare no conflicts of interest.

Appendix A

Figure A1. Distribution of the resulting NPV for PSH in the active scenario (own study).
Energies 17 01830 g0a1
Figure A2. Distribution of the resulting NPV for PSH in the passive scenario (own study).
Energies 17 01830 g0a2
Based on a comparison of the generation volume in the three PSHs analyzed, their capacity (potential energy of water expressed in MWh) and the theoretical number of annual cycles, it was calculated that the effective (conversion value) annual number of cycles was 115.26 in 2021, 154.4 in 2022, 191.88 in 2023 and 153.8 in total in the last three years.
Using the assumed theoretical annual generation of electricity and the effective (conversion value) annual number of cycles (estimated on the data from 2021–2023 for the three existing Polish PSHs), the actual annual electricity production was calculated—it was 537 GWh (with the assumed RTE efficiency = 77.3%, the annual energy consumption for pumping would be 695 GWh).
Based on the analysis of the operation of the three existing PSHs and the difference in prices and energy volumes between generation and pumping, together with the assumption of price differences, it was assumed that PSH Młoty could generate revenues of EUR 26.44 million per year. The basic assumptions for the analysis of the resumption of the PSH Młoty construction are presented in Table A1.
Table A1. Assumptions for economic analysis for PSH Młoty.
SpecificationUnitValue
The power of the power plantMW750
Capacity, SCMWh3500
Theoretical annual energy production, TEGGWh1275
Actual annual energy production, EEGGWh573
Round-trip efficiency (RTE), %%77.3
Figure A3 shows a simple return time for the Młoty PSH construction, assuming a constant level of annual operating costs, constant revenues such as the balance of energy consumption and production at different times of the day, and variable revenues obtained at capacity market auctions (variable contracted power and price level at the capacity market auction). Variable value of revenue from capacity market is the result of auction course and decision which volume of output power form PSH is expected to be on capacity market.
Figure A3. Simple return time for the construction of Młoty PSH, assuming variable revenues obtained at Power Market auctions (output power from PSH for at least 4 h per day).
Energies 17 01830 g0a3

References

  1. Le, T.S.; Nguyen, T.N.; Bui, D.-K.; Ngo, T.D. Optimal sizing of renewable energy storage: A techno-economic analysis of hydrogen, battery and hybrid systems considering degradation and seasonal storage. Appl. Energy 2023, 336, 120817. [Google Scholar] [CrossRef]
  2. Liu, J.; Zhou, Y.; Yang, H.; Wu, H. Net-zero energy management and optimization of commercial building sectors with hybrid renewable energy systems integrated with energy storage of pumped hydro and hydrogen taxis. Appl. Energy 2022, 321, 119312. [Google Scholar] [CrossRef]
  3. Komorowska, A.; Olczak, P.; Hanc, E.; Kamiński, J. An analysis of the competitiveness of hydrogen storage and Li-ion batteries based on price arbitrage in the day-ahead market. Int. J. Hydrogen Energy 2022, 47, 28556–28572. [Google Scholar] [CrossRef]
  4. Komorowska, A.; Benalcazar, P.; Kamiński, J. Evaluating the competitiveness and uncertainty of offshore wind-to-hydrogen production: A case study of Poland. Int. J. Hydrogen Energy 2023, 48, 14577–14590. [Google Scholar] [CrossRef]
  5. IEA Grid-Scale Storage. Available online: https://www.iea.org/data-and-statistics/charts/annual-grid-scale-battery-storage-additions-2017-2022 (accessed on 12 July 2023).
  6. Niewiński, G.; Rajewski, A. Ekonomiczne uwarunkowania pracy elektrowni szczytowej na paliwa gazowe w Krajowym Systemie Elektroenergetycznym. Nierówności Społeczne A Wzrost Gospod. 2018, 54, 403–424. [Google Scholar] [CrossRef]
  7. Olczak, P.; Matuszewska, D. Energy Storage Potential Needed at the National Grid Scale (Poland) in Order to Stabilize Daily Electricity Production from Fossil Fuels and Nuclear Power. Energies 2023, 16, 6054. [Google Scholar] [CrossRef]
  8. Blakers, A.; Stocks, M.; Lu, B.; Cheng, C. A review of pumped hydro energy storage. Prog. Energy 2021, 3, 022003. [Google Scholar] [CrossRef]
  9. Dzikuć, M.; Gorączkowska, J.; Piwowar, A.; Dzikuć, M.; Smoleński, R.; Kułyk, P. The analysis of the innovative potential of the energy sector and low-carbon development: A case study for Poland. Energy Strateg. Rev. 2021, 38, 100769. [Google Scholar] [CrossRef]
  10. Rola Elektrowni Szczytowopompowych w Krajowym Systemie Elektroenergetycznym: Uwarunkowania i Kierunki Rozwoju; Warsaw, Poland. 2022. Available online: https://www.gov.pl/attachment/5560c5ac-fdc9-46e0-bf06-eb0dabd113dd (accessed on 10 May 2023).
  11. Pasqualetti, M.; Stremke, S. Energy landscapes in a crowded world: A first typology of origins and expressions. Energy Res. Soc. Sci. 2018, 36, 94–105. [Google Scholar] [CrossRef]
  12. Chazarra, M.; Pérez-Díaz, J.I.; García-González, J.; Praus, R. Economic viability of pumped-storage power plants participating in the secondary regulation service. Appl. Energy 2018, 216, 224–233. [Google Scholar] [CrossRef]
  13. Chazarra, M.; Pérez-Díaz, J.I.; García-González, J. Economic Viability of Pumped-Storage Power Plants Equipped with Ternary Units and Considering Hydraulic Short-Circuit Operation. J. Phys. Conf. Ser. 2017, 813, 012013. [Google Scholar] [CrossRef]
  14. Abdellatif, D.; AbdelHady, R.; Ibrahim, A.M.; El-Zahab, E.A. Conditions for economic competitiveness of pumped storage hydroelectric power plants in Egypt. Renew. Wind Water Sol. 2018, 5, 2. [Google Scholar] [CrossRef]
  15. Madlener, R.; Specht, J.M. An Exploratory Economic Analysis of Underground Pumped-Storage Hydro Power Plants in Abandoned Coal Mines; E.ON Energy Research Center, RWTH Aachen University: Aachen, Germany, 2013. [Google Scholar]
  16. Madlener, R.; Specht, J.M. An Exploratory Economic Analysis of Underground Pumped-Storage Hydro Power Plants in Abandoned Deep Coal Mines. Energies 2020, 13, 5634. [Google Scholar] [CrossRef]
  17. Sivakumar, N.; Das, D.; Padhy, N.P. Economic analysis of Indian pumped storage schemes. Energy Convers. Manag. 2014, 88, 168–176. [Google Scholar] [CrossRef]
  18. Henden, A.L.; Doorman, G.; Helseth, A. Economic Analysis of Large-Scale Pumped Storage Plants in Norway. Energy Procedia 2016, 87, 116–123. [Google Scholar] [CrossRef]
  19. Zeng, M.; Feng, J.; Xue, S.; Wang, Z.; Zhu, X.; Wang, Y. Development of China’s pumped storage plant and related policy analysis. Energy Policy 2013, 61, 104–113. [Google Scholar]
  20. Ko, Y.; Choi, G.; Lee, S.; Kim, S. Economic analysis of pumped hydro storage under Korean governmental expansion plan for renewable energy. Energy Rep. 2020, 6, 214–220. [Google Scholar] [CrossRef]
  21. Deane, J.P.; Ó Gallachóir, B.P.; McKeogh, E.J. Techno-economic review of existing and new pumped hydro energy storage plant. Renew. Sustain. Energy Rev. 2010, 14, 1293–1302. [Google Scholar] [CrossRef]
  22. Bayazıt, Y.; Bakış, R.; Koç, C. A study on transformation of multi-purpose dams into pumped storage hydroelectric power plants by using GIS model. Int. J. Green Energy 2021, 18, 308–318. [Google Scholar] [CrossRef]
  23. Xu, B.; Zhang, J.; Egusquiza, M.; Zhang, J.; Chen, D.; Egusquiza, E. Exploring the Regulation Reliability of a Pumped Storage Power Plant in a Wind–Solar Hybrid Power Generation System. Water 2021, 13, 2548. [Google Scholar] [CrossRef]
  24. Mennemann, J.-F.; Marko, L.; Schmidt, J.; Kemmetmüller, W.; Kugi, A. Nonlinear model predictive control of a variable-speed pumped-storage power plant. IEEE Trans. Control Syst. Technol. 2019, 29, 645–660. [Google Scholar] [CrossRef]
  25. Wu, Y.; Zhang, T.; Xu, C.; Zhang, B.; Li, L.; Ke, Y.; Yan, Y.; Xu, R. Optimal location selection for offshore wind-PV-seawater pumped storage power plant using a hybrid MCDM approach: A two-stage framework. Energy Convers. Manag. 2019, 199, 112066. [Google Scholar] [CrossRef]
  26. Fu, X.; Li, D.; Wang, H.; Yang, J.; Wei, X. Multi-objective optimization of guide vane closure scheme in clean pumped-storage power plant with emphasis on pressure fluctuations. J. Energy Storage 2022, 55, 105493. [Google Scholar] [CrossRef]
  27. Pérez-Díaz, J.I.; Lafoz, M.; Burke, F. Integration of fast acting energy storage systems in existing pumped-storage power plants to enhance the system’s frequency control. Wiley Interdiscip. Rev. Energy Environ. 2020, 9, e367. [Google Scholar] [CrossRef]
  28. Holzer, T.; Muetze, A.; Traxler-Samek, G.; Lecker, M.; Zerobin, F. Generator design possibilities for full-size converter operation of large pumped storage power plants. IEEE Trans. Ind. Appl. 2020, 56, 3644–3655. [Google Scholar] [CrossRef]
  29. Mukhammadiev, M.M.; Dzhuraev, K.S. Justification of the energy and economic parameters of pumped storage power plants in Uzbekistan. Appl. Sol. Energy 2020, 56, 227–232. [Google Scholar] [CrossRef]
  30. Rezghi, A.; Riasi, A. The interaction effect of hydraulic transient conditions of two parallel pump-turbine units in a pumped-storage power plant with considering “S-shaped” instability region: Numerical simulation. Renew. Energy 2018, 118, 896–908. [Google Scholar] [CrossRef]
  31. Savchyn, I.; Vaskovets, S. Local geodynamics of the territory of Dniester pumped storage power plant. Acta Geodyn. Geomater. 2018, 15, 189. [Google Scholar] [CrossRef]
  32. Urishev, B. Selection of parameters of pumped storage power plants at large pumping stations for water use. Appl. Sol. Energy 2018, 54, 477–480. [Google Scholar] [CrossRef]
  33. Nasir, J.; Javed, A.; Ali, M.; Ullah, K.; Kazmi, S.A.A. Capacity optimization of pumped storage hydropower and its impact on an integrated conventional hydropower plant operation. Appl. Energy 2022, 323, 119561. [Google Scholar] [CrossRef]
  34. Botterud, A.; Levin, T.; Koritarov, V. Pumped Storage Hydropower: Benefits for Grid Reliability and Integration of Variable Renewable Energy; Argonne National Laboratory: Argonne, IL, USA, 2014.
  35. Wessel, M.; Madlener, R.; Hilgers, C. Economic feasibility of semi-underground pumped storage hydropower plants in open-pit mines. Energies 2020, 13, 4178. [Google Scholar] [CrossRef]
  36. Luick, H.; Niemann, A.; Perau, E.; Schreiber, U. Coalmines as Underground Pumped Storage Power Plants (UPP)—A contribution to a sustainable energy supply. Proc. Geophys. Res. Abstr. 2012, 14, 4205. [Google Scholar]
  37. Peczkis, G. Practical possibilities of pumped-storage power plants implementation in liquidated underground mines. J. Power Technol. 2021, 101, 4. [Google Scholar]
  38. Dyczko, A.; Kamiński, P.; Stecuła, K.; Prostański, D.; Kopacz, M.; Kowol, D. Thermal and mechanical energy storage as a chance for energy transformation in Poland. Polityka Energ. Energy Policy J. 2021, 24, 43–60. [Google Scholar] [CrossRef]
  39. Kulpa, J.; Kamiński, P.; Stecuła, K.; Prostański, D.; Matusiak, P.; Kowol, D.; Kopacz, M.; Olczak, P. Technical and Economic Aspects of Electric Energy Storage in a Mine Shaft—Budryk Case Study. Energies 2021, 14, 7337. [Google Scholar] [CrossRef]
  40. Saigustia, C.; Robak, S. Review of Potential Energy Storage in Abandoned Mines in Poland. Energies 2021, 14, 6272. [Google Scholar] [CrossRef]
  41. Kozieł, J.; Majka, M.; Wac-Włodarczyk, A.; Naglak, K. Optimization of the wind farm structure through the use of PV installations and the use of pumped storage power plants. Przegląd Elektrotechniczny 2022, 98, 86–89. [Google Scholar] [CrossRef]
  42. Richter, W.; Pikl, F.; Zenz, G.; Vereide, K.; Pummer, E.; Lia, L. Economic and sustainable energy transition enabled by pumped-storage hydropower plants. In Proceedings of the Hydro Conference 2020, Strasbourg, France, 26–28 October 2020. [Google Scholar]
  43. Tedla, F.K.; Wieprecht, S.; Gillies, I. The Role of Pumped Storage Hydropower in Improving the Integration of Generation from Renewable Sources–The Case of Germany. In Proceedings of the HYDRO 2017, Seville, Spain, 9–11 October 2017. [Google Scholar]
  44. Kubiak-Wójcicka, K.; Szczęch, L. Exploitation of Rivers in Poland for Electricity Production–Current Condition and Perspectives for Development. In Management of Water Resources in Poland; Springer: Cham, Switzerland, 2021; pp. 327–355. [Google Scholar]
  45. Kubiak-Wójcicka, K.; Szczęch, L. Dynamics of electricity production against the backdrop of climate change: A case study of hydropower plants in Poland. Energies 2021, 14, 3427. [Google Scholar] [CrossRef]
  46. Kuta, M. Mobilized thermal energy storage (M-TES) system design for cooperation with geothermal energy sources. Appl. Energy 2023, 332, 120567. [Google Scholar] [CrossRef]
  47. Tyryk, M. Simulation of Static Excitation System of a Hydrogenerator of a Pumped Storage Power Plant in Żarnowiec; Institute of Heat Engineering, Warsaw University of Technology: Warsaw, Poland, 2022. [Google Scholar]
  48. Lewandowski, S.; Lewandowski, M.; Steller, J. Hydrozespoły odwracalne o zmiennej prędkości obrotowej–możliwości i korzyści techniczno-ekonomiczne. Napędy Sterow. 2021, 23, 91–101. [Google Scholar]
  49. Igliński, B.; Krukowski, K.; Mioduszewski, J.; Pietrzak, M.B.; Skrzatek, M.; Piechota, G.; Wilczewski, S. Assessment of the Current Potential of Hydropower for Water Damming in Poland in the Context of Energy Transformation. Energies 2022, 15, 922. [Google Scholar] [CrossRef]
  50. Twaróg, B. Modelling of the Solina-Myczkowce pumped storage power plant. Tech. Trans. 2023, 120, 1–11. [Google Scholar] [CrossRef] [PubMed]
  51. Rotkegel, M.; Szot, Ł.; Sobczak, D. Ograniczenie ryzyka utraty stateczności obudowy w wyrobiskach Elektrowni Szczytowo-Pompowej „Młoty”. Wiadomości Górnicze 2017, 2, 112–120. [Google Scholar]
  52. Kowalski, E.; Rotkegel, M.; Stałęga, S. Uwarunkowania geologiczno-inżynierskie wznowienia budowy elektrowni szczytowo-pompowej koło Bystrzycy Kłodzkiej. Górnictwo Geonżynieria 2008, 32, 213–226. [Google Scholar]
  53. DZIENNIK URZĘDOWY RZECZYPOSPOLITEJ POLSKIEJ Zarządzenie nr 351 Prezesa Rady Ministrów z Dnia 28 Grudnia 2021 r. w Sprawie Zespołu Eksperckiego do Spraw Budowy Elektrowni Szczytowo-Pompowych, Warsaw, Poland. Available online: https://isap.sejm.gov.pl/isap.nsf/DocDetails.xsp?id=WMP20220000006 (accessed on 1 February 2022).
  54. Zarębska, J.; Dzikuć, M. Determining the environmental benefits of life cycle assessment (LCA) on example of the power industry. Sci. J. Marit. Univ. Szczecin 2013, 34, 97–102. [Google Scholar]
  55. PSE. Dane Systemowe. Available online: https://www.pse.pl/dane-systemowe (accessed on 18 July 2023).
  56. PSE. Praca KSE-Generacja Mocy Jednostek Wytwórczych. Available online: https://www.pse.pl/dane-systemowe/funkcjonowanie-kse/raporty-dobowe-z-pracy-kse/generacja-mocy-jednostek-wytworczych (accessed on 12 February 2024).
  57. PSE. Plan Rozwoju w Zakresie Zaspokojenia Obecnego i Przyszłego Zapotrzebowania na Energię Elektryczną na Lata 2023–2032; PSE: Konstancin-Jeziorna, Poland, 2022. [Google Scholar]
  58. Ibrahim, H.; Ilinca, A.; Perron, J. Energy storage systems—Characteristics and comparisons. Renew. Sustain. Energy Rev. 2008, 12, 1221–1250. [Google Scholar] [CrossRef]
  59. Berrada, A.; Loudiyi, K. Operation, sizing, and economic evaluation of storage for solar and wind power plants. Renew. Sustain. Energy Rev. 2016, 59, 1117–1129. [Google Scholar] [CrossRef]
  60. U.S. Energy Information and Administration. Today in Energy. Available online: https://www.eia.gov/todayinenergy/ (accessed on 18 July 2023).
  61. Bowen, T.; Chernyakhovskiy, I.; Xu, K.; Gadzanku, S.; Coney, K. USAID Grid-Scale Energy Storage Technologies Primer; NREL: Golden, CO, USA, 2021.
  62. Aneke, M.; Wang, M. Energy storage technologies and real life applications–A state of the art review. Appl. Energy 2016, 179, 350–377. [Google Scholar] [CrossRef]
  63. Zakeri, B.; Syri, S. Electrical energy storage systems: A comparative life cycle cost analysis. Renew. Sustain. Energy Rev. 2015, 42, 569–596. [Google Scholar] [CrossRef]
  64. Frate, G.F.; Ferrari, L.; Desideri, U. Energy storage for grid-scale applications: Technology review and economic feasibility analysis. Renew. Energy 2021, 163, 1754–1772. [Google Scholar] [CrossRef]
  65. Mongird, K.; Viswanathan, V.; Alam, J.; Vartanian, C.; Sprenkle, V.; Baxter, R. 2020 Grid Energy Storage Technology Cost and Performance Assessment; 2020. Available online: https://www.pnnl.gov/sites/default/files/media/file/Final%20-%20ESGC%20Cost%20Performance%20Report%2012-11-2020.pdf (accessed on 10 June 2023).
  66. TGE SA Polish Day-Ahead Market. Available online: http://tge.pl/electricity-dam (accessed on 18 July 2023).
  67. Cherubini, U.; Luciano, E.; Vecchiato, W. Copula Methods in Finance; John Wiley & Sons: Hoboken, NJ, USA, 2004; ISBN 0-47-086345-5. [Google Scholar]
  68. Vose, D. Risk Analysis: A Quantitative Guide; John Wiley & Sons: Hoboken, NJ, USA, 2008; ISBN 0-47-051284-9. [Google Scholar]
  69. Kopacz, M.; Kulpa, J.; Galica, D.; Dyczko, A.; Jarosz, J. Economic valuation of coal deposits—The value of geological information in the resource recognition process. Resour. Policy 2019, 63, 101450. [Google Scholar] [CrossRef]
  70. Immendoerfer, A.; Tietze, I.; Hottenroth, H.; Viere, T. Life-cycle impacts of pumped hydropower storage and battery storage. Int. J. Energy Environ. Eng. 2017, 8, 231–245. [Google Scholar] [CrossRef]
  71. PGE Energia Odnawialna, S.A. Trzy Elektrownie PGE Energia Odnawialna z Kontraktami Rynku Mocy. Available online: https://pgeeo.pl/aktualnosci/trzy-elektrownie-pge-energia-odnawialna-z-kontraktami-rynku-mocy (accessed on 10 April 2023).
  72. Kryzia, D.; Kopacz, M.; Kryzia, K. The Valuation of the Operational Flexibility of the Energy Investment Project Based on a Gas-Fired Power Plant. Energies 2020, 13, 1567. [Google Scholar] [CrossRef]
  73. Komorowska, A.; Olczak, P. Economic viability of Li-ion batteries based on the price arbitrage in the European day-ahead markets. Energy 2024, 290, 130009. [Google Scholar] [CrossRef]
  74. Benalcazar, P.; Komorowska, A.; Kamiński, J. A GIS-based method for assessing the economics of utility-scale photovoltaic systems. Appl. Energy 2024, 353, 122044. [Google Scholar] [CrossRef]
  75. Kaszyński, P.; Komorowska, A.; Kamiński, J. Revisiting Market Power in the Polish Power System. Energies 2023, 16, 4856. [Google Scholar] [CrossRef]
Figure 1. Plan for the construction of PSH Młoty—situation at the end of 2022 (own study based on [38]).
Energies 17 01830 g001
Figure 2. Share of pumping and generation compared to average hourly energy prices for PSHs Żarnowiec, Porąbka-Żar and Żydowo in 2021–2023 and consumption in 2022. Source own study based on PSE and TGE data [55,66].
Energies 17 01830 g002
Figure 3. Average daily productivity (MWh/MW) for pumping and generation in individual months for PSHs Żarnowiec, Porąbka-Żar and Żydowo in 2021–2023. Source own study based on PSE and TGE data [55,66].
Energies 17 01830 g003
Figure 4. Relations between electricity prices, pumping costs, and electricity generation. Source. Own study.
Energies 17 01830 g004
Figure 5. Distribution of PSH operating costs in the base scenario (own study).
Energies 17 01830 g005
Figure 6. Distribution of PSH operating income in the base scenario (own study).
Energies 17 01830 g006
Figure 7. Distribution of the resulting NPV for PSH in the base scenario (own study).
Energies 17 01830 g007
Figure 8. Distribution of the resulting IRR for the PSH in the base scenario (own study).
Energies 17 01830 g008
Table 1. Characteristics of existing PSHs in Poland.
Name of PSHŻarnowiecPorąbka-ŻarŻydowo
Location (voivodeship)Czymanowo (Pomeranian Voivodeship)Międzybrodzie Żywieckie (Silesian Voivodeship)Żydowo (West Pomeranian Voivodeship)
Capacity, MWh38002015687
Installed capacity, MW780552165
Number of hydro units443
Generation in 2021, MWh425,433272,61868,533
Pumping in 2021, MWh612,378359,19392,824
Yearly mean RTE, %69.4775.9073.83
Source: Own study based on [55].
Table 2. Comparison for PSH and lithium-ion batteries—capital expenditures perspective (CAPEX and OPEX expressed in USD for 2020, based on [61]).
TypePower/CapacityCAPEXOPEX (Annual)Lifetime
$/kW$/kWh$/kW$/kWhNumber of Cycles at 80% of DischargeProject Lifetime
PSH100 MW/
400 MWh
153438430.47.6015,00040
100 MW/
1000 MWh
196719730.43.04
1000 MW/
4000 MWh
128832217.84.45
100 MW/
10 000 MWh
165116517.81.78
Lithium-ion iron phosphate (LFP) batteries100 MW/
800 MWh
28943627.150.89550010
100 MW/
1000 MWh
35653568.820.88
Lithium-ion nickel manganese cobalt (NMC) batteries100 MW/
800 MWh
29743727.350.92350010
100 MW/
1000 MWh
36643669.070.91
Table 3. Spearman correlation statistic for analyzed data.
ItemElectricity GenerationPumping CostElectricity Price
Electricity Generation1.000.620.70
Pumping Cost0.621.000.81
Electricity Price0.700.811.00
Source: own study.
Disclaimer/Publisher’s Note: The statements, opinions and data contained in all publications are solely those of the individual author(s) and contributor(s) and not of MDPI and/or the editor(s). MDPI and/or the editor(s) disclaim responsibility for any injury to people or property resulting from any ideas, methods, instructions or products referred to in the content.

