Article

A New Method for Optimizing Water-Flooding Strategies in Multi-Layer Sandstone Reservoirs

1
MOE Key Laboratory of Enhanced Oil Recovery, Northeast Petroleum University, Daqing 163712, China
2
E&D Research Institute, PetroChina Daqing Oilfield Company Limited, Daqing 163712, China
3
Unconventional Petroleum Research Institute, China University of Petroleum (Beijing), Beijing 102249, China
*
Author to whom correspondence should be addressed.
Energies 2024, 17(8), 1828; https://doi.org/10.3390/en17081828
Submission received: 25 February 2024 / Revised: 24 March 2024 / Accepted: 27 March 2024 / Published: 11 April 2024
(This article belongs to the Special Issue The Technology of Oil and Gas Production with Low Energy Consumption)

Abstract

:
As one of the most important and economically enhanced oil-recovery technologies, water flooding has been applied in various oilfields worldwide for nearly a century. Stratified water injection is the key to improving water-flooding performance. In water flooding, the water-injection rate is normally optimized based on the reservoir permeability and thickness. However, this strategy is not applicable after oilfields enter the ultra-high-water-cut period. In this study, an original method for optimizing water-flooding parameters for developing multi-layer sandstone reservoirs in the entire flooding process and in a given period is proposed based on reservoir engineering theory and optimization technology. Meanwhile, optimization mathematical models that yield maximum oil recovery or net present value (NPV) are developed. The new method is verified by water-flooding experiments using Berea cores. The results show that using the method developed in this study can increase the total oil recovery by approximately 3 percent compared with the traditional method using the same water-injection amounts. The experimental results are consistent with the results from theoretical analysis. Moreover, this study shows that the geological reserves of each layer and the relative permeability curves have the greatest influence on the optimized water-injection rate, rather than the reservoir properties, which are the primary consideration in a traditional optimization method. The method developed in this study could not only be implemented in a newly developed oilfield but also could be used in a mature oilfield that has been developed for years. However, this study also shows that using the optimized water injection at an earlier stage will provide better EOR performance.

1. Introduction

As one of the most important and economically enhanced oil-recovery technologies, water flooding has been applied in various oilfields worldwide for nearly a century (Steven, 2023 [1]). To date, water flooding is still the most widely used method for hydrocarbon development in China. Annual oil production from high-water-cut oilfields (60% ≤ water cut < 90%) accounts for more than 70% of total annual oil production nationally. Furthermore, the production from ultra-high-water-cut oilfields (water cut ≥ 90%) accounts for nearly 30% of total annual oil production nationally (Wang, 2014 [2]). Long into the future, oil production through water injection will still account for the most important part of China’s oil production. On the other hand, the large oilfields in China, such as Daqing Oilfield, Shengli Oilfield, and Dagang Oilfield, have entered the development stage of ‘ultra-high water cut and ultra-high recovery’ (Zhu, 2015 [3]; Cui, 2016 [4]; Lu, 2020 [5]). Among them, Daqing Oilfield has maintained a stable production of 5000 × 104 t for 27 years, and 64% of that production still comes from water flooding. Other oilfields will gradually enter the ultra-high-water-cut development stage (water cut ≥ 95%) sooner or later. The inefficient and ineffective circulation of injected water in these oilfields will be further aggravated, leading to the difficulty of injected water control being further increased. Therefore, we need to put forward higher requirements for the efficient development of water flooding. In water flooding, the development process and EOR performance are greatly affected by formation heterogeneity and development conditions, which may result in unbalanced displacement. The key task of efficient development is how to improve the sweep efficiency—whether by balanced water injection for light oil (Liu, 2013 [6], 2023 [7]) or assisted CO2 foam flooding for heavy oil (Shi, 2023 [8]; Lei, 2023 [9]; Tao, 2023 [10]). Injection and production optimization are widely used throughout oilfields. In order to reduce the complexity of the numerical simulation and the optimization, reduced-physics modeling is promoted for water-flooding oilfields with relatively simple well patterns (Zhai, 2017 [11]; Ibrahima, 2017 [12]). Moreover, some new methods, such as those using big data and artificial intelligence, have also been introduced into the optimization of water injection. For example, a combination of the hybrid genetic algorithm, particle swarm optimization (PSO), and streamline-based reservoir simulation (Naderi, 2021 [13]; Azamipour, 2018 [14], 2023 [15]) has been studied. Furthermore, the reservoir is also approximated as a multi-well injection–production system, and capacitance and resistant models (Yousef, 2006 [16]; Soroush, 2014 [17]; Yousefi, 2020 [18]; Huang, 2023 [19]; Guo, 2023 [20]), system analysis models (Liu, 2009 [21]), and INSIM-derived models (Zhao, 2014 [22], 2016 [23], 2019 [24], 2022 [25]) have been developed to predict and optimize inter-well connectivity and the water-injection rate.
For a multi-layer reservoir that has been water-flooded for years, development experiences show that the joint effect of the stratified water injection and reservoir engineering is one of the most important ways to achieve balanced displacement (Liu, 2013 [6]). The key task is to optimize the stratified water-injection rate. Since this technology was put forward in the 1960s, a series of stratified water-injection technologies and supporting equipment have been developed. Fixed water injection, eccentric throwing and fishing, and cable-based testing and adjusting are the three generations of this widely used technology. In recent years, the fourth generation (named fine-stratified water-injection technology), characterized by digitization and automation, has been developed (Liu, 2023 [7]). The concept of balanced displacement is promoted for the optimization of the stratified water-injection rate. Commonly used methods are based on reservoir parameters and experiences, such as the resistance coefficient method (Du, 2004 [26]), distributing coefficient method (Song, 2000 [27]), etc. In recent years, many researchers have proposed the concept of balanced displacement and carried out many studies on how to achieve balanced water flooding. However, the definitions and standards of balanced displacement differ greatly, including water breakthrough at the same time, reaching the same water cut or oil saturation or oil recovery at each connecting oil well, etc. (Li, 2003 [28]; Feng, 2016 [29]; Cui, 2017 [30]; Chang, 2019 [31]; Chen, 2020 [32]).
The purpose of water flooding in a multi-layer sandstone oilfield is to obtain the maximum recovery factor or net present value (NPV). The compound methods combining numerical models and AI techniques could not meet the requirements of simplicity in oilfield practice. Meanwhile, the balanced displacement concepts of water flooding rarely consider the overall objectives of water flooding or lack theoretical support. Based on the fundamental theory of reservoir engineering, a new method for the balanced displacement of water flooding is proposed by combining interval injection distribution with the technical and economic optimization of the well group in this paper. We hope this paper can provide useful guidance in the further improvement of water flooding in multi-layer sandstone oilfields.

2. Establishment and Validation of the Water-Injection Optimization Method

2.1. Establishment of the Water-Injection Optimization Method

2.1.1. Two-Phase Flow Theory of Water Flooding

In this study, the term balanced displacement refers to maximizing the recovery factor or NPV of well groups and blocks by optimizing and adjusting the water injection in different injection–production directions of each layer. This could be categorized into two different scenarios: the optimization of the entire water-flooding process and the optimization in a given water-flooding period. According to the Buckley–Leverett water-flooding theory, the water saturation at the outlet and the average water saturation of the reservoir could be calculated when a given volume of water is injected. Conversely, the cumulative water-injection volume required could then be calculated by providing a certain water saturation at the outlet or the average water saturation of the reservoir. To optimize the allocation of water-injection volumes to each layer, the following assumptions should be made: (i) The flow in the reservoir follows isothermal conditions; (ii) The two-phase (oil–water) flow in the porous media follows the generalized Darcy’s law; (iii) The impacts of capillary pressure and gravity are neglected; and (iv) The rock and fluids are incompressible. Under the condition of oil–water two-phase flow in porous media, the commonly used relationship between the relative permeability of oil and water and the dimensionless water saturation is:
K r o = α 1 ( 1 S w d ) m
K r w = α 2 S w d n
S w d = S w S i w 1 S o r S i w
where K r o and K r w are the relative permeability of the oil and water, respectively; S w d is the dimensionless water saturation; S w is the water saturation; S i w is the connate water saturation; S o r is the residual oil saturation; and α 1 , α 2 , m , n are the regression coefficients. The water cut and the derivative of the water cut at the outlet could be expressed as:
f s w = S w d n S w d n + A ( 1 S w d ) m
f s w = A B [ n S w d n 1 ( 1 S w d ) m + m S w d n ( 1 S w d ) m 1 ] [ S w d n + A ( 1 S w d ) m ] 2
A = α 1 μ w α 2 μ o
B = 1 1 S o r S i w
where f s w and f s w are the water cut and the derivative of water cut, respectively, when the water saturation at the producer is S w ; and μ o and μ w are the viscosity of crude oil and formation water, mPa·s.
It should be noted that the optimization amount of the water injection in each layer generally targets the situation that the outlet end has reached the water-cut limit (generally 98%). Based on the Buckley–Leverett theory, the calculation formulas for the cumulative water-injection volume and the average water saturation are:
Q i = 1 f s w
S w ¯ = S w + 1 f s w f s w
where Q i is the cumulative water-injection volume when the water saturation at the producer is S w , m3; and S w ¯ is the average water saturation between the injector and the producer when the water saturation at the producer is S w .

2.1.2. Optimized Displacement in the Entire Water-Flooding Process

As aforementioned, the purpose of the developed method is to achieve the maximum oil recovery or the maximum NPV of water flooding. Assuming that the optimized water-injection strategy is applied at an early stage of water-flooding development, the method of optimized displacement in the entire water-flooding process could then be used to optimize the water-injection amount in each layer.
We assume that the multi-layer sandstone oilfield can be simplified as a one-dimensional parallel linear system. The well space is L . The sweep width of each layer is equally given as d . Based on the one-dimensional two-phase flow theory, an optimization model to maximize the oil recovery or NPV can be established. For the scenario of maximized oil recovery, the objective function is equivalent to minimize the remaining geological reserves with constraints of the total water cut and the average water saturation of each layer. Considering that the water cut of each layer is quite high when the maximum oil recovery is reached, the minimum of the average water saturation of the constraints could then be given as S w f ¯ , which is the average water saturation between wells when the water-flooded front reaches the producer. Therefore, the optimal mathematical model with the highest oil recovery could be expressed as follows:
{ Objective   Function :   min ( i = 1 N V p i ( 1 S w i ¯ ) )   Constraint   Function :   F w = 0.98 ;   S w f l ¯ S w i ¯ 1 S o r i
where
V p i = L i d i h i φ i
S w i ¯ = S w i + 1 f s w i f s w i
F w = i = 1 N q w i i = 1 N q w i + q o i
where N is the number of reservoir layers; V p i is the pore volume of the layer i , m3; S w i ¯ is the average water saturation of the layer i ; F w is the water cut of the producer; S w f l ¯ is the average water saturation between wells when the water-flooded front of the layer reaches the oil well; S o r i is the residual oil saturation of the layer i ; φ i is the average porosity of the layer i ; S w i is the water saturation at the producer of the layer i ; f s w i and f s w i are the water cut and the derivative of the water cut respectively when the water saturation at the producer of the layer i is S w i ; and q w i and q o i are the water production and oil production of the layer i , respectively, m³/d.
For the scenario of maximizing NPV, we assume that the injection and production ratio is unit. Meanwhile, the crude oil price, the water-injection cost, and the produced water treatment cost remain constant during the development process. The injection cost I n , the cumulative water-injection volume I i , and the cumulative revenue of crude oil R are:
I n = i = 1 N I i ( c i + c p )
I i = 1 f s w i
R = i = 1 N V p i ( S w i ¯ S i w ) c o = i = 1 N ( S w i S i w + 1 f s w i f s w i ) V p i c o
where c i and c p are the water-injection cost per unit water volume and the treatment cost per unit produced fluid respectively, CNY/m3; c o is the crude oil price, CNY/m3; I n is the injection cost, CNY; I i is cumulative water-injection volume, m3; and R is the cumulative revenue of the crude oil, CNY.
The optimization model while maximizing NPV could then be given as:
{ Objective   Function :   min ( i = 1 N ( V p i ( c i + c p f s w i ) ( S w i S i w + 1 f s w i f s w i ) c o ) )   Constraint   Function :   F w = 0.98 ;   S w f l ¯ S w i ¯ 1 S o r i
For a parallel linear system that adopts a water-injection optimization strategy for displacement from the original state, after providing the relative permeability curves of each layer, the aforementioned optimization method could then be used to optimize the average water saturation required for each layer to maximize the oil recovery or NPV. Considering the characteristics of multi-parameter and non-linearity, MATLAB 2023b is used and the interior-point algorithm is adopted to solve the nonlinear optimization problem in this paper. The nonlinear constraints are converted into penalty terms and incorporated into the objective function in the algorithm so that the original constrained problem is transformed into an unconstrained one. Subsequently, the optimal cumulative injection volume required for each layer and the water-injection rate for different vertical layers can be calculated.

2.1.3. Optimized Displacement in a Given Water-Flooding Period

Compared with the optimization in the entire water-flooding process, the optimization in each water-flooding period needs to consider two additional factors: the initial water cut of each layer or the average water saturation at the beginning of the given period and the water cut of the producer at the end of the period. Either factor can be given as a constraint condition when developing the corresponding model.
For the scenario of maximizing the oil recovery, it is the same the optimization in the entire water-flooding process, except the water cut of the producer at the end of the period should be taken into account:
{ Objective   Function :   min ( i = 1 N V p i ( 1 S w i ¯ ) )   Constraint   Function :   F w = F w l i m i t ;   S w f l ¯ S w i ¯ 1 S o r i
where F w l i m i t is the water cut of the producer at the end of the period.
When optimizing the water-injection rate, the model should be used to optimize the cumulative water-injection volume and the initial water cut of each layer. The optimal water-injection volume for each layer in a given water-flooding period could then be given as:
I i p e r i o d = I i 1 f s w i o
where I i p e r i o d is the optimized water-injection volume of layer i in the water-flooding period, m3; I i is the optimized cumulative water-injection volume of layer i , m3; and f s w i o  is the derivative of the initial water cut of layer i at the beginning of the water-flooding period, m3.
For the scenario of maximizing NPV, it is necessary to consider the water-injection volume required for each layer to reach the water cut at the end of the period and the oil production of each layer during the water-flooding process. The water-injection cost, the water-injection volume at the end of the water-flooding period, and the crude oil revenue could be given as:
I n = i = 1 N ( ( I i I i o ) ( c i + c p ) )
I i o = 1 f s w i o
R = i = 1 N V p i ( S w i ¯ S w i o ) c o = i = 1 N ( S w i S w i o + 1 f s w i f s w i 1 f s w i o f s w i o ) V p i c o
where Iio is the cumulative water-injection volume of layer i at the beginning of the given water-flooding period, m3; Swio is the water saturation at the producer of layer i at the beginning of the period; and fswio is the water cut of layer i at the beginning of the period.
The optimization model in each water-flooding period while maximizing NPV could then be given as:
{ Objective Function : min ( i = 1 N ( V p i ( 1 f s w i 1 f s w i o ) ( c i + c p ) ( S w i S w i o + 1 f s w i f s w i 1 f swio f swio ) c o ) ) Constraint Function : F w = F w l i m i t ; S w f l ¯ S w l ¯ 1 S ori
Similarly, as it is in the scenario of the entire water-flooding process, the cumulative water-injection volume of each layer in the given period is firstly optimized by using of the mentioned models, and then the water-injection volume of each layer at the beginning of the period is subtracted to obtain the optimized water-injection volume of each layer for the period.

2.2. Establishment of the Water-Injection Optimization Method

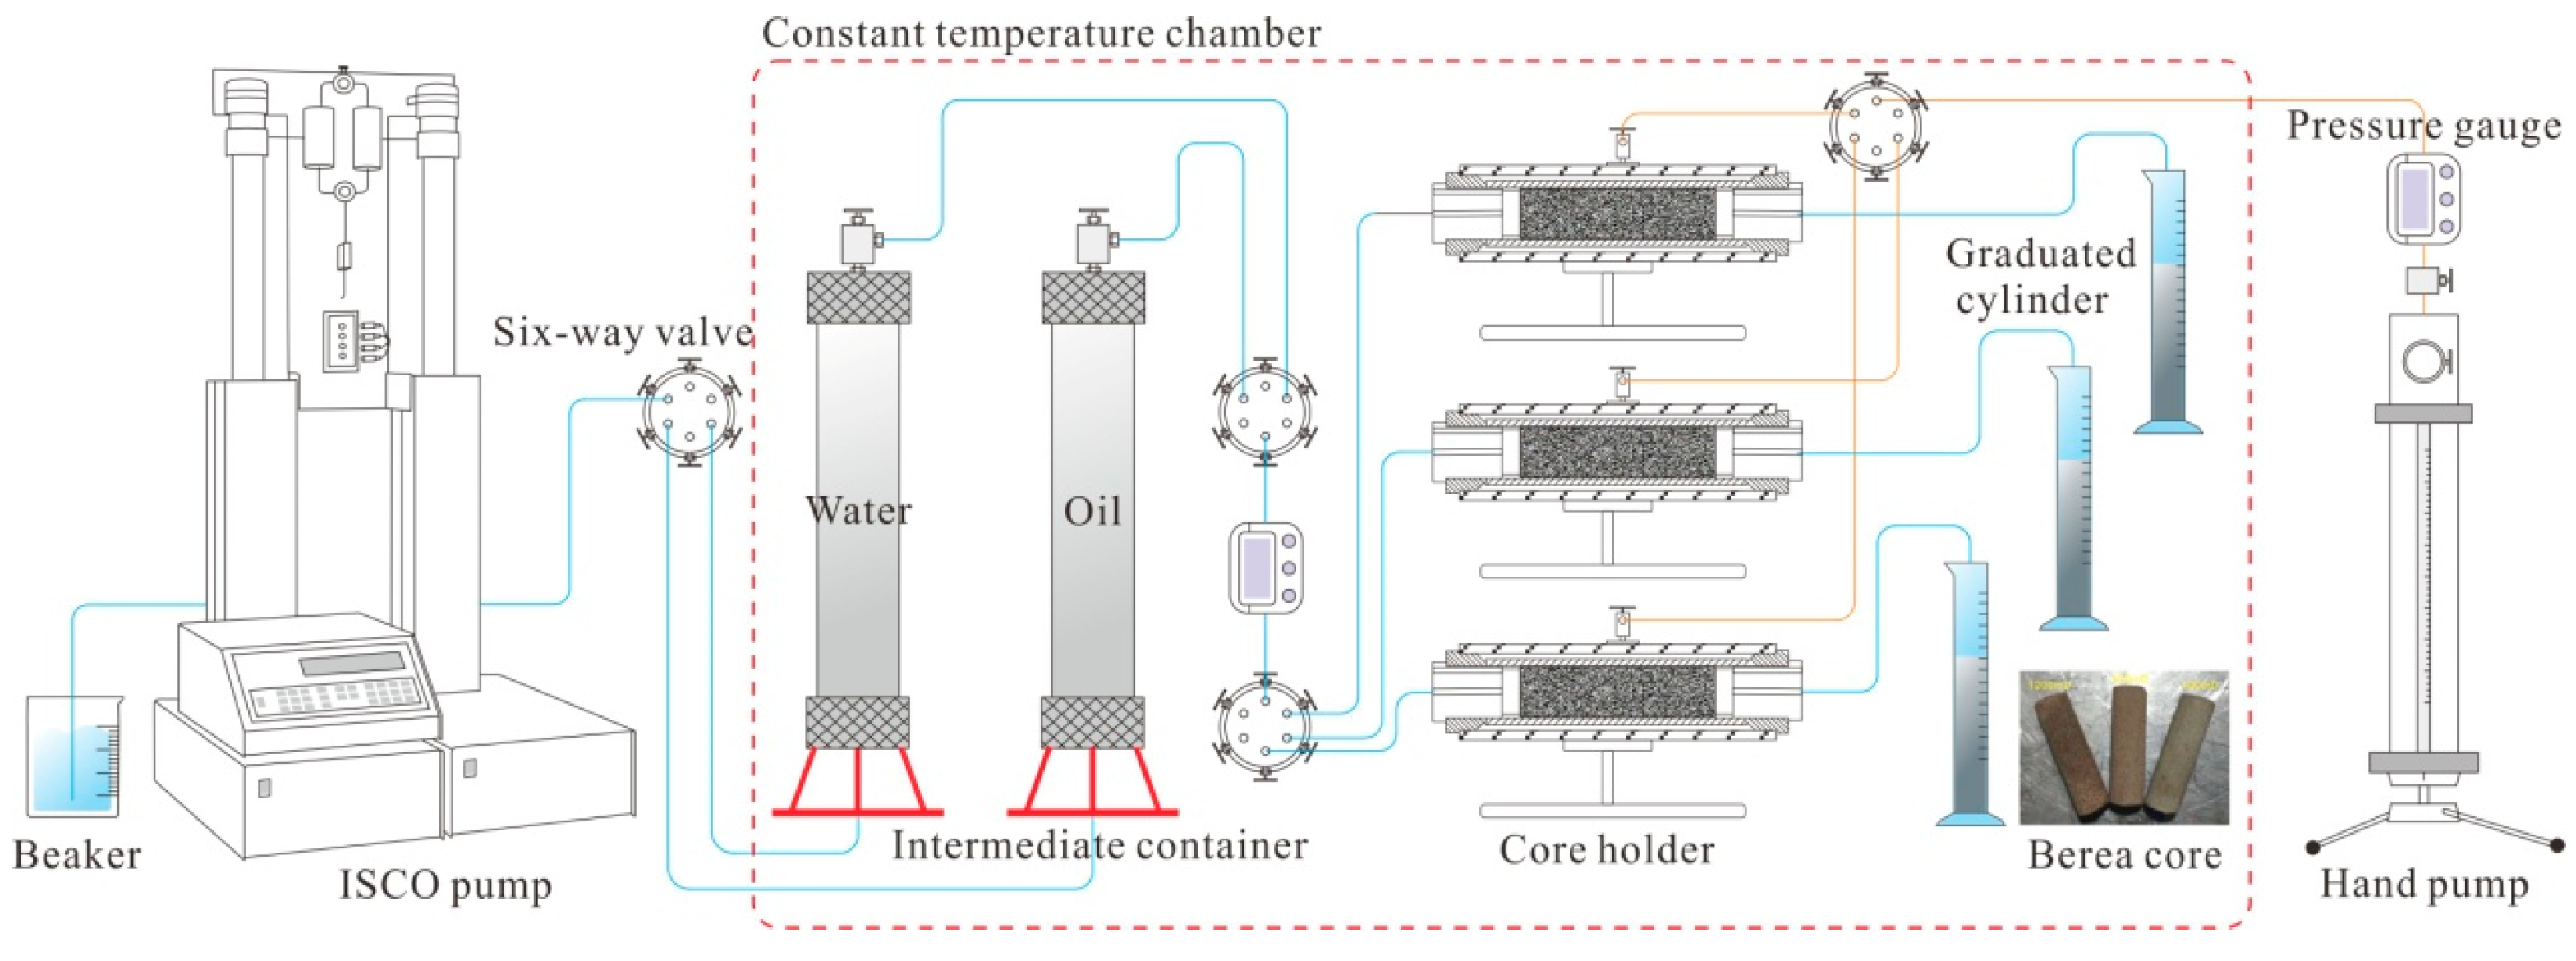
2.2.1. Experimental Materials and Equipment

Experimental materials: Three Berea core samples (Cleveland Quarries, Vermilion, OH, USA) with a permeability of 0.1 μm2, 0.5 μm2, and 1.2 μm2, respectively, were used in the experiments. These core samples had the same diameter and length of 2.5 cm and 8 cm, respectively. Simulated oil with a viscosity of 9.8 mPa·s and simulated formation water with a TDS of 6778.7 were used (Table 1). In addition, 120# gasoline was also used in the experiments.
Experimental equipment: KD-II type of high-temperature and high-pressure displacement device (Zhongjing Machinery Co., Ltd., Natong, China), core holder (Zhongjing Machinery Co., Ltd., Natong, China), hand pump (Zhongjing Machinery Co., Ltd., Natong, China), electric mixer (Lichen Instrument Technology Co., Ltd., Shanghai, China), electronic balance (accuracy: 0.0001 g, Lichen Instrument Technology Co., Ltd., Shanghai, China), Soxhlet extractor (Jiangsu Hua’an Scientific Research Instrument Co., Ltd., Natong, China), and thermostatic heater (Jiangsu Hua’an Scientific Research Instrument Co., Ltd., Natong, China). The schematic of the apparatus used in the water-flooding experiments are shown in Figure 1.

2.2.2. Experimental Scheme

The paralleled water-flooding experiments using Berea cores with different permeability were first conducted with constant pressure. The relative permeability of each Berea core was measured in this process. The cores were then saturated again by simulated oil. The optimized single-core experiments were conducted with different optimized flow rates, as shown in Table 2.

2.2.3. Experimental Procedure

The temperature of the core flooding experiments remained at 45 °C, while the other experiments were conducted at room temperature (25 °C). The experimental procedure is listed as follows:
  • The Berea cores with different permeability levels were saturated by formation water using a vacuum pump. The pore volume and the porosity of each core were measured.
  • The flooding was conducted at a flow rate of 0.5 mL/min for 2 PV, 2.0 mL/min for 5 PV, and 10.0 mL/min for 30 PV sequentially until the residual oil saturation was reached.
  • The flooding was conducted at a pressure of 0.25 MPa with water injection using the traditional method. The oil–water relative permeability of cores was given according to the national standard (GB/T 28912-2012 [33]).
  • The Berea cores were placed in a Soxhlet extractor to conduct oil flooding using 120# gasoline until the extract in the upper part was clear enough, and the cores were then placed in an 80 °C drying oven to be dried to a constant weight, which makes sure that all experiments were conducted under the same relative permeability curve.
  • We repeated experimental steps (i) to (ii) until all Berea cores reached the residual oil saturation.
  • Optimized water flooding was conducted on each core with different flow rates. The water production and the oil production were recorded during the process.

3. Results and Discussion

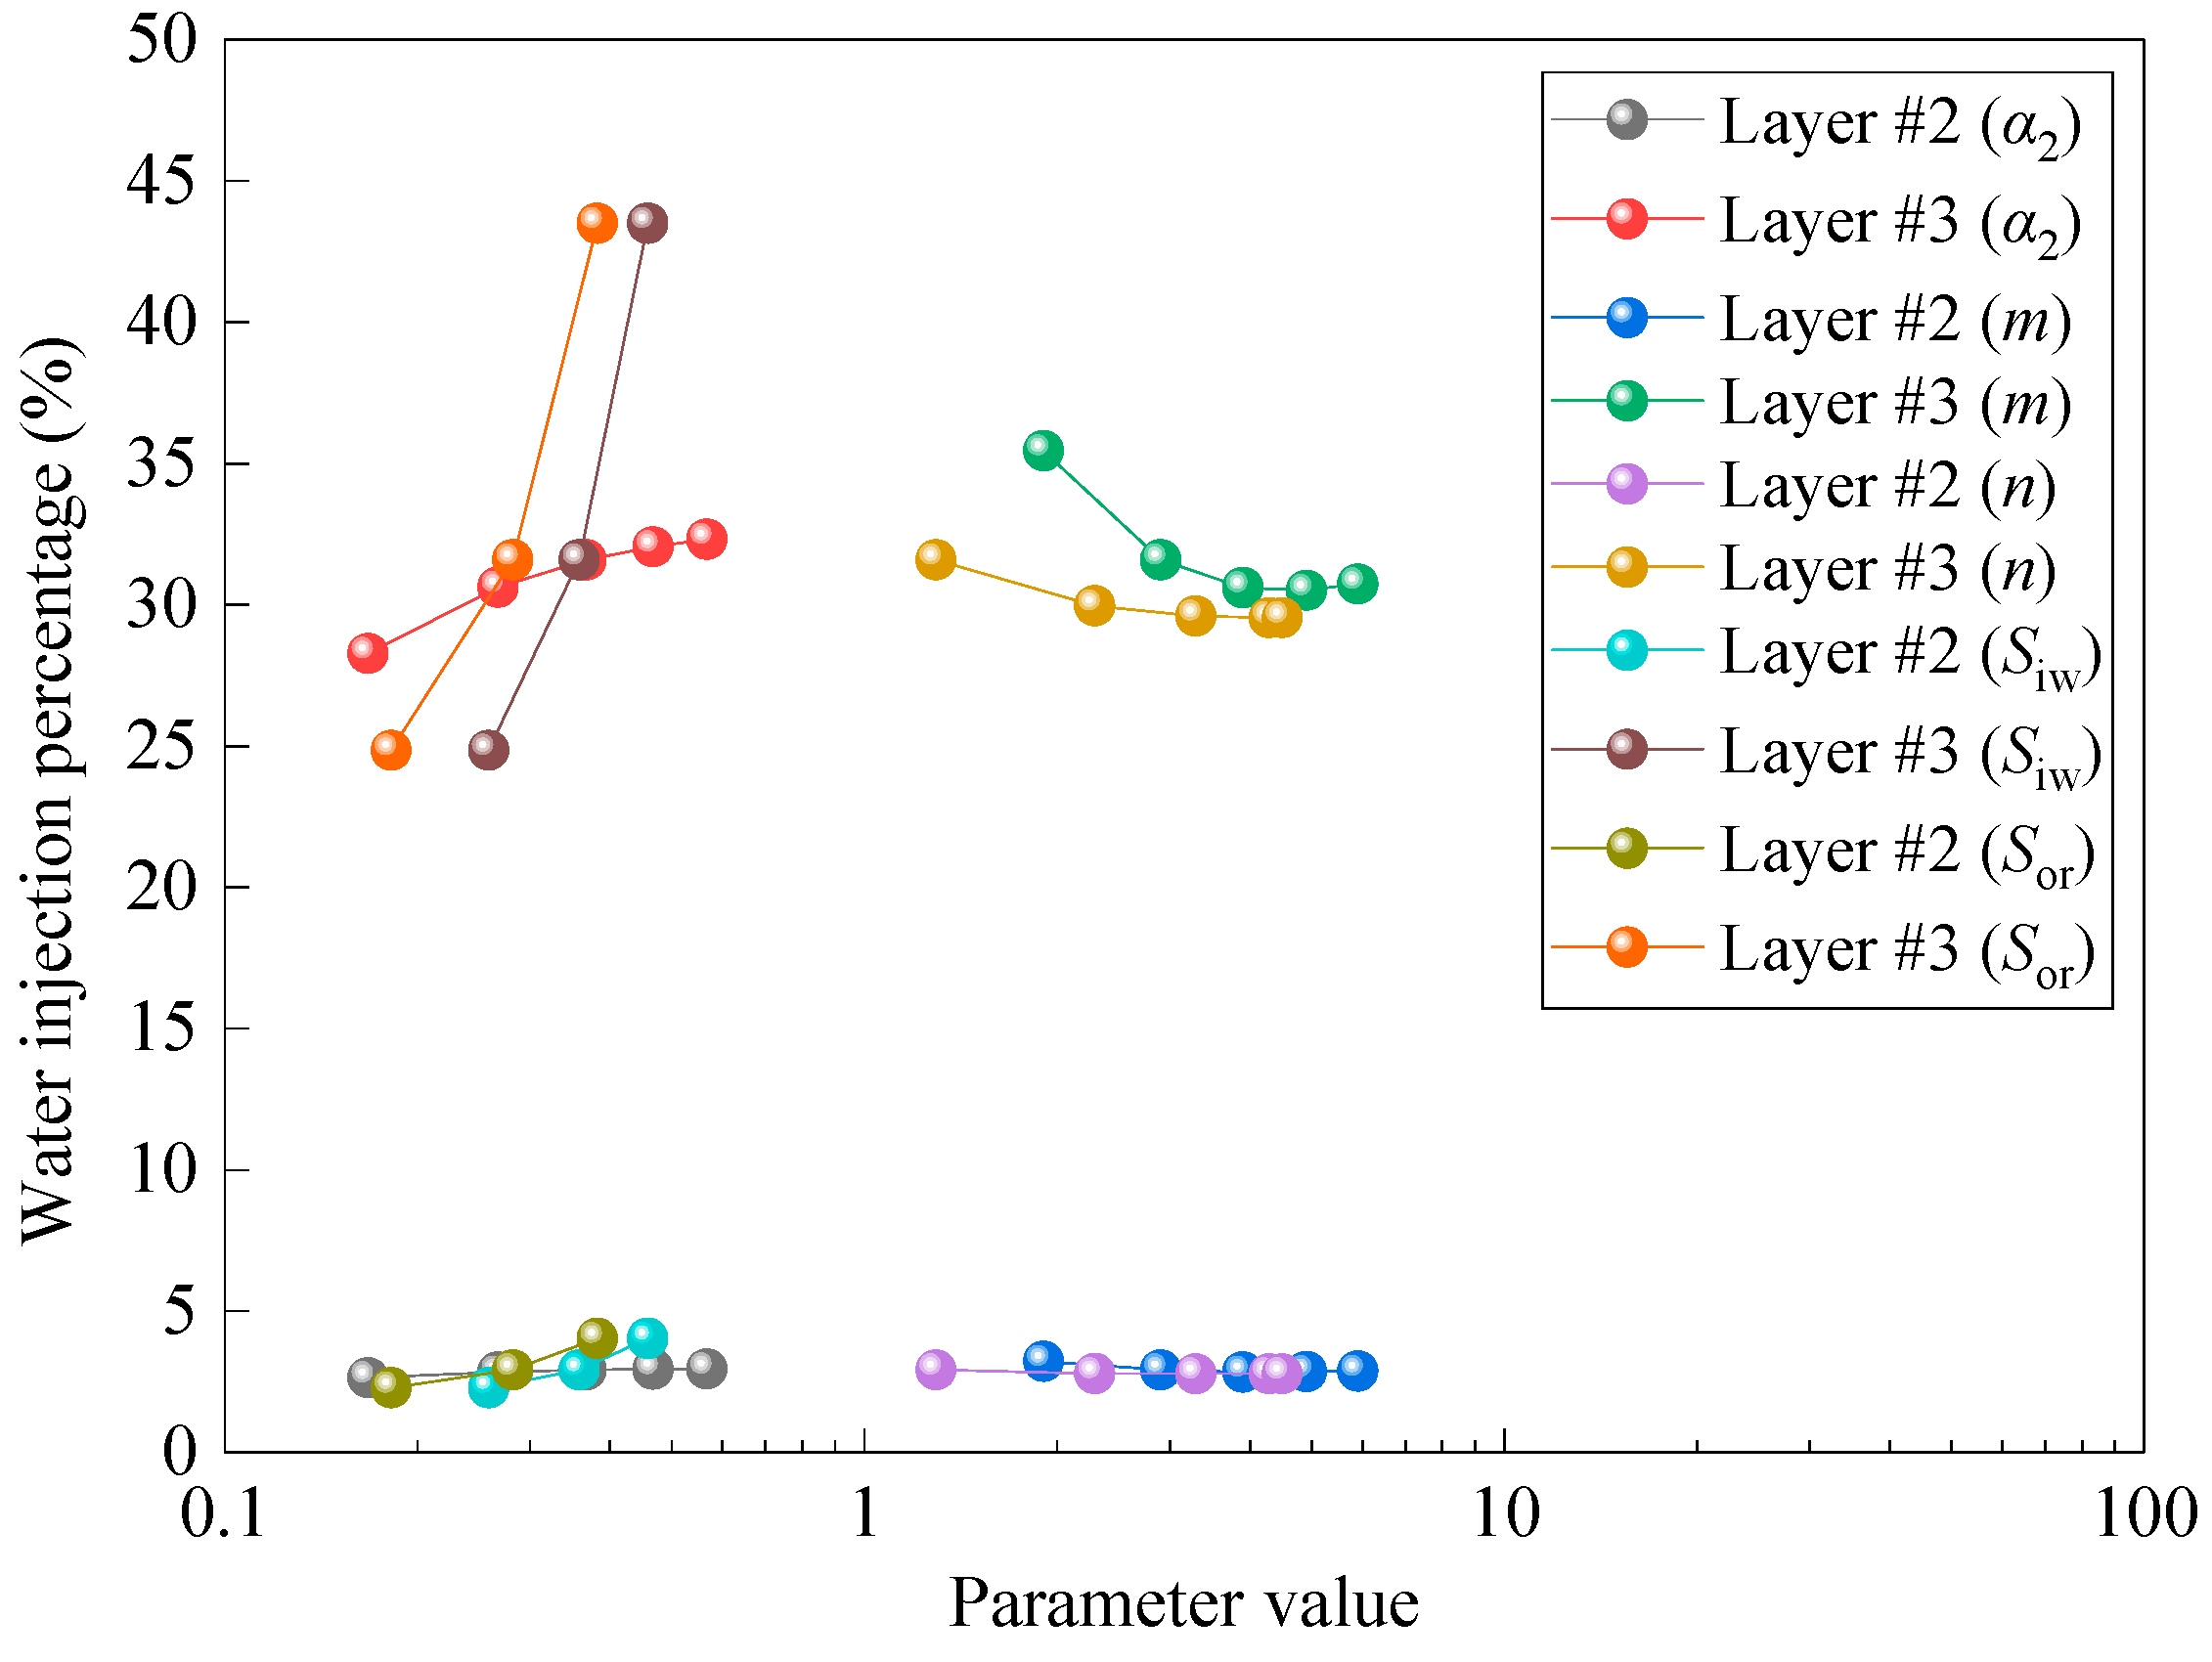
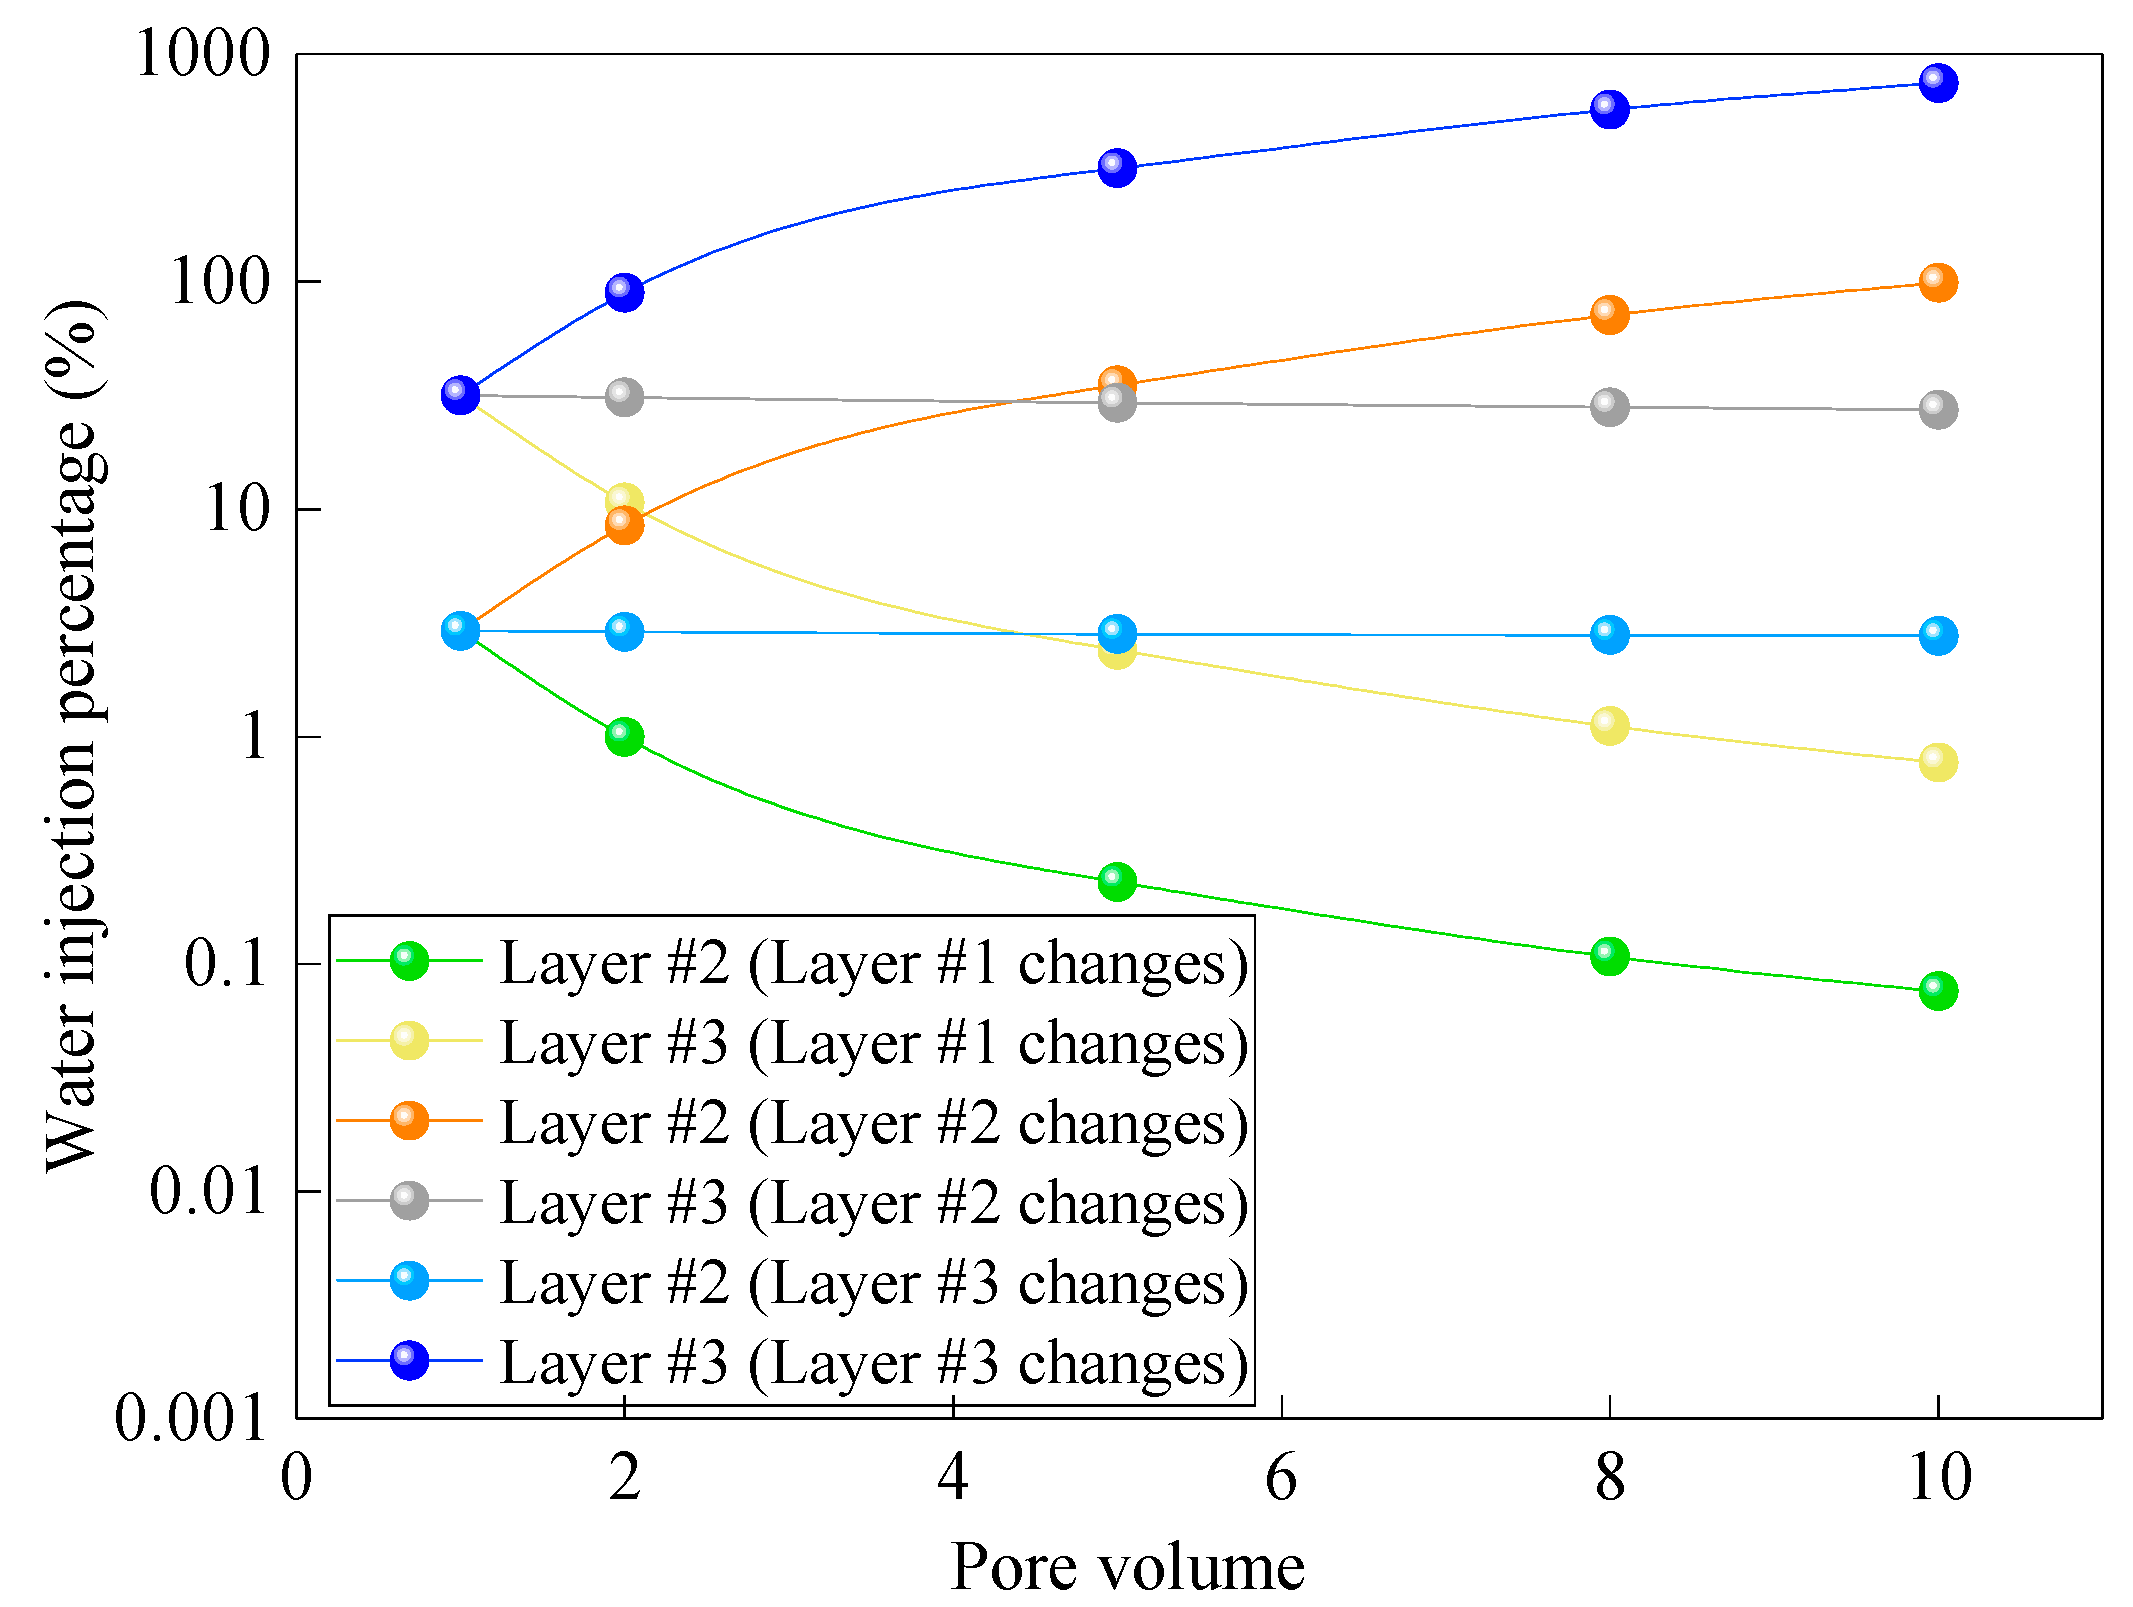
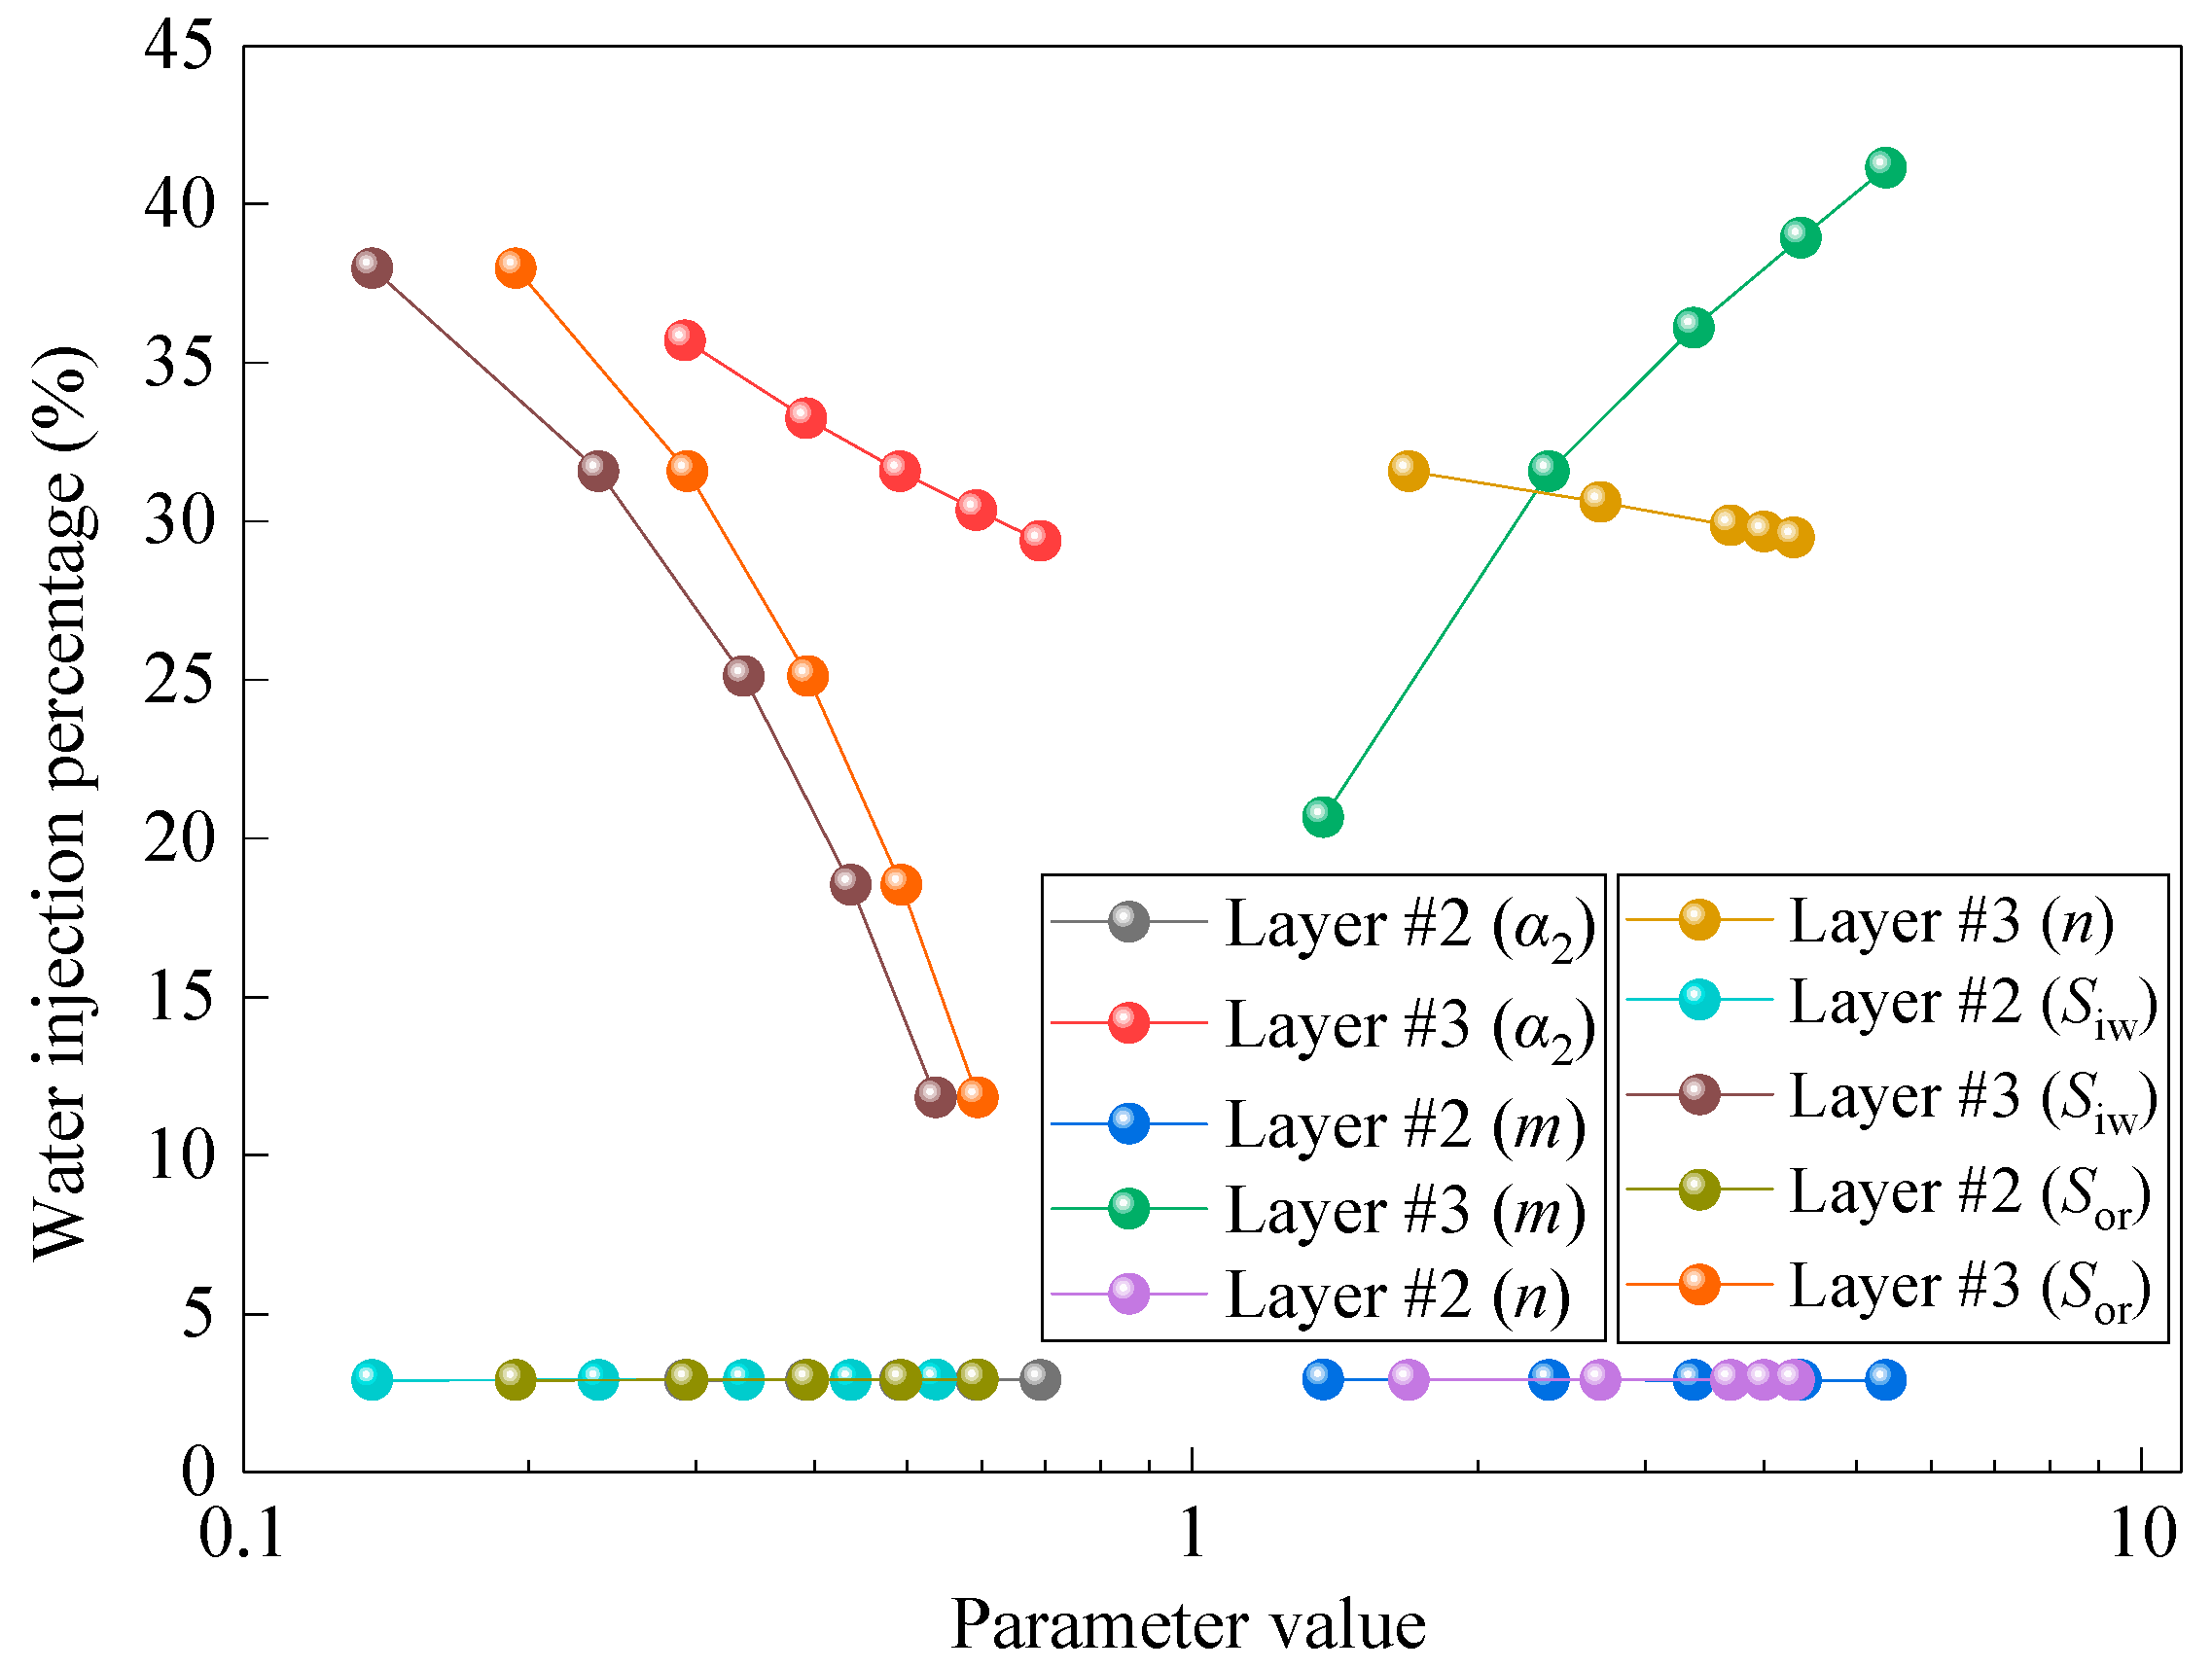
3.1. Analysis of Influencing Factors on the Optimized Water-Injection Rate

For the sake of discussion, the scenario of maximizing oil recovery is discussed in this paper. Taking Daqing Oilfield as an example, the effective thickness and the permeability of a single layer range from 0.2 to 10 m and 0.02 to 5.0 μm2, respectively. In order to reach a better development result, the reservoirs are divided into three categories according to sedimentary type, permeability, and sand body thickness (Li, 2007 [34]; Wu, 2018 [35]). Generally speaking, the reservoirs with permeability larger than 0.5 μm2 are classified as Type I, and the reservoirs with permeability less than 0.1 μm2 are classified as Type III. In order to understand the effect of optimizing flooding, the three-layer water-injection optimization mathematical model is established based on the three types of reservoirs of Daqing Oilfield, in which layer #1 has the worst property, layer #2 has a better property, and layer #3 has the best property. The pore volumes of the three layers are 269 m3, 538 m3, and 2152 m3, respectively. The viscosities of the crude oil and the formation water are 8.0 mPa·s and 0.6 mPa·s, respectively. The parameters of reservoir physical properties and the relative permeability curves are shown in Table 3.
Based on the optimization methods developed in this paper, the stratified water-injection rate is optimized with a water-cut limit of 98% at the producer. For the convenience of comparison, the cumulative water injection given by the optimization of layer #1 is taken as unit 1, and the water-injection proportion of layer #2 and layer #3 is then given by optimization. The evaluation results show that the final water cut and the cumulative water-injection volume of each layer differ when the optimal target is reached. Taking the water cut as an example, it is lower than the given water-cut limit in layers #1 and #2, with relatively poorer physical properties, while it is the opposite in layer #3, with the best properties. Taking the cumulative water injection required for each layer as an example, it is also lower in layers #1 and #2 compared with layer #3. The water-injected ratio for each layer is not directly related to the pore volume or the permeability, which is commonly taken as the fundamental parameter in stratified water injection (Table 4).

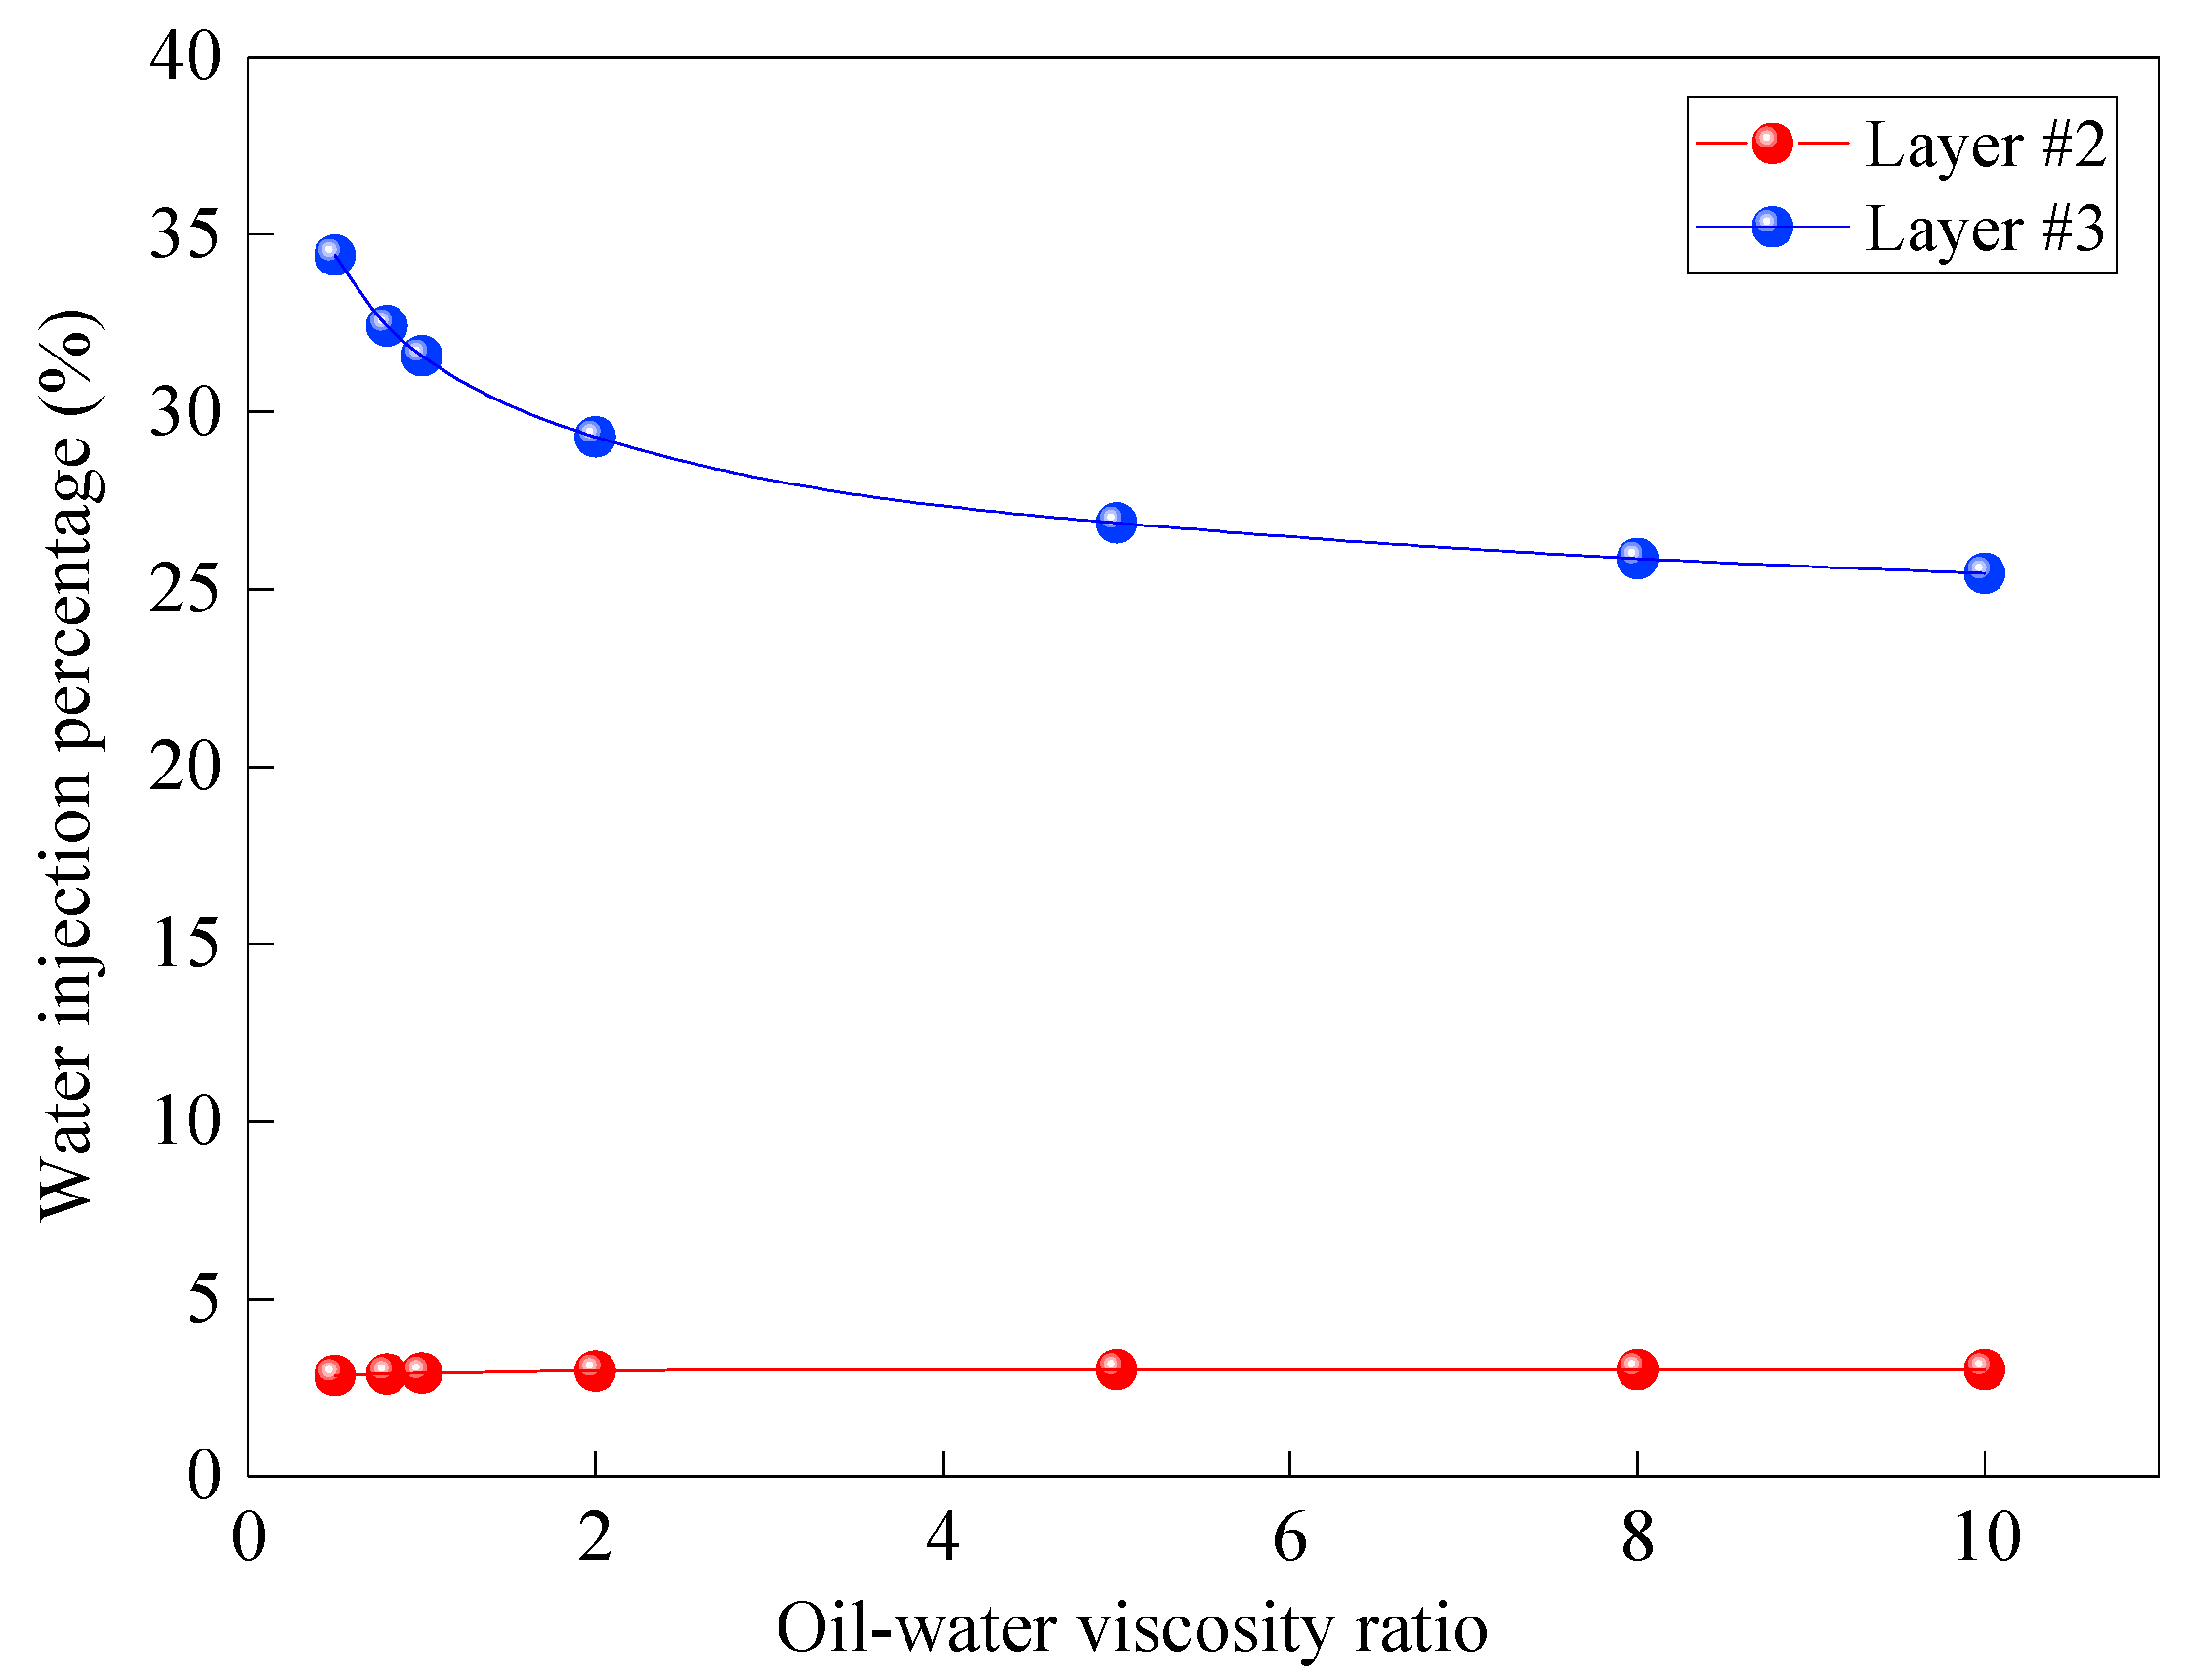
3.2. Influence of Reservoir and Fluid Properties

From the derivation process of the optimized water-injection method, it is clear that the objective function contains the total pore volume of each layer (OOIP) and the oil–water viscosity ratio. However, this method does not contain the permeability of each layer regardless of whether the optimization is oil recovery or NPV. This means that the optimized water-injection rate is not directly related to permeability unless it is connected with the parameters of the relative permeability curve.
For the reservoir property of the pore volume of each layer, the study is conducted by analyzing the impact of the geological reserves of each layer on the optimization results. The study shows that the water-injection percentage of layers #2 and #3 with relatively better reservoir properties decreases dramatically while increasing the pore volume of layer #1. Layer #3, with a larger geological reverse, decreases more rapidly. Similarly, the water-injection percentage of layer #2 increases significantly, and the percentage of layer #3 decreases slightly while increasing the pore volume of layer #2. The water-injection percentage of layers #1 and #2 remains essentially unchanged, and the percentage of layer #3 increases sharply while increasing the pore volume of layer #3. The analysis indicates that the pore volume or geological reserves of reservoirs with relatively poorer properties have a greater impact on the proportion of the stratified water-injection rate during water flooding of the sandstone oilfield (Figure 2).
For the reservoir fluids, which are mainly concerned with the oil–water viscosity ratio, the study is conducted by analyzing the impact of ratio changes on the optimization results. The results show that the oil–water viscosity ratio could be neglected for thin layers with smaller reserves (layers #1 and #2), while the effect could reach 25% for layer #3, with better reservoir properties and larger geological reserves (Figure 3).

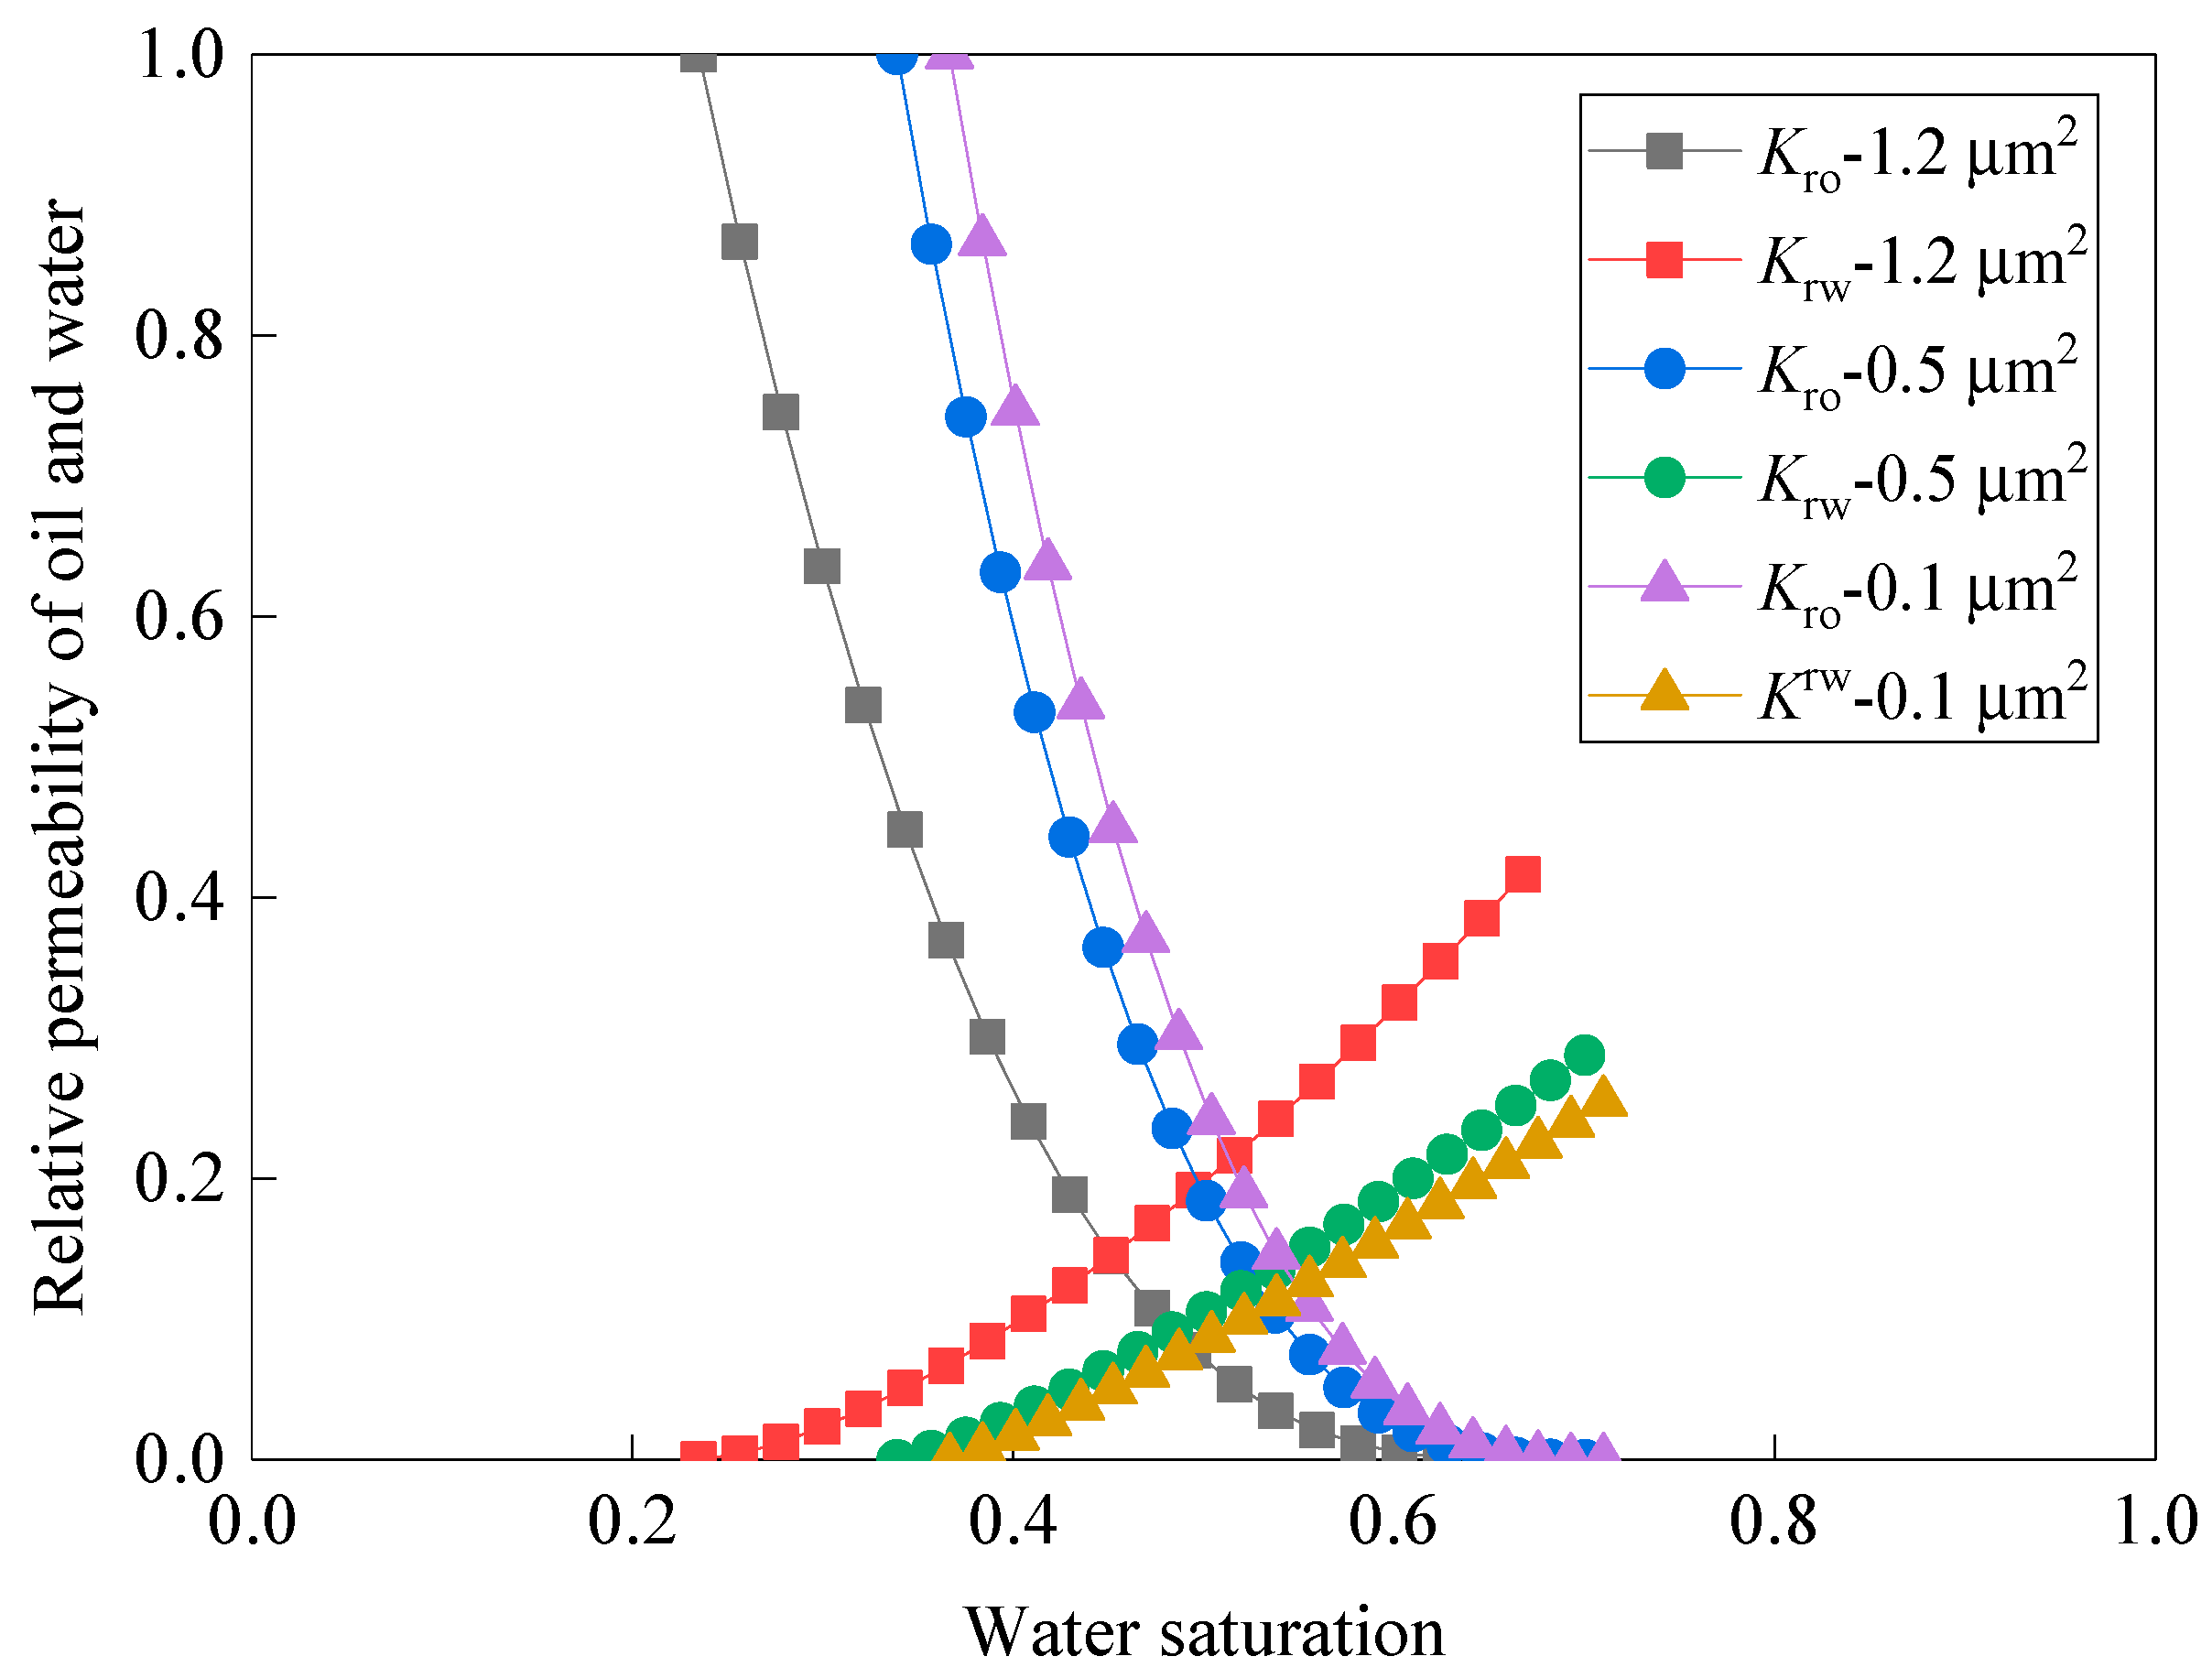
3.3. Influence of Relatively Permeability Curve

The flow characteristics of oil and water in porous media are the key internal factors affecting the effect of water flooding, which could be characterized by the oil–water relative permeability curve obtained from sample experiments. The influence of the relative permeability curve on the water-injection rate is further studied by changing the curve parameters of layer #1, with the poorest reservoir properties, and layer #3, with the best reservoir properties (Figure 4).
The results show that the influence of the parameter changes of layers #1 and #3 on thin and poor layers (layers #1 and #2) with small reserves can be ignored. It has a greater impact on layer #3, with better properties and larger reserves. The endpoint of the relative permeability curve has the greatest impact on the original geological reserves of the reservoir. Thus, it has a greater impact on the optimized water-injection rate of layer #3, while the influence of parameters m, n, and α2 follows (Figure 5).

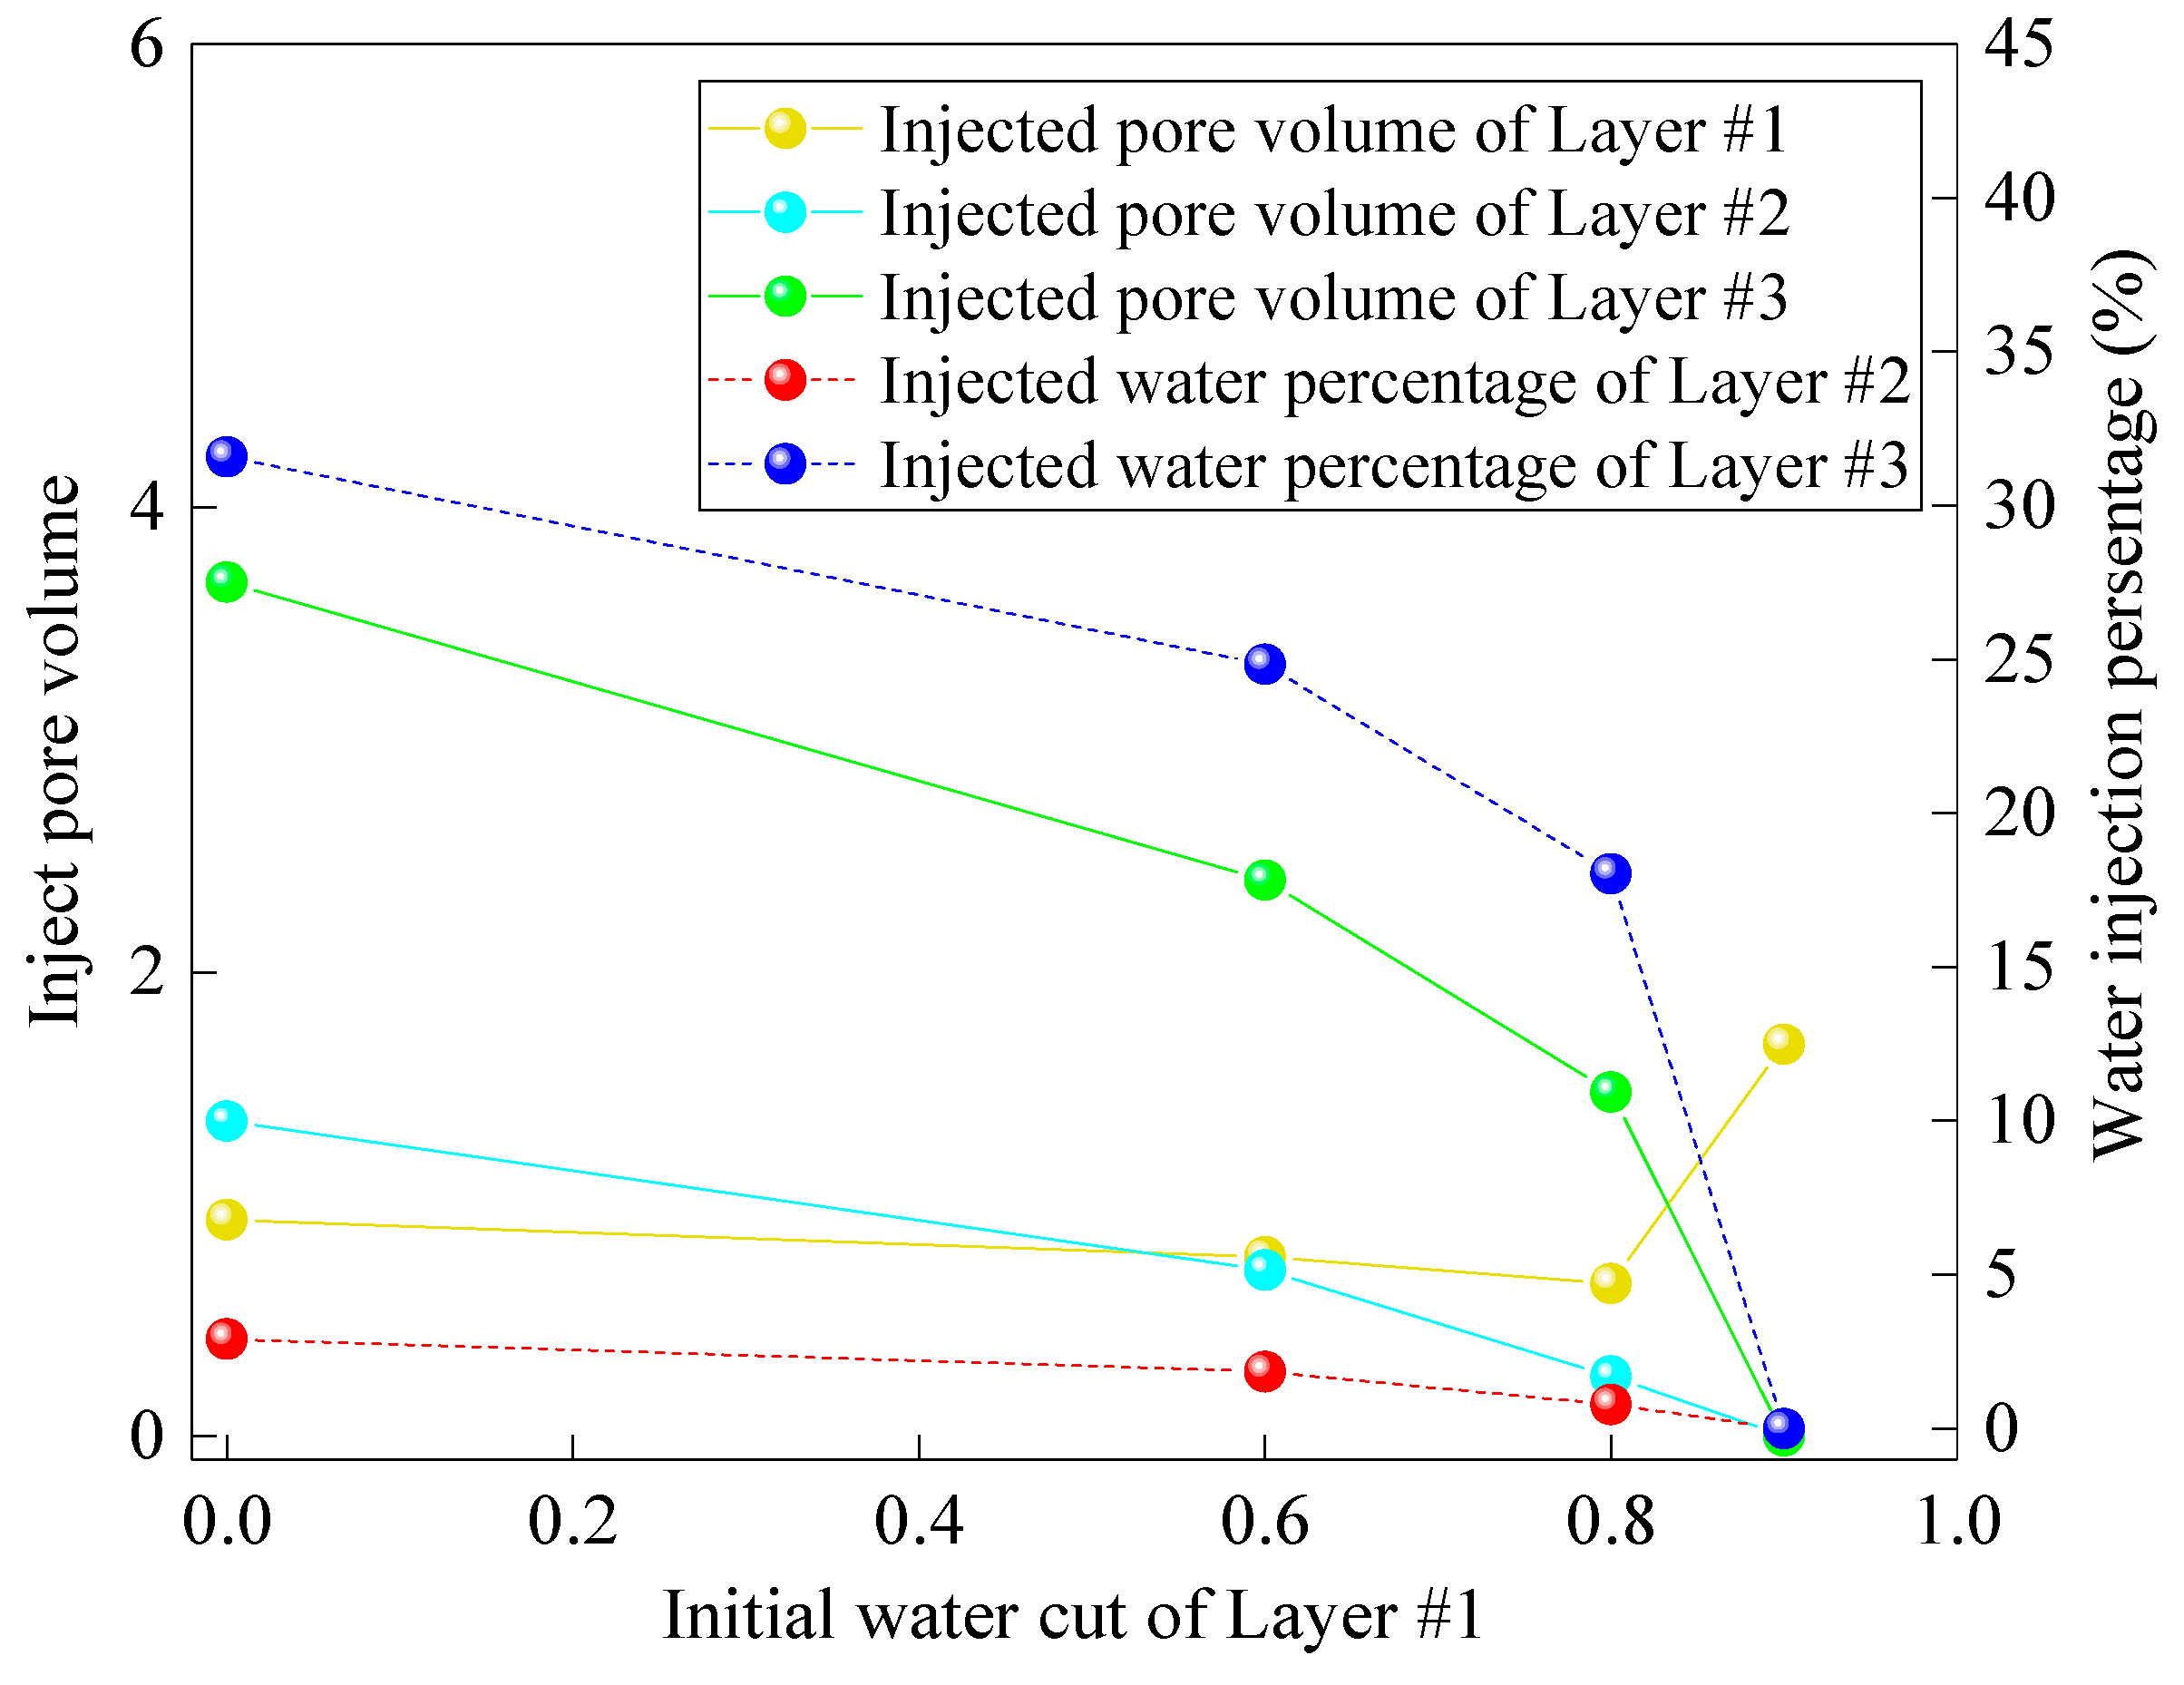
3.4. Influence of the Optimization Timing

The model of the balanced displacement in each water-flooding period indicates that the initial average water saturation of each layer determines the optimized water-injection rate. Moreover, the average water saturation of each layer is determined by the cumulative injection volume of each layer. The reservoir thickness and permeability are the most widely used parameters in determining the water-injection rate in the field. For the convenience of comparison, the water is injected according to the proportion of the reservoir thickness and permeability of each layer before the producer reaches the given water cut, and then the optimized water-injection rate is applied. There are four different water-cut scenarios in this paper, including 0, 0.6, 0.8, and 0.9 for layer #1, as the comparison benchmark. The basic information on the water cut, the average water saturation, and the water-injected volume under different scenarios is listed in Table 5.
The better the property of the layer is, the higher the water cut will be. The water cuts of layers #2 and #3 reach the water-cut limit while the water cut is only 0.9 in layer #1. The optimization of water injection is shown in Figure 6. The results show that the water required in the layers with better physical properties decreases gradually to 0 along with the later application of the optimized water injection. Further analysis shows that the water cut in those layers has already exceeded the water-cut limit, and the water cut of the producer with all layers would exceed the limit if one of those layers continued to be injected or produced. At the same time, the water-injection volume could be further increased based on the actual situation for the thin and poor layers since other reservoirs with better properties have already stopped water injection.

3.5. Result Analysis of the Experimental Verification

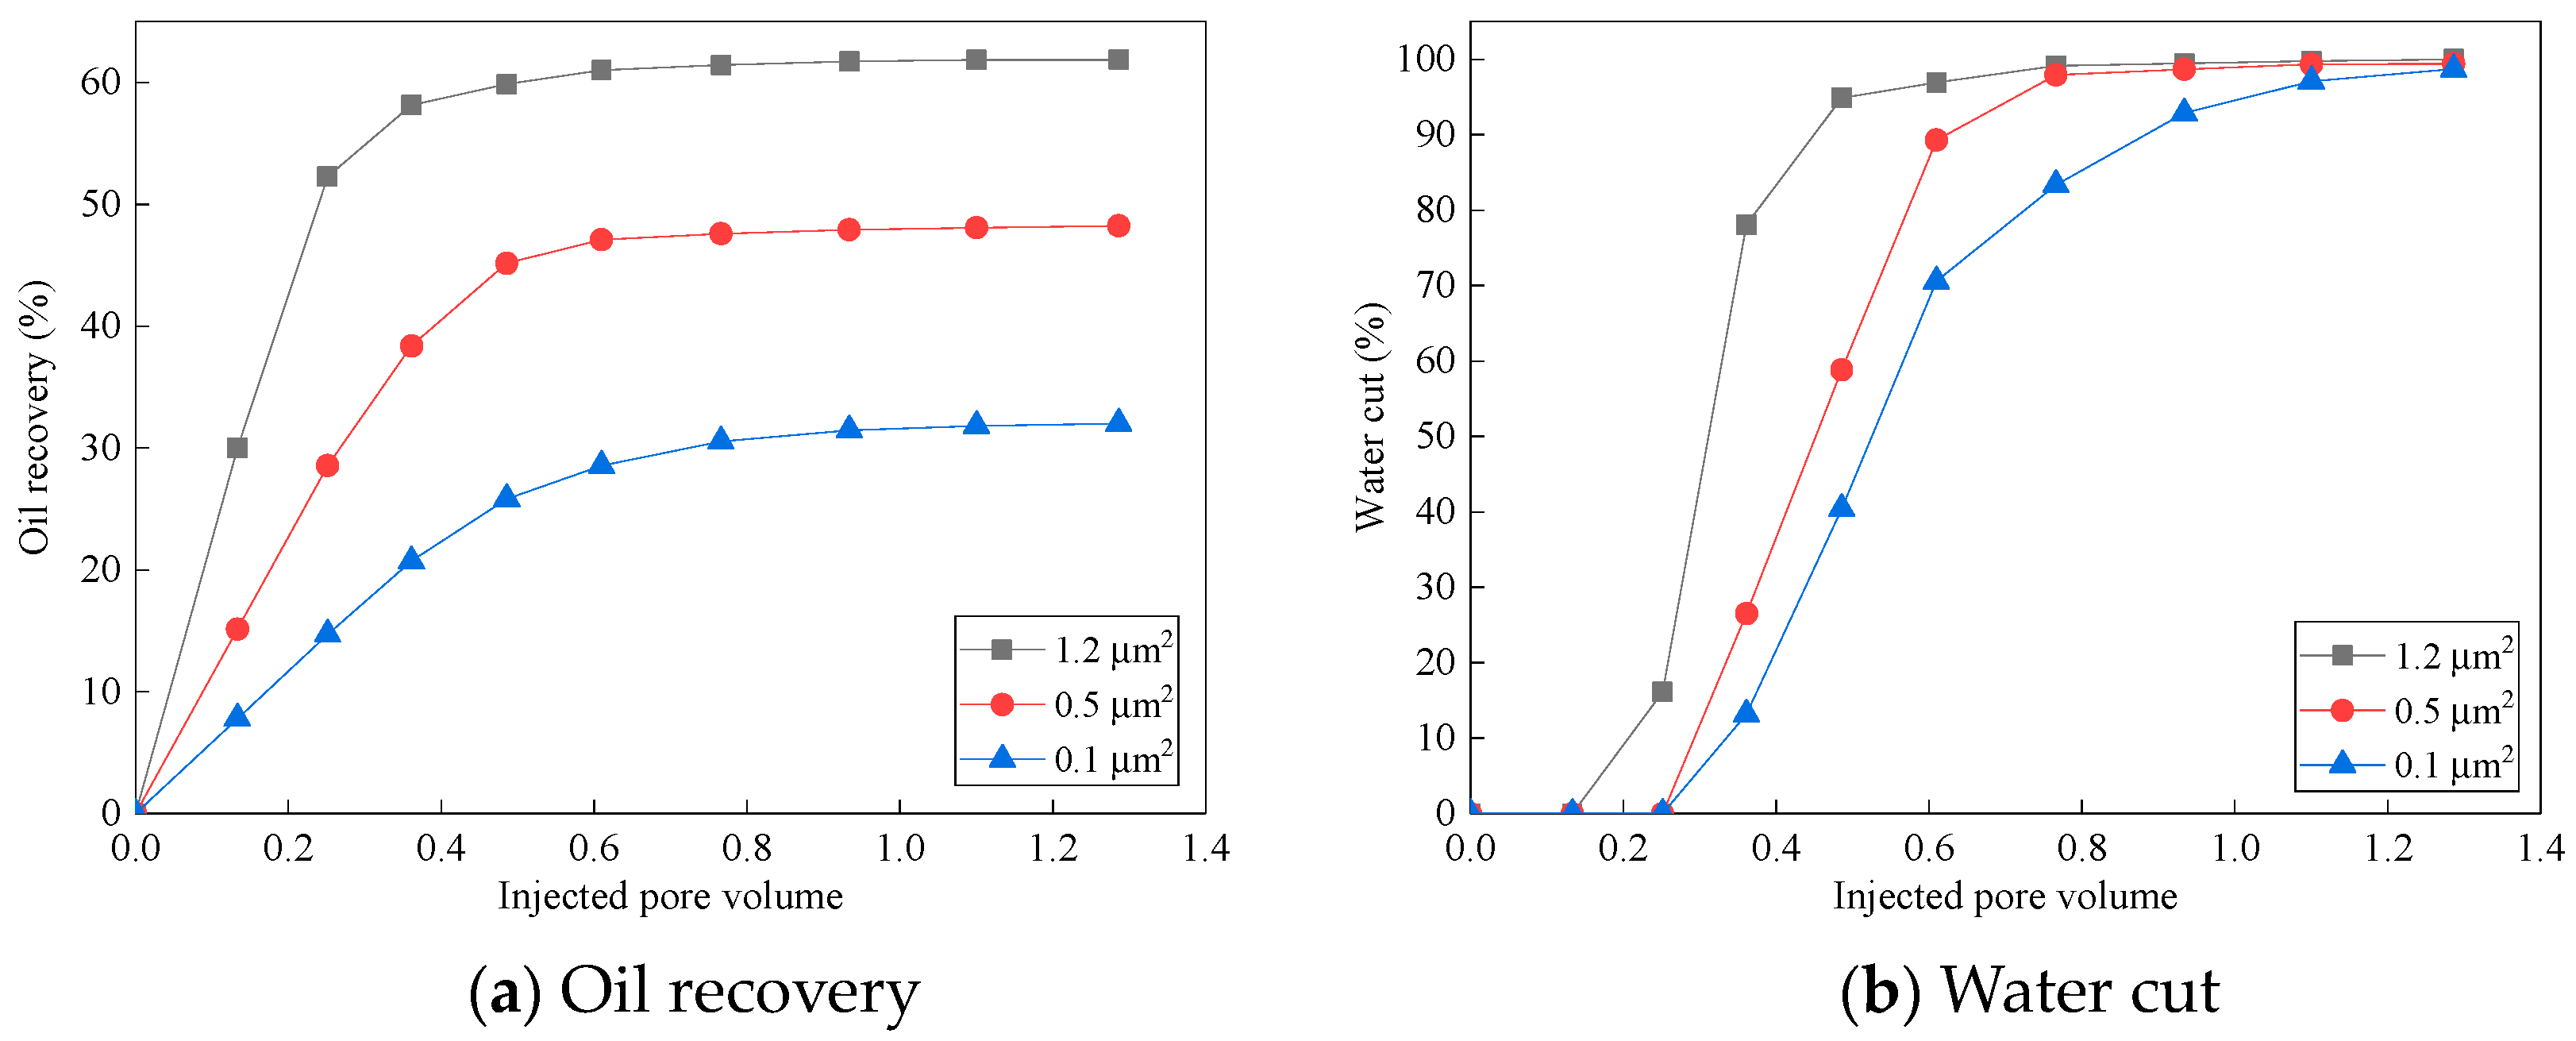
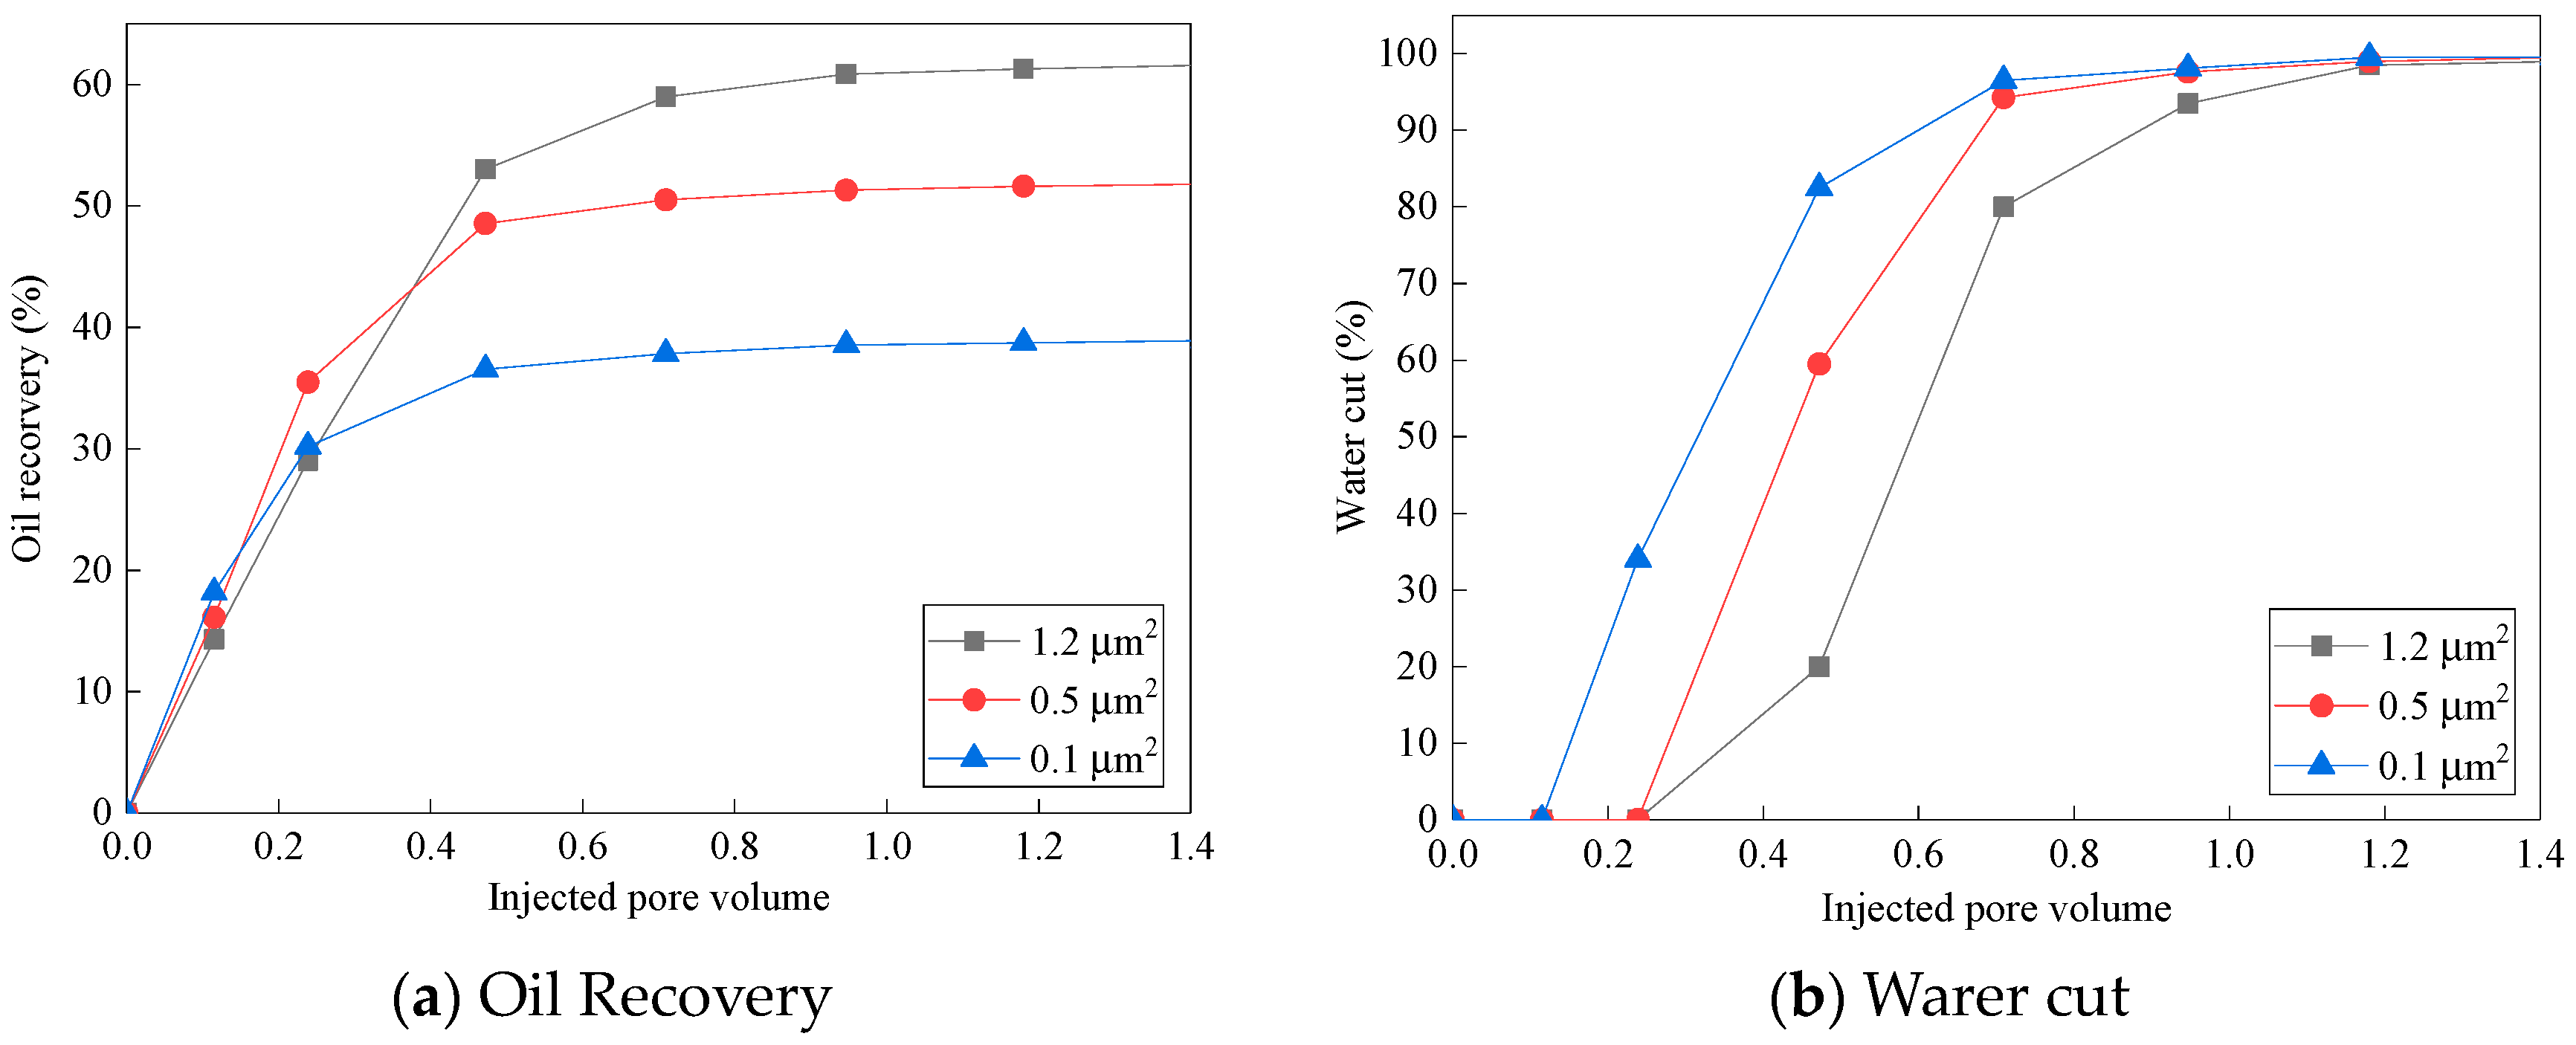
3.5.1. Generalized Water-Flooding Experimental Results

The oil–water relative permeability curves of the Berea cores with different permeability levels are shown in Figure 7. It could be concluded that the connate water saturation decreases, the relative permeability of water increases, and the iso-saturation points of the curves shift to the right as the permeability increases, which is consistent with the previous experimental results. Based on the oil–water relative permeability curves and the methods mentioned in this paper, the experimental schemes of traditional water injection and optimized water injection are given in Table 2.
The curves of the oil recovery and the water cut in experiments using Berea cores with traditional water flooding show that cores with a higher permeability could reach a relatively higher oil recovery of 61.9%, while cores with the lowest permeability could only reach an oil recovery of 32.0% (Figure 8a). The result shows that the water cut rises sharply as more water is injected into the cores with higher permeability at the beginning of the flooding experiments. Further analysis reveals that the flooding capacity of the cores with different permeability levels at the same pressure gradient strongly depends on the value of the permeability, which means the higher the permeability of the core is, the stronger the flooding capacity it will be. Once the water breakthrough occurs at the producer, the flow resistivity of oil and water reduces even further and the flooding capacity is further enhanced, resulting in more water being injected into cores with higher permeability. Then, the oil recovery is further increased (Figure 8b).

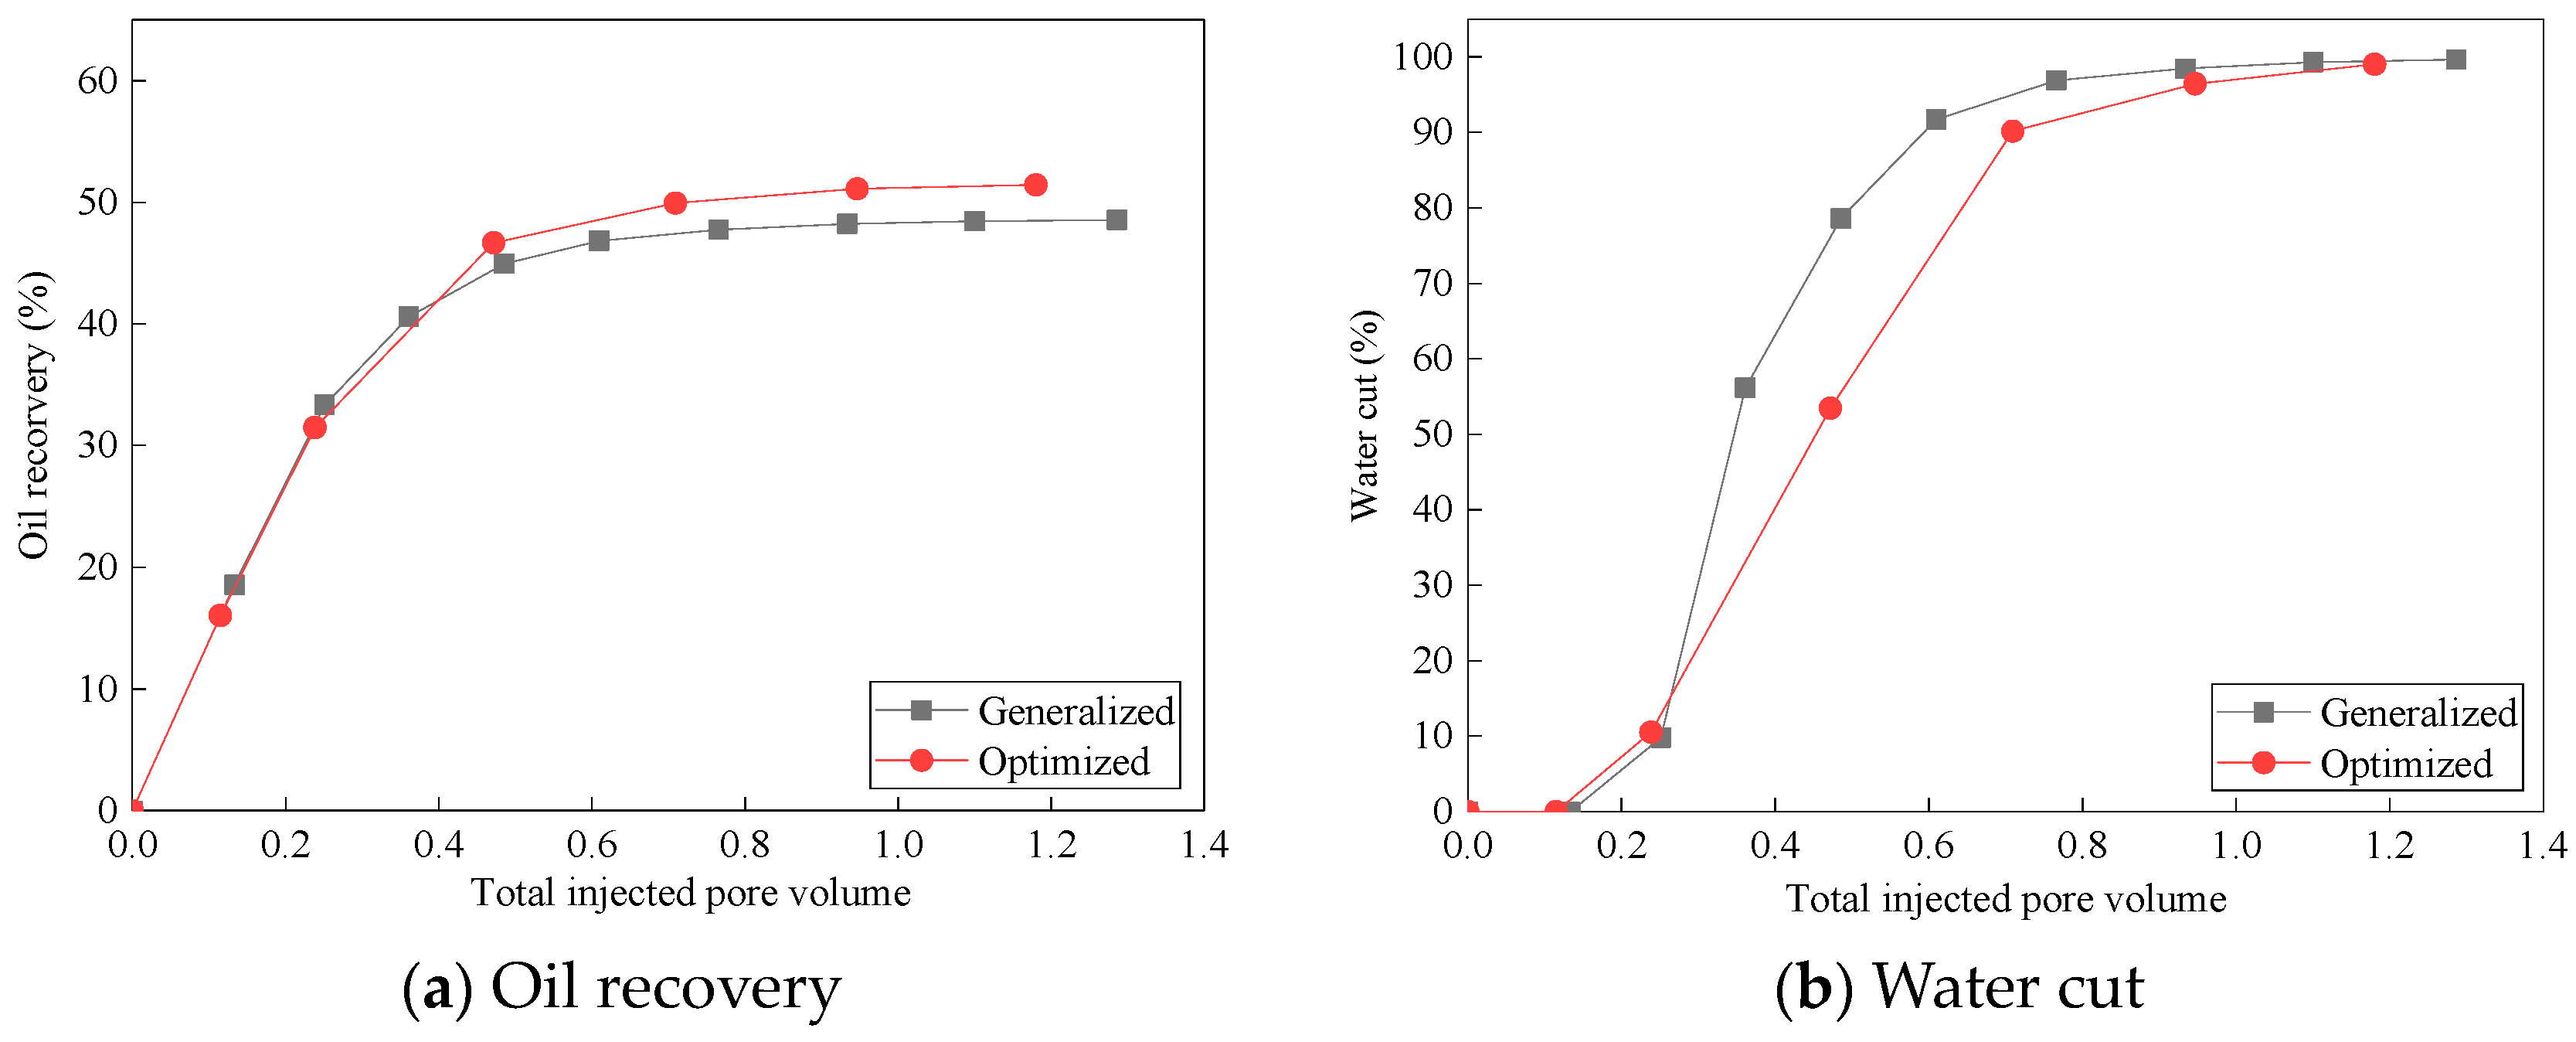
3.5.2. Optimized Water-Flooding Experimental Results

The curves of the oil recovery and the water cut in experiments using Berea cores with optimized water flooding are shown in Figure 9a and Figure 9b. The core with the highest permeability has the highest oil recovery of 61.9%, the core with medium permeability reaches an oil recovery of 51.8%, and the core with the lowest permeability reaches an oil recovery of 38.9% (Figure 9a), which is higher than in the generalized scenario. This is primarily because the cores with different permeability levels are flooded independently in the optimized water-flooding scenario, leading to the flooding being conducted at a constant injection rate in each core and the flowing capacity being much stronger than that in generalized flooding, and the flooding is more balanced in each core. Meanwhile, due to the complexity of the pore structure in the cores with the lowest permeability, the volume of the saturated crude oil is lower than others, and the water cut rises more sharply (Figure 9b).

3.5.3. Comparison of the Traditional and the Optimized Results

The curves of the total oil recovery and the water cut versus the total injection pore volume of the traditional and optimized experiments are shown in Figure 10. The comparison of the total oil recovery shows that the curves are quite similar when the injection pore volume is less than 0.2 PV. However, after 0.2 PV of water is injected, the trend of the total oil recovery increasing becomes significantly more pronounced during optimized water injection. Notably, the total oil recovery of the optimized flooding with the same water-injection volume is 3 percent higher than that of the traditional flooding, where the stratified water-injection rate is determined based only on reservoir permeability and thickness. This result is consistent with the theoretical analysis. The comparison of the water cut of the producer shows that it is much higher in traditional flooding (generalized) than in the optimized flooding in the late period of the experiments, which means the water cut increases more slowly and higher oil recovery is reached. This indicates that the optimized water injection proposed in this paper could enhance the water-flooding performance of a multi-layer sandstone oilfield significantly. However, there still exist many challenges when scaling laboratory findings to field-scale applications. Moreover, it is important to consider how best to determine key factors such as the geological reserve and relative permeability curves, which could be obtained using numerous experiments and production analyses combined with geological descriptions. The heterogeneity of the porosity and permeability of each layer is incorporated into the relative permeability curve of each layer.

4. Conclusions

  • A new method of optimizing water flooding in multi-layer sandstone oilfields in the entire water-flooding process and in a given water-flooding period is proposed based on reservoir engineering theory and optimization technology. Optimization mathematical models for maximizing oil recovery and NPV are developed. The stratified water-injection rate for each layer could then be optimized based on the overall water-flooding performance rather than reservoir permeability and thickness.
  • The new method is verified by water-flooding experiments using Berea cores. This method is also compared with the traditional method based on reservoir permeability and thickness. The total oil recovery using the new method is increased approximately by 3 percent after the injection of the same PV of water, which is consistent with the theoretical analysis.
  • The results show that the overall water-flooding performance can be significantly improved by optimized water injection in a multi-layer sandstone oilfield. The geological reserves of each layer and the endpoints of the relative permeability curves have the greatest influence on the optimized water-injection rate, rather than the reservoir permeability and thickness, which are the primary considerations in traditional water-injection-rate optimization.
  • The method proposed in this paper could not only be implemented in a multi-layer sandstone oilfield developing from beginning to end but also could be used in an oilfield that has been developed for years. This study also shows that the earlier the optimized water injection is conducted, the better the water-flooding performance will be.

Author Contributions

Conceptualization, J.G.; Methodology, E.Y. and C.D.; Software, J.G., E.Y., Y.Z., C.D. and Q.D.; Validation, J.G., H.F., Z.W. and B.Y.; Formal analysis, J.G., H.F. and X.Z.; Investigation, Q.D. and X.Z.; Resources, X.Z., Z.W. and J.Z.; Data curation, Q.D. and B.Y.; Writing-original draft, J.G. All authors have read and agreed to the published version of the manuscript.

Funding

This work is financially supported by the National Natural Science Foundation of China (51774090), Hainan Province Science and Technology Special Fund (ZDYF2022SHFZ107), and the Scientific Research and Technology Development Projects of PetroChina (2023ZZ22-02).

Data Availability Statement

The original contributions presented in the study are included in the article, further inquiries can be directed to the corresponding author.

Acknowledgments

We would like to thank Huazhou Li and Lin Du from the University of Alberta of Canada and Tianyu Chen from Northeastern University of China for their linguistic assistance during the preparation of this manuscript.

Conflicts of Interest

Authors Junhui Guo, Yu Zhao, Qinglong Du, Xianbao Zheng, Zhiguo Wang and Bingbing Yang were employed by the company PetroChina Daqing Oilfield Company Limited. The remaining authors declare that the research was conducted in the absence of any commercial or financial relationships that could be construed as a potential conflict of interest.

References

  1. Steven, W.P.; Marcelo, L. Practical Aspects of Waterflooding; SPE: Kuala Lumpur, Malaysia, 2023. [Google Scholar]
  2. Wang, Y.P.; Liu, Y.K.; Deng, Q.J. Current Status and Countermeasures of Development of Continental Sandstone Oilfields in Ultra-High Water Cut Stage in China. J. Northeast. Pet. Univ. 2014, 28, 1–9. [Google Scholar]
  3. Zhu, L.H.; Du, Q.L.; Jiang, X.Y.; Guo, J.H.; Wei, L.Y.; Jin, Y.X. Characteristics and Countermeasures of Three Major Conflicts during Ultra-High Water Cut Stage in Continental Multi-layer Sandstone Reservoirs. Acta Pet. Sin. 2015, 36, 210–216. [Google Scholar]
  4. Cui, C.Z.; Li, S.; Yang, Y.; Wang, J.; Huang, Y.S.; Wu, Z.W. Zonal Regulation Method for Reservoirs in Ultra-High Water Cut Stage. Acta Pet. Sin. 2018, 39, 1155–1161. [Google Scholar]
  5. Lu, F.M.; Cai, M.J.; Zhang, Y.; Xiao, X.H. Discussion on Classification Scheme and Research Method for Clastic Reservoir Architectures. Lithol. Reserv. 2020, 32, 1–11. [Google Scholar]
  6. Liu, H.; Pei, X.H.; Luo, K.; Sun, F.C.; Zheng, L.C.; Yang, Q.H. Current Status and Development Trend of Layered Water Injection Technology in Chinese Oil and Gas Fields. Pet. Explor. Dev. 2013, 40, 733–737. [Google Scholar] [CrossRef]
  7. Liu, H.; Li, Y.C.; Jia, D.L.; Wang, S.L.; Qiao, M.X.; Qu, R.Y.; Wen, P.Y.; Ren, Z.H. Current Status and Prospects of the Application of Artificial Intelligence in the Fine Adjustment of Water Injection Development Schemes. Acta Pet. Sin. 2023, 44, 1574–1586. [Google Scholar]
  8. Shi, W.; Ma, Y.; Tao, L.; Zhang, N.; Ma, C.; Bai, J.; Xu, Z.; Zhu, Q.; Zhong, Y. Study of the Enhanced Oil Recovery Mechanism and Remaining Oil State of Heavy Oil after Viscosity-Reducer-Assisted CO2 Foam Flooding: 2D Microvisualization Experimental Case. Energy Fuels 2023, 37, 18620–18631. [Google Scholar] [CrossRef]
  9. Shi, W.; Xu, L.; Tao, L.; Zhu, Q.; Bai, J. Flow behaviors and residual oil characteristics of water flooding assisted by multi-effect viscosity reducer in extra heavy oil reservoir. Pet. Sci. Technol. 2023, 41, 1231–1249. [Google Scholar] [CrossRef]
  10. Tao, L.; Liu, X.; Shang, H.; Zhang, N.; Shi, W.; Bai, J.; Xu, Z.; Zhu, Q.; Zhong, Y. Effects Evaluation on Multiround Injection of a N2 Foam & Viscosity Reducer to Improve the Recovery of Fault-Block Heavy Oil Reservoir with Edge-Bottom Water: A Two-Dimensional Visualization Experimental Study. Energy Fuels 2023, 37, 18785–18800. [Google Scholar]
  11. Zhai, X.; Wen, T.; Matringe, S. Estimation of Inter-Well Connections in Waterflood under Uncertainty for Application to Continuous Waterflood Optimization of Large Middle-Eastern Carbonate Reservoirs; SPE 182450; SPE: Kuala Lumpur, Malaysia, 2016. [Google Scholar]
  12. Ibrahima, F.; Maqui, A.; Negreira, A.S.; Liang, C.; Olalotiti, F.; Khebzegga, O.; Matringe, S.; Zhai, X. Reduced-Physics Modeling and Optimization of Mature Waterfloods; SPE 188313; SPE: Kuala Lumpur, Malaysia, 2017. [Google Scholar]
  13. Naderi, F.; Siavashi, M.; Nakhaee, A. A Novel Streamline-Based Objective Function for Well Placement Optimization in Waterfloods. ASME J. Energy Resour. Technol. 2021, 143, 102104. [Google Scholar] [CrossRef]
  14. Azamipour, V.; Assareh, M.; Mittermeir, G.M. An improved optimization procedure for production and injection scheduling using a hybrid genetic algorithm. Chem. Eng. Res. Des. 2018, 131, 557–570. [Google Scholar] [CrossRef]
  15. Azamipour, V.; Assareh, M.; Eshraghi, R. Development of an effective completion schedule for a petroleum reservoir with strong aquifer to control water production. J. Petrol. Explor. Prod. Technol. 2023, 13, 365–380. [Google Scholar] [CrossRef]
  16. Yousef, A.A.; Gentil, P.; Jensen, J.L.; Lake, L.W. A capacitance model to infer inter well connectivity from production and injection rate fluctuations. SPE Reserv. Eval. Eng. 2006, 9, 630–646. [Google Scholar] [CrossRef]
  17. Soroush, M.; Kaviani, D.; Jerry; Jensen, L. Interwell Connectivity Evaluation in Cases of Changing Skin and Frequent Production Interruptions. J. Pet. Sci. Eng. 2014, 122, 616–630. [Google Scholar]
  18. Yousefi, S.H.; Rashidi, F.; Sharifi, M.; Soroush, M.; Ghahfarokhi, A.J. Interwell connectivity identification in immiscible gas-oil systems using statistical method and modified capacitance-resistance model: A comparative study. J. Pet. Sci. Eng. 2020, 198, 108175. [Google Scholar] [CrossRef]
  19. Huang, Z.Q.; Wang, Z.X.; Hu, H.F.; Zhang, S.M.; Liang, Y.X.; Guo, Q.; Yao, J. Dynamic interwell connectivity analysis of multi-layer waterflooding reservoirs based on an improved graph neural network. Pet. Sci. 2023, in press. [CrossRef]
  20. Guo, J.H.; Wei, L.Y.; Sun, L.; Wang, H.T.; Dong, C.; Yin, S.M.; Yi, Z.L. Estimation of Interwell Connectivity of a Single Layer in a Stratified Reservoir Based on Physical Constraints. In Proceedings of the International Field Exploration and Development Conference 2023, Wuhan, China, 20–22 September 2023. IFEDC-202315564. [Google Scholar]
  21. Liu, F.L.; Mendel, J.M.; Nejad, A.M. Forecasting injector/producer relationships from production and injection rates using an extended Kalman filter. SPE J. 2009, 14, 653–664. [Google Scholar] [CrossRef]
  22. Zhao, H.; Kang, Z.J.; Zhang, Y.; Sun, H.T.; Li, Y. Connectivity Calculation Method for Characterizing Inter-Well Formation Parameters and Oil-Water Dynamics. Acta Pet. Sin. 2014, 35, 922–927. [Google Scholar]
  23. Zhao, H.; Kang, Z.J.; Sun, H.T.; Zhang, X.S.; Li, Y. An interwell connectivity inversion model for waterflooded multilayer reservoirs. Pet. Explor. Dev. 2016, 43, 106–114. [Google Scholar] [CrossRef]
  24. Zhao, H.; Xu, L.F.; Guo, Z.Y.; Liu, W.; Zhang, Q.; Ning, X.W.; Li, G.H.; Shi, L.H. A new and fast waterflooding optimization workflow based on INSIM-derived injection efficiency with a field application. J. Pet. Sci. Eng. 2019, 179, 1186–1200. [Google Scholar] [CrossRef]
  25. Zhao, H.; Liu, W.; Rao, X. Connection element method for reservoir numerical simulation. Sci. Sin. Technol. 2022, 52, 1869–1886. [Google Scholar] [CrossRef]
  26. Du, Q.L.; Zhu, L.H. New Method for Studying Layered Utilization Status of Oil and Water Wells. Pet. Explor. Dev. 2004, 31, 96–98. [Google Scholar]
  27. Song, K.P.; Wang, L.J.; He, X.; Wang, Y.; Liu, S.M. Dynamic Splitting Method for Predicting Distribution and Dynamic Indicators of Remaining Oil in Single Layers. Acta Pet. Sin. 2000, 21, 122–126. [Google Scholar]
  28. Li, C.L.; Li, L.M. Study on Well Spacing Design in Anisotropic Formations. Xinjiang Pet. Geol. 2003, 24, 559–561. [Google Scholar]
  29. Feng, Q.H.; Wang, X.; Wang, D.P.; Huang, Y.S. Argumentation of Development Effectiveness of Balanced Displacement in Waterflood Reservoirs. Oil Gas Geol. Recovery Effic. 2016, 23, 83–88. [Google Scholar]
  30. Cui, C.Z.; Liu, L.J.; Feng, Y.; Wu, G.H.; Chen, H.L.; Jin, C.L.; Feng, Y.; Wu, G.H.; Chen, H.L.; Jin, C.L. Zonal Water Injection and Rational Allocation Method Based on Balanced Displacement. Oil Gas Geol. Recovery Effic. 2017, 24, 67–71. [Google Scholar]
  31. Chang, H.J.; Sun, G.Y.; Chen, X.M.; Zhai, S.Q.; Zhang, Y.H. Research and Application of Plane Injection-Production Optimization Based on Balanced Displacement. Spec. Oil Gas Reserv. 2019, 26, 120–124. [Google Scholar]
  32. Chen, C.L. Development of Multi-layer Reservoirs Based on the Minimum Water Consumption Rate for Balanced Displacement. J. Xi’an Shiyou Univ. Nat. Sci. Ed. 2020, 35, 63–67. [Google Scholar]
  33. GB/T 28912-2012; General Administration of Quality Supervision, Inspection and Quarantine of the People’s Republic of China; Standardization Administration of the People’s Republic of China. Determination Method of Two-Phase Fluid Relative Permeability in Rocks. Standards Press of China: Beijing, China, 2013.
  34. Li, J.; Zhang, S.Y. Oil Layer Classification for Lasaxing Oilfields at High Water cut Stage. Pet. Geol. Oilfield Dev. Daqing 2007, 86–90. [Google Scholar]
  35. Wu, J.Y.; Wang, Z.Q.; Wang, Q.Y.; Shao, S.; Sun, S.T. Reservoir Evaluating Method Based on the Strong-permeating Capacities and Assemble-scatter Degrees of the Sandbodies. Pet. Geol. Oilfield Dev. Daqing 2018, 37, 65–70. [Google Scholar]
Figure 1. Schematic of the apparatus used in the water-flooding experiments.
Energies 17 01828 g001
Figure 2. The influence of changes in pore volume of the layers.
Energies 17 01828 g002
Figure 3. The influence of changes in the oil–water viscosity ratio.
Energies 17 01828 g003
Figure 4. The influence of the relative permeability curve of layer #1.
Energies 17 01828 g004
Figure 5. The influence of the relative permeability curve of layer #3.
Energies 17 01828 g005
Figure 6. Optimization results in given water-flooding periods.
Energies 17 01828 g006
Figure 7. Relative permeability curves of the Berea cores.
Energies 17 01828 g007
Figure 8. Results of generalized water-flooding experiments.
Energies 17 01828 g008
Figure 9. Results of optimized water-flooding experiments.
Energies 17 01828 g009
Figure 10. Comparison of the traditional (generalized) and the optimized results.
Energies 17 01828 g010
Table 1. Water quality analysis data of experimental water.
Ion TypeNa+Mg2+Ca2+ClHCO3SO42−TDS
on Concentration (mg/L)2316.411.610.12464.71913.062.96778.7
Table 2. Schemes of generalized water-injection and optimized water-injection experiments.
Displacement SchemeDisplacement ConditionLow Permeability (0.1 μm2)Medium Permeability (0.5 μm2)High Permeability (1.2 μm2)
TraditionalConstant Pressure (MPa)0.25
OptimizedConstant Flow Rate (cm3/min)3.86.18.4
Table 3. Basic parameters of each layer of the conceptual model.
Reservoir Layer NumberPermeability (μm2)Pore Volume (m3)Connate Water Saturation (%)Residual Oil Saturation (%) α 1 α 2 mn
#10.126935.8528.221.00.36752.90491.2931
#20.453831.3029.761.00.40332.20101.4317
#30.8215223.6829.381.00.49192.37391.6903
Table 4. Optimized water-injection scheme for each layer in the conceptual model.
Layer #1Layer #2Layer #3
Water Cut0.95340.96450.9883
Recovery of OOIP0.36830.43360.5043
Injected PV of Water0.93241.35813.6809
Water-Injected Ratio1.02.931.6
Table 5. Basic information of the 4 different given water-cut scenarios.
No.Layer #1Layer #2Layer #3
Water CutAverage Water SaturationWater-Injection VolumeWater CutAverage Water SaturationWater-Injection VolumeWater CutAverage Water SaturationWater-Injection Volume
10.000.35850.00000.00000.3130000.23680
20.600.50330.16050.90820.51220.64210.95520.51211.2842
30.800.53460.27480.95520.55041.09930.97690.54762.1987
40.900.56490.49320.97880.58611.97300.98920.58293.9460
Disclaimer/Publisher’s Note: The statements, opinions and data contained in all publications are solely those of the individual author(s) and contributor(s) and not of MDPI and/or the editor(s). MDPI and/or the editor(s) disclaim responsibility for any injury to people or property resulting from any ideas, methods, instructions or products referred to in the content.

