Article

Optimizing Hydrogen-Rich Biofuel Production: Syngas Generation from Wood Chips and Corn Cobs

1
FEUP Mechanical Engineering Department, Faculty of Engineering, University of Porto, 4099-002 Porto, Portugal
2
INEGI—Institute of Science and Innovation in Mechanical and Industrial Engineering, FEUP, 4099-002 Porto, Portugal
3
MEAM Department, University of Pennsylvania, Philadelphia, PA 19020, USA
*
Author to whom correspondence should be addressed.
Energies 2024, 17(8), 1859; https://doi.org/10.3390/en17081859
Submission received: 2 February 2024 / Revised: 21 March 2024 / Accepted: 31 March 2024 / Published: 13 April 2024

Abstract

:
This study investigates gasification using wood chips (WC) and corn cobs (CC) for hydrogen-rich syngas production. A simulation model developed in Aspen Plus was used to evaluate the performance of biomass gasification. The model incorporates a system of Fortran subroutines that automate the definition of input parameters based on the analysis of biomass composition. Furthermore, the model’s equilibrium constants were adjusted based on experimentally measured gas concentrations, increasing the precision of the variations. The numerical results predicted hydrogen yields of 65–120 g/kg biomass, with 60–70% energy efficiency for steam gasification (versus 40–50% for air gasification). The hydrogen concentration ranged from 34% to 40%, with  C O  (27–11%),  C O 2  (9–20%), and  C H 4  (<4%). The gasification temperature increased hydrogen production by up to 40% but also increased  C O 2  emissions by up to 20%. Higher biomass moisture content promoted hydrogen production by up to 15% but reduced energy efficiency by up to 10% if excessive. Steam gasification with wood chips and corn cobs shows promising potential for hydrogen-rich syngas production, offering benefits such as reduced emissions (up to 30% less  C O ) and sustainability by utilizing agricultural residues.

1. Introduction

The recent escalation in fuel prices has garnered widespread global attention due to its intricate relationship with the ongoing energy crisis. This crisis has been further exacerbated by the confluence of the COVID-19 pandemic [1,2] and the protracted Russian–Ukrainian conflict, both of which have had adverse consequences on global production and supply chains. This study delves into the multifaceted factors contributing to this intricate and precarious situation, elucidating the response of the European Union (EU) in adopting stringent geopolitical measures, including the imposition of sanctions and embargoes. These measures have had profound and far-reaching consequences, culminating in significant disruptions within the world’s oil supply chains. Notably, the focus of these measures has primarily centered on the second-largest global oil producer, Russia. Furthermore, recent years have witnessed a notable expansion of Russian export policies directed towards the European market, engendering a substantial dependency of European countries on Russian energy resources and petroleum [3]. The energy crisis has had a profound impact, with dependence on Russian energy a critical concern; as of September 2021, Europe relies on Russia for approximately 40% of its natural gas imports, highlighting significant vulnerability to geopolitical tensions and disruptions in supply. This strong dependence highlights the urgency of diversifying energy sources and reducing dependence on a single supplier.
Numerous European nations find themselves in a precarious position due to their overreliance on Russian energy resources, particularly as the onset of winter approaches, and their domestic energy reservoirs fall short of meeting escalating demands. Consequently, several European countries have resorted to making use of conventional, non-environmentally friendly energy sources, thereby deviating from the established path of prioritizing green and clean energy solutions. The looming specter of energy scarcity has compelled the temporary suspension of environmental objectives initially outlined during the COP26 climate conference held in Glasgow in 2021 [4].
In this context, the imperative for sustainable and innovative remedies has become increasingly pronounced. The biomass gasification technique allows biomass waste to be transformed into syngas, with it being a promising alternative. This approach harbors the potential to furnish energy in a more efficient and environmentally sustainable manner [5,6]. Across the globe, numerous nations possess substantial reservoirs of readily accessible biomass resources, encompassing agricultural residues and municipal organic waste. These biomass reservoirs represent a promising source of energy for the generation of combustible gas, offering a means to address the pressing energy challenges while adhering to sustainable practices. These biomass reservoirs represent a promising source of energy for the generation of combustible gas, offering a means to address the pressing energy challenges while adhering to sustainable practices. Limitations of biomass gasification technology include concerns regarding scalability and potential environmental impacts. While biomass gasification shows promise in converting organic materials into energy, its widespread implementation may be limited by the availability of feedstock and the need for efficient collection and transportation systems. Additionally, environmental considerations such as air emissions and land use impacts require careful assessment to ensure sustainable deployment.
This scientific article investigates, through a sensitivity study, a computational model in small-scale biomass gasification, specifically at the 1 MWth level [7], as a viable alternative for energy generation compared to traditional fossil fuel sources. Utilizing a sophisticated simulation model developed with Aspen Plus® V14 software, it facilitates a comprehensive examination of the dynamics of gas composition throughout the gasification process and an in-depth assessment of process efficiency [8,9]. This model has substantial potential in providing critical knowledge essential for the advancement and implementation of efficient and sustainable biomass gasification systems. Ultimately, our research contributes to the global transition to cleaner, more renewable energy solutions, not just in Europe but across the world [10,11].
The current state of gasification technology remains underdeveloped for the market, given the intricacies of the gasification process and the challenges in accurately predicting the composition of the resulting gas. While  C O C O 2 H 2 C H 4 , and  C 2 H 4  constitute the primary gases generated, their precise quantities often remain unknown and can vary significantly based on biomass characteristics, reactor type, gasifying agent, and operating conditions [12,13]. Among the suggested methods for turning biomass into energy is downdraft gasification, which combines internal combustion engines with air as the gasification agent. With its high electrical efficiency (25%) and low tar generation, this technology makes it easier to clean gas, which is necessary for use in ignition gas engines. According to [13,14,15], tar develops as a complex mixture of high molecular weight hydrocarbons during the gasification process.
At the gasifier tubes’ outputs and filters, this tar tends to condense into a viscous liquid that clogs and blocks them, making downstream operations difficult. The generated gas’s high tar content causes operational issues for the gasifier and downstream equipment in addition to making it unsuitable for many commercial applications [16]. As such, it is critical to keep tar levels below 1 g/Nm3 and aim for the lowest content feasible; the precise threshold will vary according to the planned use [17]. Predicting the gas’s composition is therefore a challenging undertaking. For instance, chemical equilibrium is frequently used as a predictor of the produced syngas composition from biomass gasification; however, recent research on the topic indicates that this method is not consistent for predicting the composition of produced gas during gasification [14]. For instance, a large overestimation of  H 2  and  C O  and underestimation of  C H 4  concentration were found for biomass in bubbling fluidized reactors [18].
The second widely used approach involves process simulation using Aspen Plus. This method, highlighted for its user-friendly interface, relies on the extensive compound database and thermodynamic models available in Aspen Plus. It offers flexibility in handling solid materials like biomass, making it an efficient tool for understanding and optimizing biomass gasification processes [19,20].
Through this work, our aim is to promote greater exploration of sustainable energy technologies, offering pertinent information to inform political and strategic decisions regarding the ongoing energy transition. By clarifying the merits of small-scale biomass gasification and providing a robust simulation model for its analysis, we aspire to play a key role in facilitating a transition to more environmentally conscious and sustainable energy systems, aligning with global efforts to combat climate change and guarantee a greener future.

2. Materials and Methods

The gasification model for the combined forest and organic residue mixture was meticulously constructed and fine-tuned within the Aspen Plus simulator. This simulation platform enables a comprehensive evaluation of the model’s viability and allows us to elucidate crucial project parameters. These parameters encompass the proportions of the biomass mixture, the operational temperatures of diverse reactors, and an array of other key factors. The overarching objective is to optimize these conditions to achieve the highest quality gas output and maximize yield [21,22,23,24,25].
The biomass feedstock utilized in this research comprises agricultural and forest residues, and a summarized analysis of its composition can be found in Table 1. This analysis provides a comprehensive overview of the key characteristics of the biomass, serving as an essential reference point for the gasification process and subsequent assessments of gas quality and yield.
The Aspen Plus model flowchart, as illustrated in Figure 1, illustrates the gasification process under a set of boundary conditions. This model operates under isothermal and steady-state conditions, employs a two-dimensional structure, and operates at atmospheric pressure (~1 bar) with gases following ideal gas behavior. Pressure drops within the system are disregarded and the resulting ash is considered inert. The gasification reactions are based on a thermodynamic kinetic model, with all reactions quickly reaching chemical equilibrium [27,28,29]. The tar composition is assumed to include  C 6 H 6 C 6 H 6 O C 7 H 8 , and  C 10 H 8 , and heat loss from the gasifier is not accounted for. This kinetic model integrates Arrhenius reactions and fluid dynamics, thereby enhancing the model’s representation of the gasification process.

Simulation and Strategy Modeling

In the Aspen Plus modeling framework, the waste treatment process was developed in two stages: (i) pre-treatment, which in turn can be segregated into two processes, drying and crushing, and (ii) gasification; a sequential modular simulation approach was developed for the process of simulating the reactor on an auto-thermal pilot scale, using Aspen Plus software. The reactor was modeled considering the process divided into four successive sub-processes: DRY (R-1), pyrolysis zone, primary (R-2.1), which also includes the secondary pyrolysis step (R-2.2), combustion zone (R-3), and reduction zone (R-4), for facilitating convergence, as shown in Figure 1 and Figure 2. The descriptive details of the model with Aspen Plus and these components and the flow conditions are presented in Figure 2. In addition, Table 2 shows the chemical reactions and Table 3 respective kinetic expressions considered in blocks R-3 and R-4. Both are considered distinct and independent procedures, each represented by its dedicated block; however, they physically represent the same component, which is the gasifier, which will be the focus of this work; further information on and details of the pre-treatment can be found in the published AIP conference proceedings. The entire pretreatment process up to the input stage in the gasifier was modeled and presented in the article “Analysis of Forest Residues pretreatment using solar photovoltaic”.
At first, coal and biomass were considered unconventional components. Additionally, the ULTANAL and PROXANAL models’ approximate and elemental analyses were defined in specific Aspen Plus properties for that stream class. The enthalpy and density of biomass, coal, and ash unconventional components were calculated using the HCOALGEN and DCOALIGT models, respectively. HCOALGEN uses the approximate and ultimate composition of the biomass, as well as several types of correlations that are available in Aspen Plus, to determine the heat of combustion [30].
ULTANAL is required for the DCOALIGHT model, which is based on the IGT (Institute of Gas Technology) correlation. Ash was chosen as an unconventional component, and considered inert. The Peng–Robinson package with the Boston Mathias function was chosen because it is the most appropriate for the high-temperature gasification processes of organic carbonaceous biomass. The elements C and S were characterized as solid phase, and the compounds  H 2 O 2 C O C O 2 C H 4 C 2 H 4 H 2 O H 2 N H 3 C 6 H 6 C 6 H 6 O , and  C 10 H 8  were characterized as fluids.
In the gasifier (Figure 3), after pretreatment of the feedstock, the different processes take place by controlling the humidification, represented by DRY, assisted by the R-1 calculator subroutine. Subsequently, the primary pyrolysis process begins, thus generating input data for the subsequent gasification model. After the drying step, a second reactor, specifically an RStoic reactor, seen in the pyrolysis zone, aided by the R-2.1 subroutine calculator, was introduced into the model to perform the primary pyrolysis step. The data needed for this reactor came from an Microsoft® Excel® for Microsoft 365 MSO (Version 2402)and Fortran R-2.1 subroutine, incorporated into the computational model, which is one of the great differences of this work, as this model is autonomous and easy to use, improving the prediction of the yield and elemental composition of pyrolytic products. Making use of only the data previously provided by the ultimate analysis and elementary analysis of the biomass used in the initial input process, making it a much more adaptive process to simulate other types of biomass and inductive when compared to other computational models used in the literature, in addition, this approach considers pyrolysis in two stages, increasing the precision of the results, as thermal cracking of the primary pyrolysis products is carried out, which can be considered as biomass that has not yet been converted, with three distinct species for tar (represented as a mixture of  C 6 H 6 C 6 H 6 O C 7 H 8 , and  C 10 H 8 ) and ash. The percentage composition of each of these constituents is determined through meticulous adjustments to the mass balance performed by the subroutine. The empirical model designed for this purpose manifests itself as a system of linear equations, with key equations encompassed in Equations (1)–(13) [31,32] which were incorporated into these recursive subroutines:
Y c h , F = 0.106 + 2.43 · exp ( 0.66 · 10 2 · T )
Y C , c h = 0.93 0.92 · exp ( 0.42 · 10 2 · T )
Y O , c h = 0.07 + 0.85 · exp ( 0.48 · 10 2 · T )
Y H , c h = 0.41 · 10 2 + 0.10 · exp ( 0.24 · 10 2 · T )
Y H 2 , F = 1.145 ( 1 exp 0.11 · 10 2 · T ) 9.384
Y C H 4 , F = 2.18 · 10 4 0.146 · Y C O , F
Y C O , F = ( 3 · 10 4 + 0.0429 1 + T / 632 7.23 ) 1 · Y H 2 , F
Y C , tar = ( 1.05 + 1.10 4 · T ) · Y C , bio
Y O , t a r = ( 0.93 2.2 · 10 4 · T ) · Y O , bio
Y H , tar = ( 0.93 3.8 · 10 4 · T ) · Y H , bio
Y C , bio Y C , ch · Y ch , F = Y C , tar · Y tar , F + Y C , C H 4 · Y C H 4 , F   + Y C , CO · Y C O , F   + Y C , C O 2 · Y C O 2 , F  
Y O , bio Y O , ch · Y ch , F = Y O , tar · Y tar , F + Y O , CO · Y C O , F   + Y O , C O 2 · Y C O 2 , F     + Y O , H 2 O · Y H 2 O , F  
Y H , bio Y H , ch · Y ch , F = Y H , tar · Y tar , F + Y H , H 2 · Y H 2 , F   + Y H , C H 4 · Y C H 4 , F   + Y H , H 2 O · Y H 2 O , F  
Here, the symbols  Y ch , F Y H 2 , F   Y C O , F   Y H 2 O , F    and  Y C O 2 , F      denote the yields of  H 2 C O H 2 O , and  C O 2  resulting from the biomass pyrolysis zone, respectively. Meanwhile,  Y C , b i o Y C , c h Y H , t a r Y H , b i o Y H , c h Y H , t a r Y O , b i o Y O , c h , and  Y O , t a r    represent the  C H O  composition of biomass, coal, and tar, respectively. In this context,  Y i , j  signifies the mass fraction of the chemical element i (where i can be  C H , or  O ) within the compound j (where j can be  C O C O 2 C H 4 , or  H 2 O ), expressed in kilograms of element i per kilogram of compound j.
The presented model comprises four primary stages: drying, pyrolysis, combustion, and reduction. The primary objective of this model has consistently been to faithfully replicate real-world scenarios. Consequently, it extensively examines the production of tar and biochar throughout the process. In the Aspen Plus simulations, it was assumed that both the drying and pyrolysis of forest residue biomass would occur as separate stages. This approach enables a more comprehensive analysis, accounting for varying conditions and different gasifying agents, including options such as air or steam. The products from the combustion zone are calculated by the Arrhenius kinetics, as shown in Table 2:
Table 2. Kinetic parameters adopted in the model. Evaluated according to [32].
ProcessNo.Stoichiometric Chemical EquationsKineticsRef.
R-31Partial oxidation of C:   r = k · T · e E a R T α = 1 + 2 f 1 + f · 6 d p [ O 2 ] [33,34]
  α C s + O 2 2 ( α 1 ) C O + ( 2 α ) C O 2   With   f = 4.72 · 10 3 e E a R T
2 Total   oxidation   of   C O :   r = k · T · e E a R T C O O 2 0.25 [ H 2 O ] 0.5 [35,36]
  C O + 1 / 2 O 2 C O 2
3 Partial   oxidation   of   C H 4 :   r = k · T · e E a R T [ C H 4 ] 0.7 O 2 0.8 [37]
  C H 4 + 1 / 2 O 2 C O + 2 H 2
4Hydrogen oxidation   r = k · T · e E a R T [ H 2 ] O 2 [35,36]
  H 2 + 1 / 2 O 2 H 2 O
5Partial oxidation of phenol   r = k · T · e E a R T [ C 6 H 6 O ] 0.5 O 2 [37]
  C 6 H 6 O + 4 O 2 6 C O + 3 H 2 O
6Partial oxidation of benzene:   r = k · T · e E a R T [ C 6 H 6 ] 0.5 O 2 [38]
  C 6 H 6 + 9 / 2 O 2 6 C O + 3 H 2 O
R-47Water gas:   r = k · T · e E a R T [ C ] H 2 O [39,40]
  C + H 2 O C O 2 + H 2
8Water–gas shift:   r = k · T · e E a R T C O H 2 O C O 2 [ H 2 ] k e q [41]
  C O + H 2 O C O 2 + H 2   With   k e q = 0.022 e 34.73 R T
9   Steam   reforming :   C H 4 + H 2 O C O 2 + 3 H 2   r = k · T · e E a R T C H 4 H 2 O [40,41]
10Boudouard:  C + C O 2 2 C O     r = k · T · e E a R T C [34,40]
11   C 6 H 6 O C O + 0.4 C 10 H 8 + 0.1 C H 4 + 0.75 H 2   r = k · T · e E a R T [ C 6 H 6 O ] [42,43]
12   C 6 H 6 O + 3 H 2 O 4 C O + 0.5 C 2 H 4 + 0.1 C H 4 + 3 H 2   r = k · T · e E a R T [ C 6 H 6 O ] [43]
13   C 10 H 8 6.5 C + 0.5 C 6 H 6 + 0.5 C H 4 + 1.5 H 2   r = k · T · e E a R T [ C 10 H 8 ] 1.6 [ H 2 ] 0.5 [40,44]
This was used as a basis for the kinetic model data of the oxidation and reduction steps of the model proposed by [45], which, despite having some differences in the model, still manages to reach good agreement with the results. The pre-exponential factor for each chemical reaction in the model was used based on different values from the literature and adjusted for the respective concentrations of the components, maintaining the other parameters of the procedure, similar to the methodological process adopted by Puing Gamero et al. [46]. When compared to the presented experimental data, the results show that the improvement in hydrogen production through biomass steam gasification depends on the amount of steam and biomass fed to the gasifier as well as the operating temperature.
Furthermore, this study presents a comprehensive investigation of kinetic parameters. Some kinetic parameters were extracted from the existing literature (Martinez-Gonzalez et al. (2018) [40] and Champion et al. (2014) [33]) and others were developed based on models established in the literature. During this process, selected kinetic parameters were adjusted to align with the experimental data [33,47]; the pre-explorational factor adjustments of selected reactions are shown in Table 3.
Table 3. Parameter kinetic pre-exponential factors adopted in the model.
Simulation ParametersValue
ReactionKEa (cal/mol)
(1)   3.7 · 10 10 35826.8449
(2)   1.78 · 10 10 42992.26139
(3)   1.58 · 10 12 48246.87112
(4)   1.08 · 10 7 2579.53568
(5)   6.55 · 10 2 19155.44091
(6)   2.4 · 10 11 30094.58298
(7)   8 · 10 3 11918.41024
(8)   2.78 · 10 2 3009.45829
(9)   4.92 · 10 11 29855.73708
(10)   1.05 · 10 13 32244.19604
(11)   1.00 · 10 07 23884.58966
(12)   1.00 · 10 07 23884.58966
(13)   1.00 · 10 14 83596.06382

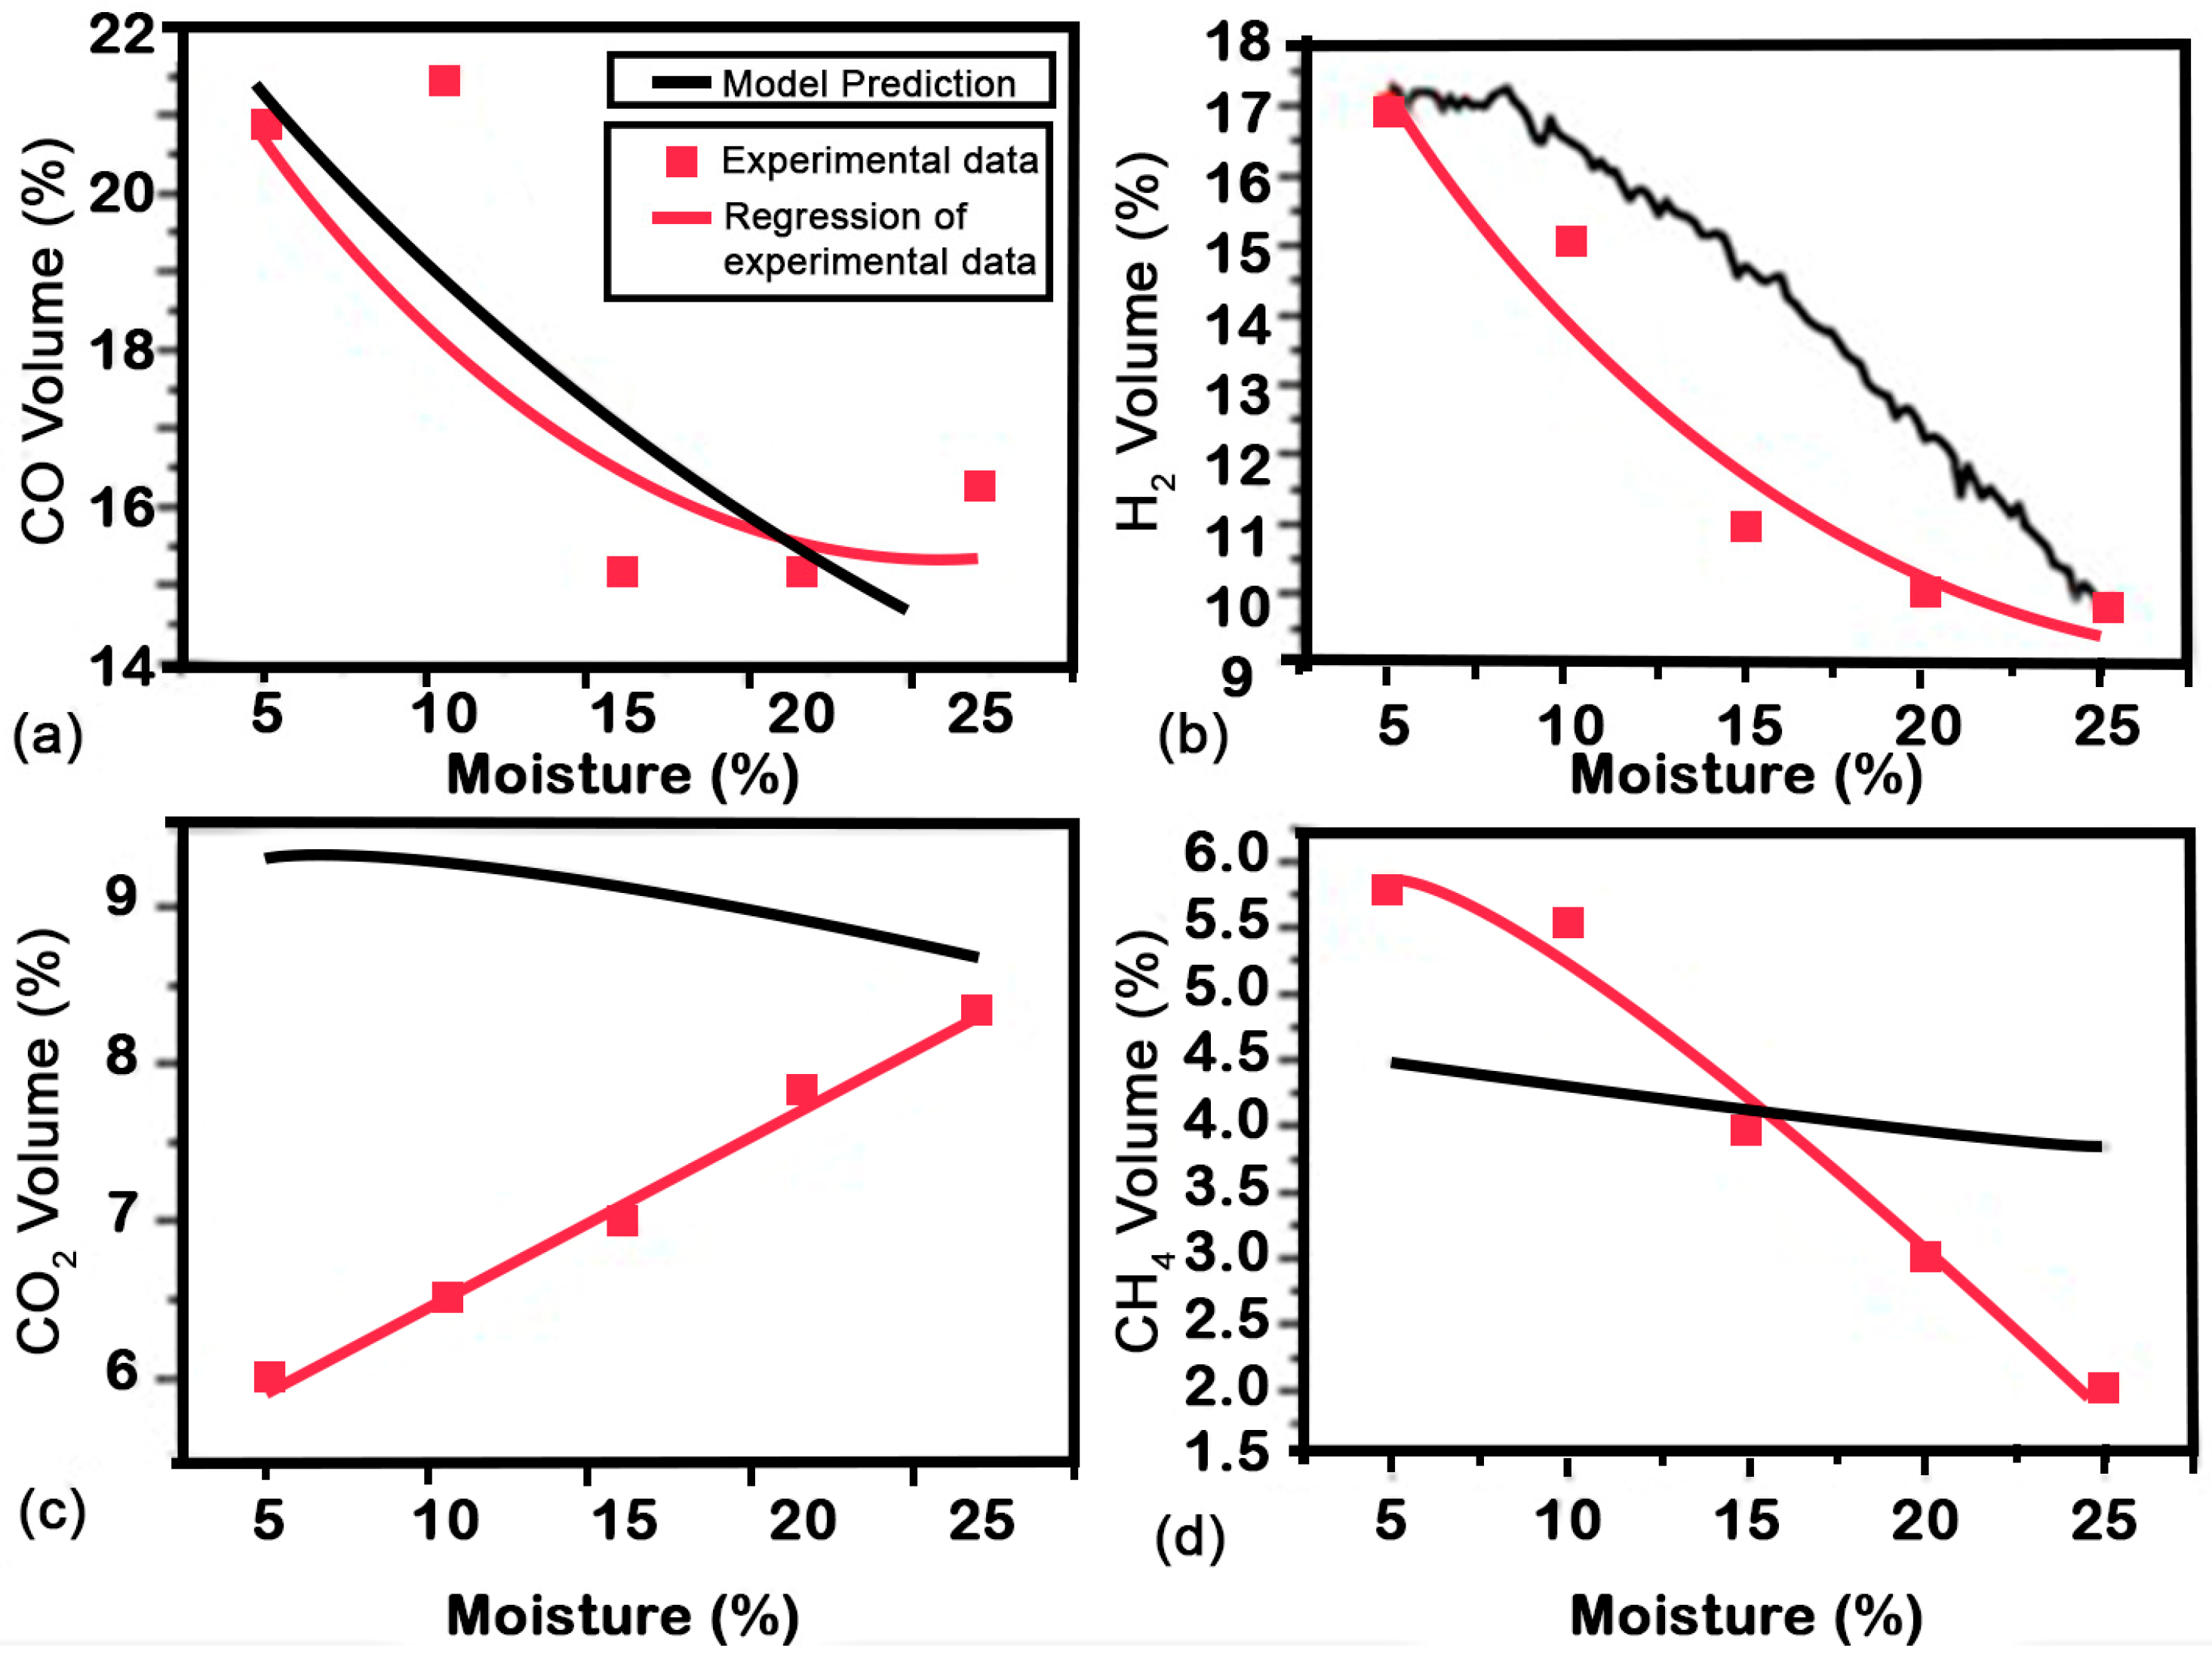
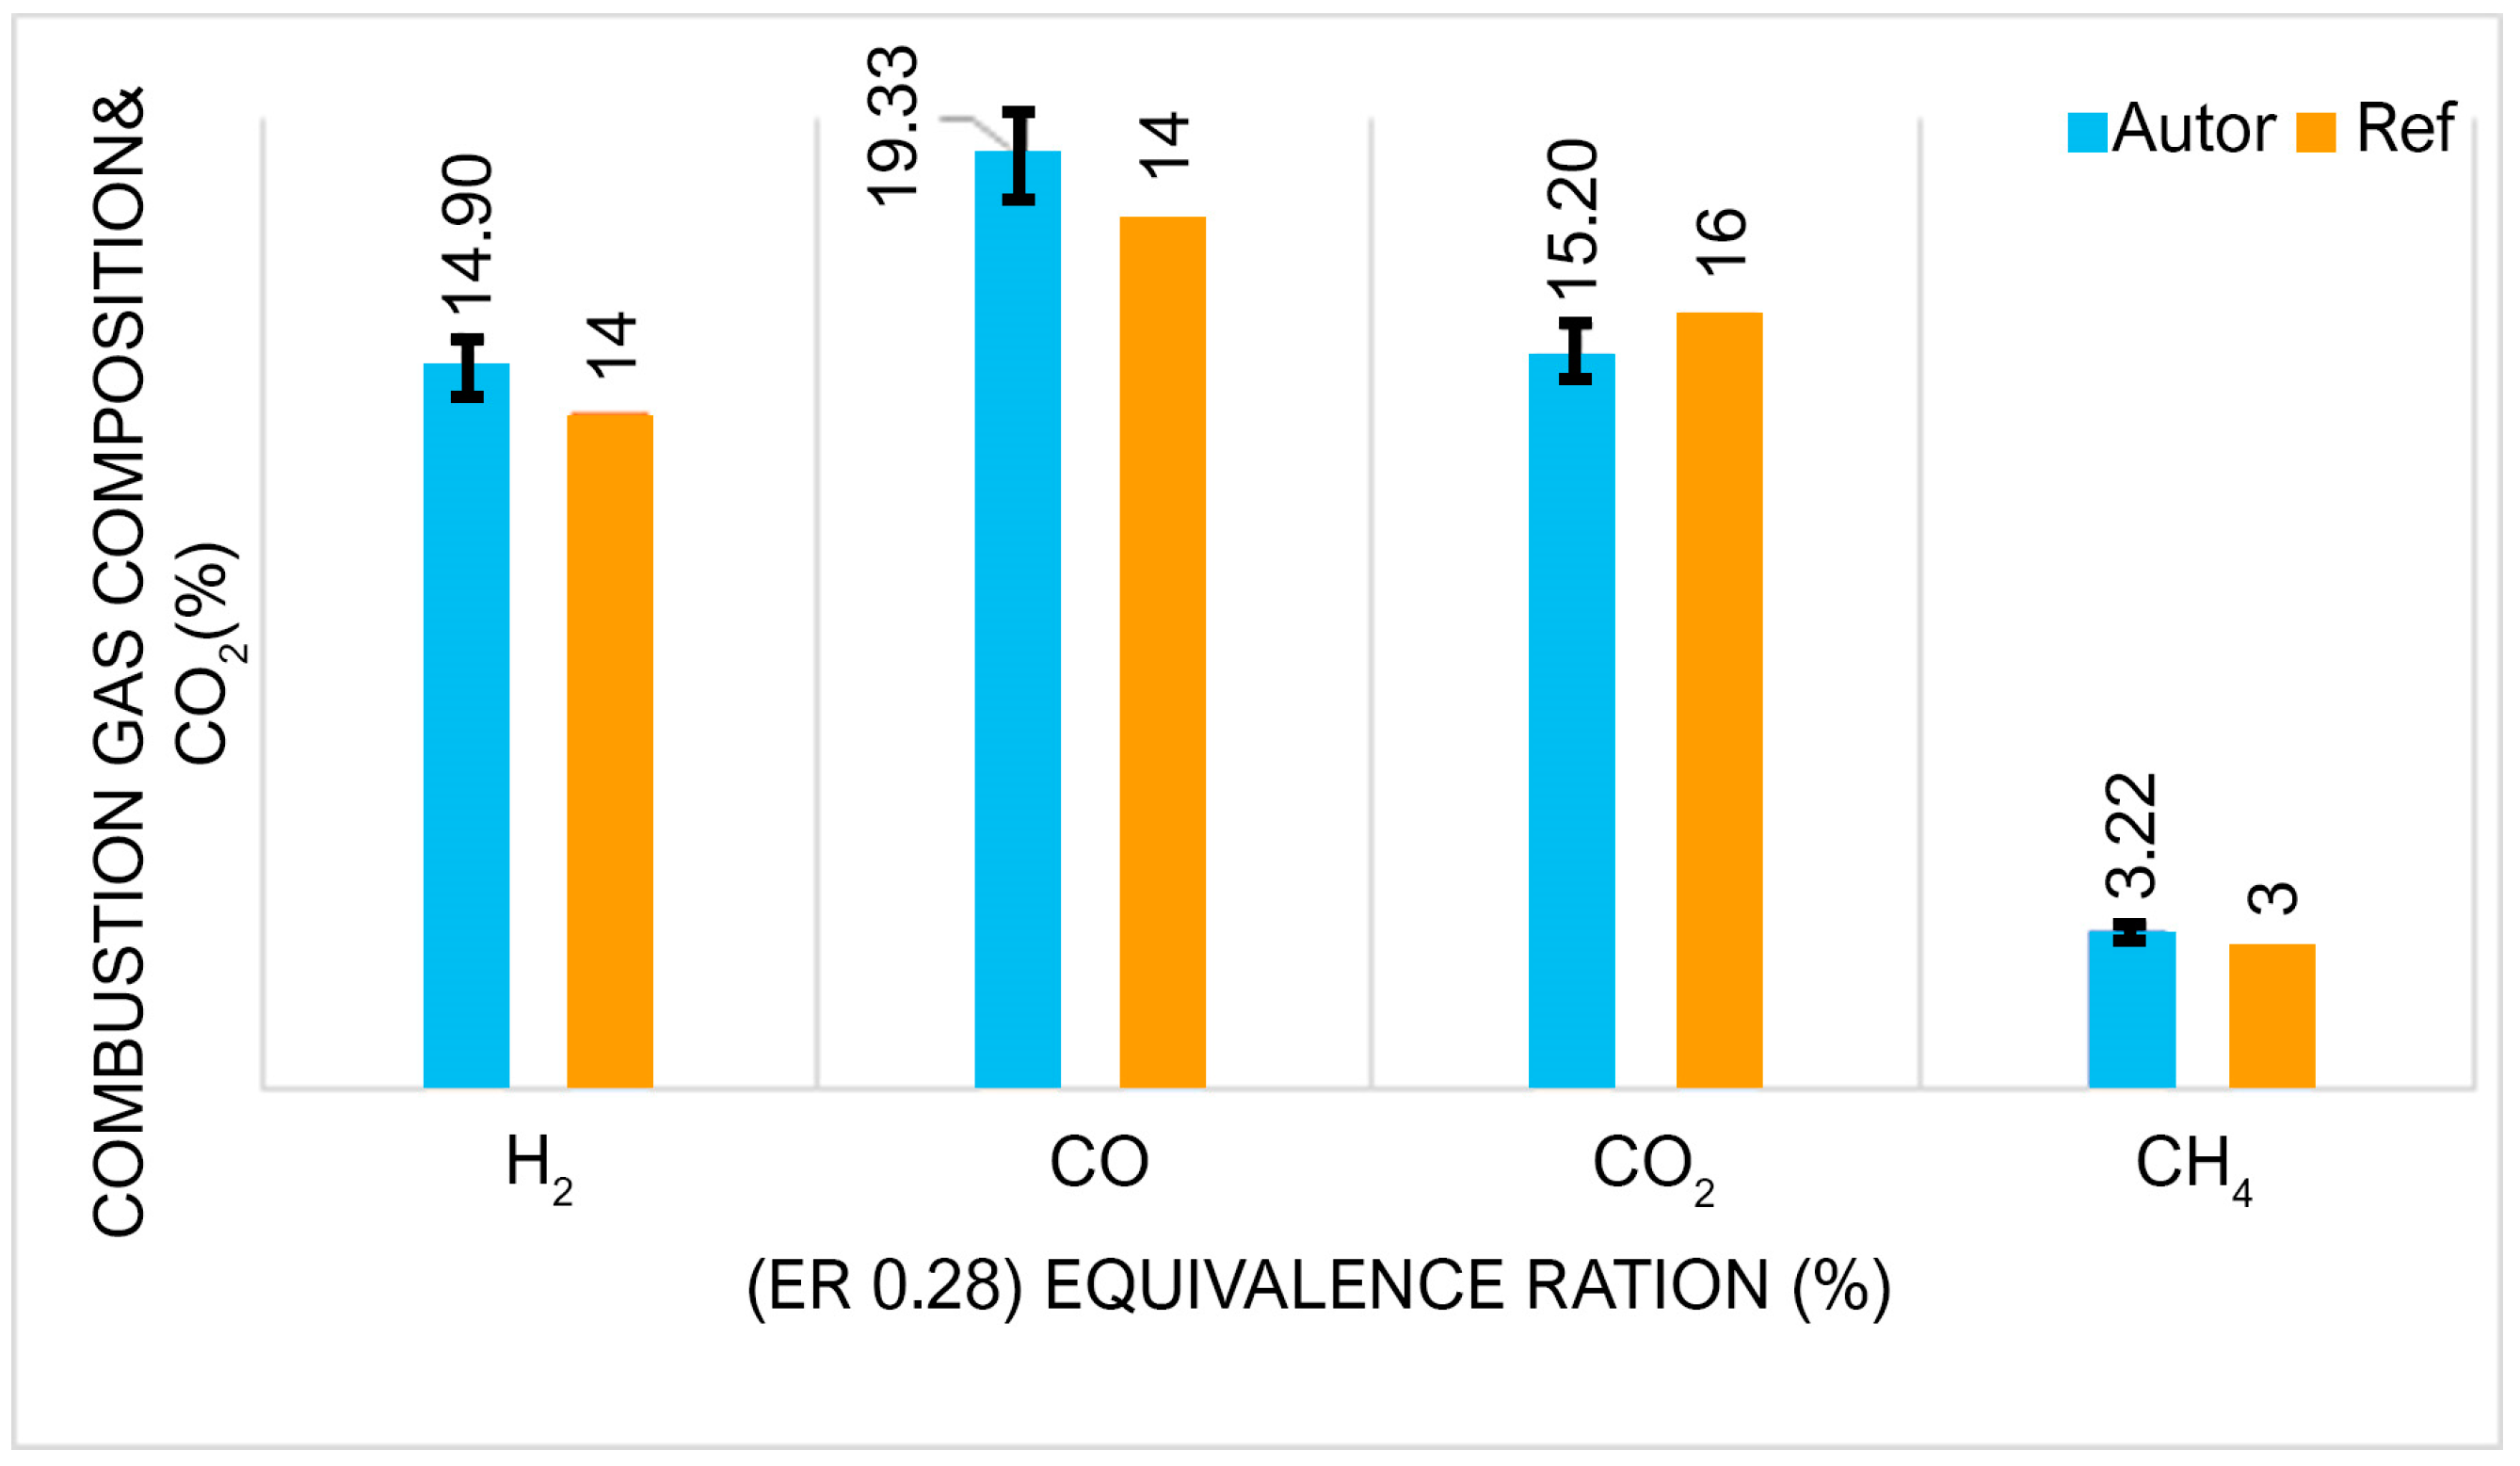
3. Results and Discussion

Exploring the complex interactions of variables and factors that influence syngas production is a challenging task. To address this complexity, we performed a sensitivity analysis of the gasification model to assess the influence of operating parameters. In particular, the choice of gasifying agent was identified as a parameter of considerable relevance as it has a significant influence on the final composition of the syngas. Furthermore, it was found that the moisture content in the biomass plays an important role, leading to significant changes in the composition of the syngas. This highlights the importance of carefully controlling and optimizing these operating parameters to achieve the desired syngas composition and properties. Figure 4 presents a comparison between the experimental values of the synthesis gas composition and those calculated by the Aspen model. Although, the methane prediction is very low, as measured experimentally. Furthermore, a comparison was made between the experimental data reported by Awais et al. [26] and the numerically computed mole fractions of the syngas components, confirming the consistency of the model differences. This analysis reveals the intricate relationship between operational parameters and syngas formation, offering valuable information to optimize gasification processes.

Effect of the Gasifying Agent and Moisture on Syngas Composition

This subsection focuses on analyzing the impact of the gasifying agent on the composition of the synthesis gas. The study considers two important parameters: the equivalent ratio (ER) and the steam to biomass ratio (SBR). The experiments were conducted using air as the gasifying agent, with ER values ranging from 0.1 to 1 and SBR values ranging from 0.1 to 2. The resulting data were plotted on graphs, as shown in Figure 5, where the x-axis represents the gasification agent parameter and the y-axis represents the volume, expressed as a percentage, of  C O C H 4 C O 2 , and  H 2  in the syngas. By examining Figure 5, which depicts the influence of air as the gasifying agent on the final syngas composition, it can be observed that the ER has an inverse relationship with the formation of  H 2 . As the ER increases, the quality of the syngas composition deteriorates. For an ER of 0.1,  H 2  has molar fractions of 43%. However, as the ER gradually increases from 0.1 to 0.8, the molar fraction of  H 2  progressively declines until reaching zero. Conversely, the molar fraction of  C O 2  substantially increases, starting from an initial value of 70% and ultimately reaching 100% due to the Boudouard reaction, where oxygen is fully converted into  C O 2  through oxidation reactions. Meanwhile, the molar fraction of  C H 4  remains constant at 3%.
In Figure 5, dashed lines represent curves obtained through regression analysis applied to experimental results from the reference, whereas solid lines depict curves derived from the numerical model presented in this study.
The estimated volumetric composition of the production gas was compared to the experimental results of Awais et al. [26] in order to evaluate the accuracy of the suggested gasification model. When compared to the experimental data, Figure 5 shows that, overall, the suggested prediction model correctly predicts all gas components. Specifically, the  C O 2  prediction is in good agreement with small variances, and there are exact correlations between the    C H 4  and  C O  predictions.
During the study, the proportion of hydrogen in the gas produced increased significantly from 34% to 45%, and the concentration of carbon monoxide decreased from 27% to 11%. On the other hand, the carbon dioxide concentration showed the opposite behavior, increasing from 9% to 20%. This composition optimization resulted in a 7% molar increase in hydrogen yield. It was observed that increasing temperature shows a similar trend with respect to hydrogen production. Some variation in gas yield was evident within the analyzed temperature range. From the composition of the gas produced during gasification, it was clear that the increase in temperature contributed to the decrease in hydrogen content, which decreased from 34% to 30%.
In Figure 6, the influence of biomass moisture on the synthesis gas composition is illustrated. It is evident that an elevated moisture content introduces a higher concentration of  H 2  into the system, primarily due to the presence of hydrogen in steam. In hydrogen production processes within biomass steam gasification, gasification temperature plays a critical role due to the endothermic nature of hydrogen production reactions, including the water–gas shift reaction ( H 2 O  +  C O  →  H 2  +  C O 2 ), carbon gasification reactions (C +  H 2 O  →  C O  +  H 2 ), tar cracking reactions ( T a r  +  n 1 H 2 O  →  n 2 C O 2 n 3 H 2 ), and others. A higher gasification temperature is favorable for promoting hydrogen production [24,48,49].
Additionally, an increase in moisture content results in higher partial pressures within the gasification reactor, thereby facilitating flow reactions such as water–gas reactions, water–gas displacement, and steam reforming. These mechanisms contribute to an enhanced production of  H 2  and  C O 2  while reducing the concentration of  C O  to 16%.
Reducing  C O 2  has a positive effect on  C O  production, as Herguido et al. [50], in their results, obtained at a temperature of 1023 K. However, it is important to note that a direct realistic comparison with these results cannot be made because they concern different types of biomass (pine sawdust and wood) with different hydrogen content, different gasification substances (90%  H 2 O ), pressure fluctuations, and the use of different geometric carburetors. Furthermore, no precise details were provided to allow for comparison of gasification rates or the ratio of  H 2  production to a given biomass. This pattern was also observed, as Turn et al. notes [51], nonetheless, at a distinct temperature of 1073 K. It is important to note that compared to the results obtained at 1023 K, the hydrogen generation results at 1073 K are less sensitive to the steam-to-biomass ratio. Therefore, in this paper, we come to the same conclusion. Furthermore, direct comparisons are less practical because hydrogen generation happens at varying temperature ranges.
As for the  C O 2  content, it is largely unaffected by the gasifier and remains approximately constant at around 10% for all scenarios evaluated. On the other hand,  C H 4  concentrations are negligible with a value of 4%. Based on the presented results, it can therefore be concluded that the optimal solution for conventional gasification can be achieved in all cases when both ER and SBR are 0.28 and 0.2, respectively.
Despite the variations in the experimental conditions and the low steam-to-biomass ratio, our technique shows similar sensitivity to hydrogen output variations, ranging from 0.15 to 0.51. In contrast, Herguido et al. [50] conducted tests with a wide range of steam-to-biomass ratios (0.50–2.50) and varying hydrogen contents (40–60 percent) but found no significant difference in hydrogen output at a steam-to-biomass ratio of 0.70 (55–59 percent). Based on these findings, the hydrogen output of our technique falls within a narrow range of 51–63 percent of the steam-to-biomass ratio.

4. Conclusions

This study highlights the potential of steam gasification utilizing wood chips and corn cobs to produce hydrogen-rich biofuels. The process yielded hydrogen ranging from 65 to 120 g/kg of biomass, consistent with existing literature values. Impressively, it achieved an energy efficiency of up to 70%, surpassing results obtained from air gasification. Notably, the resulting syngas showcased hydrogen concentrations between 34% and 45%, while the concentrations of  C O C O 2 , and  C H 4  ranged from 27% to 11%, 9% to 20%, and less than 4%, respectively.
Furthermore, steam gasification exhibited reduced  C O 2  production compared to air gasification, with up to 30% less  C O 2  emitted. This underscores the environmental advantage inherent in this technique. Utilizing agricultural residues as feedstock further promotes a circular economy, reinforcing sustainability goals.
This study validates the findings reported in the existing literature on biomass gasification. It also offers precise quantifications of operational parameters and gasification performance. What sets this study apart is the integration of a sophisticated system of Fortran programming language subroutines. This addition renders the model autonomous and adaptable, providing benefits such as enhanced prediction accuracy and efficiency. By incorporating kinetic parameters and pre-tuned factors from previous studies, along with newly developed parameters adapted to match available experimental data, our model stands out as a robust representation of real-world gasification processes.
Looking ahead, future research endeavors should concentrate on experimental validation at pilot or industrial scales. This includes assessing the economic viability of the process and exploring new technologies aimed at optimizing efficiency while minimizing environmental impacts. Notably,  C O  production should be further studied, as it is a desirable product due to its high calorific value, potentially offering additional benefits to overall process efficiency and feasibility.
The findings of this study foster understanding of the intricate dynamics of syngas production through steam gasification, showing its significant environmental benefits. The use of agricultural waste as a raw material not only promotes a circular economy but also aligns with sustainable objectives, highlighting the fundamental role of this technique in mitigating environmental impacts.

Author Contributions

In this article, the specific contributions of the main author, M.O., are as follows: conceptualization, methodology, software, validation, formal analysis, investigation, data curation, writing—original draft, writing—review and editing; E.M. reviewed the physical and chemical principles and contributed to writing the manuscript; and the third project director, A.R., was responsible for writing the manuscript and providing financial resources. All authors have read and agreed to the published version of the manuscript.

Funding

This work was developed and published with the support of FCT(Portuguese Foundation of Science and Technology) through the contract PCIF/GVB/0169/2019 “Cogeneration using gasification of forest biomass through computational modelling”.

Institutional Review Board Statement

Not applicable.

Data Availability Statement

The original contributions presented in the study are included in the article, further inquiries can be directed to the corresponding author.

Conflicts of Interest

The authors declare no conflicts of interest.

References

  1. Monge, M.; Lazcano, A. Commodity Prices after COVID-19: Persistence and Time Trends. Risks 2022, 10, 128. [Google Scholar] [CrossRef]
  2. Mohideen, M.M.; Ramakrishna, S.; Prabu, S.; Liu, Y. Advancing green energy solution with the impetus of COVID-19 pandemic. J. Energy Chem. 2021, 59, 688–705. [Google Scholar] [CrossRef]
  3. Fang, Y.; Shao, Z. The Russia-Ukraine Conflict and Volatility Risk of Commodity Markets. Financ. Res. Lett. 2022, 50, 103264. [Google Scholar] [CrossRef]
  4. Aleluia Reis, L.; Tavoni, M. Glasgow to Paris—The impact of the Glasgow commitments for the Paris climate agreement. iScience 2023, 26, 105933. [Google Scholar] [CrossRef] [PubMed]
  5. Couto, N.D.; Silva, V.B.; Rouboa, A. Assessment on steam gasification of municipal solid waste against biomass substrates. Energy Convers. Manag. 2016, 124, 92–103. [Google Scholar] [CrossRef]
  6. Zhang, Y.; Xu, P.; Liang, S.; Liu, B.; Shuai, Y.; Li, B. Exergy analysis of hydrogen production from steam gasification of biomass: A review. Int. J. Hydrogen Energy 2019, 44, 14290–14302. [Google Scholar] [CrossRef]
  7. Gabbrielli, R.; Seggiani, M.; Frigo, S.; Puccini, M.; Vitolo, S.; Raggio, G.; Puccioni, F. Validation of a small scale woody biomass downdraft gasification plant coupled with gas engine. Chem. Eng. Trans. 2016, 50, 241–246. [Google Scholar]
  8. Cecílio, D.M.; Gonçalves, J.R.M.; Correia, M.J.N.; Mateus, M.M. Aspen Plus® Modeling and Simulation of an Industrial Biomass Direct Liquefaction Process. Fuels 2023, 4, 221–242. [Google Scholar] [CrossRef]
  9. Jiamin, S.; Chengcheng, Y.; Lijing, Z.; Gang, T. Aspen plus Simulation and Analysis of Methanol Synthesis Process. In Proceedings of the 8th International Symposium on Energy Science and Chemical Engineering (ISESCE 2023), Guangzhou, China, 24–26 March 2023; p. 04009. [Google Scholar]
  10. Ramos, A.; Afonso Teixeira, C.; Rouboa, A. Environmental analysis of waste-to-energy—A Portuguese case study. Energies 2018, 11, 548. [Google Scholar] [CrossRef]
  11. Zhiznin, S.Z.; Shvets, N.N.; Timokhov, V.M.; Gusev, A.L. Economics of hydrogen energy of green transition in the world and Russia. Part I. Int. J. Hydrogen Energy 2023, 48, 21544–21567. [Google Scholar] [CrossRef]
  12. Ahmed, A.; Salmiaton, A.; Choong, T.; Azlina, W.W. Review of kinetic and equilibrium concepts for biomass tar modeling by using Aspen Plus. Renew. Sustain. Energy Rev. 2015, 52, 1623–1644. [Google Scholar] [CrossRef]
  13. Gomez, E.; Rani, D.A.; Cheeseman, C.; Deegan, D.; Wise, M.; Boccaccini, A. Thermal plasma technology for the treatment of wastes: A critical review. J. Hazard. Mater. 2009, 161, 614–626. [Google Scholar] [CrossRef] [PubMed]
  14. Couto, N.; Silva, V.; Monteiro, E.; Brito, P.; Rouboa, A. Experimental and numerical analysis of coffee husks biomass gasification in a fluidized bed reactor. Energy Procedia 2013, 36, 591–595. [Google Scholar] [CrossRef]
  15. Mallick, D.; Mahanta, P.; Moholkar, V.S. Co–gasification of coal/biomass blends in 50 kWe circulating fluidized bed gasifier. J. Energy Inst. 2020, 93, 99–111. [Google Scholar] [CrossRef]
  16. Wiatowski, M. An Experimental Study on the Quantitative and Qualitative Characteristics of Tar Formed during Ex Situ Coal Gasification. Energies 2023, 16, 2777. [Google Scholar] [CrossRef]
  17. Kopetz, H. Build a biomass energy market. Nature 2013, 494, 29–31. [Google Scholar] [CrossRef] [PubMed]
  18. Pio, D.; Tarelho, L. Empirical and chemical equilibrium modelling for prediction of biomass gasification products in bubbling fluidized beds. Energy 2020, 202, 117654. [Google Scholar] [CrossRef]
  19. Vaquerizo, L.; Cocero, M.J. CFD–Aspen Plus interconnection method. Improving thermodynamic modeling in computational fluid dynamic simulations. Comput. Chem. Eng. 2018, 113, 152–161. [Google Scholar] [CrossRef]
  20. Monteiro, E.; Ismail, T.M.; Ramos, A.; Abd El-Salam, M.; Brito, P.; Rouboa, A. Assessment of the miscanthus gasification in a semi-industrial gasifier using a CFD model. Appl. Therm. Eng. 2017, 123, 448–457. [Google Scholar] [CrossRef]
  21. Couto, N.; Silva, V.; Rouboa, A.J.E. Municipal solid waste gasification in semi-industrial conditions using air-CO2 mixtures. Energy 2016, 104, 42–52. [Google Scholar] [CrossRef]
  22. Marinho, D.A.; Silva, A.J.; Reis, V.M.; Barbosa, T.M.; Vilas-Boas, J.P.; Alves, F.B.; Machado, L.; Rouboa, A.I. Three-dimensional CFD analysis of the hand and forearm in swimming. J. Appl. Biomech. 2011, 27, 74–80. [Google Scholar] [CrossRef] [PubMed]
  23. Silva, V.; Rouboa, A. Optimizing the gasification operating conditions of forest residues by coupling a two-stage equilibrium model with a response surface methodology. Fuel Process. Technol. 2014, 122, 163–169. [Google Scholar] [CrossRef]
  24. Abuadala, A.; Dincer, I.; Naterer, G.F. Exergy analysis of hydrogen production from biomass gasification. Int. J. Hydrogen Energy 2010, 35, 4981–4990. [Google Scholar] [CrossRef]
  25. Gao, N.; Li, A.; Quan, C.; Gao, F. Hydrogen-rich gas production from biomass steam gasification in an updraft fixed-bed gasifier combined with a porous ceramic reformer. Int. J. Hydrogen Energy 2008, 33, 5430–5438. [Google Scholar] [CrossRef]
  26. Awais, M.; Omar, M.M.; Munir, A.; Ajmal, M.; Hussain, S.; Ahmad, S.A.; Ali, A. Co-gasification of different biomass feedstock in a pilot-scale (24 kWe) downdraft gasifier: An experimental approach. Energy 2022, 238, 121821. [Google Scholar] [CrossRef]
  27. Ahmad, A.A.; Zawawi, N.A.; Kasim, F.H.; Inayat, A.; Khasri, A. Assessing the gasification performance of biomass: A review on biomass gasification process conditions, optimization and economic evaluation. Renew. Sustain. Energy Rev. 2016, 53, 1333–1347. [Google Scholar] [CrossRef]
  28. Silva, V.B.; Rouboa, A. In situ activation procedures applied to a DMFC: Analysis and optimization study. Fuel 2012, 93, 677–683. [Google Scholar] [CrossRef]
  29. Sousa, P.; Soares, A.; Monteiro, E.; Rouboa, A. A CFD study of the hydrodynamics in a desalination membrane filled with spacers. Desalination 2014, 349, 22–30. [Google Scholar] [CrossRef]
  30. Haydary, J. Chemical Process Design and Simulation: Aspen Plus and Aspen Hysys Applications; John Wiley & Sons: Hoboken, NJ, USA, 2019. [Google Scholar]
  31. Aguilar-Jiménez, J.A.; Hernández-Callejo, L.; Alonso-Gómez, V.; Velázquez, N.; López-Zavala, R.; Acuña, A.; Mariano-Hernández, D. Techno-economic analysis of hybrid PV/T systems under different climate scenarios and energy tariffs. Sol. Energy 2020, 212, 191–202. [Google Scholar] [CrossRef]
  32. Puig-Gamero, M.; Pio, D.; Tarelho, L.; Sánchez, P.; Sanchez-Silva, L. Simulation of biomass gasification in bubbling fluidized bed reactor using aspen plus®. Energy Convers. Manag. 2021, 235, 113981. [Google Scholar] [CrossRef]
  33. Champion, W.M.; Cooper, C.D.; Mackie, K.R.; Cairney, P. Development of a chemical kinetic model for a biosolids fluidized-bed gasifier and the effects of operating parameters on syngas quality. J. Air Waste Manag. Assoc. 2014, 64, 160–174. [Google Scholar] [CrossRef] [PubMed]
  34. Choi, Y.C.; Li, X.Y.; Park, T.J.; Kim, J.H.; Lee, J.G. Numerical study on the coal gasification characteristics in an entrained flow coal gasifier. Fuel 2001, 80, 2193–2201. [Google Scholar] [CrossRef]
  35. Groppi, G.; Tronconi, E.; Forzatti, P.; Berg, M. Mathematical modelling of catalytic combustors fuelled by gasified biomasses. Catal. Today 2000, 59, 151–162. [Google Scholar] [CrossRef]
  36. Yan, W.-C.; Shen, Y.; You, S.; Sim, S.H.; Luo, Z.-H.; Tong, Y.W.; Wang, C.-H. Model-based downdraft biomass gasifier operation and design for synthetic gas production. J. Clean. Prod. 2018, 178, 476–493. [Google Scholar] [CrossRef]
  37. Smoot, L.D.; Smith, P.J. Coal Gasification and Combustion; Plenum Press: New York, NY, USA, 1985. [Google Scholar]
  38. Westbrook, C.K.; Dryer, F.L. Chemical kinetic modeling of hydrocarbon combustion. Prog. Energy Combust. Sci. 1984, 10, 1–57. [Google Scholar] [CrossRef]
  39. Corella, J.; Sanz, A. Modeling circulating fluidized bed biomass gasifiers. A pseudo-rigorous model for stationary state. Fuel Process. Technol. 2005, 86, 1021–1053. [Google Scholar] [CrossRef]
  40. Gonzalez, A.M.; Lora, E.E.S.; Palacio, J.C.E.; del Olmo, O.A.A. Hydrogen production from oil sludge gasification/biomass mixtures and potential use in hydrotreatment processes. Int. J. Hydrogen Energy 2018, 43, 7808–7822. [Google Scholar] [CrossRef]
  41. Gómez-Barea, A.; Leckner, B. Modeling of biomass gasification in fluidized bed. Prog. Energy Combust. Sci. 2010, 36, 444–509. [Google Scholar] [CrossRef]
  42. Umeki, K.; Namioka, T.; Yoshikawa, K. Analysis of an updraft biomass gasifier with high temperature steam using a numerical model. Appl. Energy 2012, 90, 38–45. [Google Scholar] [CrossRef]
  43. Morf, P.; Hasler, P.; Nussbaumer, T. Mechanisms and kinetics of homogeneous secondary reactions of tar from continuous pyrolysis of wood chips. Fuel 2002, 81, 843–853. [Google Scholar] [CrossRef]
  44. Sreejith, C.C.; Muraleedharan, C.; Arun, P. Performance prediction of steam gasification of wood using an ASPEN PLUS thermodynamic equilibrium model. Int. J. Sustain. Energy 2014, 33, 416–434. [Google Scholar] [CrossRef]
  45. Ji, P.; Feng, W.; Chen, B. Production of ultrapure hydrogen from biomass gasification with air. Chem. Eng. Sci. 2009, 64, 582–592. [Google Scholar] [CrossRef]
  46. Puig-Gamero, M.; Argudo-Santamaria, J.; Valverde, J.L.; Sánchez, P.; Sanchez-Silva, L. Three integrated process simulation using aspen plus®: Pine gasification, syngas cleaning and methanol synthesis. Energy Convers. Manag. 2018, 177, 416–427. [Google Scholar] [CrossRef]
  47. Islamova, S.; Tartygasheva, A.; Karaeva, J.; Panchenko, V.; Litti, Y. A Comprehensive Study on the Combustion of Sunflower Husk Pellets by Thermogravimetric and Kinetic Analysis, Kriging Method. Agriculture 2023, 13, 840. [Google Scholar] [CrossRef]
  48. Luo, S.; Xiao, B.; Guo, X.; Hu, Z.; Liu, S.; He, M. Hydrogen-rich gas from catalytic steam gasification of biomass in a fixed bed reactor: Influence of particle size on gasification performance. Int. J. Hydrogen Energy 2009, 34, 1260–1264. [Google Scholar] [CrossRef]
  49. Luo, S.; Xiao, B.; Hu, Z.; Liu, S.; Guo, X.; He, M. Hydrogen-rich gas from catalytic steam gasification of biomass in a fixed bed reactor: Influence of temperature and steam on gasification performance. Int. J. Hydrogen Energy 2009, 34, 2191–2194. [Google Scholar] [CrossRef]
  50. Herguido, J.; Corella, J.; Gonzalez-Saiz, J. Steam gasification of lignocellulosic residues in a fluidized bed at a small pilot scale. Effect of the type of feedstock. Ind. Eng. Chem. Res. 1992, 31, 1274–1282. [Google Scholar] [CrossRef]
  51. Turn, S.; Kinoshita, C.; Zhang, Z.; Ishimura, D.; Zhou, J. An experimental investigation of hydrogen production from biomass gasification. Int. J. Hydrogen Energy 1998, 23, 641–648. [Google Scholar] [CrossRef]
Figure 1. Methodological scheme of chemical reactions used in this work.
Energies 17 01859 g001
Figure 2. Aspen Plus gasification scheme model.
Energies 17 01859 g002
Figure 3. Principle of the coupling Aspen Plus flowchart using the subroutines.
Energies 17 01859 g003
Figure 4. Comparing the mole fractions of syngas composition WC and CC (ER 0.28).
Energies 17 01859 g004
Figure 5. Effect of ER on syngas composition WC + CC.
Energies 17 01859 g005
Figure 6. Influence of moisture content (MC) (ER 0.28) on the volume of (a)   C O , (b)   H 2 , (c)   C O 2    and (d)   C H 4 .
Energies 17 01859 g006
Table 1. Raw material characterization, final and proximate analysis. Evaluated according to [26].
Ultimate Analysis (wt%)Proximate Analysis 1 (wt%)LHV
BiomassCHONSAshVMFC 2Moisture(MJ/Nm3)
Wood chips48.126.1245.740.0803.56314.57.53.36
Corn cobs446.938.651.80.092.56917123.21
1 as received; 2 dry basis.
Disclaimer/Publisher’s Note: The statements, opinions and data contained in all publications are solely those of the individual author(s) and contributor(s) and not of MDPI and/or the editor(s). MDPI and/or the editor(s) disclaim responsibility for any injury to people or property resulting from any ideas, methods, instructions or products referred to in the content.

