Article

Radiated Electromagnetic Emission from Photovoltaic Systems—Measurement Results: Inverters and Modules †

1
Energy Engineering, School of Information and Engineering, Dalarna University, 79188 Falun, Sweden
2
Electrical Power Engineering, Luleå University of Technology, 97187 Skellefteå, Sweden
3
Wireless Communication, RISE Research Institute of Sweden, Box 857, 50115 Borås, Sweden
*
Author to whom correspondence should be addressed.
This article is an extended version of our conference article published in 2023 International Symposium on Electromagnetic Compatibility—EMC Europe, Krakow, Poland, 4–8 September 2023; pp. 1–6.
Energies 2024, 17(8), 1893; https://doi.org/10.3390/en17081893
Submission received: 5 February 2024 / Revised: 24 February 2024 / Accepted: 11 April 2024 / Published: 16 April 2024
(This article belongs to the Section A: Sustainable Energy)

Abstract

:
Radiated electromagnetic emission of photovoltaic systems, for example, adversely impacting radiocommunication, can pose a major barrier against further increase in photovoltaic penetration. This is particularly the case near sensitive infrastructure and activities such as hospitals, airports, search and rescue, and military. To understand the impact of each component and installation detail, we performed systematic radiated electromagnetic emission measurements on comparable commercial photovoltaic systems in the frequency range 150 kHz to 30 MHz. Our measurements indicate that string inverters are unlikely to interfere with radiocommunication when installed according to recommended standards, rules, guidelines, and regulations. It was shown that module-level power optimizers are the main cause of high levels of radiated emissions. The frameless bifacial module showed higher levels of radiated emissions than the monofacial module with frame. Changes in cable management and earthing have less impact on radiated emissions than the choice of solar inverter concept and module type.

1. Introduction

In this study, a photovoltaic (PV) system consists of the electrical components: solar inverter, PV modules, PV cables, earthing cables or wires, switches, fuses; the mechanical components: mounting structure, cable trays, combiner boxes; and the installation details: cable management and earthing. PV systems, like all digital electronics, emit radiated and conducted electromagnetic energy [1]. High levels of these unintended electromagnetic emissions (EMEs) can cause all sorts of interference problems, if not properly suppressed through good wire routing and filtering in the device or system [2,3]. The European Union ensures surveillance of the electromagnetic compatibility (EMC) requirements through the national surveillance authorities of each member country [4]. Those authorities can impose product sales bans or stop installations from operating, until the high levels of radiated EMEs are eliminated [5].
Radio amateurs as in [6] report that PV systems with module optimizers interfere with their communication frequencies. Such radio interference complaints are received and investigated by the national agencies, such as the Federal Office of Communication (BAKOM) in Switzerland. De Raemy, a BAKOM representative, reports that several radio amateurs have complained about electromagnetic interferences (EMIs) from PV systems with module-level power optimizers [7]. In the same interview, he states that almost the entire high-frequency (HF) range 3–30 MHz is affected and not only the radio amateur frequencies. Moreover, Radiocommunications Agency Netherlands (Agentschap Telecom) [8,9] reported EMIs with their emergency services C2000 and digital radio and TV services DAB and DVB-T. The Swedish National Electrical Safety Board (Elsäkerhetsverket) [10] has also reported that PV modules with integrated submodule optimizer caused EMIs in the uplink frequencies of an LTE 800 MHz mobile base station. The Swedish National Electrical Safety Board imposed sales bans on several solar inverters and module-level power electronics that caused interferences with radiocommunication [11,12,13,14]. Simulation analysis from the Swedish Defense Research Agency [15,16] showed that antenna ranges of military HF-Systems and of airport tower communication in very-high-frequency (VHF) band could significantly be reduced by high levels of EMEs from PV systems.
As summarized in the previous paragraph, there are numerous reports that PV systems cause interference with radiocommunication [6,7,8,9,10,11,12,13,14]. Current research solely measures PV systems that cause interference [17,18,19,20,21,22]. Measurements of the radiated and/or conducted emissions were performed in different frequency ranges on PV systems causing interferences. This makes it difficult to compare the measured systems with each other. As Linder and Wiklundh [17] stated, the mechanisms behind the EMEs of PV systems are not yet fully understood, and more research is needed about the EME behavior of PV systems.
To fully investigate the EME behavior of PV systems, one should ideally measure all existing photovoltaic systems. However, such a study would cause many practical problems, e.g., radiated measurements are extremely time-consuming; systems are not comparable because of different system components and installation details; missing documentation of installation details; or deviating installation from documentation. Instead, a dedicated test installation was built, which aimed to be flexible, comparable, and realistic.
In this way, systematic radiated EME measurements were performed on 34 comparable PV system combinations with a peak power up to 5 kW. The aim was to understand the impact of each component and installation detail on the radiated EMEs. For this purpose, we compared 34 residential PV system combinations, involving different types of commercial products as components and installation details which reflected either (a) best practice or (b) other common installations. These installation details should, according to the rules and recommendations, have either a positive (a) or negative (b) effect on the radiated EMEs [23].
The radiated EME measurements were conducted with the full-time domain method developed by Pous and Azpúrua [24]. The selected frequency range 150 kHz to 30 MHz reflects the majority of interference reports [7]. The measurement data were analyzed with our statistical data analysis method, described in Section 2.4.1. This method is used to overcome the problem in distinguishing background and system emissions. This problem is caused by the fluctuating background resulting from in situ measurements and is amplified by the unavoidable time delay between background and system measurements, due to energizing and de-energizing of the PV system.
This article is organized as follows. Section 2 gives an outline of the selection criterion of photovoltaic system components, of the system under test, and of its configuration. This is followed by the in situ measurement setup and the used data analysis. Section 3 guides the reader firstly through the results for the solar inverter and secondly through the results for the photovoltaic module. This section also provides the final summary of both components. The article closes with the conclusions.

2. Materials and Methods

2.1. Selection of Photovoltaic-System Combinations

It is expected that the solar inverter plays a key role for EMEs in PV systems; especially, the choice of topology and solar inverter concept are of importance. EMEs are caused by the switching of the solar inverter, which contains filters to suppress EMEs [3]. Therefore, the following comparisons were discussed: transformer inverter versus transformerless inverter and string inverter versus inverter with module-level power optimizers. The comparison between transformer inverters and transformerless inverters was excluded since no new products with transformers were purchasable in the required power range. Figure 1 shows the three variations in solar inverter concept for the comparison of string inverter versus inverter with module-level power optimizers: (a) the string inverter (F, K, S); (b) the inverter with one module power level optimizer per PV module, further called inverter with module optimizers (SE); and (c) the string inverter with one module-level power optimizer on one PV module, further called string inverter with one optimizer (Tx).
PV modules are seen as passive components and therefore not included in any of the abovementioned studies in connection with EMEs from PV systems. During the discussions of the selection process, the possibility was raised that the leakage current of the PV module could influence the EMEs. Hereby, the frame and the different encapsulations were suspected as possible reasons for changes in the EMEs. Hence, a comparison was made between an aluminum-framed, monofacial, monocrystalline half-cell module with glass–backsheet encapsulation (MO) and a frameless, bifacial, monocrystalline full-cell module with glass–glass encapsulation (BI). This comparison was made to include the potential impact of the leakage current.
In the installation details, the approach was to compare best practice versus other common installations that are currently not recommended, from an EMC perspective. For the cable management, the loop area behind the PV array was either small-loop (SLS) or large-loop (LL). The string cables in the cable tray had either zero (R) or 10 cm (R10) distance between DC+ and DC−. The earthing was either installed with functional equipotential earthing (W) or without functional equipotential earthing (N).
For the case without functional equipotential earthing, the vertical equipotential bonding between the aluminum rails and the cable tray bonding were removed. The earthing clips were kept in place even without functional equipotential earthing, since removing them would have created additional time-consuming work, and some PV module clamps on the market provide integrated grounding pins, e.g., Schletter and Solar Parts Components. Therefore, we did not expect this to have a significant impact on the results.
All abbreviations for components and installation details are listed in Table 1.

2.2. Photovoltaic Systems

The 34 different PV system combinations were built one at a time, where we stepwise implemented small changes to the system components and installation details: PV module type, solar inverter concept, loop area, earthing, or string cables.
All PV system combinations consisted of one string with 14 PV modules and were mounted on a wooden structure with aluminum rails that faced south and had a tilt angle of 35°. All measurements were conducted, according to a measurement plan, during June, July, and August on the university building in Borlänge, Sweden. The timing for each measurement was affected by weather and solar radiation condition. Therefore, measurement days fell on weekdays, weekends, and the holiday season of the campus.
One measurement is (MO_SE_LL_W_R), and with the help of Table 1 and the notation scheme described in Figure 1d, the system can be decoded to: 14 monofacial monocrystalline half-cell modules with an aluminum frame, an inverter with 14 module optimizers, PV array cables installed in a large-loop area, earthing installed with functional equipotential earthing, and string cables installed with zero distance between DC+ and DC−.

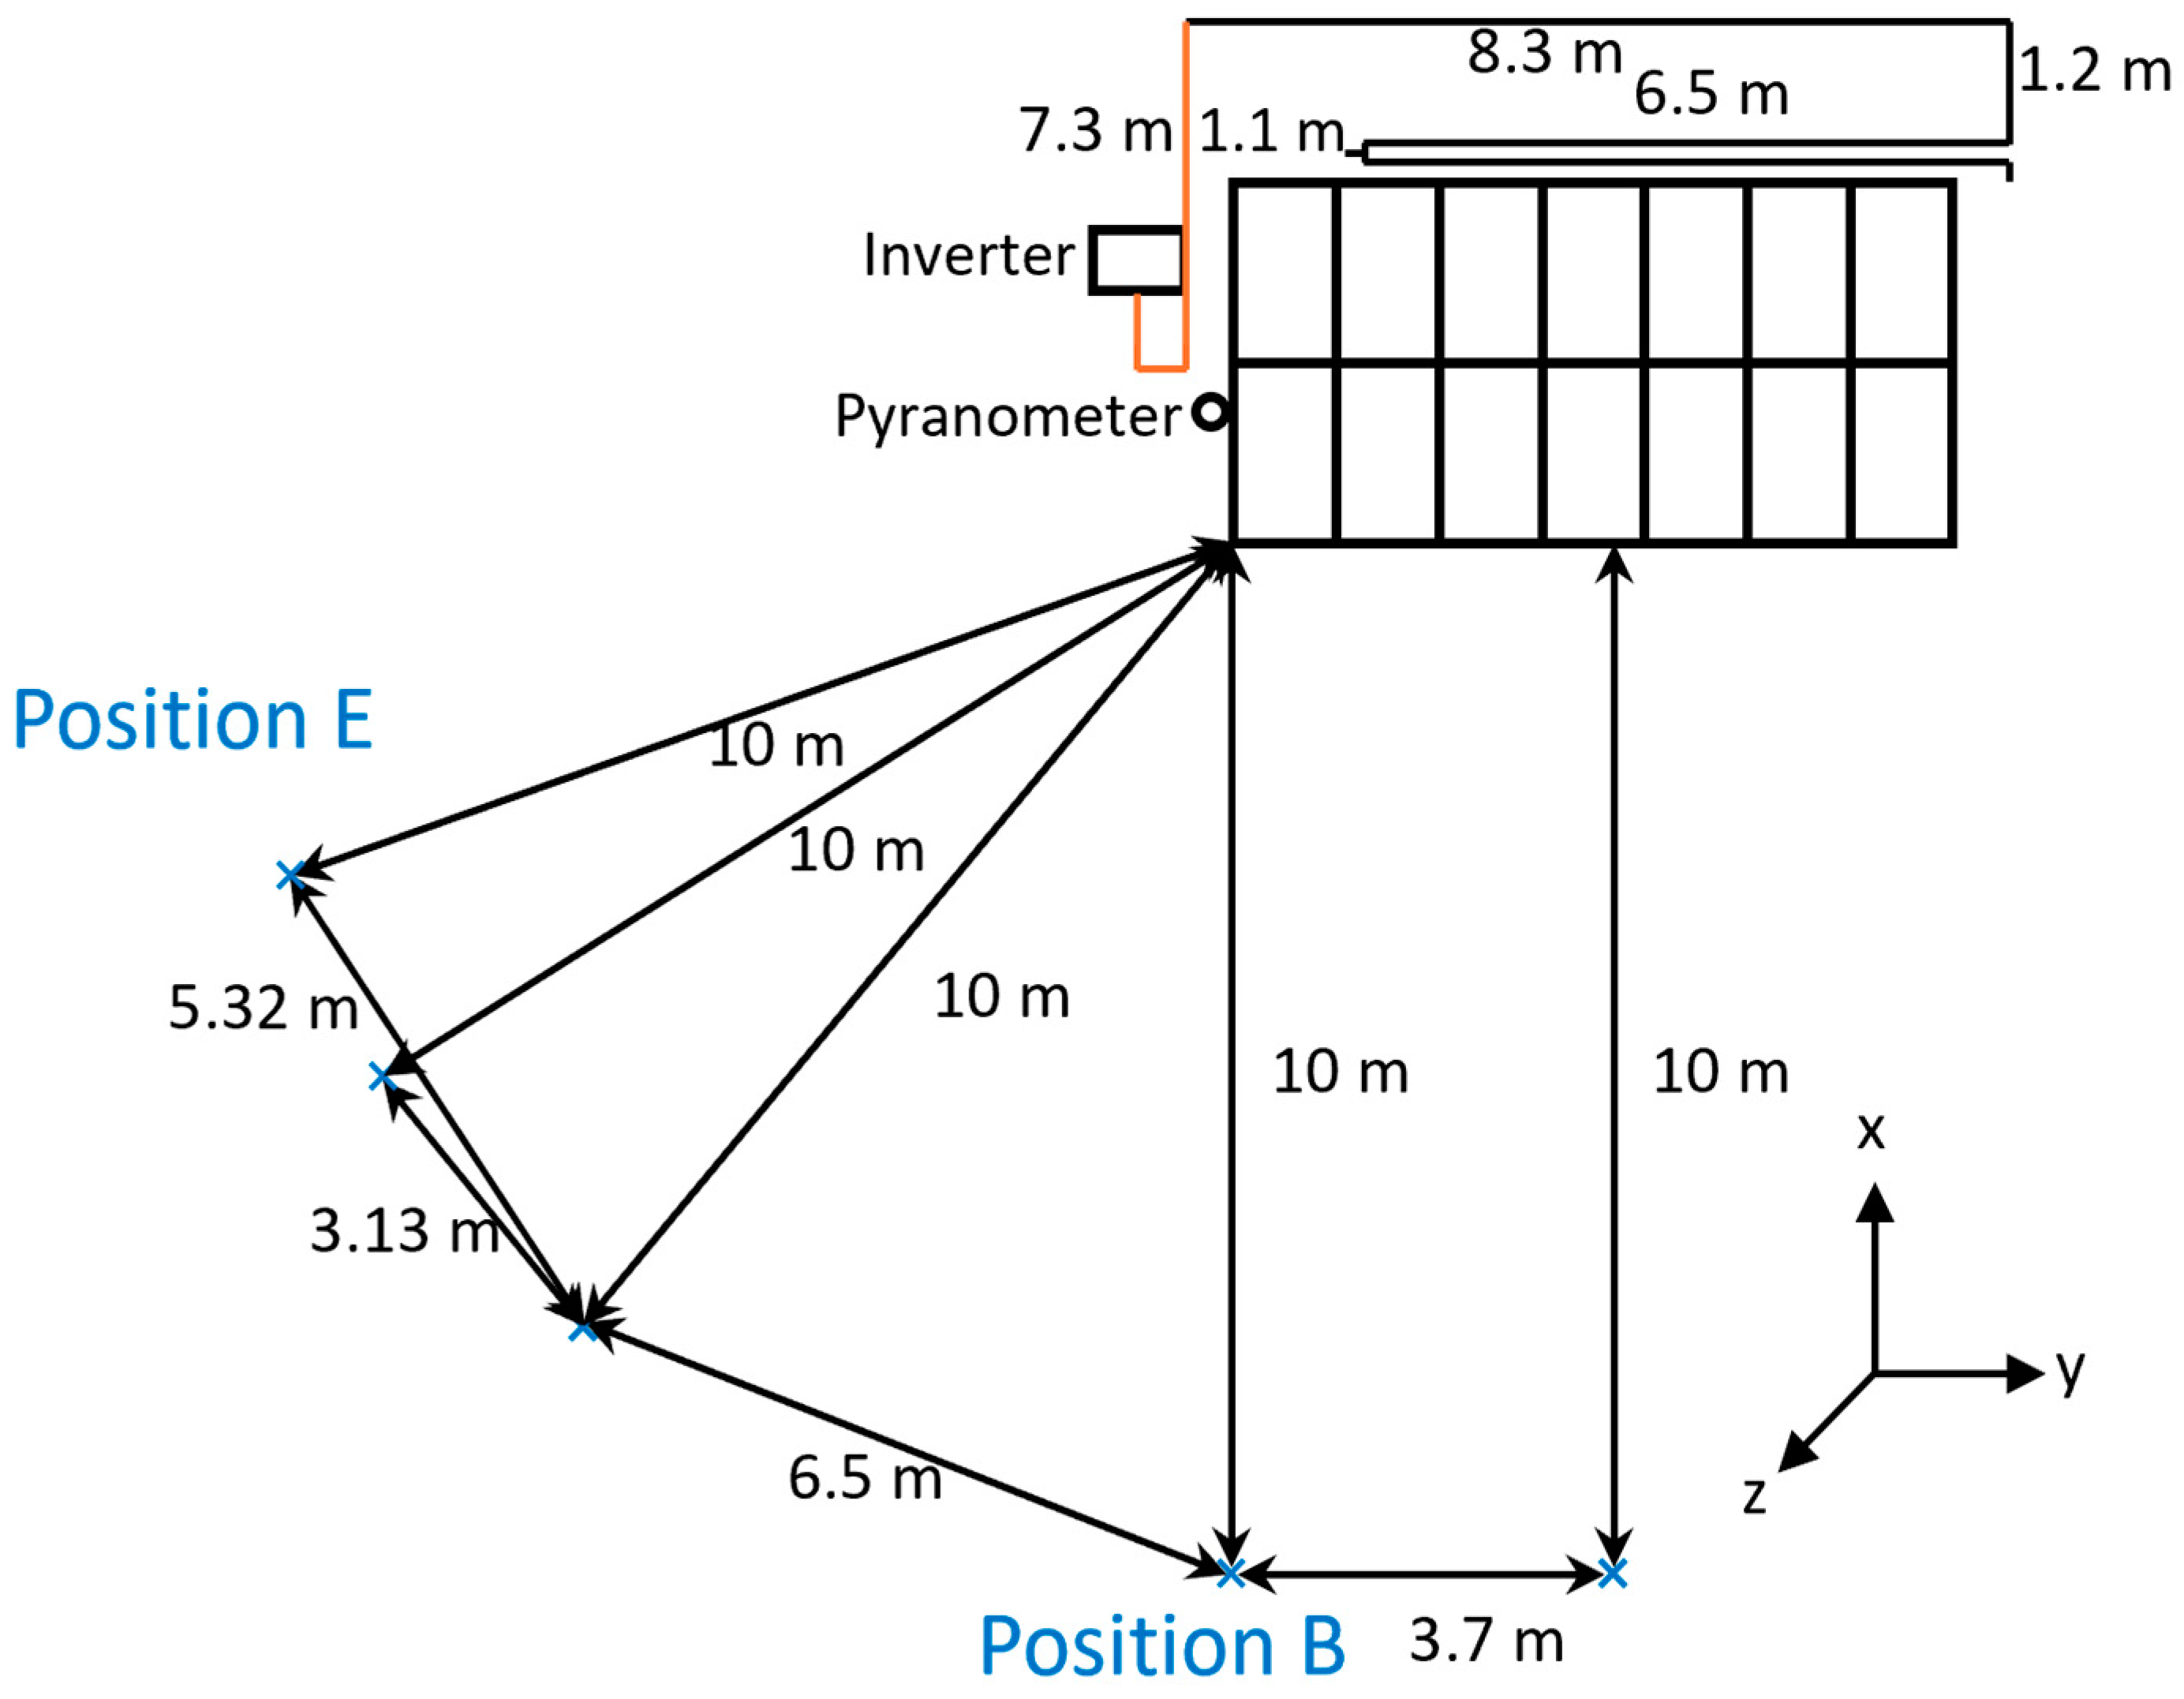
2.3. In Situ Measurement Setup

The radiated EME measurements were conducted on the university building in Borlänge, Sweden. The decision to focus the study on the frequency range 150 kHz to 30 MHz was driven by the factor that most interference reports concerned this frequency range [7]. Through this, we ensured that we see higher emissions and therewith have the possibility to study the impact of the different system components and installation details on the radiated emissions.
For the measurements, we used a Full-Time Domain Electromagnetic Interference measurement system similar to the one described in [24]. In this measurement approach, an oscilloscope is used to digitalize and store the connected sensor signals in time domain. The stored time domain data are transferred to a personal computer with the software TEMPS 5.0, developed by Azpúrua, Pous, and Sliva [24]. “The software performs the signal processing task which delivers frequency domain measurement results that are in accordance with CISPR 16-1-1”, as described in [24]. The choice of oscilloscope and its specifications (bandwidth, maximum sampling rate, analog-to-digital converter resolution) have a significant impact on the methods limitations and are therefore conveyed to the TEMPS software. A measurement accuracy of ±1.5 dB is stated in [24] for the frequency range 30 MHz to 1 GHz with another oscilloscope. We followed the selection criterion for the oscilloscope as described in [24]. However, we decided to use the more conservative accuracy level of ±3 dB for the data analysis described in Section 2.4.
For our measurements, we used the four-channel oscilloscope, PicoScope 5444D MSO (Pico Technology, Saint Neots, UK) with the specification [25], to which the active loop antenna and the pyranometer were connected. The loop antenna EMCO 6502 (ETS Lindgren, Cedar Park, TX, USA) measures the radiated electromagnetic emissions from the PV system at a height of 1 m aboveground, while the pyranometer CM 11 (Kipp & Zonen, Delft, The Netherlands) measures the irradiation from the sun at the same angle as the PV modules.
The in situ measurement setup was kept the same throughout the study. Measurements were conducted in accordance with CISPR 11 [26] and CISPR 16 [27]. The loop antenna was placed 10 m from the PV system under test, in positions B and E, as shown in Figure 2. During the pre-scan, positions B and E were identified as the positions with strongest emissions. A distance of 30 m is given to the unit under test for the limit in CISPR 11, class A, group 1. The 30 m limit from CISPR 11 was increased by 10 dB to correspond with a 10 m distance, to obtain a reference value for the emission levels in this study. That reference value is further referred to as “EMC limit”.
The measurement proceedings for each position always contain background measurements BG2 as well as system measurements M_sys with a loop antenna. Hereby, the loop antenna is placed in the X, Y, and Z directions for each position.
For the background measurements BG2, the PV system is turned off entirely. That means that the inverter is disconnected from AC; if module optimizers are used, they are disconnected from their PV module, to de-energize the optimizer.
According to CISPR 16, before conducting system measurements M_sys, the PV system must be turned on and, when possible, operate in the highest disturbance field strength. This was not practically possible during this study. Instead, we used as a criterion that the inverter needs to feed into the grid. This reflects normal operation and makes it possible to conduct measurements on many system combinations within the available time frame.
For the system measurements M_sys, the PV system needs to feed into the grid as defined earlier. That means that if module optimizers are used, the PV modules are reconnected to the optimizers, and the inverter is powered by AC. After a device dependent startup sequence of 1–10 min, the inverter feeds into the grid.

2.4. Data Analysis

According to best praxis for in situ measurements, there should only be a short time between background B G 2 t B G 2 and system M s y s t s y s measurements, to calculate system emissions S y s t s y s according to Equation (1).
S y s t s y s = M s y s t s y s B G 2 s y s t s y s                             M s y s t s y s B G 2 t B G 2
Because of the short time assumed in standard testing, differences are neglected between background measurement B G 2 t B G 2 and the implicit system background B G 2 s y s t s y s . This means that B G 2 t B G 2 and B G 2 s y s t s y s are treated as equal B G 2 t B G 2 B G 2 s y s t s y s .
This short time assumption cannot be made for in situ measurement of PV systems.
Whereas energizing and starting up a PV system take several minutes, as do de-energizing and disconnecting optimizers, this time delay causes problems in distinguishing background B G 2 s y s t s y s from system emissions S y s t s y s .

2.4.1. Statistical Data Analysis Method

Due to the non-constant nature of the background B G 2 t B G 2 B G 2 s y s t s y s in PV in situ measurements, the developed data analysis method incorporates multiple backgrounds B G 2 i . Herein, it is assumed that the statistical properties of the multiple backgrounds B G 2 i do not change. Therefore, the method is further referenced as the statistical data analysis method.
The statistical data analysis method works as follows. With the help of an algorithm, all local maxima of more than 10 dB above the noise floor are marked in the system measurements M s y s , further called “peaks”. This is carried out to address the ±3 dB accuracy level of the measurements system.
The statistical data analysis method compares the peaks M s y s with all measured backgrounds B G 2 i , according to Equation (2).
P s y s = min i = 1 n M s y s B G 2 i
All measured backgrounds i = 1 n are used to create a margin between peaks M s y s and background measurements B G 2 i . The lowest margin P s y s is used for the comparison of the peaks.
Each peak is categorized in the EMC limit category and peak-to-background margin P s y s category. The EMC limit category shows if a peak is above or below the EMC limit line, while the peak-to-background margin P s y s category gives the magnitude of each peak in 5 steps, 0–5 dB, 6–10 dB, 11–15 dB, 16–20 dB, and >20 dB. As an example, the margin P s y s category >20 dB, means that the peak is more than 20 dB higher than the highest background. Figure 3 shows an example of a system measurement graph that illustrates: a system measurement (pink), the margin P s y s category (dot: yellow; orange; green; blue; red), and the EMC limit line (purple). Samples of 3 representative backgrounds are shown in diverse colors (see legend: 2202, 2214, and 2217).
To enable fast comparison, all system measurement graphs from the same system configuration are assembled into one system summary graph, meaning that all margin P s y s categories of positions B and E and in directions X, Y, and Z are summarized in this graph.
When such a graph has many peaks and high amplitudes close to or above the EMC limit, then the system is more likely to cause interference with radiocommunication than a system summary graph with fewer peaks and lower amplitudes.
From the system summary graph, the frequency histogram is generated to see if any peaks are repeated in a fixed frequency pattern and which frequency has the most accumulations.

3. Results and Discussion

Radiated EME measurements in the frequency range from 150 kHz to 30 MHz were conducted for 34 different system combinations, resulting in 570 spectra. A selection of these measurements is presented in this article, representing the major findings from these measurements. Results are presented with the help of a system summary graph and frequency histogram.

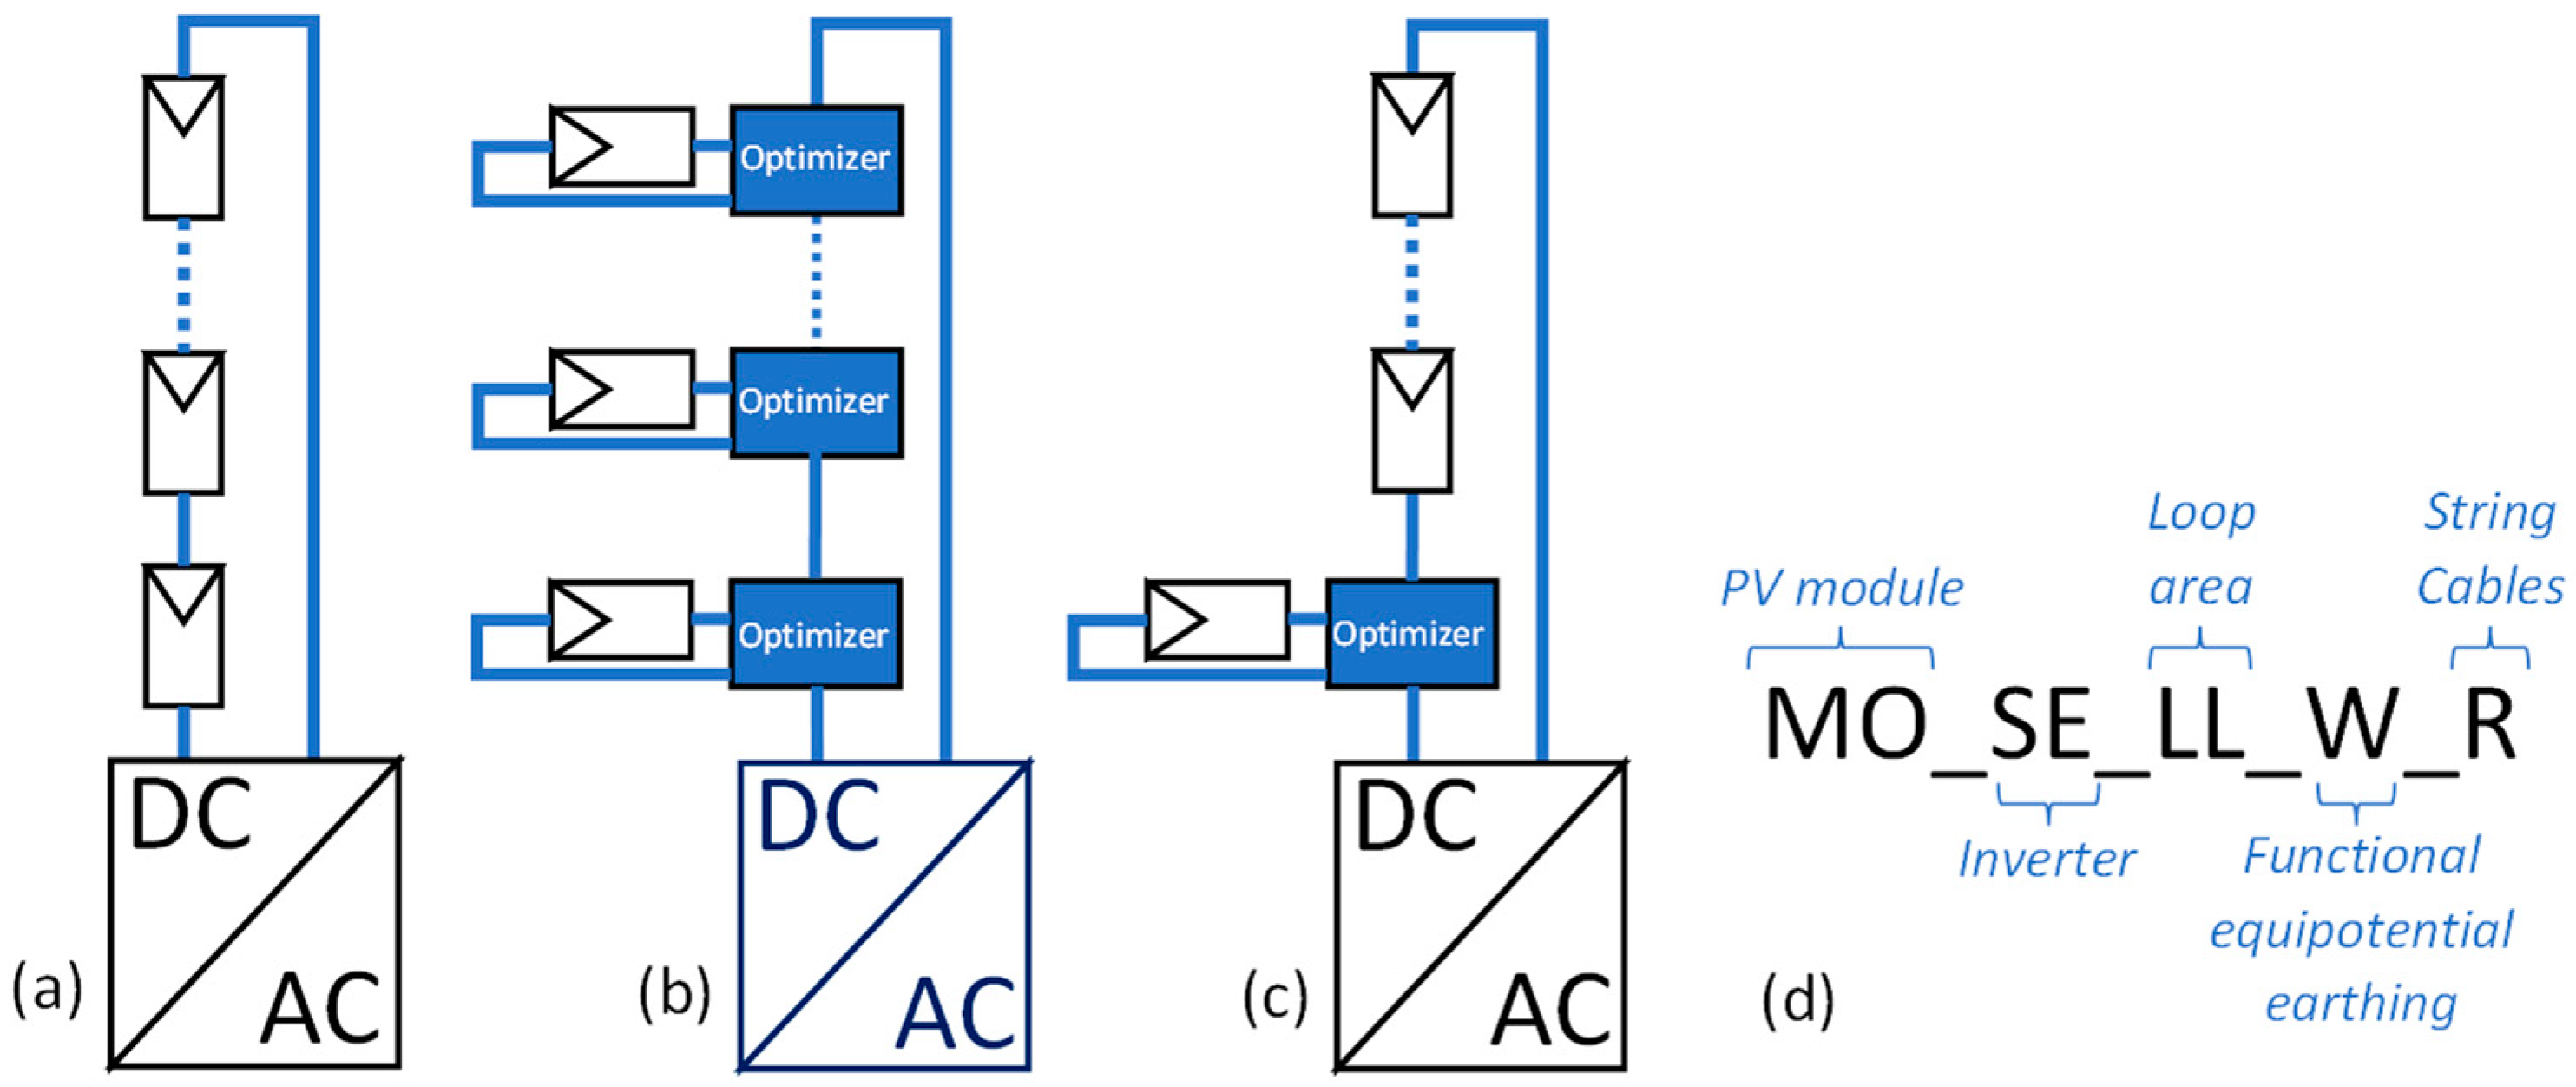
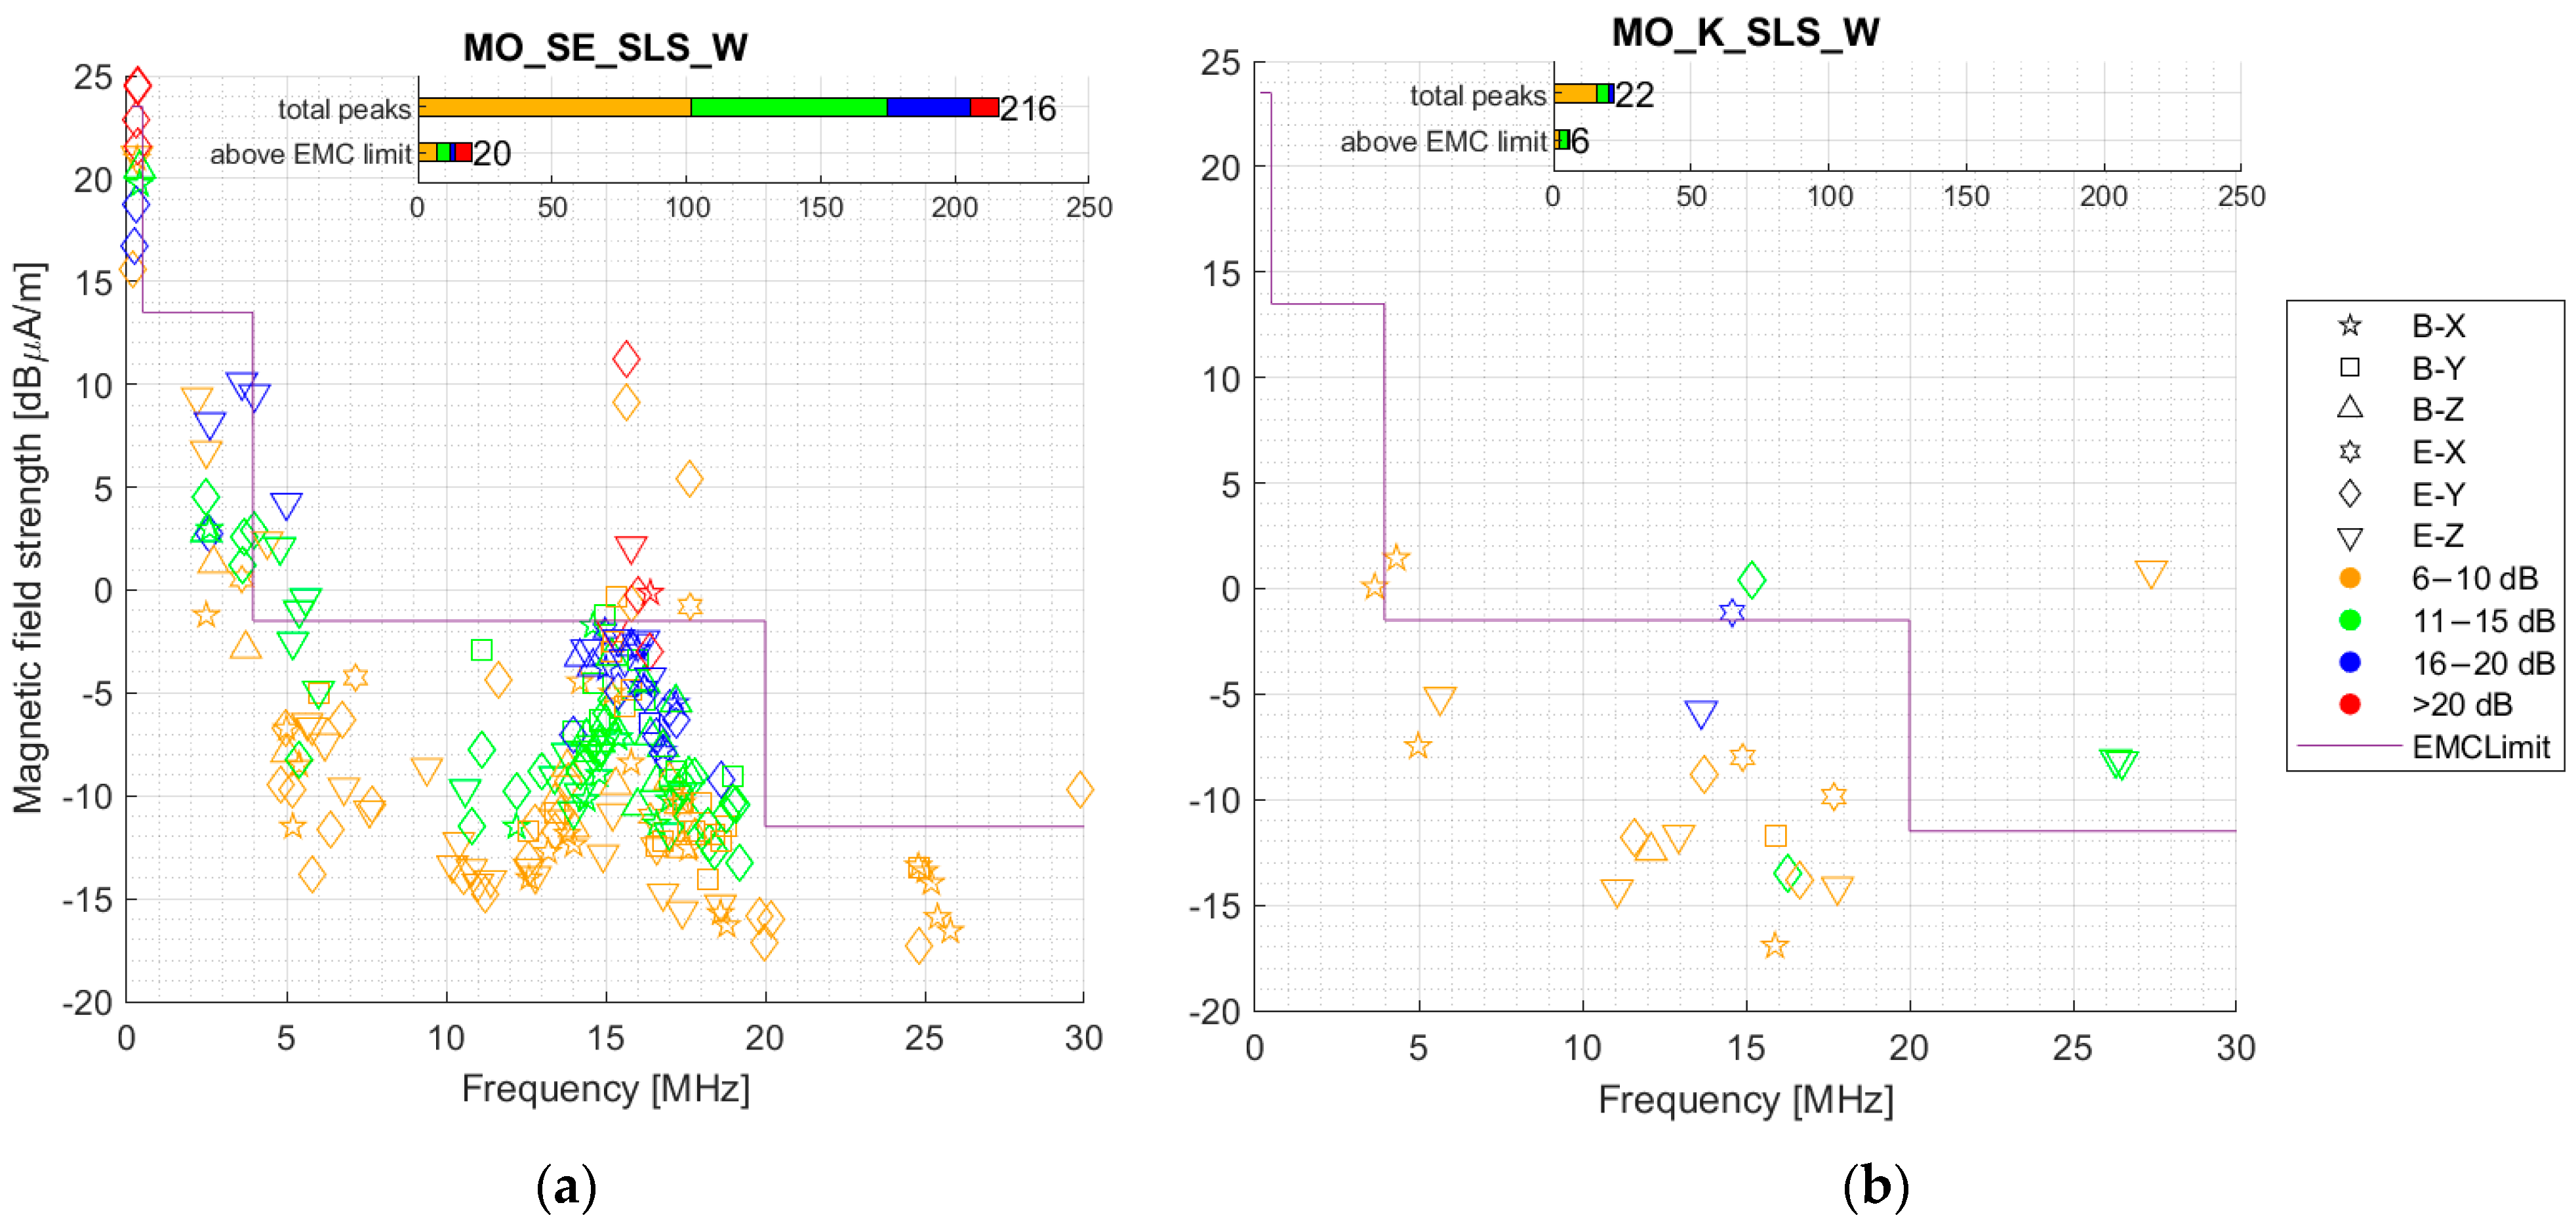
3.1. Solar Inverter Concept

The solar inverter plays a key role for EMEs of PV systems. Figure 4 shows a comparison of an inverter with module optimizers (SE) (Figure 4a) and a string inverter (K) (Figure 4b). The installation details were kept the same for Figure 4a,b: small-loop area behind the PV array (SLS), with functional equipotential earthing (W), zero distance between the string cables DC+ and DC− (R). These installation details were selected for the comparison of solar inverter concepts since they, according to theory [23], have the lowest impact on the emissions.
The MO_SE system in Figure 4a has 216 peaks above the highest background and 20 peaks were above the EMC limit. Whereas, the string inverters MO_K in Figure 4b has only 22 peaks above the highest background and 6 peaks were above the EMC limit. The MO_SE system has noticeably higher peaks then the K system, in the margin P s y s category 11–15 dB green, 16–20 dB blue, and >20 dB red.
Figure 5a shows the frequency histogram of the MO_SE system. Figure 5b shows a zoom-in of the 13–20 MHz range, where many peaks are visible. Here is a clear repetitive pattern visible, with multiples of 200 kHz in the frequency range of 13.8–18 MHz; in none of the measured string inverter systems (F, K, and S) were such repetitive patterns visible.
In summary, all MO_SE_yz system combinations showed 79–89 % more peaks than the three tested string inverter systems. Peaks have noticeably higher margins to the background (on average 90 %, 89 %, and 71 % more for the respected categories 11–15 dB, 16–20 dB, and >20 dB), regardless of loop area, earthing, or string cable distance. All MO_SE_yz system combinations have a visible repetitive pattern of 200 kHz. The prominence of the 200 kHz pattern varied slightly in the different system combinations. The most common frequency ranges were at 3.2–6.4 MHz and 12.6–21.2 MHz, with the second range being dominant in all measurements.
The same 200 kHz pattern was reported by [6] for a module optimizer system from the same manufacturer in the frequency range 18–22 MHz. Linder [17] reported 200 kHz and 100 kHz patterns in the frequency range 19–21 MHz and 33–35 MHz, the optimizer again coming from the same manufacturer.
The measurement results in combination with earlier reports [6,17] indicate that MO_SE_yz system combinations increase the risk of interference with radiocommunication, while the tested string inverter systems (F, S, and K) do not.
The string inverter system with one additional module optimizer (Tx) does not require optimizers behind every module. For the test, only one module was equipped with an optimizer. Such Tx systems showed no enlarged EMEs compared to the test string inverter systems (F, K, and S). However, Schwarzburger [28] reported that Tx optimizers can result in interference and send out signal patterns with multiples of 50 kHz. The reduced number of Tx interference cases could be explained by the feature that module optimizers are only added to shaded modules and not to all modules. Interference from submodular optimizers was reported in [10]. Current submodule and module optimizer systems show undesirable high levels of EMEs. These EMEs can have their origin in poor filtering within inverters and module-level power optimizers, high switching frequencies, and internal communication via, e.g., power line communication. In comparison, systems with string inverters can be built in such a way that they do not interfere with radiocommunication. This difference could be explained by the maturity level of the different solar inverter concept.

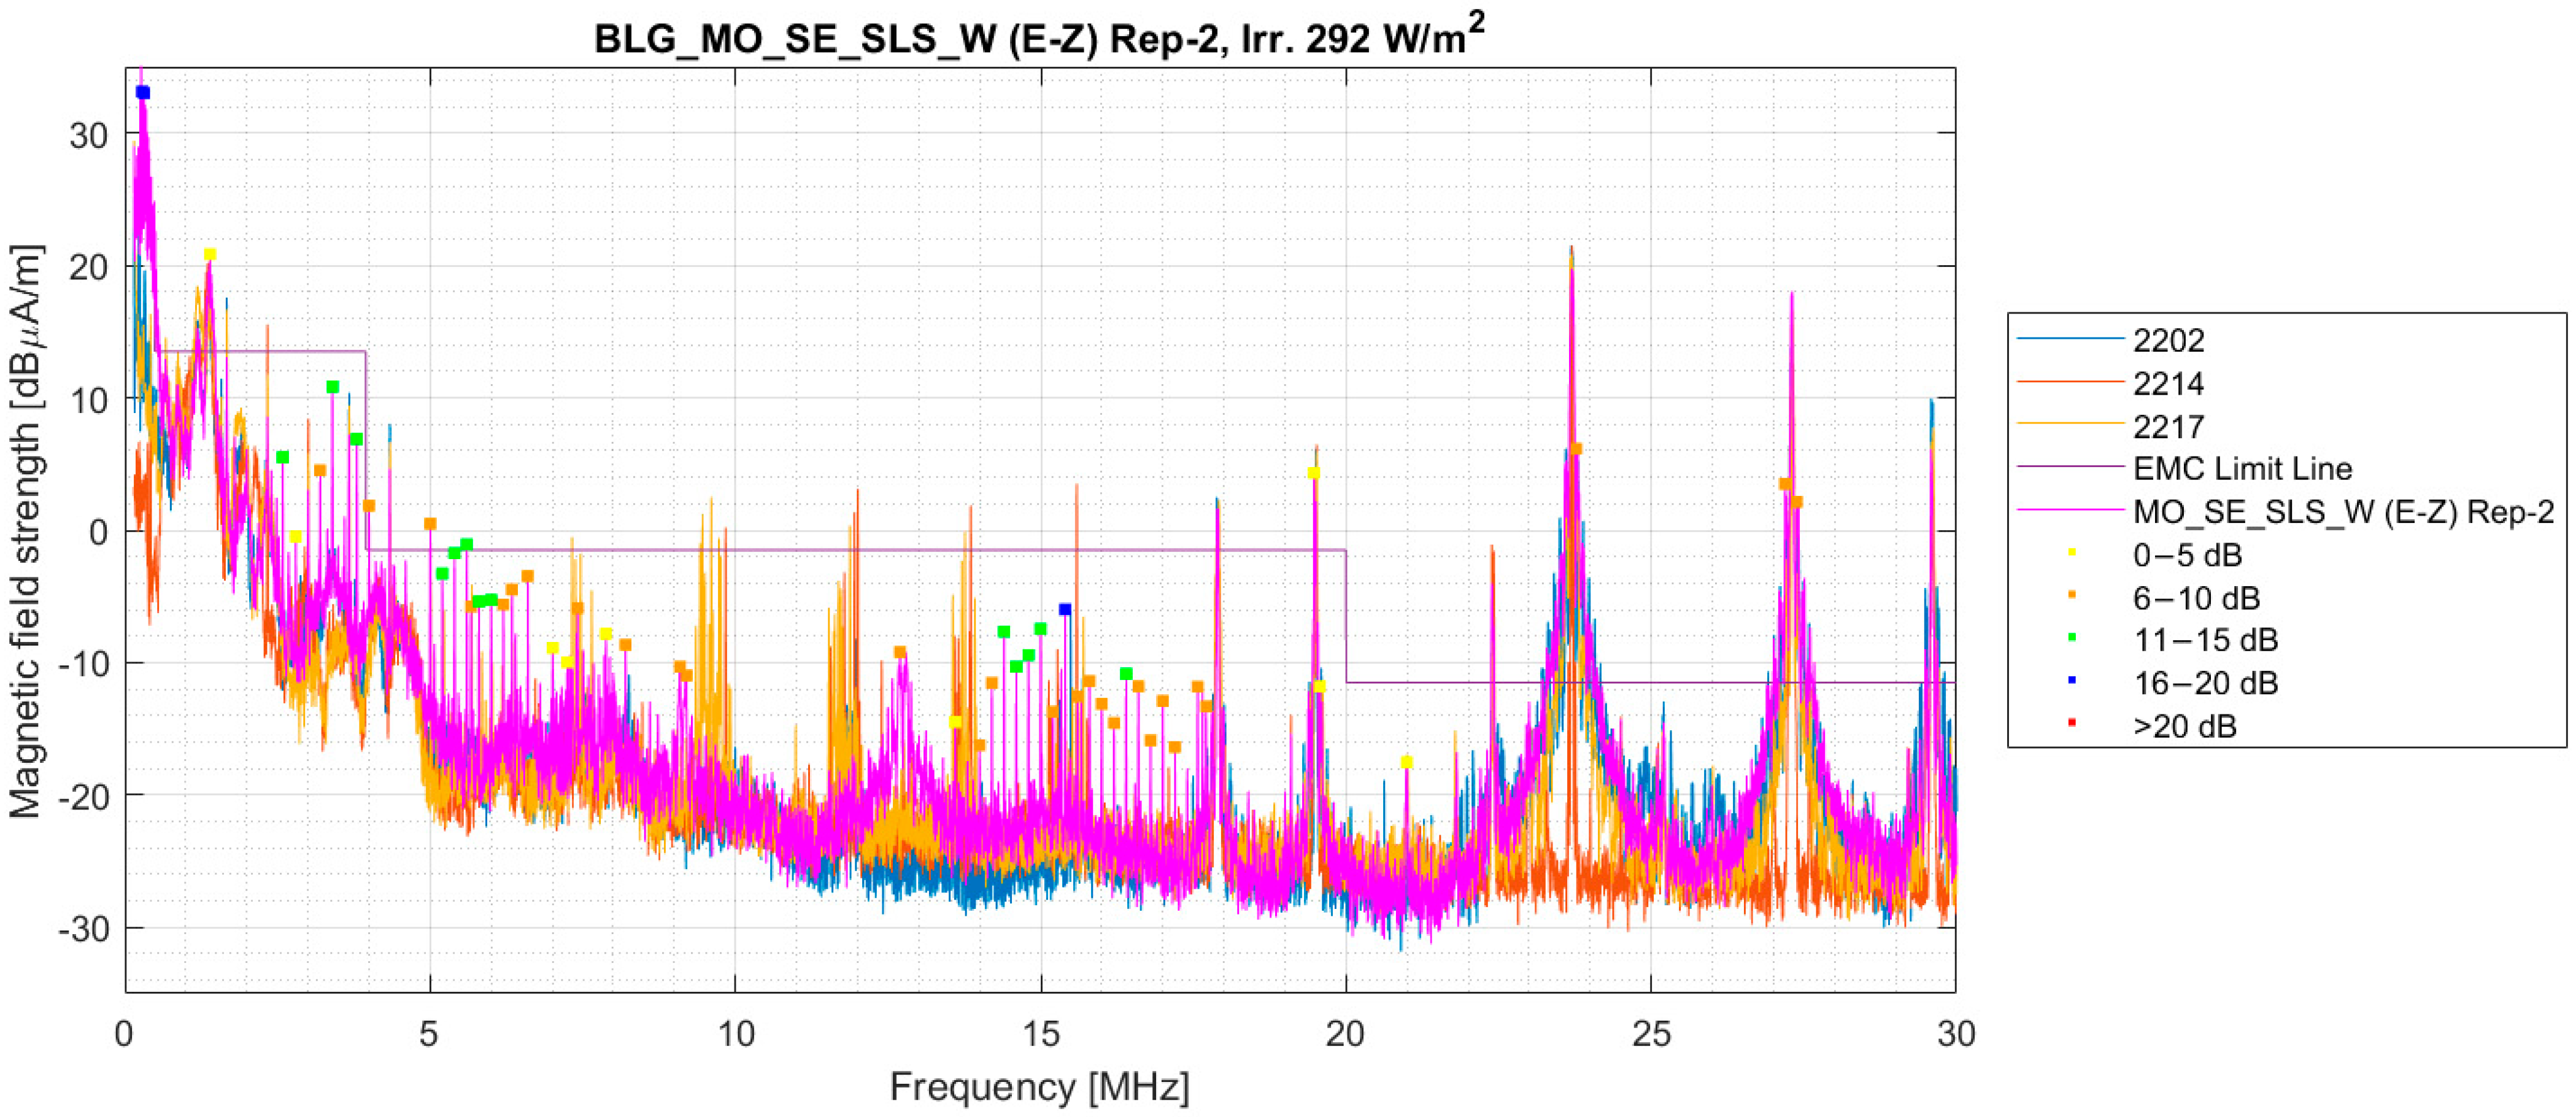
3.2. Photovoltiac Module

The PV module is a passive component and has therefore received little attention in the past in connection with EMEs. Figure 6 shows the comparison of a monofacial module (MO) left column (Figure 6a,c) and bifacial module (BI) right column (Figure 6b,d). The left column in Figure 6a,c shows the MO_SE system (Figure 6a) and MO_K system (Figure 6c) presented in Figure 4 and sets them in comparison to the right column of Figure 6b,d with the BI_SE system upper row (Figure 6b) and BI_K system lower row (Figure 6d).
The installation details were kept the same for all presented systems: small-loop area behind the photovoltaic array (SLS), with functional equipotential earthing (W), zero distance between the string cables DC+ and DC− (R). These installation details were selected for the comparison of PV modules since they, according to theory [23], have the lowest impact on the emissions.
The BI_SE system, Figure 6b, has 225 peaks above the highest background and 35 peaks above the EMC limit. The BI_K system, Figure 6d, has 54 peaks above the highest background and 27 peaks above the EMC limit. Both systems with BI modules have a visible increase in peaks above the highest background in the frequency range 6–15 MHz when compared to systems with MO modules. In the same frequency range, more peaks also exceed the EMC limit.
In summary, all BI_x_yz system combinations showed a visible increase in peaks above the highest background and above the EMC limit, in comparison to the MO_x_yz system combinations. Figure 7 summarizes peaks above the highest background (orange) and peaks above the EMC limit (blue) for each system combination, with the help of two boxplots. The BI_SE_SLS_W system shown in Figure 6b represents the minimum of all BI_SE_yz system combinations in Figure 7 (marked with a blue circle), while the maximum for BI_SE_yz is 335 peaks above the highest background and 71 peaks above the EMC limit. All BI_x_yz system combinations have a visible increase in peaks above the highest background in the frequency range 6–15 MHz, in comparison to the MO_x_yz systems. In the same frequency range, more peaks are located above the EMC limit. Therefore, the earlier-mentioned 200 kHz pattern is visible in a broader frequency range for BI_SE_yz system combinations.
The results indicate that bifacial glass–glass modules lead to a significant increase in the EMEs in the PV system. However, the measurements cannot show if the absence of the aluminum frame, the difference in encapsulation, or the difference in wiring between half-cut versus full-cell modules causes the deterioration. Further measurements are needed to prove if BI glass–glass modules also increase emissions outside the measured frequency range of 150 kHz to 30 MHz.
The results indicate that the solar inverter as well as the photovoltaic module can result in elevated levels of radiated electromagnetic emissions in photovoltaic systems. However, the possible cause of the observed impact from different components on the emissions is beyond the scope of this article. Further studies are needed to address the root cause of emissions in photovoltaic systems caused by their different components. Further work is also needed for the impact of different components on emission levels in other frequency ranges, such as 30 MHz to 1 GHz.

4. Conclusions

With the help of the statistical data analysis method, we can draw the following conclusions relevant for the design of photovoltaic systems.
String inverters are unlikely to interfere with radiocommunication when the PV system is installed according to recommended standards, rules, guidelines, and regulations.
Photovoltaic systems with module optimizers tend to have higher emissions. They show a signature of 200 kHz separation in the ranges 3.2–6.4 MHz and 12.6–21.2 MHz, when using aluminum-framed monofacial modules. The presence of these frequency components makes it more likely that inverters with module optimizers interfere with radiocommunication.
Our study showed that changes in cable management and earthing play a lesser role in electromagnetic emission behavior than the choice of solar inverter concept and module type.
To the best of our knowledge, this study shows for the first time that the change to bifacial glass–glass modules without an aluminum frame substantially increases radiated electromagnetic emissions. Bifacial glass–glass modules in combination with module optimizers show a more pronounced 200 kHz signature and emit in a broader frequency range than systems with aluminum-framed monofacial modules.

Author Contributions

Conceptualization, D.K. and U.L.; methodology, D.K. and U.L.; investigation, D.K. and U.L.; measurements, D.K. and U.L.; data processing and visualization D.K.; validation, D.K.; formal analysis, D.K.; writing—original draft preparation, D.K.; writing—review and editing, D.K., M.B., A.A. and U.L.; supervision, M.B. and A.A.; funding acquisition, D.K., U.L. and A.A. All authors have read and agreed to the published version of the manuscript.

Funding

This research was funded by the Swedish Energy Agency, grant numbers P2020-90239 and 50982-1 and grant numbers P2021-90275 and 52693-1.

Data Availability Statement

The data presented in this study are available on request from the corresponding author.

Acknowledgments

The authors would like to thank the Swedish Energy Agency for funding the projects: “Method to detect and to prevent EMI from PV installations” Project nr: 50982-1 (solEMC) and the “Solar Electricity Research Center Sweden” Project nr: 52693-1 (SOLVE) as a national center of excellence. The authors would like to thank the Swedish National Electrical Safety Board, the solEMC project member Mikael Bergbom from Friendly Power and the Swedavia radio council for fruitful discussions. We also thank the internship students Nadine Eisinger and Hugo Serris assisting in the measurement campaign, Joar Nyman from Solfamiljen, and diverse solar energy engineering master students from Dalarna University assisting in building the different PV system combinations. Thanks is extended to Ian Garman and Miritt Zisser for the language support throughout the writing process.

Conflicts of Interest

The authors declare no conflicts of interest. The funders had no role in the design of the study; in the collection, analyses, or interpretation of data; in the writing of the manuscript; or in the decision to publish the results.

References

  1. Ott, H.W. Electromagnetic compatibility. In Electromagnetic Compatibility Engineering; Wiley: Hoboken, NJ, USA, 2009; Chapter 1; pp. 1–42. [Google Scholar] [CrossRef]
  2. Araneo, R.; Lammens, S.; Grossiand, M.; Bertone, S. EMC Issues in High-Power Grid-Connected Photovoltaic Plants. IEEE Trans. Electromagn. Compat. 2009, 51, 639–648. [Google Scholar] [CrossRef]
  3. Henze, N.; Degner, T. Radio Interference of Photovoltaic Power Systems. In Proceedings of the 16th 6th International Wroclaw Symposium and Exhibition on EMC, Wroclaw, Poland, 25–28 June 2002. [Google Scholar]
  4. Regulation (EU) 2019/1020 of the European Parliament and of the Council of 20 June 2019 on Market Surveillance and Compliance of Products and Amending Directive 2004/42/EC and Regulations (EC) No 765/2008 and (EU) No 305/2011, OJ L 169/1. Available online: https://eur-lex.europa.eu/legal-content/EN/TXT/?uri=CELLAR:903d90ee-9712-11e9-9369-01aa75ed71a1 (accessed on 9 August 2023).
  5. Directive 2014/30/EU of the European Parliament and of the Council of 26 February 2014 on the Harmonisation of the Laws of the Member States Relating to Electromagnetic Compatibility, OJ L 96/79. Available online: https://eur-lex.europa.eu/legal-content/EN/TXT/?uri=CELEX:32014L0030 (accessed on 9 August 2023).
  6. Häberlin, H. Reception Interference from PV Systems with Power Optimizers; HBradio 5/2017; USKA: Bern, Switzerland, 2018; Available online: https://www.uska.ch/wp-content/uploads/2018/06/Empfangsst%C3%B6rungen-durch-PV-Anlage-mit-Power-Optimizern.HB9AZO.pdf (accessed on 22 November 2022). (In German)
  7. Schwarzburger, H. Optimizers Can Interfere. Photovoltaic. 2020; pp. 16–17. Available online: https://www.uska.ch/wp-content/uploads/2020/04/PV2-2020_DC-Optimierer.pdf (accessed on 22 November 2022). (In German).
  8. Radiocommunications Agency Netherlands. Annual Report Radiocommunications Agency Netherlands 2020. 2021, p. 29. Available online: https://www.agentschaptelecom.nl/documenten/jaarverslagen/2021/05/26/jaarbericht-2020 (accessed on 28 November 2022). (In Dutch).
  9. Hut, E. EMC Aspects of PV Installations [PowerPoint Slides]. 2019. Available online: https://fhi.nl/app/uploads/sites/42/2019/11/Agentschap-Telecom.pdf (accessed on 9 December 2022). (In Dutch).
  10. Olsson, H. Surveillance Visit Friberga School March 2021; Dnr: 19EV2763; Swedish National Electrical Safety Board: Kristinehamn, Sweden, 2021. (In Swedish) [Google Scholar]
  11. Swedish National Electrical Safety Board. Sales Ban. Dnr: 20EV1483, SolarEdge: P300, P350, P350I, P370, P4040, P405, P500, P505, P600, P650, P700, P730, P800p, P800s, P850, OPJ300-LV, M6240. 2021. Available online: https://www.elsakerhetsverket.se/privatpersoner/dina-elprodukter/forsaljningsforbud/solaredge-tvingas-saljstoppa-vaxelriktare/ (accessed on 10 October 2022). (In Swedish).
  12. Swedish National Electrical Safety Board. Sales Ban. Dnr: 19EV5340, Growatt: 8000TL3-S. 2021. Available online: https://www.elsakerhetsverket.se/privatpersoner/dina-elprodukter/forsaljningsforbud/sunnytek-solar-sweden-ab-tvingas-saljstoppa-growatt-vaxelriktare/ (accessed on 10 October 2022). (In Swedish).
  13. Swedish National Electrical Safety Board. Sales Ban. Dnr: 14EV1597, Carlo Gavazzi: HiNRG1G03EU(SE). 2015. Available online: https://www.elsakerhetsverket.se/privatpersoner/dina-elprodukter/forsaljningsforbud/storningar-fran-vaxelriktare/ (accessed on 10 October 2022). (In Swedish).
  14. Swedish National Electrical Safety Board. Sales Ban. Dnr: 14EV1599, Involar: MAC250-230-EUR. 2015. Available online: https://www.elsakerhetsverket.se/privatpersoner/dina-elprodukter/forsaljningsforbud/vaxelriktare-stor/ (accessed on 10 October 2022). (In Swedish).
  15. Stenumgaard, P.; Linder, S.; Olsson, H. Interference impact from solar-panel systems on HF Communications. Presented at the Nordic HF Conference (HF 19), Fårö, Gotland, 12–14 August 2019; p. 8.3. [Google Scholar]
  16. Stenumgaard, P.; Linder, S. Interference Impact from Solar-Panel Systems on Air Traffic Control Communications. In Proceedings of the 2019 International Symposium on Electromagnetic Compatibility-EMC EUROPE, Barcelona, Spain, 2–6 September 2019; pp. 1044–1048. [Google Scholar] [CrossRef]
  17. Linder, S.; Wiklundh, K. In-situ Measurements of Conducted and Radiated Emissions from Photovoltaic Installations. In Proceedings of the 2022 International Symposium on Electromagnetic Compatibility-EMC EUROPE, Gothenburg, Sweden, 5–8 September 2022; pp. 231–236. [Google Scholar] [CrossRef]
  18. Loschi, H.; Ferreira, L.; Nascimento, D.; Cardoso, P.; Carvalho, S.; Conte, F. EMC evaluation of off-grid and grid-tied photovoltaic systems for the Brazilian scenario. J. Clean Energy Technol. 2018, 6, 125–133. [Google Scholar] [CrossRef]
  19. Hamza, D.; Jain, P. Conducted EMI in grid-tied PV system. In Proceedings of the Intelec 2010, Orlando, FL, USA, 6–10 June 2010. [Google Scholar] [CrossRef]
  20. Di Piazza, M.C.; Serporta, C.; Tine, G.; Vitale, G. Electromagnetic compatibility characterisation of the DC side in a low power photovoltaic plant. In Proceedings of the 2004 IEEE International Conference on Industrial Technology (IEEE ICIT ’04), Hammamet, Tunisia, 8–10 December 2004. [Google Scholar] [CrossRef]
  21. Keyer, C.; Timens, R.; Buesink, F.; Leferink, F. In-situ measurement of high frequency emission caused by photo voltaic inverters. In Proceedings of the 2014 International Symposium on Electromagnetic Compatibility, Gothenburg, Sweden, 1–4 September 2014. [Google Scholar] [CrossRef]
  22. Mohos, A.; Ladanyi, J. Emission Measurement of a Solar Park in the Frequency Range of 2 to 150 kHz. In Proceedings of the 2018 International Symposium on Electromagnetic Compatibility (EMC EUROPE), Amsterdam, The Netherlands, 27–30 August 2018. [Google Scholar] [CrossRef]
  23. SEK Handbook 457; Photovoltaic–Recommendation and Rules for Electrical Installations. 1st ed. Swedish Electrical Standard: Kista, Sweden, 2019. (In Swedish)
  24. Azpúrua, M.; Pous, M.; Silva, F. A measurement system for radiated transient electromagnetic interference based on general purpose instruments. In Proceedings of the 2015 IEEE International Symposium on Electromagnetic Compatibility (EMC), Dresden, Germany, 16–22 August 2015; pp. 1189–1194. [Google Scholar] [CrossRef]
  25. Pico Technology. PicoScope 5000D Series—FlexRes Oscilloscopes and MSOs. Available online: https://www.picotech.com/download/datasheets/picoscope-5000d-series-data-sheet.pdf (accessed on 22 February 2024).
  26. IEC Standard CISPR 11:2015; Industrial, Scientific and Medical Equipment—Radio-Frequency Disturbance Characteristics—Limits and Methods of Measurement. International Electrotechnical Commission: Geneva, Switzerland, 2015.
  27. IEC Standard CISPR 16-2-3:2016; Specification for Radio Disturbance and Immunity Measuring Apparatus and Methods—Part 2-3: Methods of Measurement of Disturbances and Immunity—Radiated Disturbance Measurements. International Electrotechnical Commission: Geneva, Switzerland, 2016.
  28. Schwarzburger, H. Service: Insufficient. Photovoltaic. 2020; pp. 18–21. Available online: https://www.uska.ch/wp-content/uploads/2020/04/PV2-2020_DC-Optimierer.pdf (accessed on 22 November 2022). (In German).
Figure 1. PV system with modules and (a) string inverter, (b) inverter with one module-level power optimizer per module, further called inverter with module optimizers; (c) string inverter with one module-level power optimizer, further called string inverter with one optimizer; and (d) notation scheme for PV system combinations.
Energies 17 01893 g001
Figure 2. Schematic overview of inverter, modules, cables, pyranometer, and antenna positions B and E on the test site.
Energies 17 01893 g002
Figure 3. MO_SE_SLS_W E-Z system measurement (pink) for the position B direction x, EMC limit line (purple), background to system margin P s y s category (dot: yellow, orange, green, blue, red), 3 representative sample background measurements (divers colors, see legend 22xx).
Energies 17 01893 g003
Figure 4. A comparison of inverter with module optimizers (SE) (a) and string inverter system (K) (b); both with monocrystalline half-cut modules with an aluminum frame (MO). Installations details were kept the same. The inverter with module optimizer system (SE) has noticeably higher peaks than the string inverter systems (K), as displayed in the horizontal bar graph in the top right corner of each plot.
Energies 17 01893 g004
Figure 5. (a) shows the frequency histogram from system MO_SE_SLS_W; (b) shows a zoom-in of the repetitive pattern of 200 kHz.
Energies 17 01893 g005
Figure 6. A comparison of monofacial monocrystalline half-cell module with an aluminum frame (MO) (a,c) and with monocrystalline bifacial full-cell module with glass–glass encapsulation (BI) (b,d). Both BI systems have a visible increase in peaks above the highest background in the frequency range 6–15 MHz when compared to systems with MO modules.
Energies 17 01893 g006
Figure 7. Summary of peaks above the highest background (orange) and peaks above the EMC limit (blue) for combinations MO_SE_yz, BI_SE_yz, MO_K_yz, and BI_K_yz. Each boxplot shows the minimum, median, and maximum number of peaks per system combination. The two circles mark the location of the two compared systems in Figure 6a,b. They represent the minimum difference of peaks for system combinations MO_SE_yz and BI_SE_yz, while the median difference is marked with black lines.
Energies 17 01893 g007
Table 1. The used components (blue) and installation details (blue italic); their abbreviations, used in the notation scheme to describe PV system combinations; and detailed description of each component and installation detail.
AbbreviationDescription
Photovoltaic module
LR-60HiH 370WMO14 monofacial monocrystalline half-cell glass–backsheet modules with an aluminum frame
SOLID PRO 320W M.60BI14 bifacial monocrystalline full-cell glass–glass modules without an aluminum frame
Solar inverter concept
Symo 3.0-3-SFString inverter
Planticore 5.5KString inverter
SB 5000TL-21SString inverter
SE-5k-N4SEInverter with
P50514 module-level power optimizers
Symo 3.0-3-STFString inverter with
TS4-A-O1 module-level power optimizer
Planticore 5.5TKString inverter with
TS4-A-O1 module-level power optimizer
Loop area
Small-loop areaSLSMax. 5 cm distance between DC+ and DC−
Large-loop areaLL1.8 m distance between DC+ and DC−
String cables
Zero distanceRZero distance: max 1 cm from cable center to center
10 cm distanceR1010 cm distance
Earthing
WithWWith functional equipotential earthing
NoNWithout functional equipotential earthing
Disclaimer/Publisher’s Note: The statements, opinions and data contained in all publications are solely those of the individual author(s) and contributor(s) and not of MDPI and/or the editor(s). MDPI and/or the editor(s) disclaim responsibility for any injury to people or property resulting from any ideas, methods, instructions or products referred to in the content.

