1. Introduction
The increasing urgency of addressing climate change has made the transition to a low-carbon economy a global imperative. As the world’s largest energy consumer and carbon dioxide emitter, China plays a crucial role in this shift. This paper explores the intersection of environmental policy and social development, specifically examining the impact of China’s environmental regulations on employment. While the debate in academia about this relationship is ongoing, no consensus has yet been reached. Some researchers argue that environmental regulations, such as those targeting a low-carbon economy, may hinder job growth by increasing the operational costs for businesses. On the other hand, others contend that these regulations can foster employment opportunities by encouraging cleaner production practices and the creation of green jobs. The existing literature presents a divided stance on the impact of environmental regulations on employment. Some studies, like that of Curtis (2018), suggest that such regulations could increase the operational costs for businesses, potentially leading to job losses [
1]. Conversely, the research by Ren et al. (2020) and Sheriff et al. (2019) posits that environmental regulations can stimulate employment growth by encouraging the adoption of cleaner production practices and creating green jobs [
2,
3]. However, these studies often lack a comprehensive analysis of the diverse and complex contexts within which these regulations operate, particularly in developing countries like China.
To address this gap, our study focuses on China’s low-carbon city pilot policy, initiated in three phases (2010, 2012, and 2017), as a case study. This policy provides an ideal quasi-natural experiment setting to assess not just the environmental and economic impacts, as explored in previous studies [
4,
5,
6], but also the social impacts, particularly on employment, which has been less examined [
7]. The majority of the existing research on this topic has been centered on developed countries, where the pollution levels and economic structures differ significantly from those in China [
8,
9,
10]. Specifically, this study delves into China’s efforts to mitigate air pollution and transition towards a low-carbon economy through its low-carbon city pilot projects initiated in 2010, 2012, and 2017 by the National Development and Reform Commission. These projects aim to enhance environmental quality, combat climate change, and foster sustainable growth. The unique nature of these initiatives presents an exceptional quasi-natural experimental setting to evaluate the multifaceted impacts of environmental regulations, a domain where the prior research has primarily emphasized the environmental and economic outcomes, often neglecting the social dimension, especially employment effects.
In this context, our paper adopts a Difference-in-Differences (DID) analytical framework to scrutinize the influence of the low-carbon city pilot policy on employment within Chinese enterprises, exploring the policy’s underlying mechanisms. Utilizing data from A-share listed companies spanning from 2007 to 2021, we find that the policy induces a significant positive shift in enterprise employment levels, averaging an increase of about 7.27% relative to non-pilot areas. This impact is primarily mediated through the promotion of green innovation, the easing of financing constraints, and the stimulation of sales activities. Significantly, the policy predominantly enhances the employment opportunities for high-skilled workers in sales, research and development, and management roles. Moreover, the employment enhancement effect of the policy is notably stronger in sectors characterized as low-polluting or low-carbon, as well as in highly marketized industries and firms located in the eastern region. This study marks an important advancement in understanding the intersection of environmental regulations and employment within a significant developing country context, shedding light on the possible synergies and compromises between environmental strategies and social development objectives.
Our investigation introduces several innovative angles into the discourse on environmental regulations and employment, especially within the developmental context of China. Notably, it shifts the traditional focus from developed nations to China, providing fresh insights into how environmental policies are weaved through the socio-economic tapestry of emerging economies. Furthermore, our comprehensive examination of China’s low-carbon city pilot policy, encompassing its social facets, with a particular emphasis on employment, extends beyond the typical environmental and economic analyses. Employing the DID methodology, this study methodically isolates the effects of the low-carbon initiative on employment, thereby enhancing the credibility of our findings. The comprehensive dataset spanning from 2007 to 2021 enables an extensive evaluation of the policy’s long-term consequences. Our nuanced exploration of various employment dimensions—including the distinction between high-skilled and low-skilled jobs and different employment sectors—offers a more detailed understanding of the labor market dynamics under environmental regulations. The inclusion of rigorous robustness checks, such as parallel trend assessments and placebo tests, fortifies the study’s validity, ensuring that our results genuinely reflect the policy’s impact rather than coincidental trends.
Overall, this research significantly contributes to the nuanced dialogue on environmental policy and labor market dynamics in developing economies. By providing a well-rounded, contextually informed analysis supported by a solid methodological base, this paper enriches the collective understanding of the complex interrelations between environmental initiatives and socio-economic growth.
The remainder of this paper is structured as follows:
Section 2 provides a comprehensive literature review to contextualize and identify the research gaps this study addresses.
Section 3 elucidates the data sources and methodology employed, offering clarity on the analytical approaches taken.
Section 4 presents the results and a detailed discussion, linking the findings to the broader study themes and implications.
Section 5 concludes.
2. Literature Review
2.1. Environmental Regulation and Employment
Environmental challenges, particularly pollution and climate change, pose critical concerns globally, affecting both human existence and developmental prospects. In response, a multitude of environmental regulations have been enacted, the implications of which span environmental, economic, and social dimensions. The academic world has extensively explored these facets, with a specific focus on the impact of environmental regulation on employment, though a consensus is yet elusive.
A strand of the literature posits that environmental regulations could detrimentally affect employment. This effect is especially pronounced in industries or regions heavily regulated for environmental reasons [
11]. These regulations may increase production costs, resulting in higher product prices, reduced output, and consequently, a decline in labor demand [
12,
13]. Moreover, stringent regulations might prompt enterprises to adopt more efficient, albeit labor-replacing, technologies [
3,
14]. For instance, Gray et al. (2014) observed a marginal employment decrease in the pulp and paper industry following the implementation of the “Cluster Rule” by the US EPA in 2001 [
9]. Similarly, Raff and Earnhart (2019; 2022) noted a negative impact of environmental enforcement on job opportunities in facilities regulated by the US Clean Water Act [
15,
16]. Conversely, other studies highlight a potentially positive or negligible impact of environmental regulation on employment. This perspective suggests that regulations could stimulate employment through innovation, reduced costs, and increased output [
17]. When the employment promotion effect balances the crowding-out effect, environmental regulation might not significantly impact employment levels. Industry-level analyses in the UK and the US support this view, showing minimal or non-linear effects on employment [
18,
19,
20]. Studies also demonstrate positive impacts, as seen in the case of European carbon tax simulations and the carbon tax policy in British Columbia [
21,
22].
As the world’s second largest economy, China faces significant environmental challenges alongside its rapid economic growth. In response, the Chinese government has enacted a series of environmental regulations. However, given China’s particular stage of economic development, unique industrial structure, and distinct approach to formulating environmental regulations compared to developed countries, these regulations have had varying impacts on employment within Chinese enterprises. The research within China reveals mixed effects: on the one hand, policies such as the “Demarcation Plan for Air Pollution Prevention and Control” and the total sulfur dioxide emission controls implemented during the 11th Five-Year Plan have been linked to a reduction in labor demand within the manufacturing sector [
23,
24]. Liu and Li (2023) conducted a study on the impact of the implementation of the new Environmental Protection Law in 2015 on enterprise employment, and their findings indicate that this law has reduced enterprise labor demand by approximately 5.1% on average [
25]. On the other hand, similar to studies conducted in developed countries, some researches have indicated that environmental regulations can stimulate job creation within enterprises. Ren et al. (2020), Wang et al. (2023), and Cong et al. (2023) have all demonstrated a positive correlation between carbon emission trading programs and increased labor demand within regulated enterprises [
2,
26,
27].
The research findings illustrate that, despite marked differences in the economic development stages, industrial structures, and processes for formulating environmental regulations between China and developed countries, environmental policies in China generally tend to decrease labor demand within enterprises. Nonetheless, specific environmental regulations have been shown to stimulate labor demand, thus achieving the dual objectives of environmental governance and employment security. It is crucial to investigate whether China’s low-carbon pilot cities can also realize these dual benefits, providing significant insights for the environmental policies of other developing nations.
2.2. Low-Carbon City Pilot Policy and Employment
China’s National Development and Reform Commission’s three-phase implementation of low-carbon city pilot projects in 2010, 2012, and 2017 was aimed at greenhouse gas emission control and low-carbon development. This policy’s employment impact is multifaceted.
Distinct from traditional regulations, the low-carbon city pilot policy promotes green innovation by offering financial support and dedicated funds and guiding financial institutions. This policy fosters technological innovation within enterprises, potentially enhancing labor demand through green R&D and innovation compensation effects [
28,
29,
30]. For instance, studies show that EU ETS regulation and green credit policies in China have spurred low-carbon innovations in firms [
31,
32]. These insights suggest that low-carbon city pilot policies can increase employment by promoting green innovation within enterprises.
Financing plays a crucial role in enterprise operation and development. The low-carbon city pilot policy, by offering financial incentives and alleviating constraints, can directly influence labor costs and employment scale. Studies like those by Chodorow-Reich (2014) and Acharya et al. (2018) indicate that easing financial constraints can lead to an increase in enterprise employment [
33,
34]. Thus, the pilot policy’s role in expanding financing channels and reducing the associated costs could potentially bolster labor demand and enhance employment.
The low-carbon city pilot policy necessitates specific carbon emission targets, driving enterprises, especially key ones, to seek ways to enhance their production efficiency. This effort can lead to reduced production costs, spurring enterprise enthusiasm for expanding operations and increasing labor demand. Simonovska (2015) highlights the link between product prices and consumer demand, suggesting that lower prices can lead to higher demand and, consequently, an expansion in production and employment [
35]. Therefore, the low-carbon city pilot policy may promote labor demand and enterprise employment expansion through its impact on production scale.
3. Methodology and Data
3.1. Data Sources
China has implemented the Accounting Standards for Enterprises since 1 January 2007, with the aim of achieving international convergence with accounting standards. To ensure that our findings remain unaffected by significant criteria changes, we have carefully selected a representative sample. Our analysis utilizes data from all the A-share listed companies in China spanning the years 2007 to 2021. After excluding samples with missing values on employees, assets, profits, and other data, we obtained 34,985 company-year samples. The data for this study were sourced from the China Stock Market & Accounting Research Database (CSMAR database), which was developed by Shenzhen Xishima Data Technology Co., Ltd. (Shenzhen, China), ensuring a robust and comprehensive foundation for our analysis.
3.2. Model Setting
The DID methodology has gained prominence as an econometric tool for assessing the impact of policy interventions. This method conceptualizes institutional changes and policy enactments as exogenous shocks, analogous to “natural experiments” or “quasi-experiments” within an economic framework [
36,
37]. In this study, China’s low-carbon city pilot policy is treated as such a “quasi-natural experiment”. We apply the DID approach to evaluate the policy’s efficacy, considering its implementation across three distinct phases. This necessitates the use of a progressive DID model, which allows for a nuanced assessment of the policy’s temporal dynamics.
The core premise underpinning this analysis is that if the low-carbon city pilot policy effectively curtails carbon emissions, it indicates a successful transition towards low-carbon practices in these cities. An integral aspect of this transition is its potential impact on labor market dynamics, particularly employment at the enterprise level. To scrutinize this hypothesis, we investigate the influence of the low-carbon city pilot on employment within enterprises, deploying specific parameters to meticulously capture the nuances of this policy’s effects. This approach enables a comprehensive understanding of how environmental policy interventions, such as the low-carbon city initiative, reverberate through the employment landscape, thereby contributing vital insights into the intersection of environmental actions and economic consequences:
where the variable
LnLaborit denotes the natural logarithm of the number of employees in a corporation. The binary variable
LowCarbonPilotit is used to indicate whether a corporation is located in a city that has implemented the low-carbon city pilot policy, assigned a value of 1 if the policy is in place and 0 otherwise. Prior to conducting the regression test, we conducted the Hausman test and obtained a
p value of <0.01. This outcome provides strong support for incorporating fixed-effects models rather than random-effects models into our analysis. As a result, we have included both industry and time fixed effects in the model. The term
λi represents the fixed effect specific to each industry, capturing the industry-specific characteristics that might influence employment. Specifically, the 2012 edition of the China Securities Regulatory Commission’s Industry Classification Guidelines for Listed Companies classifies industry into 19 major sectors, including mining and manufacturing, among others. These sectors are further divided into 2-digit codes. Given the substantial presence of manufacturing enterprises as part of China’s industrial distribution, we further categorize the manufacturing industry into four distinct categories based on a 1-digit code system, resulting in a total of 22 industry categories. As a result, we incorporate 21 industry dummy variables into our regression model to effectively control for potential influences arising from factors at the industry level on enterprise employment. Similarly,
γt denotes the time fixed effect, accounting for temporal variations that could impact the outcome. The term
µit is included to capture random disturbances that could affect the dependent variable. The coefficient
β1 is of particular interest in our analysis, as it serves as the differential estimator. This coefficient is designed to measure the impact of the low-carbon city pilot policy on employment at the enterprise level. It quantifies the differential effect of the policy implementation on the employment figures for corporations located in pilot cities compared to those in non-pilot cities. Additionally, various control variables (
Controlit) are incorporated into the model to account for other factors that might influence employment within the enterprises. These control variables, detailed in
Table 1, include a range of economic, demographic, and industry-specific factors that could potentially affect the number of employees in a corporation. By including these variables, the model aims to isolate the effect of the low-carbon city pilot policy from other concurrent influences on corporate employment levels.
3.3. Variable Measurement
In line with the established methodologies in the existing literature [
2,
9], our study measures employment by counting the number of employees within firms. Specifically, we calculate firm-level employment (
LnLaborit) by taking the natural logarithm of the total number of employees in each firm.
Since 2010, China’s National Development and Reform Commission has rolled out three rounds of low-carbon city pilot projects. The first phase, initiated in July 2010, included five provinces and eight cities: Hubei, Yunnan, Guangdong, Shanxi, Liaoning, Chongqing, Xiamen, Nanchang, Baoding, Tianjin, Shenzhen, Hangzhou, and Guiyang. The second phase, launched in November 2012, expanded to one province and twenty-eight cities, including Beijing, Shanghai, Hainan, and others. The third phase, starting in January 2017, further encompassed forty-one cities and four counties, including Wuhai, Dalian, Xunke, and Changzhou, among others.
For our analysis, we define the initiation of the three batches of pilot policies as 2010 (first round), 2013 (second round), and 2017 (third round), taking into account the specific months and the lag in policy implementation. Accordingly, the variable LowCarbonPilotit is determined in this study. If a city where enterprises are located implements the low-carbon city pilot policy in year t, it is assigned a value of 1; otherwise, it receives a value of 0.
Following Liu et al. (2017) [
38], we select seven control variables for our model: return on assets (
ROAit), representing the net profit margin of total assets; leverage, indicating the debt–asset ratio; enterprise scale (
LnAssetit), measured using the logarithm of total assets;
TobinQit, as an indicator of growth ability; sales expense ratio (
SaleExpenseit), the proportion of sales expenses to operating revenue; income tax expense (
LnTaxit), the natural logarithm of corporate income tax expense; and the average wage level within enterprises (
LnWageit), denoted using the natural logarithm of average employee wages.
Table 2 in the manuscript presents descriptive statistics of these specific variables. The mean and standard deviation of enterprise employment (
LnLaborit) are 7.610 and 1.353, respectively, indicating that, on average, each sample enterprise employs approximately 2,018 employees, but the employee number between different enterprises across our sample has a larger amount of diversity. Therefore, it is crucial to investigate the factors influencing enterprise employment. The average value of the low-carbon city pilot policy (
LowCarbonPilotit) stands at 0.495, implying that nearly half of enterprises are impacted by this policy. The other variables align closely with existing relevant studies.
4. Empirical Analysis
4.1. The Impact of the Low-Carbon City Pilot Policy on Employment
Table 3 delineates the effects of the low-carbon city pilot policy on enterprise employment. The findings are broken down as follows:
Column (1) showcases the results when industry factors are not included in the model. Here, the coefficient of LowCarbonPilotit is estimated at 0.045, which is statistically significant at the 5% level. This suggests a notable impact of the policy on employment when industry-specific characteristics are not accounted for.
Column (2) presents the estimated results without the inclusion of time factors. The coefficient for LowCarbonPilotit is calculated to be 0.100, showing statistical significance at the 1% level. This indicates a more pronounced effect of the policy on employment when temporal variations are not considered.
In Column (3), the analysis integrates both industry and time factors. The resulting coefficient for LowCarbonPilotit is 0.073, which also passes the significance test at the 1% level. This comprehensive model suggests a robust relationship between the low-carbon city pilot policy and employment increases.
Overall, the results indicate that enterprises located in low-carbon pilot cities exhibit an average employment increase of approximately 7.27% compared to those in non-pilot cities. This finding underscores the positive impact of the low-carbon city initiatives on enterprise-level employment, even when controlling for industry and time variations.
4.2. The Parallel Trend Test
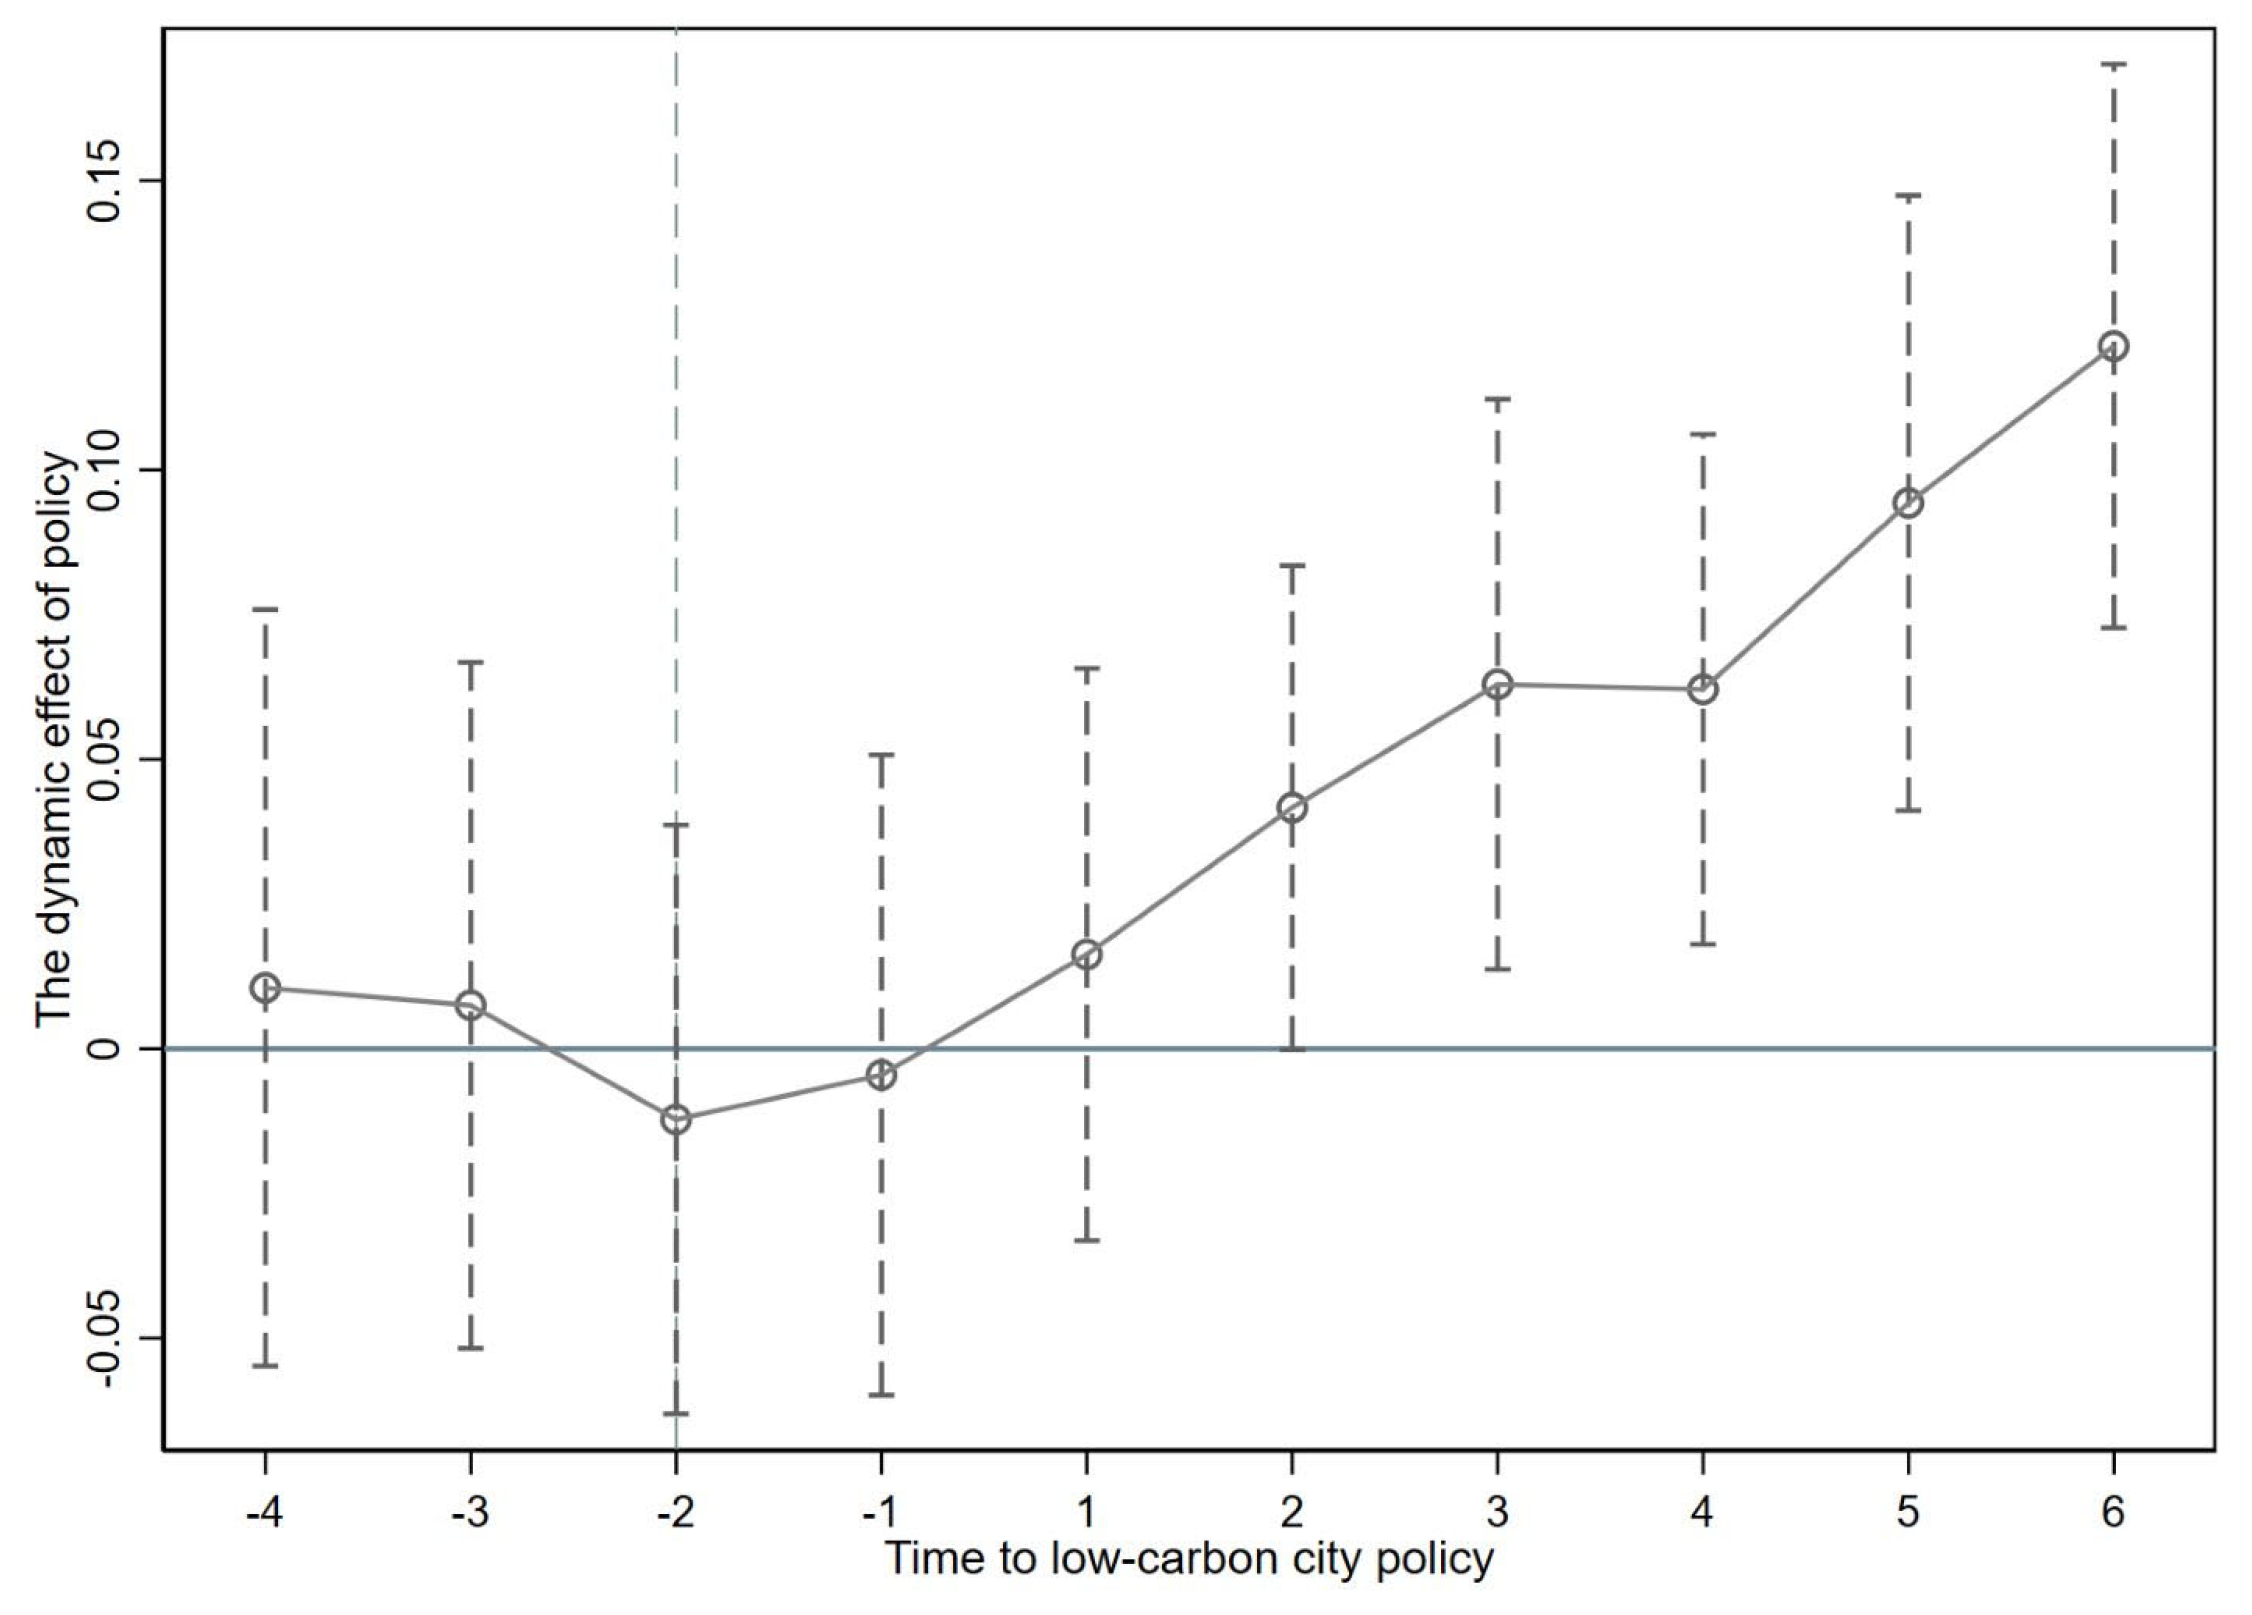
The fundamental premise of the Progressive Difference Model (PDM) lies in the parallel trend hypothesis, which posits that prior to policy implementation, there should be a parallel employment change trend between enterprises in pilot cities and non-pilot cities. Hence, this study employs the event study method proposed by Jacobson et al. (1993) to conduct a rigorous parallel trend test [
39], as follows:
In our analysis, Dumit represents a series of dummy variables designed to capture the temporal dimensions relative to the implementation of the low-carbon city pilot policy. These variables are defined as follows:
pre_4it: Equal to 1 if the observation is from the fourth year or earlier before the policy implementation at the enterprise’s location; 0 otherwise.
pre_3it: Set to 1 for observations from the third year before policy implementation; 0 otherwise.
pre_2it: Assigned a value of 1 for the second year before policy implementation; 0 otherwise.
pre_1it: Indicates the first year before policy implementation with a value of 1; 0 otherwise.
presentit: Equal to 1 during the year the policy is initiated; 0 for other years.
post_1it: Assigned a value of 1 for the first year following policy implementation; 0 otherwise.
post_2it: Set to 1 for the second year after policy implementation; 0 otherwise.
post_3it: Reflects the third year after policy implementation, assigned a value of 1 if applicable; 0 if not.
post_4it Set to 1 for the fourth year after policy implementation; 0 otherwise.
post_5it: Equal to 1 for the fifth year after policy implementation; 0 otherwise.
post_6it (and subsequent years): Similarly represents the sixth year (and beyond) after policy implementation, with a value of 1 if applicable; 0 otherwise.
The interpretation of the other variables remains consistent with Model (1). The coefficient δn is of particular interest, as it reflects the differential impact on labor employment between pilot and non-pilot cities over a period extending from 4 years before to 6 years after policy implementation.
The period during which the pilot policies are implemented is considered the baseline for comparison.
Figure 1 showcases the results of the parallel trend tests. These tests reveal that the coefficient estimates for each period prior to the policy implementation are not statistically significant. This lack of significance indicates no discernible difference in the employment trends between pilot and non-pilot cities before the enactment of the policy, thereby confirming the validity of the parallel trend assumption.
4.3. Placebo Test
In order to address potential discrepancies in the employment trends caused by temporal variations, our study conducts a parallel trend test by artificially advancing the timeline of the low-carbon city pilot policy implementation by 2, 3, 4, and 5 years. This method establishes hypothetical policy periods, labeled as LowCarbonPilot_Pre2it, LowCarbonPilot_Pre3it, LowCarbonPilot_Pre4it, and LowCarbonPilot_Pre5it, to simulate a scenario where the policy was enacted earlier than it actually was. We then apply Model (1), incorporating these pseudo-policy timeframes to conduct placebo tests.
The results of these time placebo tests are detailed in
Table 4. Notably, the coefficient estimates for
LowCarbonPilot_Pre2it,
LowCarbonPilot_Pre3it,
LowCarbonPilot_Pre4it, and
LowCarbonPilot_Pre5it are not statistically significant at the 10% level. This lack of significance suggests that there are no systematic temporal differences in the employment trends between the treatment (pilot cities) and control (non-pilot cities) groups. This outcome reinforces the conclusion that the observed impact on employment can indeed be attributed to the low-carbon city pilot policy, rather than being a result of inherent time-based variations in the data.
However, it is important to recognize that, despite the absence of a significant impact in the placebo scenarios, the low-carbon city pilot policy does contribute to the promotion of employment opportunities. The real policy implementation, as distinct from these placebo scenarios, demonstrates a tangible positive effect on employment within the treatment group.
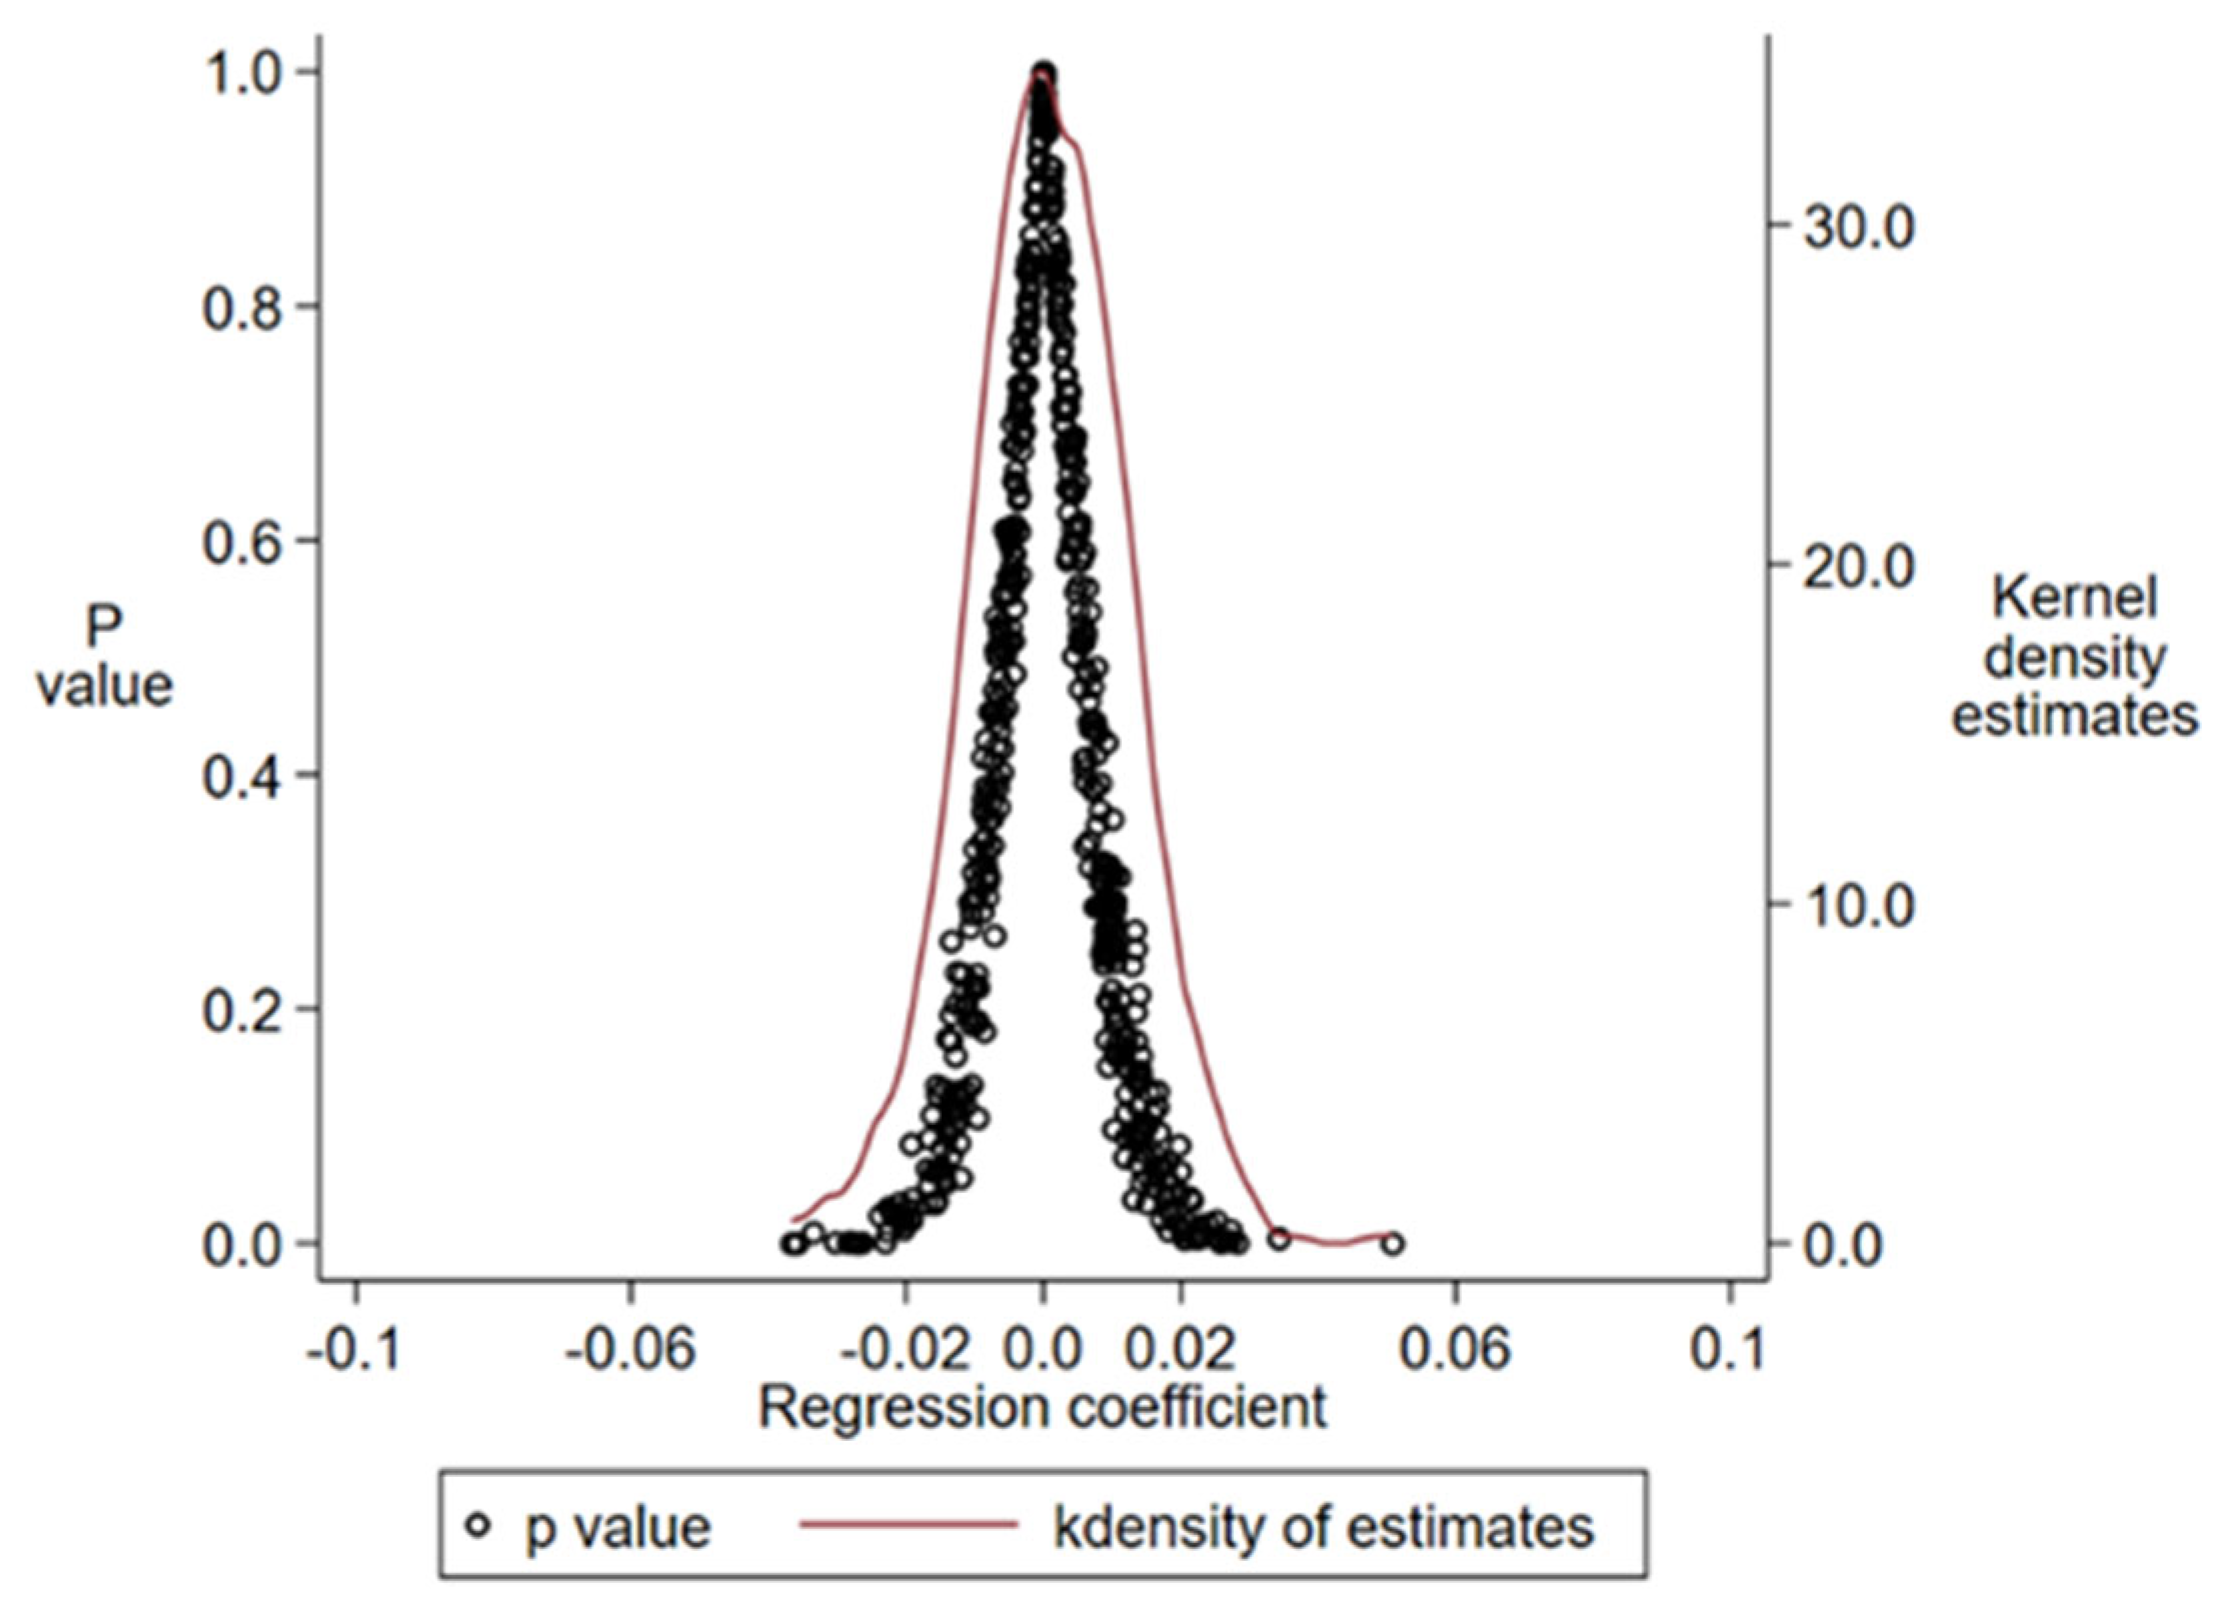
To address the potential influence of unobserved confounding variables on our benchmark regression results, we implemented a robust placebo test. This involved randomly selecting 121 cities from our dataset to form a pseudo-treatment group, while the remaining cities were assigned to a pseudo-control group. This setup was employed to simulate the effect of the low-carbon city pilot policy on employment using city-based placebo groups. We replicated this random selection process 500 times, generating 500 sets of regression coefficients and their respective p-values.
The findings from this placebo test are illustrated in
Figure 2. The kernel density distribution of the regression coefficients and their
p-values reveal a crucial pattern: most of the coefficients are statistically insignificant and follow a normal distribution centered around zero. This suggests that when random cities are falsely designated as being under the low-carbon city pilot policy, their employment impact coefficients do not significantly deviate from zero, indicating no real effect.
Crucially, the benchmark regression coefficients from our actual analysis are situated in the higher tail of this false regression coefficient distribution. Such positioning is statistically unlikely under the conditions of our placebo test, reinforcing the validity of our findings. Therefore, the results of the placebo test provide strong evidence to reject the hypothesis that unobservable factors might be driving the results of our benchmark estimates. This enhances the credibility of our conclusion that the low-carbon city pilot policy has a genuine and significant impact on employment, independent of unobservable confounding variables.
4.4. Robustness Tests
4.4.1. Processing of Extreme Values
To minimize the potential distortion caused by outliers in our benchmark regression analysis, this study implemented a trimming approach at both the 1% and 5% levels for all variables. By excluding these extreme values, we aimed to enhance the robustness of our results. Subsequently, Model (1) was re-estimated with this adjusted dataset.
The outcomes of this re-estimation, as detailed in
Table 5, reveal a key observation: even after the exclusion of outliers, the coefficient estimates for
LowCarbonPilotit remain statistically significant, at least at the 5% level. This outcome aligns with the findings of our initial benchmark estimations, affirming the consistency and reliability of our results. The presence of statistical significance in both the original and trimmed datasets underscores the robust nature of the impact of the low-carbon city pilot policy on employment.
4.4.2. Sample Adjustment
To address the potential bias introduced by abnormal samples into our benchmark regression analysis, this study systematically excluded specific subsets of data and conducted a series of re-regressions using Model (1). The process involved progressively removing samples from distinct categories: first from the financial industry, then from “ST” (Special Treatment) companies, and finally retaining only non-ST manufacturing industry samples.
The re-estimated results, detailed in
Table 6, provide insightful observations. Regardless of the data subset excluded—be it financial industry samples, ST company samples, or both—the coefficient estimates for the low-carbon city pilot policy consistently demonstrate statistical significance at the 1% level. This pattern holds true even when the analysis is restricted solely to non-ST manufacturing industry samples.
These findings robustly support the conclusions drawn from the initial benchmark regression analysis. The persistent statistical significance across various sample exclusions indicates that the observed impact of the low-carbon city pilot policy on employment is not an artifact of specific industry biases or anomalies associated with ST companies. Instead, it suggests a genuine, broad-based effect of the policy across different sectors of the economy.
4.4.3. Controlling the Influence of Macroeconomic Factors
The variation in the employment trends within firms can be influenced by a confluence of regional, industry, and macroeconomic factors. To account for these variables, our analysis incorporates interaction terms that combine regional and industry factors with yearly trends. This approach allows for a more nuanced understanding of how these broader factors may interact with the impact of the low-carbon city pilot policy on employment.
The findings, as displayed in
Table 7, reveal that after controlling for these regional, industry, and macro factors, the relationship between the low-carbon city pilot policy and labor employment continues to exhibit high statistical significance. The
t-statistics for these controlled results are 1.52, 1.75, 2.19, 2.04, and 2.04, respectively. These values indicate a robust and significant relationship, even when considering the potential influence of these wider economic and sectoral variables.
Importantly, these controlled results align closely with our benchmark estimation outcomes. This consistency reaffirms the validity of our initial findings, suggesting that the observed positive impact of the low-carbon city pilot policy on employment is not merely a product of regional or industry-specific trends or broader macroeconomic conditions. Instead, it underscores the direct and significant influence of the policy itself on labor employment across different contexts.
4.4.4. Controlling the Influence of Other Policies
To address the potential confounding effects of concurrent policies on enterprise employment during the sample period, and to enhance the accuracy of our benchmark estimations, this study meticulously identified four other policies through a thorough review of relevant documents. These policies include the Notice of the Chinese National Development and Reform Commission on Promoting the National Innovative City Pilot Work, the Notice on Implementing Special Emissions Limits for Air Pollutants, the establishment of the First Green Finance Reform and Innovation Pilot Zone, and the enactment of China’s Environmental Protection Law.
Recognizing that these policies could intersect with the low-carbon city initiatives, we introduced corresponding dummy variables into our benchmark regression model to account for their influence:
InnCityPilotit: Indicates whether an enterprise is located in a city designated as a national innovative city pilot in year t. This variable takes a value of 1 if the enterprise is in such a city and 0 otherwise.
EmiLimitPiloitt: Reflects whether an enterprise is situated in a key control area subject to special emission limits for air pollutants during year t, with a value of 1 if applicable and 0 otherwise.
GreenFinancePilotit: Denotes whether an enterprise is located in a green finance reform and innovation pilot zone in year t, assigned a value of 1 in this case and 0 otherwise.
EnvironmentalLawit: Represents the implementation of China’s revised Environmental Protection Law, with a value of 1 for years post-1 January 2015 and 0 for prior years. The regression results, displayed in
Table 8, indicate that the coefficients associated with the low-carbon city pilot policy retain their significance even when these other policy factors are controlled for. This includes adjustments for the effects of
InnCityPilotit,
EmiLimitPilotit,
GreenFinancePilotit, and
EnvironmentalLawit. The persistence of significance in these controlled scenarios further reinforces the robustness of the conclusions drawn in this paper, confirming that the impact of the low-carbon city pilot policy on enterprise employment is distinct and remains significant even in the presence of other policy interventions.
4.4.5. Propensity Score Matching DID Model
The potential endogeneity issues arising from reverse causality and sample selection bias are addressed in this section. Concerning reverse causality, the likelihood of enterprise employment, our dependent variable, influencing the key independent variable, the low-carbon city pilot policy, is minimal. The inherent nature of this relationship significantly reduces the risk of endogenous bias resulting from reverse causality.
To further address the potential endogenous problems stemming from sample selection bias, our study employs the propensity score matching (PSM) DID model. This approach allows for a more nuanced matching of the treated and control groups based on their propensity scores, thereby reducing biases in sample selection. We subsequently conducted robustness tests to validate the reliability of our results.
The findings, as detailed in
Table 9, underscore the robustness of our approach. The coefficient estimates for
LowCarbonPilotit consistently demonstrate statistical significance, with a minimum significance level of 5%. This outcome robustly supports the conclusion that the low-carbon city pilot policy positively influences enterprise employment. The significance of these results, especially in the context of a rigorously designed PSM DID model, lends further credibility to the assertion that the employment effects observed are indeed attributable to the policy intervention rather than being artifacts of endogenous biases.
4.5. An Analysis of the Employment Impact Mechanism of Low-Carbon City Pilot Policies
4.5.1. Green Innovation Mechanism
This study explores the hypothesis that the low-carbon city pilot policy may drive firm employment through the mechanism of green innovation. To investigate this, we use the number of green patent applications (AppGreenPatentit) and the number of green patent authorizations (AutGreenPatentit) as proxies for an enterprise’s green innovation activities. These indicators help us to examine the influence of the low-carbon city pilot policy on employment, specifically through the prism of green innovation.
The results pertaining to the impact of enterprise green innovation under the auspices of the low-carbon city pilot policy are displayed in Columns (1) and (2) of
Table 10. The findings are illuminating: the coefficient estimates for
LowCarbonPilotit in both columns are 0.100 and 0.083, respectively, each achieving statistical significance at the 1% level. This outcome robustly suggests that the implementation of low-carbon city pilot policies is not only conducive to fostering green innovation within enterprises but also has a significant downstream effect on labor demand and employment.
In essence, these results lend strong empirical support to the notion that green innovation, as stimulated by the low-carbon city pilot policy, plays a critical role in enhancing employment within firms. The findings underscore the positive employment implications of policy-driven environmental innovation initiatives.
4.5.2. Financing Constraint Mechanism
The pilot policies of low-carbon cities are strategically aimed at reducing corporate financing constraints and boosting employment by offering tax reductions and special subsidies tailored to the performance of specific industries. To empirically validate this mechanism, we employ the Whited and Wu (WW) index as a measure of corporate financing constraints. Developed by Whited and Wu in 2006 [
40], the WW index is calculated using the following formula:
where
Cashflowit is defined as the ratio of the net cash flow from operating activities to total assets.
DivPosit: Represents whether cash dividends were paid or not (coded as 1 if paid and 0 otherwise).
Leverageit: Denotes the ratio of long-term debt to total assets.
LnAssetit: Refers to the natural logarithm of total assets.
IndSaleGrowthit: Indicates the average sales growth rate in the industry.
SaleGrowthit: Represents the sales revenue growth rate of the enterprise.
The estimated results examining the impact of the low-carbon city pilot policy on corporate financing constraints are presented in Column (3) of
Table 10. The coefficient of
LowCarbonPilotit is estimated at −0.010, achieving statistical significance at the 10% level. This finding suggests that the low-carbon city pilot policy effectively eases corporate financing constraints, enabling firms to secure the necessary funding to support employment growth.
4.5.3. Sales Mechanism
Furthermore, the low-carbon cities pilot policy might also influence employment through its effect on sales. To investigate this aspect, we introduce the variable “ProSales”, defined as the ratio of an enterprise’s sales revenue to the industry average. This metric helps us to assess the impact of the low-carbon city pilot policies on employment through the sales mechanism.
The impact of the low-carbon city pilot policy on enterprise sales is detailed in Column (4) of
Table 10. The estimated coefficient for
LowCarbonPilotit is 0.241, demonstrating statistical significance at the 1% level. These results indicate that, under the interplay of cost theory and innovation induction theory, the low-carbon city pilot policies not only enhance enterprise sales but also positively affect labor demand and employment. This underlines the multifaceted nature of these policies in stimulating economic growth and job creation.
4.6. Heterogeneity Analysis
4.6.1. Educational Background
This section delves into the differential impacts of the low-carbon city pilot policy on employment among highly skilled and low-skilled workers. We operationalize “highly skilled personnel” as employees with a college degree or higher (LnCollLaborit) and “low-skilled workers” as those without such qualifications (LnLowLaborit). Both measures are quantified using the natural logarithm of the respective employee counts. These variables are then integrated into Model (1) for regression analysis.
The effects of the low-carbon city pilot policy on these two categories of workers are presented in Columns (1) and (2) of
Table 11. The analysis reveals that the coefficients for low-carbon city pilot policies are 0.170 for highly skilled employees and 0.034 for low-skilled workers. Notably, the coefficient for highly skilled workers demonstrates statistical significance at the 1% level, suggesting that low-carbon city pilot policies predominantly boost employment among highly skilled individuals.
4.6.2. Occupational Classification
Further, the study assesses the impact of the low-carbon city pilot policy on different occupational classifications within enterprises. To this end, we categorized employees into four groups, sales staff, R&D staff, management staff, and production staff, based on their roles within a company. The respective employee counts in these categories are represented by LnSaleLaborit, LnR&DLaborit, LnManLaborit, and LnProLaborit, each measured using the natural logarithm.
The influence of the low-carbon city pilot policy on these diverse occupational categories is detailed in Columns (3) to (6) of
Table 11. The coefficients for
LowCarbonPilotit across these categories are estimated to be 0.139 for sales staff, 0.219 for R&D personnel, 0.052 for management staff, and 0.031 for production staff. Interestingly, the coefficients for sales, R&D, and management personnel all pass the significance test at the 1% level. This outcome indicates that low-carbon city pilot policies are particularly effective in promoting employment in sales, R&D, and management roles, underscoring the policy’s varied impact across different occupational segments.
4.6.3. Industry and Region Background
In this section, we explore the differential impacts of China’s low-carbon city pilot policy on employment across various industrial sectors. We classify enterprises based on their industry’s environmental impact, distinguishing between those in heavy-polluting industries, as defined by the 2010 Ministry of Environmental Protection guidelines, and those in high-carbon industries, as outlined in the 2011 Notice on Carbon Emission Rights Trading. Accordingly, industries such as mining, textiles, and chemical manufacturing are designated as heavy polluting (PollutingIndustryit = 1), while sectors like petrochemicals and steel manufacturing are classified as high-carbon (HighCarbonIndustryit = 1). Other sectors are considered as neither heavily polluting nor high-carbon.
The regression results, detailed in Columns (1) and (2) of
Table 12, illustrate that the low-carbon city pilot policy positively affects employment in less polluting and lower-carbon industries, with significant coefficients of 0.120 and 0.110 at the 1% significance level for the
LowCarbonPilotit variable. In contrast, the interactions between this policy and the polluting or high-carbon industry variables (
PollutingIndustryit × LowCarbonPilotit and
HighCarbonIndustryit × LowCarbonPilotit) exhibit significant negative impacts on employment within these sectors, with coefficients of −0.164 and −0.148, respectively, indicating a policy-induced labor shift from more to less environmentally impactful sectors.
Further, our investigation extends to the policy’s employment effects across different regional contexts, considering the levels of marketization and geographical location. Based on An et al. (2020), we categorize enterprises as having high marketization if they are located in regions surpassing the annual average marketization level (
HighMarketizationit = 1) [
41]. Additionally, enterprises situated in the eastern part of China are marked as
EasternRegionit = 1.
The analyses presented in Columns (3) and (4) of
Table 12 suggest that while the low-carbon city policy’s general impact on employment is not significantly positive across all regions, it does significantly enhance employment in enterprises with high marketization levels and those located in the eastern region, as indicated by the significant positive coefficients for
HighMarketizationit × LowCarbonPilotit and
EasternRegionit × LowCarbonPilotit, at least at the 5% level. This underlines the nuanced role of regional economic contexts and geographical positioning in modulating the employment effects of environmental policies.
5. Conclusions
At the heart of contemporary global challenges lies the imperative of reconciling economic growth with environmental sustainability. This dual objective propels the exploration of how policy initiatives, particularly those aimed at reducing carbon emissions, influence socio-economic dynamics such as employment. China, as a global leader in energy consumption and carbon emissions, has embarked on an ambitious journey to transform its urban landscapes through a low-carbon city pilot policy. This initiative not only reflects China’s commitment to environmental sustainability but also serves as a critical testbed for understanding the interplay between ecological policies and labor markets.
Our research stems from the pressing need to assess the socio-economic repercussions of environmental policies. With the debate on the relationship between environmental regulations and employment outcomes still unresolved, this study seeks to provide an analysis of China’s low-carbon city policy’s impact on employment. This endeavor is rooted in the broader context of global efforts to mitigate climate change impacts without compromising economic vitality. The research is motivated by the quest to explore the potential of environmental policies to foster job creation, thereby contributing to a deeper understanding of sustainable development practices. Our study aims to address the critical question: What is the impact of China’s low-carbon city pilot policy on employment? In pursuit of this question, the research delves into the mechanisms through which the policy influences labor markets and examines the heterogeneity of its effects across different sectors and regions.
Using the DID and PSM DID methods, complemented by robustness checks and mechanism analyses, this study examines the effect on employment of the low-carbon city policy. The analysis is underpinned by an extensive dataset from A-share listed companies spanning from 2007 to 2021, offering a rich empirical basis for assessing the policy’s outcomes.
Our research shows that there is a positive effect of the low-carbon city policy on employment with statistical significance. The finding reveals that there is an average increase of 7.27% in employment levels in pilot cities compared to their non-pilot counterparts. This impact is primarily mediated through green innovation, the easing of financing constraints, and the enhancement of sales activities. Notably, the policy disproportionately benefits high-skilled workers and exerts a more pronounced effect on non-polluting industries and regions with advanced market mechanisms, particularly in the eastern areas of China.
The study’s implications are profound, advocating for the strategic expansion of low-carbon city initiatives across China. It underscores the feasibility of harmonizing environmental sustainability with economic development, highlighting the “piloting before promotion” model as an effective approach to scaling these initiatives. Furthermore, the research emphasizes the need for policies to mitigate the potential structural unemployment resulting from industrial shifts towards low-carbon models.
While this research contributes significantly to our understanding of environmental policy impacts on employment, it identifies areas for future inquiry. Future studies could explore the broader economic impacts of low-carbon policies beyond A-share listed companies, including their effects on small and medium-sized enterprises. Additionally, the research could extend to examining the implications of such policies on employee behavior and organizational efficiency, thereby providing a more holistic view of the socio-economic effects of environmental initiatives.
In summary, this study enriches the discourse on the socio-economic dimensions of environmental policies, offering valuable insights for policymakers and scholars alike. By elucidating the employment effects of China’s low-carbon city policy, it underscores the potential of targeted environmental initiatives to contribute positively to both ecological sustainability and economic vitality, paving the way for informed policy formulation and implementation in an era of sustainable development.
Author Contributions
Conceptualization, Z.H. and C.W.; methodology, Z.H. and X.Y.; software, X.Y.; validation, C.W.; formal analysis, Z.H.; investigation, C.W.; resources, Z.H.; data curation, C.W.; writing—original draft preparation, C.W.; writing—review and editing, X.Y.; visualization, Z.H. and C.W.; supervision, Z.H. and X.Y; project administration, Z.H.; funding acquisition, Z.H. All authors have read and agreed to the published version of the manuscript.
Funding
This research was funded by the National Natural Science Foundation of China, grant number 71974160.
Data Availability Statement
The data utilized in this study are owned by and accessible through the CSMAR database (
https://data.csmar.com/). For instance, the employment data were obtained from the governance comprehensive information file in the CSMAR database. The control variable data were sourced from both the corporate research series and stock market series of the CSMAR database. Our access to the data used in this study was based on Southwestern University of Finance and Economics’ purchase of use rights for the CSMAR (CSMAR Account: xncjdx). As per our agreement, we do not possess authorization to share this proprietary information; therefore, any researcher can obtain the corresponding access rights through institutional or individual registration and purchase. Throughout this process, you may reach out for assistance via email (
service@csmar.com) or telephone (400-639-888).
Conflicts of Interest
The authors declare no conflicts of interest.
References
- Curtis, E.M. Who loses under cap-and-trade programs? The labor market effects of the NOx budget trading program. Rev. Econ. Stat. 2018, 100, 151–166. [Google Scholar] [CrossRef]
- Ren, S.; Liu, D.; Li, B.; Wang, Y.; Chen, X. Does emissions trading affect labor demand? Evidence from the mining and manufacturing industries in China. J. Environ. Manag. 2020, 254, 109789. [Google Scholar] [CrossRef] [PubMed]
- Sheriff, G.; Ferris, A.E.; Shadbegian, R.J. How did air quality standards affect employment at US power plants? The importance of timing, geography, and stringency. J. Assoc. Environ. Resour. Econ. 2019, 6, 111–149. [Google Scholar] [CrossRef] [PubMed]
- Yu, Y.; Zhang, N. Low-carbon city Pilot and carbon emission efficiency: Quasi-experimental evidence from China. Energy Econ. 2021, 96, 105125. [Google Scholar] [CrossRef]
- Chen, H.; Guo, W.; Feng, X.; Wei, W.; Liu, H.; Feng, Y.; Gong, W. The impact of low-carbon city pilot policy on the total factor productivity of listed enterprises in China. Resour. Conserv. Recycl. 2021, 169, 105457. [Google Scholar] [CrossRef]
- Pan, A.; Zhang, W.; Shi, X.; Dai, L. Climate policy and low-carbon innovation: Evidence from low-carbon city pilots in China. Energy Econ. 2022, 112, 106129. [Google Scholar] [CrossRef]
- Fu, L.; Zhao, H.; Ma, F.; Chen, J. Estimating heterogeneous effects of China’s low-carbon pilot city policy on urban employment. J. Clean. Prod. 2024, 434, 139882. [Google Scholar] [CrossRef]
- Neuwahl, F.; Löschel, A.; Mongelli, I.; Delgado, L. Employment impacts of EU biofuels policy: Combining bottom-up technology information and sectoral market simulations in an input–output framework. Ecol. Econ. 2008, 68, 447–460. [Google Scholar] [CrossRef]
- Gray, W.B.; Shadbegian, R.J.; Wang, C.; Meral, M. Do EPA regulations affect labor demand? Evidence from the pulp and paper industry. J. Environ. Econ. Manag. 2014, 68, 188–202. [Google Scholar] [CrossRef]
- Yip, C.M. On the labor market consequences of environmental taxes. J. Environ. Econ. Manag. 2018, 89, 136–152. [Google Scholar] [CrossRef]
- Greenstone, M. The impacts of environmental regulations on industrial activity: Evidence from the 1970 and 1977 clean air act amendments and the census of manufactures. J. Political Econ. 2002, 110, 1175–1219. [Google Scholar] [CrossRef]
- Walker, W.R. The transitional costs of sectoral reallocation: Evidence from the clean air act and the workforce. Q. J. Econ. 2013, 128, 1787–1835. [Google Scholar] [CrossRef]
- Hanoteau, J.; Talbot, D. Impacts of the Québec carbon emissions trading scheme on plant-level performance and employment. Carbon Manag. 2019, 10, 287–298. [Google Scholar] [CrossRef]
- Walker, W.R. Environmental regulation and labor reallocation: Evidence from the clean air act. Am. Econ. Rev. 2011, 101, 442–447. [Google Scholar] [CrossRef]
- Raff, Z.; Earnhart, D. The effects of clean water act enforcement on environmental employment. Resour. Energy Econ. 2019, 57, 1–17. [Google Scholar] [CrossRef]
- Raff, Z.; Earnhart, D. Employment and environmental protection: The role of regulatory stringency. J. Environ. Manag. 2022, 321, 115896. [Google Scholar] [CrossRef] [PubMed]
- Berman, E.; Bui, L.T. Environmental regulation and labor demand: Evidence from the south coast air basin. J. Public Econ. 2001, 79, 265–295. [Google Scholar] [CrossRef]
- Cole, M.A.; Elliott, R.J. Do environmental regulations cost jobs? An industry-level analysis of the UK. B.E. J. Econ. Anal. Policy 2007, 7, 1668. [Google Scholar] [CrossRef]
- Hafstead, M.A.C.; Williams, R.C., III. Unemployment and environmental regulation in general equilibrium. J. Public Econ. 2018, 160, 50–65. [Google Scholar] [CrossRef]
- Zhong, S.; Xiong, Y.; Xiang, G. Environmental regulation benefits for whom? Heterogeneous effects of the intensity of the environmental regulation on employment in China. J. Environ. Manag. 2021, 281, 111877. [Google Scholar] [CrossRef]
- Carraro, C.; Galeotti, M.; Gallo, M. Environmental taxation and unemployment: Some evidence on the ‘double dividend hypothesis’ in Europe. J. Public Econ. 1996, 62, 141–181. [Google Scholar] [CrossRef]
- Yamazaki, A. Jobs and climate policy: Evidence from British Columbia’s revenue-neutral carbon tax. J. Environ. Econ. Manag. 2017, 83, 197–216. [Google Scholar] [CrossRef]
- Liu, M.; Tan, R.; Zhang, B. The costs of “blue sky”: Environmental regulation, technology upgrading, and labor demand in China. J. Dev. Econ. 2021, 150, 102610. [Google Scholar] [CrossRef]
- Zheng, J.; He, J.; Shao, X.; Liu, W. The employment effects of environmental regulation: Evidence from eleventh five-year plan in China. J. Environ. Manag. 2022, 316, 115197. [Google Scholar] [CrossRef] [PubMed]
- Liao, T.; Liu, G.; Liu, Y.; Lu, R. Environmental regulation and corporate employment revisited: New quasi-natural experimental evidence from China’s new environmental protection law. Energy Econ. 2023, 124, 106802. [Google Scholar] [CrossRef]
- Wang, J.; Wang, Y.; Song, J. The policy evaluation of China’s carbon emissions trading scheme on firm employment: A channel from industrial automation. Energy Policy 2023, 178, 113590. [Google Scholar] [CrossRef]
- Cong, J.; Xu, T.; Zhang, W.; Liang, D.; Zhao, Y. Creation or crowding out? A “two-eight split” phenomenon in the employment effects of the carbon trading policy in China. J. Clean. Prod. 2023, 415, 137722. [Google Scholar] [CrossRef]
- Porter, M.E.; Van der Linde, C. Toward a new conception of the environment-competitiveness relationship. J. Econ. Perspect. 1995, 9, 97–118. [Google Scholar] [CrossRef]
- Bergek, A.; Berggren, C. The impact of environmental policy instruments on innovation: A review of energy and automotive industry studies. Ecol. Econ. 2014, 106, 112–123. [Google Scholar] [CrossRef]
- Xiong, G.; Shi, D.; Li, M. The effect of low-carbon pilot cities on the green technology innovation of enterprises. Sci. Res. Manag. 2020, 41, 93–102. [Google Scholar]
- Calel, R.; Dechezleprêtre, A. Environmental policy and directed technological change: Evidence from the European carbon market. Rev. Econ. Stat. 2016, 98, 173–191. [Google Scholar] [CrossRef]
- He, L.; Zhang, L.; Zhong, Z.; Wang, D.; Wang, F. Green credit, renewable energy investment and green economy development. J. Clean. Prod. 2019, 208, 363–372. [Google Scholar] [CrossRef]
- Chodorow-Reich, G. The employment effects of credit market disruptions: Firm-level evidence from the 2008–9 financial crisis. Q. J. Econ. 2014, 129, 1–59. [Google Scholar] [CrossRef]
- Acharya, V.V.; Eisert, T.; Eufinger, C.; Hirsch, C. Real effects of the sovereign debt crisis in Europe: Evidence from syndicated loans. Rev. Financ. Stud. 2018, 31, 2855–2896. [Google Scholar] [CrossRef]
- Simonovska, I. Income differences and prices of tradables: Insights from an online retailer. Rev. Econ. Stud. 2015, 82, 1612–1656. [Google Scholar] [CrossRef]
- Meyer, B.D.; Viscusi, W.K.; Durbin, D.L. Workers’ compensation and injury duration: Evidence from a natural experiment. Am. Econ. Rev. 1995, 85, 322–340. [Google Scholar] [PubMed]
- Bronzini, R.; Piselli, P. The impact of R&D subsidies on firm innovation. Res. Policy 2016, 45, 442–457. [Google Scholar]
- Liu, M.; Shadbegian, R.; Zhang, B. Does environmental regulation affect labor demand in China? Evidence from the textile printing and dyeing industry. J. Environ. Econ. Manag. 2017, 86, 277–294. [Google Scholar] [CrossRef]
- Jacobson, L.S.; LaLonde, R.J.; Sullivan, D.G. Earnings losses of displaced workers. Am. Econ. Rev. 1993, 83, 685–709. [Google Scholar]
- Whited, T.M.; Wu, G. Financial constraints risk. Rev. Financ. Stud. 2006, 19, 531–559. [Google Scholar] [CrossRef]
- An, J.; Armitage, S.; Hou, W.; Liu, X. Do checks on bureaucrats improve firm value? Evidence from a natural experiment. Account. Financ. 2020, 60, 4821–4844. [Google Scholar] [CrossRef]
| Disclaimer/Publisher’s Note: The statements, opinions and data contained in all publications are solely those of the individual author(s) and contributor(s) and not of MDPI and/or the editor(s). MDPI and/or the editor(s) disclaim responsibility for any injury to people or property resulting from any ideas, methods, instructions or products referred to in the content. |
© 2024 by the authors. Licensee MDPI, Basel, Switzerland. This article is an open access article distributed under the terms and conditions of the Creative Commons Attribution (CC BY) license (https://creativecommons.org/licenses/by/4.0/).


