Article

Rheological Properties of Crude Oil and Produced Emulsion from CO2 Flooding

1
School of Energy and Power Engineering, Xi’an Jiaotong University, Xi’an 710049, China
2
Energy Strategy and Low-Carbon Development Research Center, Sichuan Energy Internet Research Institute, Tsinghua University, Chengdu 610213, China
3
Department of Energy and Power Engineering, Tsinghua University, Beijing 100084, China
*
Authors to whom correspondence should be addressed.
Energies 2025, 18(3), 739; https://doi.org/10.3390/en18030739
Submission received: 13 January 2025 / Revised: 2 February 2025 / Accepted: 4 February 2025 / Published: 6 February 2025
(This article belongs to the Special Issue Low Carbon Energy Generation and Utilization Technologies)

Abstract

:
Carbon Capture, Utilization and Storage (CCUS) technology is recognized as a pivotal strategy to mitigate global climate change. The CO2 storage and enhanced oil recovery (CCUS-EOR) technology not only enhances oil recovery rates but also contributes to significant reductions in CO2 emissions, with significant social and economic benefits. This paper examines the application of CO2-EOR technology in both enhancing oil recovery and facilitating geological CO2 storage, and analyzes its implementation status and differences in the United States and China. Through experimental investigations conducted in a specific oilfield, we analyze the effects of dissolved CO2 on the viscosity–temperature characteristics, yield value under pressure, stability, and rheological properties of crude oil and produced fluids. Additionally, we assess the demulsification effectiveness of various demulsifiers. Our findings indicate that both dissolved CO2 in crude oil and emulsions exhibit non-Newtonian fluid behavior characterized by shear thinning, and the viscosity decreases with the increase in temperature and pressure. Furthermore, the presence of dissolved CO2 exacerbates the oil–water separation phenomenon in produced fluids, thereby diminishing emulsion stability. The increase in emulsion concentration and the increase in emulsification temperature are both conducive to improving the emulsification rate. These research results provide critical insights for pipeline design and pump selection in oilfield production processes.

1. Introduction

Carbon Capture, Utilization and Storage (CCUS) technology is recognized as one of the key strategies to mitigate global climate change [1,2]. Since the conditions required for oil and gas and CO2 storage are very similar, CO2 storage and enhanced oil recovery (CCUS-EOR), as a technology that can both improve oil recovery and achieve CO2 emission reduction, has broad prospects and can simultaneously provide social and economic benefits [3,4].
EOR (enhanced oil recovery) refers to a series of technical measures taken to further improve the oil recovery factor of oil reservoirs after primary and secondary oil recovery methods [5,6,7]. Primary oil recovery usually relies on natural driving energy, such as the pressure of the reservoir, gas cap, dissolved gas, water flooding. Secondary oil recovery mainly maintains or increases reservoir pressure through water flooding or gas flooding to promote more crude oil to be produced. However, even with the above methods, a substantial amount of crude oil still remains underground and cannot be extracted. Among them, CO2 flooding (CO2-EOR) is a technology to improve oil recovery. The mechanisms by which CO2 operates in the reservoir include reducing interfacial tension through oil–gas mass transfer and expanding crude oil while reducing its viscosity through gas dissolution, thereby increasing crude oil production. This technology not only enhances oil extraction efficiency but also effectively stores CO2 and reduces greenhouse gas emissions, offering significant environmental benefits [8,9].
CO2-EOR is mainly implemented in North American countries such as the United States and Canada. At present, there is a significant gap between China and the United States in terms of the application level, application scale, and production effect of CO2-EOR technology. Throughout the lifecycle of a CCUS-EOR project, the economic feasibility exhibits significant differences at various stages. In the initial phase of the project, the economic feasibility is relatively low due to the maturity of the technology and the underdeveloped carbon trading market mechanisms. As technology continues to evolve and the effectiveness of enhanced oil recovery improves, oil production steadily increases, and the benefits from carbon emission reductions begin to rise. With the long-term optimization of costs across various stages, revenue from oil production maintains stable growth, thereby enhancing the project’s economic feasibility and potential for sustainable development. Since the 1980s, the industrial scale of CO2-EOR in the United States has expanded rapidly. In the 1980s, the oil production in the United States reached 1 million tons. In the 1990s, its output exceeded 10 million tons. Subsequently, it has always reached 15 million tons and remained stable. The relevant technical industries and supporting industrial systems in the United States reached maturity in the 1990s [10,11]. However, EOR experimental research began in China only in the 1960s. CO2-EOR is still under development and refinement, facing several technical challenges. There is a lack of necessary separation and recovery facilities, and the construction of infrastructure such as SC-CO2 supply pipelines is lagging behind, relatively. At present, China’s CO2-EOR technology is in the initial stage of commercial application [12]. The differences in geology and oil reservoirs between China and the United States result in a substantial gap in EOR production. In China’s EOR projects, the reservoirs are primarily continental sedimentary formations, which have lower recovery rates compared to marine sedimentary reservoirs. In the United States, there are extensive carbonate reservoirs and other geological conditions suitable for CO2-EOR. The relatively favorable reservoir conditions, such as permeability and porosity, facilitate the implementation of CO2-EOR technology. Moreover, the oil layers are relatively thin, with strong heterogeneity and poor continuity. As a result, extraction is difficult. Currently, the annual output only reaches 0.2 million tons.
CO2 geological storage technology encompasses the entire process of separating CO2 from various industries, compressing it to a supercritical state, and then injecting it into deep saline aquifers, difficult-to-exploit oil and gas reservoirs, or abandoned oil and gas fields through pipelines [13,14,15,16]. This technology can also be used as a displacement agent to enhance production while achieving the long-term isolation of CO2 from the atmosphere [17]. CO2 geological storage is the primary means of carbon storage [18,19]. The global theoretical storage capacity of terrestrial CO2 is estimated to reach 6 to 42 trillion tons, while the storage capacity of seabed CO2 can reach 2 to 13 trillion tons [20,21]. CO2 geological storage originated from the use of supercritical CO2 (SC-CO2) by the United States to enhance oil recovery, known as EOR technology [22]. During the oilfield development process, CO2 is injected, with a portion dissolving or diffusing into crude oil and formation water, while another portion reacts with rocks and is deposited in the oil reservoir [23]. As shown in Figure 1, the storage mechanisms of CO2 in enhanced oil production technology primarily include structural storage, dissolution storage, residual storage, and mineralization storage. Upon injection, CO2 undergoes convection due to pressure differences and buoyancy, migrating upward until it is trapped by the caprock. Crude oil, with its high viscosity, can dissolve a significant amount of SC-CO2. As CO2 dissolves, the molecular spacing of the CO2–crude oil mixture increases, the interaction forces between molecules decrease, and both viscosity and density decrease. This process facilitates the storage of large amounts of CO2 while improving crude oil extraction efficiency. When SC-CO2 is injected into the formation, it quickly disrupts the dynamic balance of crude oil and water, becoming miscible with crude oil and occupying pore space for pore storage. Additionally, when CO2 contacts groundwater, it participates in geochemical reactions with saline water and minerals in surrounding rocks, generating new minerals and achieving partial mineral storage.
There are consistencies and differences between CO2 geological storage in oil reservoirs and CO2-EOR technology. Both require injecting CO2 into the oil reservoir layer. However, the former focuses on the injection amount and storage volume of CO2, while the latter focuses on improving the oil and gas recovery factor. The concept of realizing carbon storage simultaneously in the process of crude oil exploitation using CO2 is called CCUS-EOR. The development potential of CO2-EOR is substantial, with the integration of EOR and geological carbon storage emerging as a future trend. As artificial intelligence and machine learning become deeply embedded in reservoir simulation and dynamic monitoring, technological advancements are shifting CO2-EOR from an experience-driven to a data-driven approach [24]. For instance, Wang et al. [25] proposed a framework utilizing sparse link neural networks to estimate the adsorption capacity of shale for CH4/CO2. Huang et al. [26] developed a long short-term memory (LSTM) neural network model that considers gas injection effects for predicting reservoir production dynamics. These technological innovations have enhanced economic benefits, and as CO2-EOR projects scale up, economies of scale are becoming increasingly apparent, effectively reducing unit costs across various stages. Concurrently, the burgeoning carbon market is endowing this technology with new economic value. CO2-EOR demonstrates a unique dual value in the long-term energy transition. With the advancement of global carbon neutrality goals, this technology is not only seen as a means to increase crude oil recovery by injecting industrially emitted CO2 into oilfields but also as a significant pathway for CCUS [27]. The International Energy Agency (IEA) predicts that by 2070, CCUS/CCS could contribute to 15% of global carbon storage needs [12]. The commercialization potential of CO2-EOR is notable, especially in regions rich in oil and gas resources but facing significant emission reduction pressures, such as North America, the Middle East, and Northwest China. In the long term, CO2-EOR may evolve into a “carbon-negative oil recovery” model, serving as an important transitional solution for decarbonizing high-carbon industries.
With the continuous development of CCUS-EOR, the treatment of its subsequent produced fluid has also received increasing attention. The properties of produced fluid from CO2 flooding are different from those of water flooding. The special properties of CO2 and the oil displacement mechanism will theoretically cause the components of the produced fluid to gradually change, the emulsion to be stable, and the difficulty of dehydration treatment to increase [28]. The size and distribution of rock pores determine the flow characteristics of crude oil within them. Smaller pores tend to form more stable emulsions because droplets find it more difficult to coalesce in confined spaces. For example, in tight sandstone reservoirs, the narrow pore throats contribute to the high stability of emulsions formed between crude oil and water [29]. The wettability of the rock surface affects the adhesion of crude oil and water. Hydrophilic rock surfaces facilitate the spreading of water, promoting the formation of water-in-oil emulsions, whereas oleophilic rock surfaces tend to form oil-in-water emulsions. The properties of these different types of emulsions vary significantly, leading to different requirements for subsequent extraction and processing techniques [30].
For oil reservoirs with CO2 flooding, the injection of CO2 will interact with the crude oil in the formation. Under miscible pressure, during the supercritical CO2 flooding process, supercritical CO2 will destroy the solvation structure of crude oil asphaltenes, leading to an enhanced degree of asphaltene aggregation and detachment from the crude oil system and deposition in the formation rock pores, resulting in a reduction in the asphaltene content in the produced fluid. Sun et al. [31] studied the specific changes in waxy crude oil and its emulsion after SC-CO2 flooding. Their research found that the content of heavy components such as asphaltenes, resins, and high-carbon-number hydrocarbons in waxy crude oil increases with the extraction of light components of CO2, which is not conducive to the safe transportation and subsequent dehydration process of produced fluid in CO2 flooding oilfields. Hu et al. [32] measured the rheological properties of Zuata crude oil (and its toluene dilution) when it reaches equilibrium with CO2 at a temperature of 220 bar and 50 °C. They found that the addition of CO2 significantly changes the rheology of crude oil. As the CO2 pressure increases, the viscosity of crude oil first decreases and then increases above a certain threshold pressure. The rheological properties and stability parameters of the produced emulsion from CO2 flooding will have an important impact on the subsequent crude oil treatment and transportation processes and process parameters. At the same time, the exploration of its property change mechanism also has a certain theoretical significance. Therefore, it is very necessary to study the relevant change laws and action mechanisms of the rheology and stability of crude oil and its emulsion in CO2 flooding. In this paper, by simulating the produced crude oil and produced fluid from on-site CO2 flooding, the relative density of the produced fluid from CO2 flooding, the viscosity–temperature characteristics of the emulsion, and the stability of the emulsion are tested, and the laws between dissolved CO2 gas and the stability and rheology of the produced fluid are analyzed.

2. Materials and Methods

2.1. Materials

The crude oil is produced from the oil production area of Changqing oilfield in China. Two samplings were carried out for each of the eight wells, and 10–15 L of produced fluids were obtained for each sampling, resulting in a total of 16 samples. In order to clearly and effectively express the rheological properties of the produced fluids and avoid the consumption of repetitive experiments, based on the basic physical properties of the produced fluids, we selected six samples with a greater degree of characteristic dispersion for subsequent tests. The sample numbers are 1–6, and the well numbers are Well 1–Well 6. Through on-site sampling, the group composition, density, and water content in oil of crude oil are tested to analyze the relationship between dissolved CO2 gas and the composition and physical properties of crude oil.
The group composition test was conducted using chromatography. The working principle of chromatography is based on the differences in solubility (or adsorption) of the substances to be separated between two phases. This technique separates a mixture composed of two or more different compounds (or sometimes ions) through their distribution between the two phases, one of which is fixed while the other is mobile. Depending on the properties of the two phases, various forms of chromatography can be employed. The basic principle of crude oil group composition detection is column chromatography (solid–liquid). The detection results of the group composition content for the six oil samples are presented in Table 1.
The density test was conducted using the oscillating tube method. The principle of the oscillating tube method involves utilizing the oscillation frequency of a glass U-shaped tube triggered by electromagnetism. A magnet is fixed on the U-shaped glass measuring tube, and an oscillator induces its vibration. The vibration period of the glass tube is measured by a vibration sensor. Each U-shaped glass tube has a characteristic frequency or vibrates at its natural frequency. When the glass tube is filled with a substance, its frequency changes; different substances will exhibit different frequency changes. The frequency is a function of the mass of the substance contained in the tube. As the mass of a substance increases, its frequency decreases, resulting in an increase in the vibration period T. During measurement, specific substances are selected as standard substances. After measuring the frequency, the density of the measured substance is calculated based on the difference in oscillation frequency between the measured substance and the standard substance. The density test results of the six oil samples at 20 °C are presented in Table 2.
Water in crude oil primarily exists in three forms: suspended water, free water, and dissolved water. Laboratory methods for determining the water content of crude oil typically include the sedimentation method, electric dehydration method, centrifugation method, and distillation method. Among these, the distillation method is the standard and universal technique for determining the water content of exported crude oil. The principle of the distillation method involves mixing and heating the crude oil sample with a solvent that is insoluble in water under reflux conditions. The water in the sample is distilled simultaneously, and the condensed solvent and water are continuously separated in the receiver. The water settles in the graduated tube of the receiver, while the solvent returns to the distillation flask. Based on the amount of sample used and the volume of water collected in the receiver, the percentage of water in the sample is calculated. The distillation method is characterized by a wide measurement range, capable of detecting water content above one thousandth. It is simple to operate, low in cost, relatively safe, and serves as the primary method for testing the water content of crude oil. The test results of the water content of the six oil samples are presented in Table 3.

2.2. Preparation of Simulated Fluid

Simulation of dissolved CO2 in produced crude oil: Weigh 60 mL of crude oil and transfer it into a visible high-pressure container. Connect the container to the outlet of the pressure-reducing valve of the CO2 gas cylinder. Adjust the pressure at the outlet of the pressure-reducing valve to the required test pressure. Maintain this setup for 9–10 min at a specified temperature. Afterward, close the gas cylinder and the inlet valve of the high-pressure container. Finally, place the container in a water bath set to the desired temperature.
Simulation of produced fluid from CO2 flooding: Based on the water content from the sampling, weigh a specific amount of oil and water in the sampling bucket. Use a homogenizer in the laboratory, setting the homogenization speed to 10,000 r/min. Rotate for 30 min to ensure that the oil and water phases are evenly mixed.

2.3. Viscosity–Temperature Properties and Yield Point Measurement

First, the crude oil or emulsion should be pretreated by placing the sample in a constant temperature bath and heating it in a closed state to 80 °C. After maintaining this temperature for 1 h, the sample should be removed and allowed to cool naturally to room temperature. It should then be stored in the dark for 48 h before use. For crude oil or emulsion that is already in a flowing state at room temperature, the heating treatment can be omitted. The pressurized testing device of the Haake rheometer is utilized for the measurements. Connectors are processed to establish a connection between the rheometer and the high-pressure CO2 gas cylinder. By adjusting the pressure at the outlet of the pressure-reducing valve of the gas cylinder, different pressures in the pressurized module of the rheometer can be achieved. Place the sample in the high-pressure module of the rheometer, and control the pressure of the high-pressure rheometer to remain at the experimental pressure using the pressure-reducing valve at the outlet of the gas storage tank. If the sample exhibits non-Newtonian fluid characteristics, it needs to be reheated in the rheometer to the initial heat treatment temperature to completely melt any wax crystals. The sample is then heated to the test temperature and maintained at this constant temperature for 3–5 min. The cooling rate should be controlled at 0.5 °C/min to 1 °C/min until it reaches the desired measurement temperature. Finally, set the shear rate to measure the viscosity and yield value. During the measurement process, the sample pressure remains unchanged. After measuring one pressure point, the sample is replaced, and another pressure point is tested.

2.4. Emulsion Stability Test

First, the emulsion stability was tested. Due to significant stratification in the crude oil emulsion produced from the oilfield, the static stability of the emulsion is generally considered poor, with stratification occurring in a relatively short time. In this study, a dynamic stability test method that better characterizes field applications was employed to assess the stability of the formed emulsion. The speed of the digital electric stirrer was controlled at 150 r/min to simulate dynamic shear with a pipe flow velocity of 1.8 m/s. Under a constant temperature of 30 °C, the emulsion was continuously stirred, and the apparent viscosity was measured every 0.5 h for a total duration of 3 h.
Subsequently, the relationship between dissolved CO2 and the stability and rheology of the produced fluid was examined. In the HAAKE rheometer, the produced fluid was saturated with CO2 under specific conditions (0.5 MPa and 30 °C). Utilizing the magnetic stirring function of the HAAKE rheometer, a shear rate of 170 s−1 was set to continuously test the viscosity of the produced fluid with dissolved CO2. The fluid was sheared continuously for 3 h, and the changes in viscosity were recorded to create a change curve. The viscosity changes in the produced fluid with dissolved CO2 were then analyzed and compared with the viscosity of the produced fluid without dissolved CO2.

2.5. Demulsification Test

A total of three demulsifiers were collected for this project: Hexadecyl trimethyl ammonium chloride (HTMAC), TPR-03, and RKP-1. Experimental research on demulsification efficiency was conducted using sample 4, focusing on the types of demulsifiers, their dosages, and demulsification temperatures. The demulsifier screening scheme for this project is presented in Table 4. Under temperature conditions of 35 °C, 40 °C, 45 °C, 50 °C, 55 °C, and 60 °C, the demulsification effects of demulsifier concentrations of 50 mg/L, 100 mg/L, 110 mg/L, 120 mg/L, 130 mg/L, 140 mg/L, 150 mg/L, and 200 mg/L were measured. The total sedimentation time was set to 60 min. During the experiment, the amount of dehydrated water was observed at 20, 25, 30, 35, 40, 50, and 60 min. The demulsification efficiency and water content at different stages were calculated. Based on the experimental results, the optimal demulsifier dosage and temperature were determined.

3. Results and Discussion

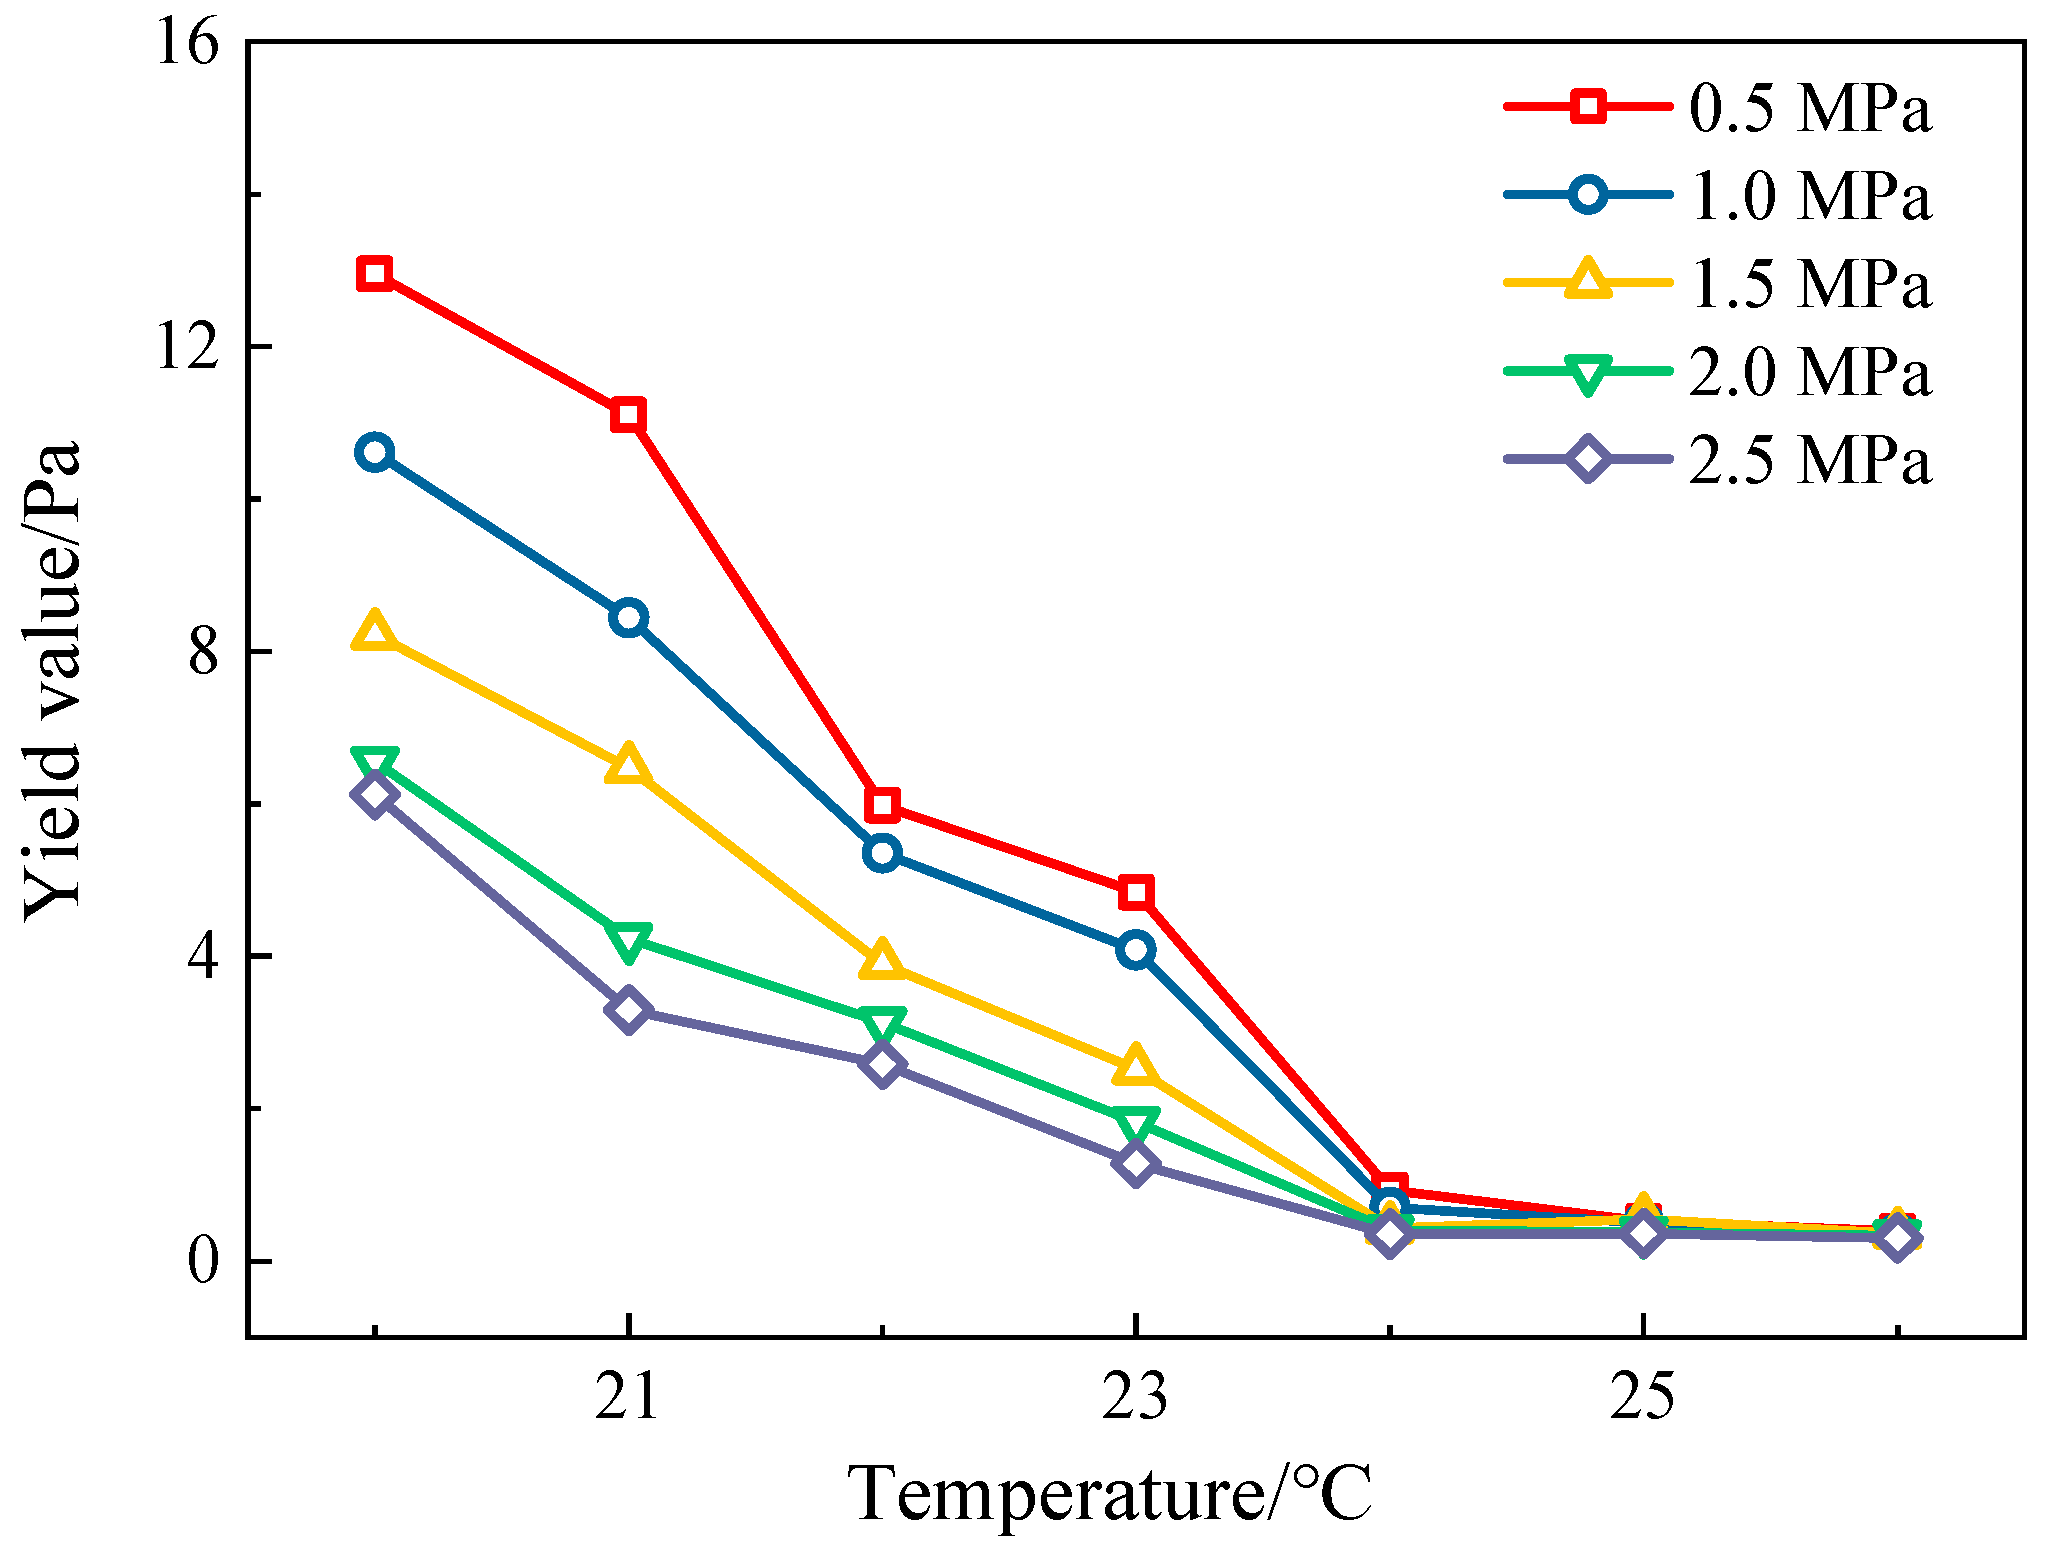
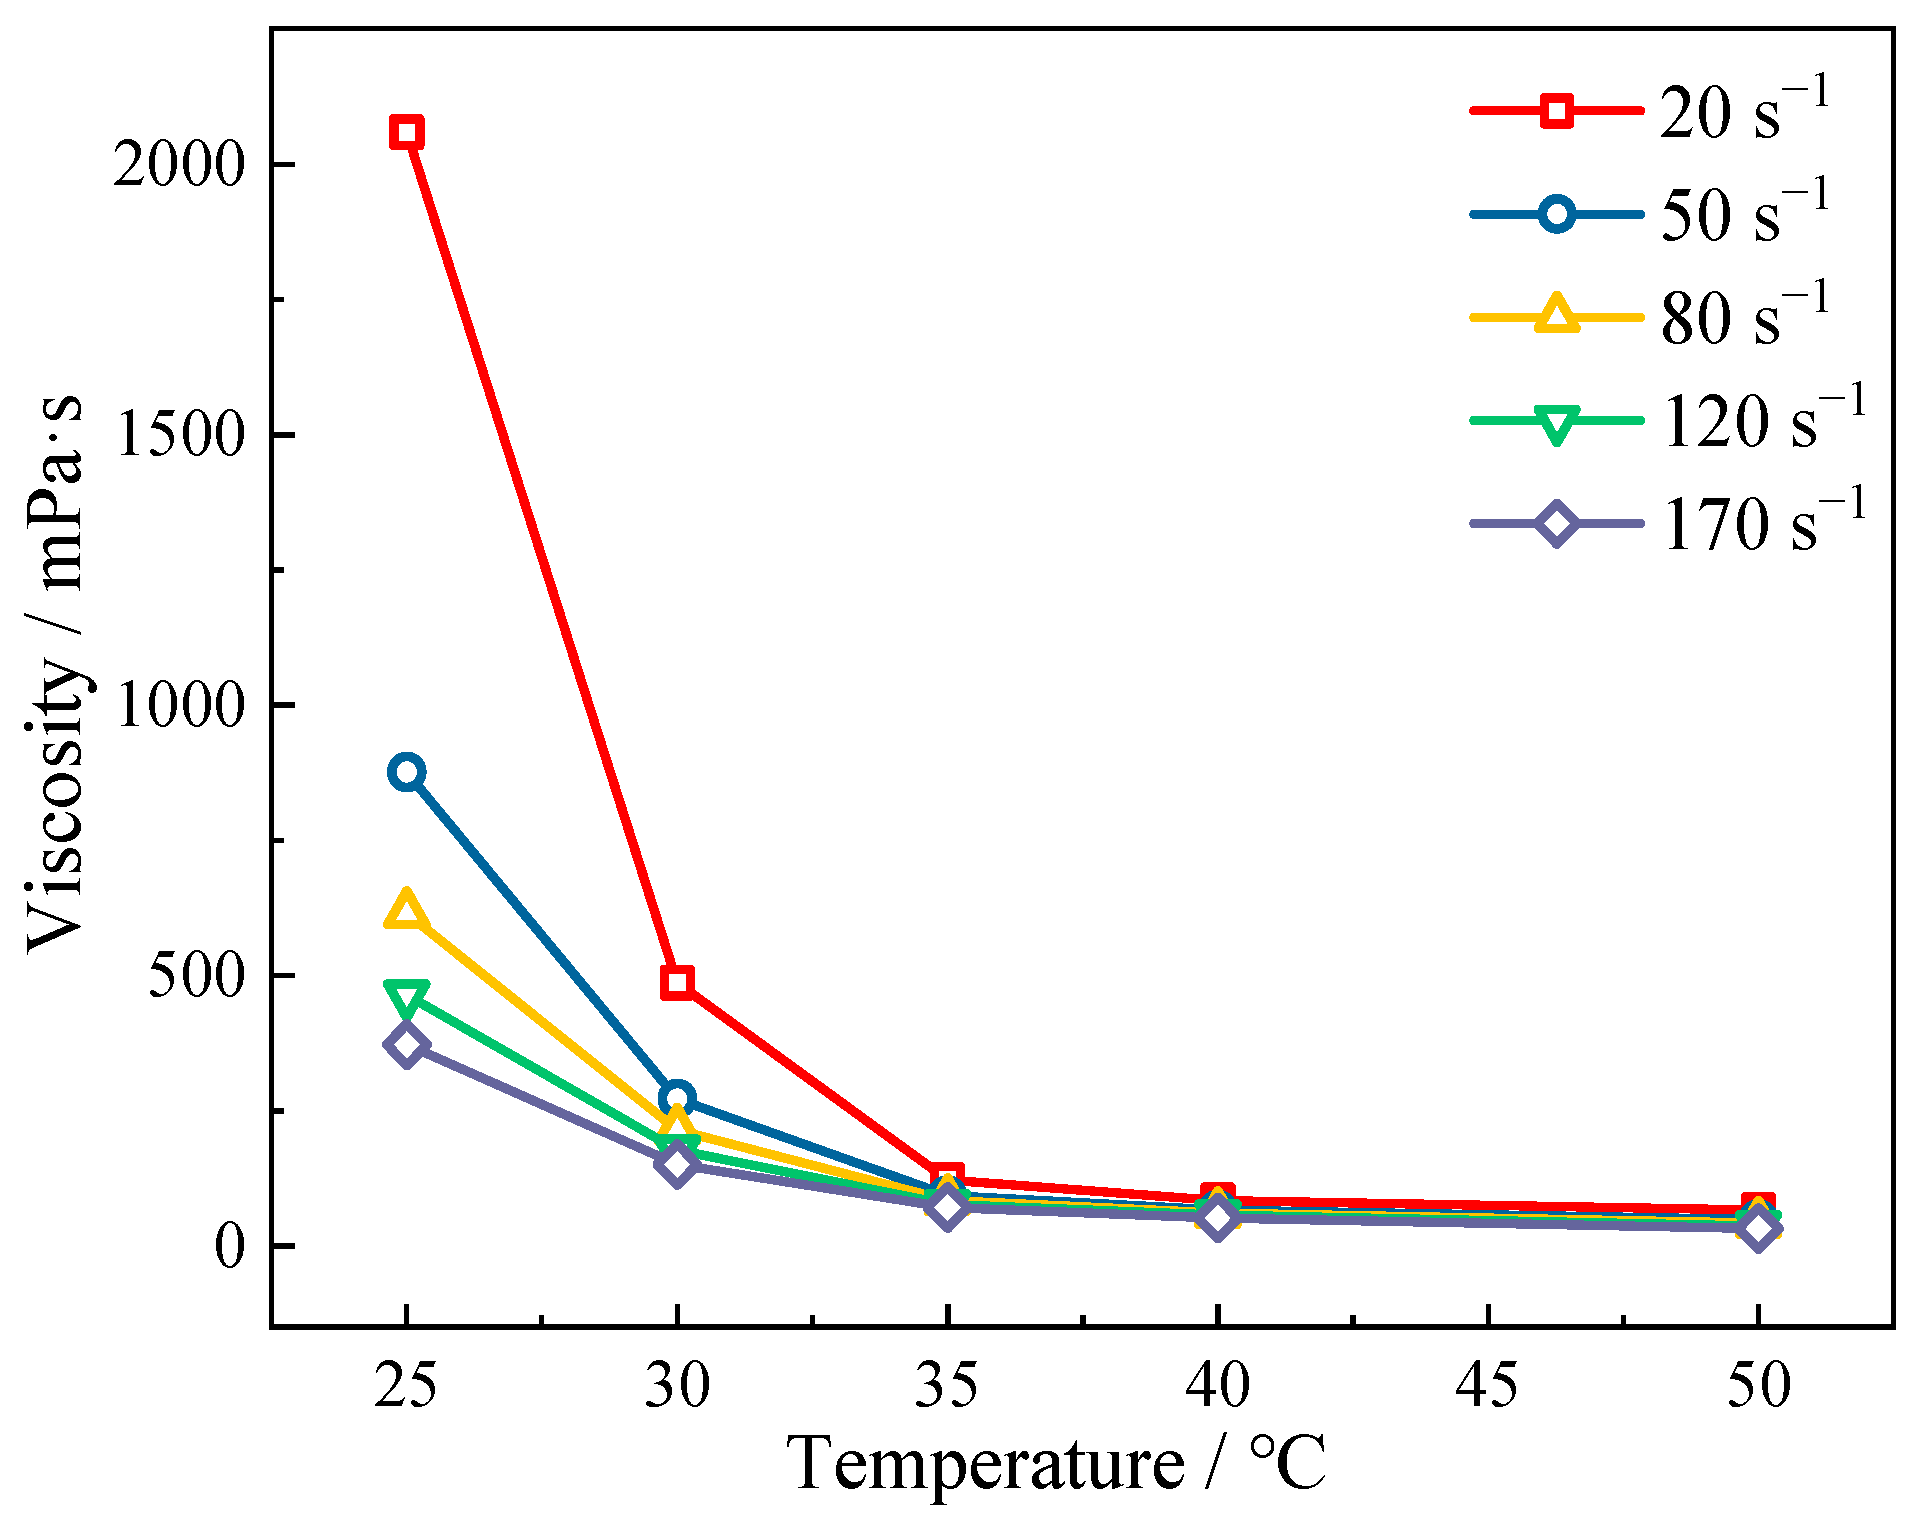
3.1. Viscosity–Temperature Characteristics and Pressure-Dependent Yield Value of CO2-Dissolved Crude Oil Under Pressure

When CO2 dissolves in crude oil, the CO2 molecules disperse among the crude oil molecules. The insertion of CO2 disrupts the van der Waals forces between long-chain alkane molecules, allowing them to slide more easily relative to one another, which macroscopically manifests as a reduction in the viscosity of the crude oil. Under high-pressure conditions, the high diffusivity of CO2 further enhances this effect. Additionally, the dissolution of CO2 in crude oil causes the oil to expand in volume. The increased intermolecular spacing reduces flow resistance, leading to a decrease in viscosity. At a certain pressure, the amount of dissolved CO2 increases, resulting in greater oil expansion and a more pronounced reduction in viscosity. CO2 can also reduce the interfacial tension between crude oil and other substances, affecting its rheological behavior and thereby influencing the yield value. As pressure and temperature increase, the solubility of CO2 in crude oil changes. Therefore, it is necessary to study the viscosity–temperature characteristics and pressure dependence of crude oil with dissolved CO2.
Taking sample 1 as an example, we analyze the pressure-dependent viscosity–temperature characteristics and the pressure-dependent yield value of crude oil with dissolved CO2 gas.
Figure 2 illustrates the viscosity–temperature curves of the dissolved CO2 crude oil of sample 1 at different pressures and shear rates. It is evident that as the temperature of the dissolved CO2 crude oil increases, the viscosity decreases, exhibiting shear thinning characteristics. Dissolved CO2 crude oil behaves as a non-Newtonian fluid and demonstrates the characteristic of shear thinning. The relationship between the viscosity of most non-Newtonian liquids and temperature can be expressed using the Arrhenius equation:
η = A e E f R g T
where A is a constant; Ef is the fluid activation energy, J/mol; Rg is the real gas constant, J/(mol·K); and T is the temperature.
As indicated by the above formula, an increase in temperature results in a decrease in fluid viscosity. Therefore, as the temperature rises, the viscosity of dissolved CO2 crude oil decreases. Additionally, as shown in Figure 3, when the temperature is 25 °C, the viscosity is significantly higher than at other temperatures. This is primarily because 25 °C is close to the pour point of dissolved-gas crude oil. Near the pour point, the dissolved-gas crude oil exhibits poor fluidity and behaves as a viscous, non-flowing substance, leading to a relatively high viscosity measurement. Considering the sample temperature during on-site sampling (generally above 40 °C) and knowing that the shear rate of the mixed oil sample in the pipeline typically ranges from 80 to 170 s−1, for sample 1, the viscosity value falls within the range of 10 to 19 mPa·s under the tested pressure conditions. These data provide a valuable reference for designing the pipeline pressure drop, aiding in the selection of an appropriate power pump.
Figure 3 illustrates the viscosity curve of dissolved CO2 in crude oil at a constant temperature as a function of pressure. It is evident that as pressure increases, the viscosity of dissolved CO2 crude oil decreases. Based on earlier tests of CO2 solubility in crude oil, it is known that as pressure increases, the solubility of CO2 in crude oil also increases. Given that the viscosity of CO2 is relatively low, the increase in CO2 concentration contributes to a reduction in the viscosity of dissolved CO2 crude oil.
Figure 4 illustrates the curve of the pressure-dependent yield value of sample 1, a dissolved-gas crude oil, as it varies with temperature under different pressures. It is evident that as both temperature and pressure increase, the pressure-dependent yield value of the dissolved-gas crude oil decreases. Notably, when the temperature exceeds 24 °C, the yield stress approaches zero, indicating that the dissolved-gas crude oil exhibits good fluidity. This behavior can be attributed to two main factors. First, temperature significantly affects the properties of non-Newtonian fluids. Generally, for non-Newtonian fluids, an increase in temperature enhances fluidity and results in a corresponding decrease in yield value. Second, based on previous knowledge regarding the solubility of CO2, an increase in pressure enhances CO2 solubility, effectively diluting the crude oil and thereby reducing the pressure-dependent yield value of the dissolved-gas crude oil.

3.2. The Law Between the Stability and Rheology of CO2-Dissolved Gas and Produced Fluid

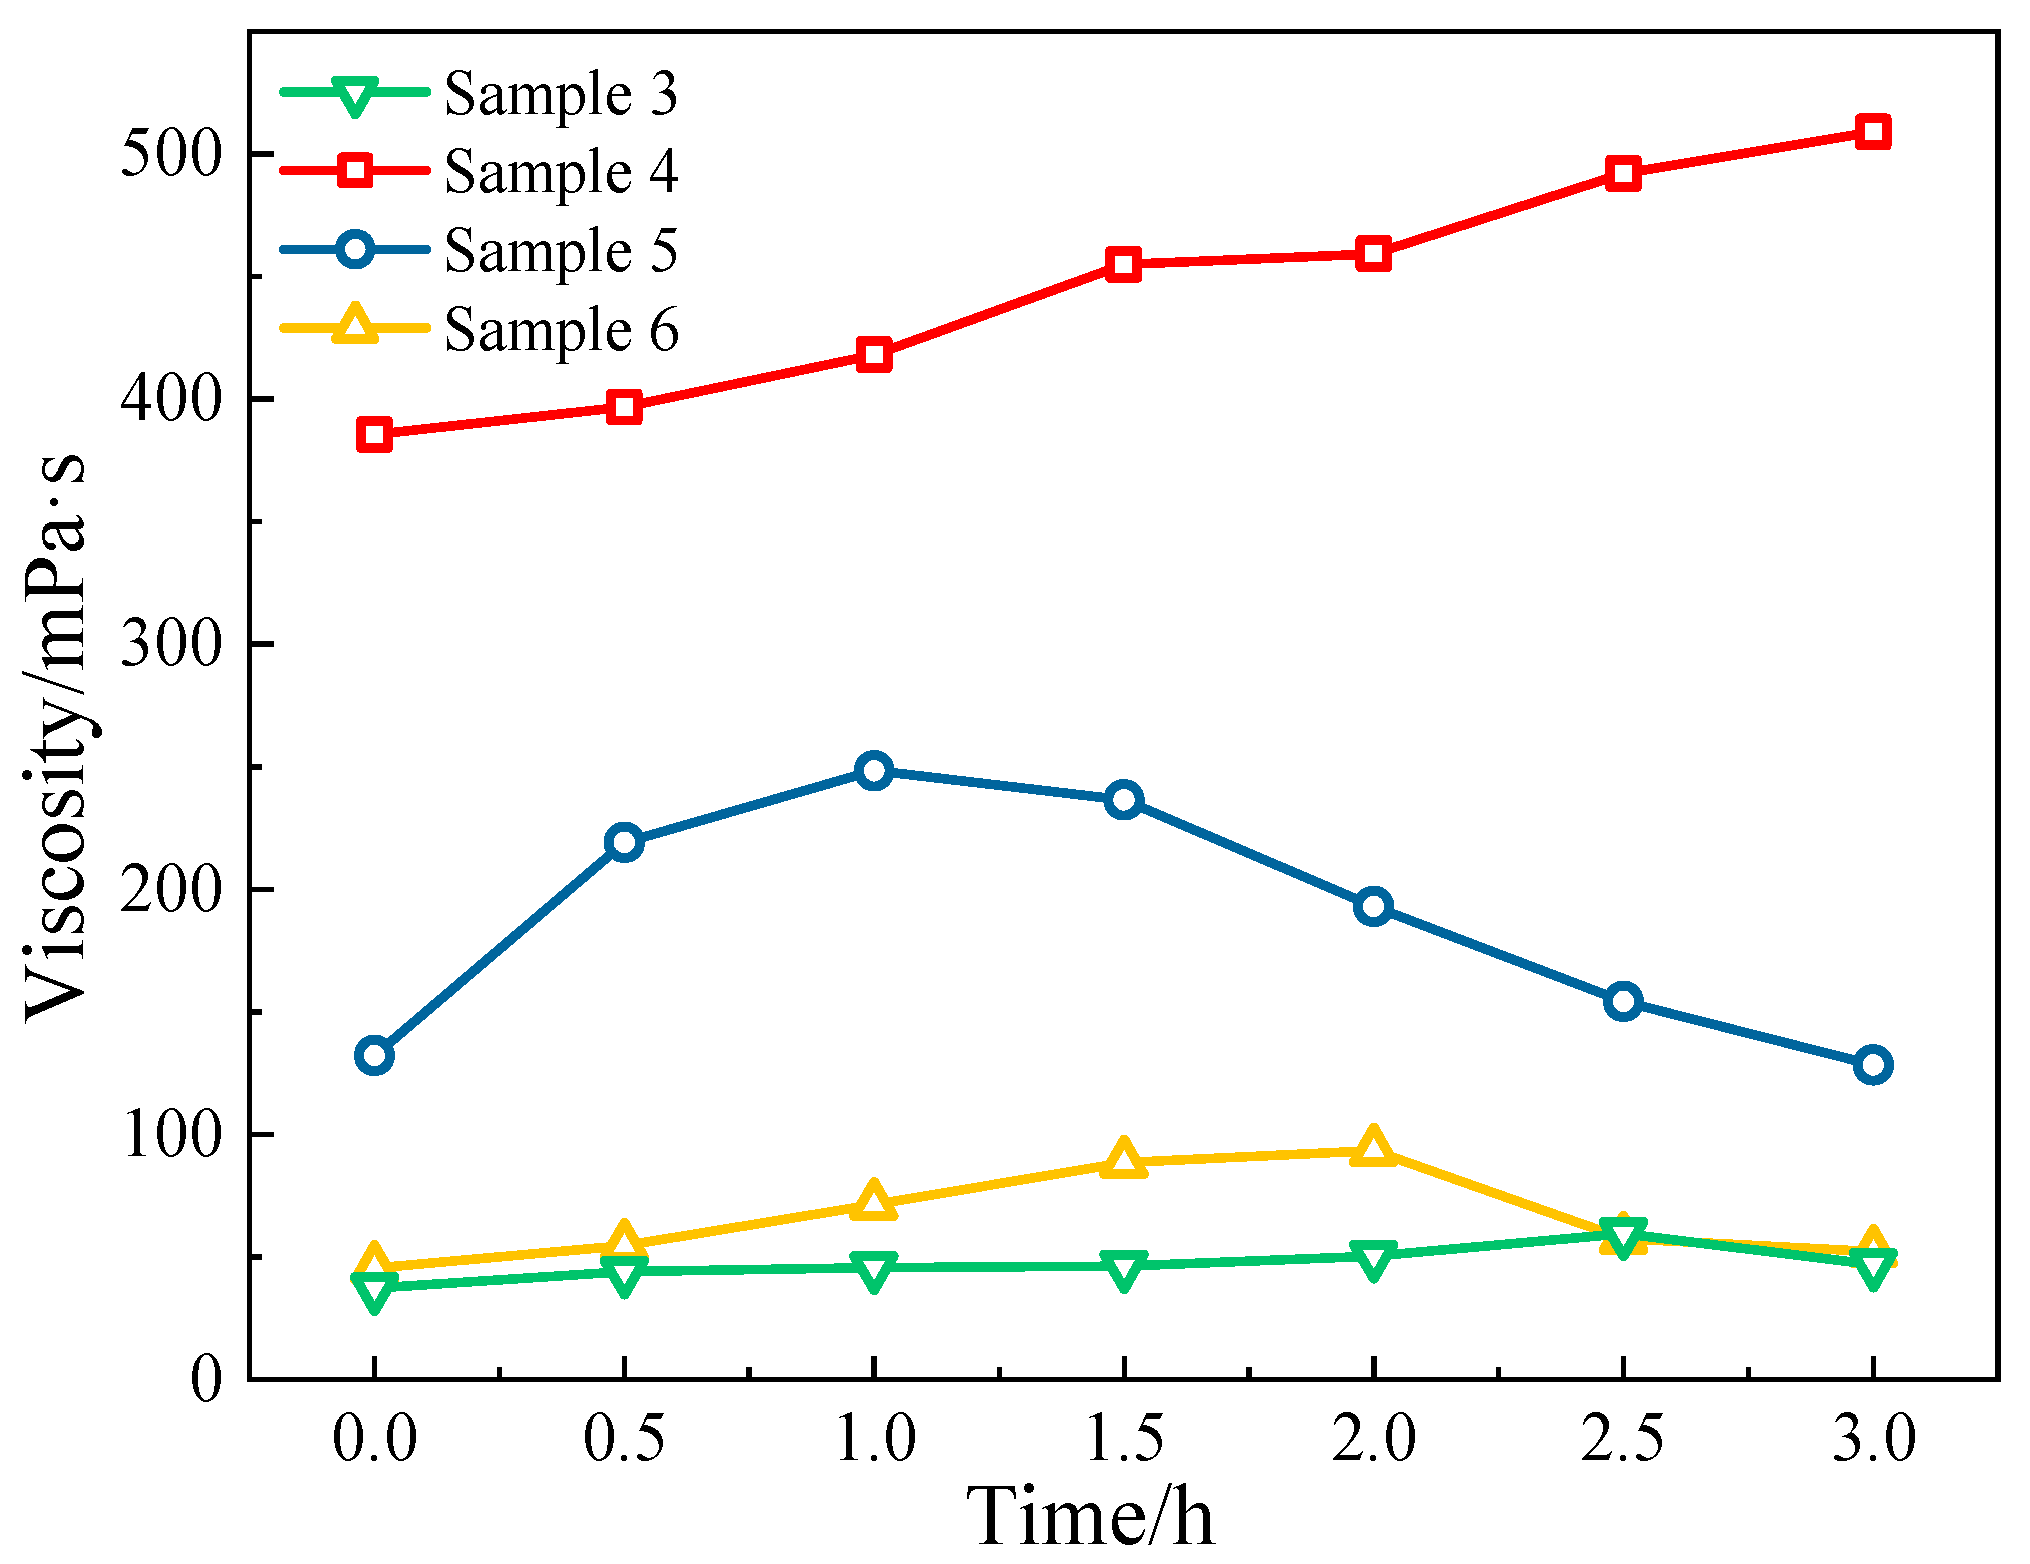
3.2.1. Viscosity–Temperature Characteristics and Stability of Emulsion

The dissolution of CO2 may alter the solubility of emulsifiers in the oil phase or water phase. If the solubility of the emulsifier in the oil phase increases, more emulsifier will enter the oil phase, reducing the relative amount in the water phase. This can lead to decreased stability of water-in-oil emulsions, affecting the viscosity and stability of the emulsion. At different temperatures and pressures, changes in the solubility of CO2 can further influence the solubility equilibrium of the emulsifier, thereby impacting the stability of the emulsion.
Taking sample 2 as an example, we analyze the viscosity–temperature characteristics of the emulsion. Figure 5 illustrates the viscosity–temperature curve of the sample 2 emulsion at different shear rates. It is evident that as the temperature increases, the viscosity of the emulsion decreases, demonstrating the non-Newtonian characteristic of shear thinning. According to the Arrhenius relationship (Equation (1)) between the viscosity and temperature of non-Newtonian liquids, the viscosity of the emulsion decreases with rising temperature. Considering the sample temperature during on-site sampling (generally above 40 °C) and knowing that the shear rate of the flowing emulsion in the pipeline typically ranges from 80 to 170 s−1, the viscosity value for sample 2 falls within the range of 32 to 60 mPa·s across the tested pressure range. These data provide a valuable reference for designing the pipeline pressure drop for Well 2, aiding in the selection of an appropriate power pump.
As shown in Figure 6, the curve illustrates the viscosity of the oil–water emulsion produced from Wells 3 to 6 as a function of shear time. For the emulsion from sample 3, it can be observed that as shear time increases, the viscosity of the emulsion also increases, indicating an upward trend in emulsion stability. In contrast, for the emulsions from the other wells, the stability initially increases with shear time but subsequently decreases.

3.2.2. The Relationship Between the Stability and Rheology of CO2-Dissolved Gas and Produced Fluid

Upon the dissolution of CO2, the surface properties of the internal-phase droplets in the emulsion change, altering the interactions between droplets. In a previously stable emulsion, droplets remain relatively stable and dispersed due to the action of emulsifiers. However, the presence of CO2 may reduce the repulsive forces between droplets, making them more prone to aggregation. This leads to changes in the microstructure of the emulsion, which macroscopically manifests as changes in viscosity. Under shear forces, these changes in aggregation and dispersion become more pronounced, affecting the rheological properties of the emulsion.
Figure 7 illustrates the change in viscosity of the dissolved CO2 emulsion of sample 5 with shear time. After the dissolution of CO2, the viscosity generally decreases. As shown in Figure 7, with the change in shear time, the viscosity of the dissolved CO2 emulsion exhibits a decreasing trend. Compared to the viscosity of the emulsion without dissolved CO2, it is evident that the stability deteriorates over time after CO2 dissolution, resulting in a phenomenon similar to the stratification of oil, gas, and water. Figure 8 indicates that sample 6 also shows similar test results. From the above tests, it can be concluded that the influence of dissolved CO2 gas on the rheology of the produced fluid is twofold: it reduces the viscosity of the produced fluid, and as shear time increases, the viscosity continues to decrease. Regarding the stability of the produced fluid, the dissolved CO2 gas exacerbates the oil–water separation phenomenon and has a detrimental effect on the stability of the emulsion.

3.3. Demulsifier Screening and Demulsification Effect

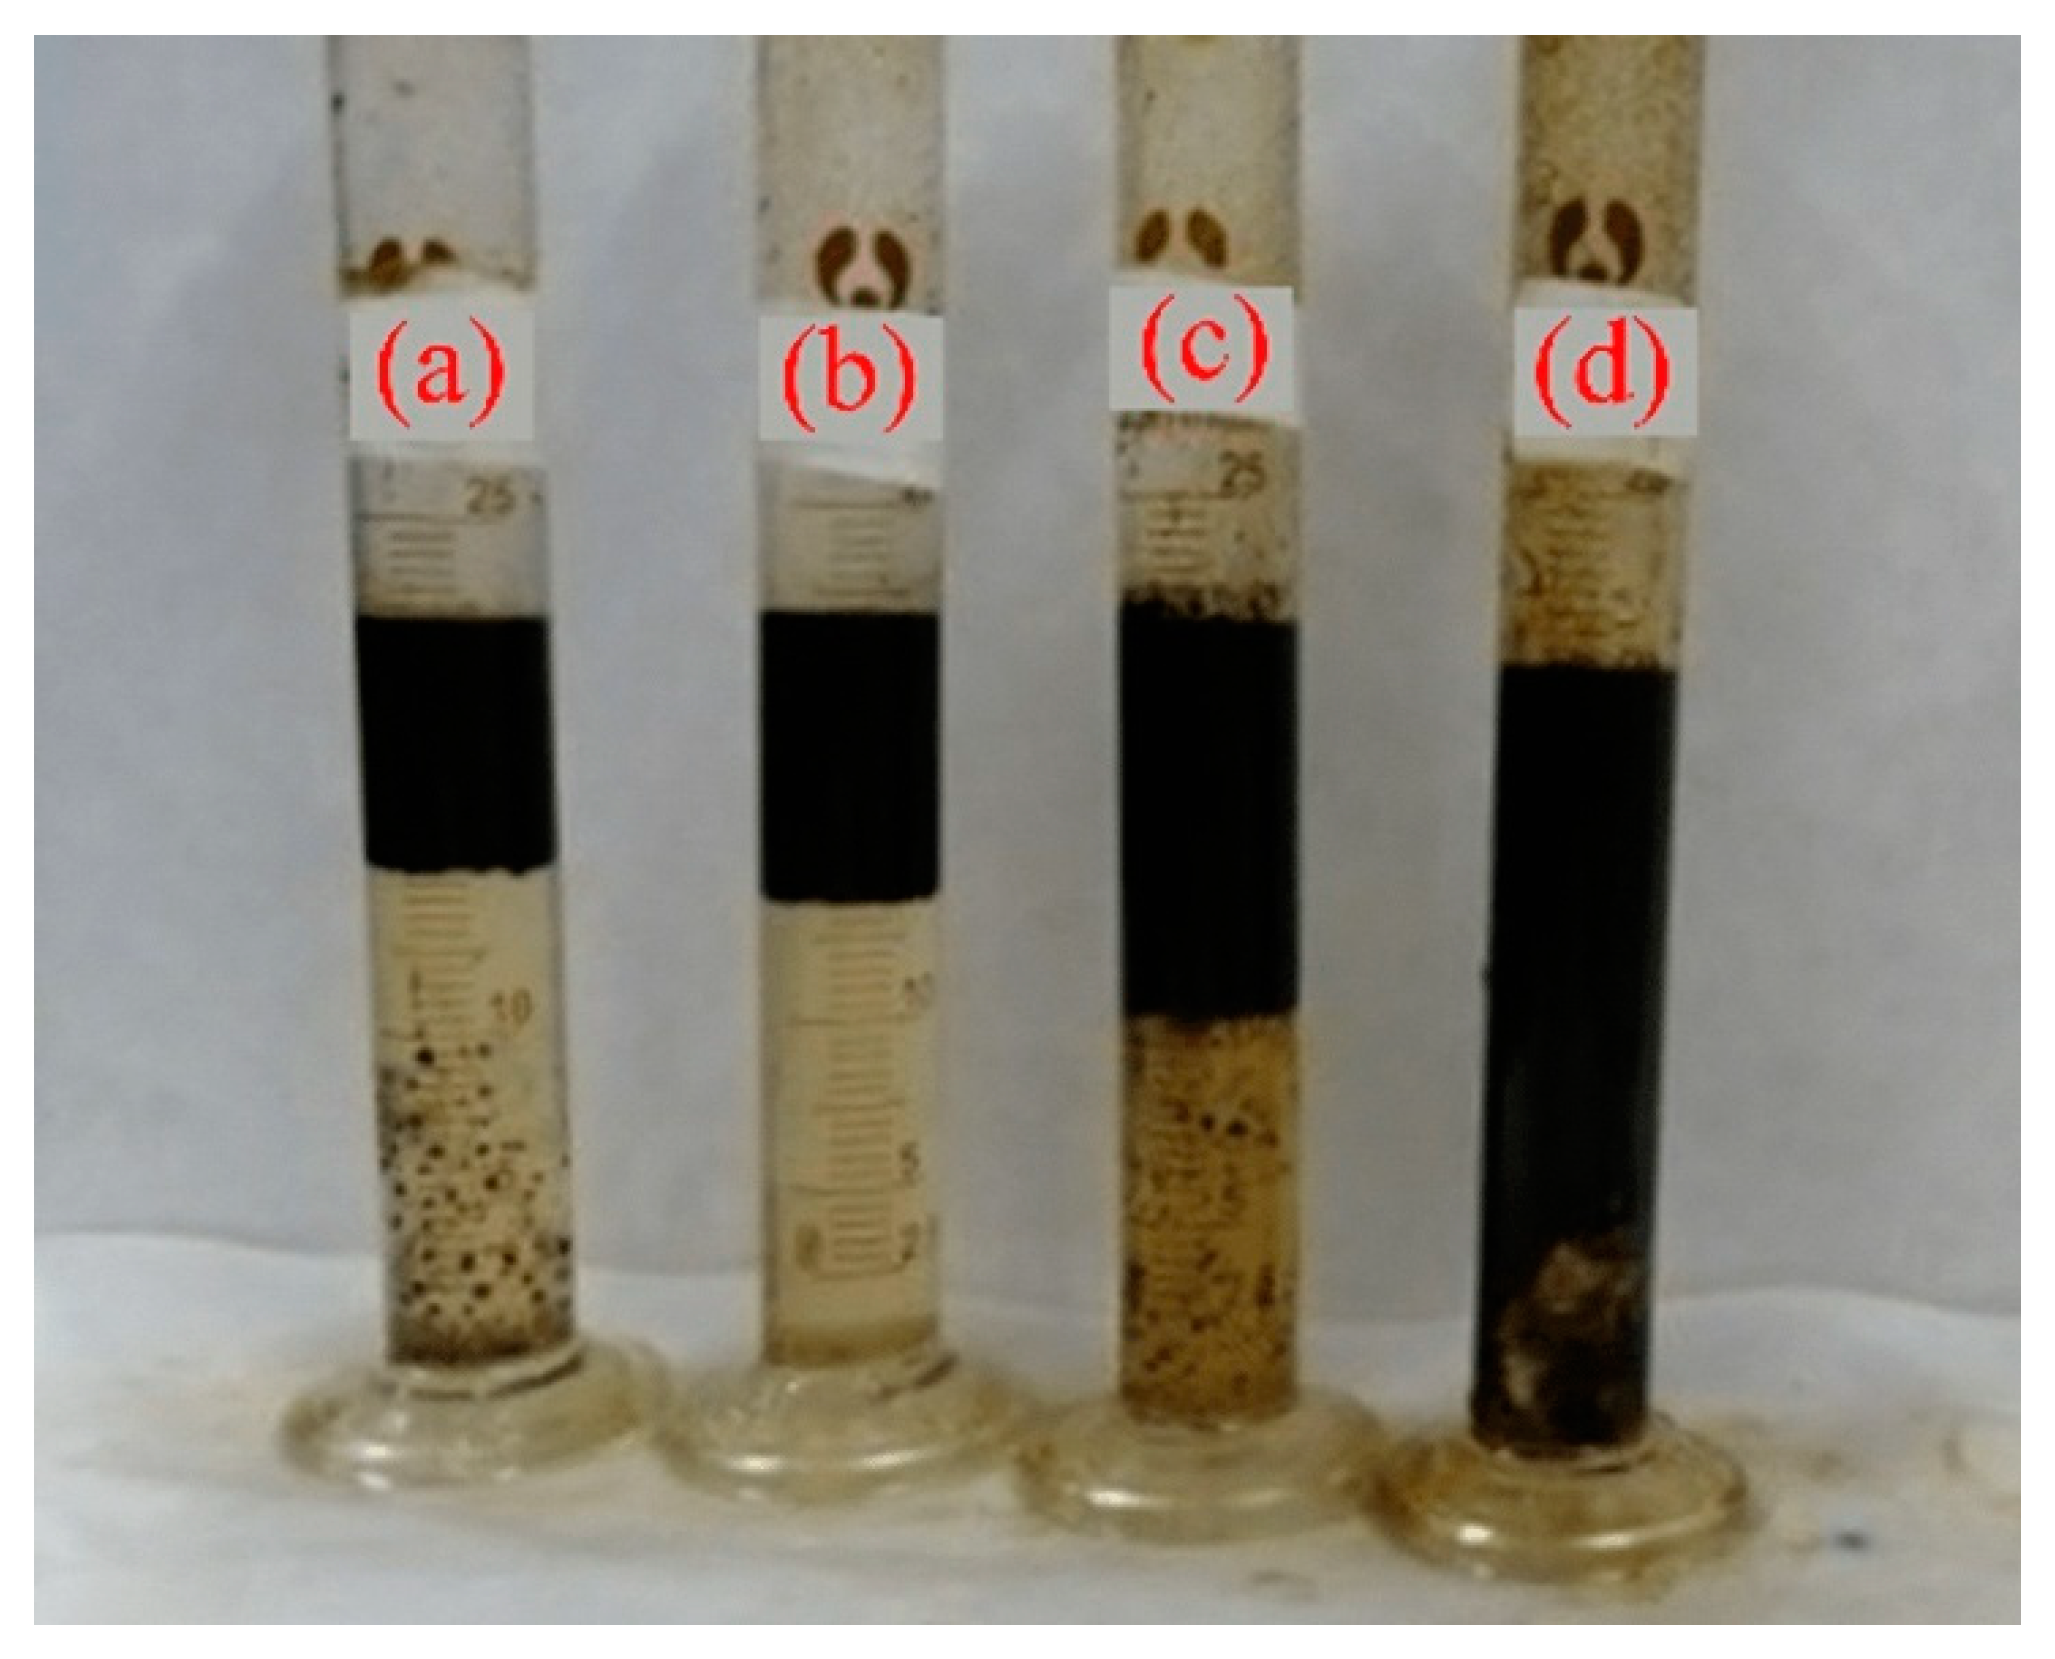
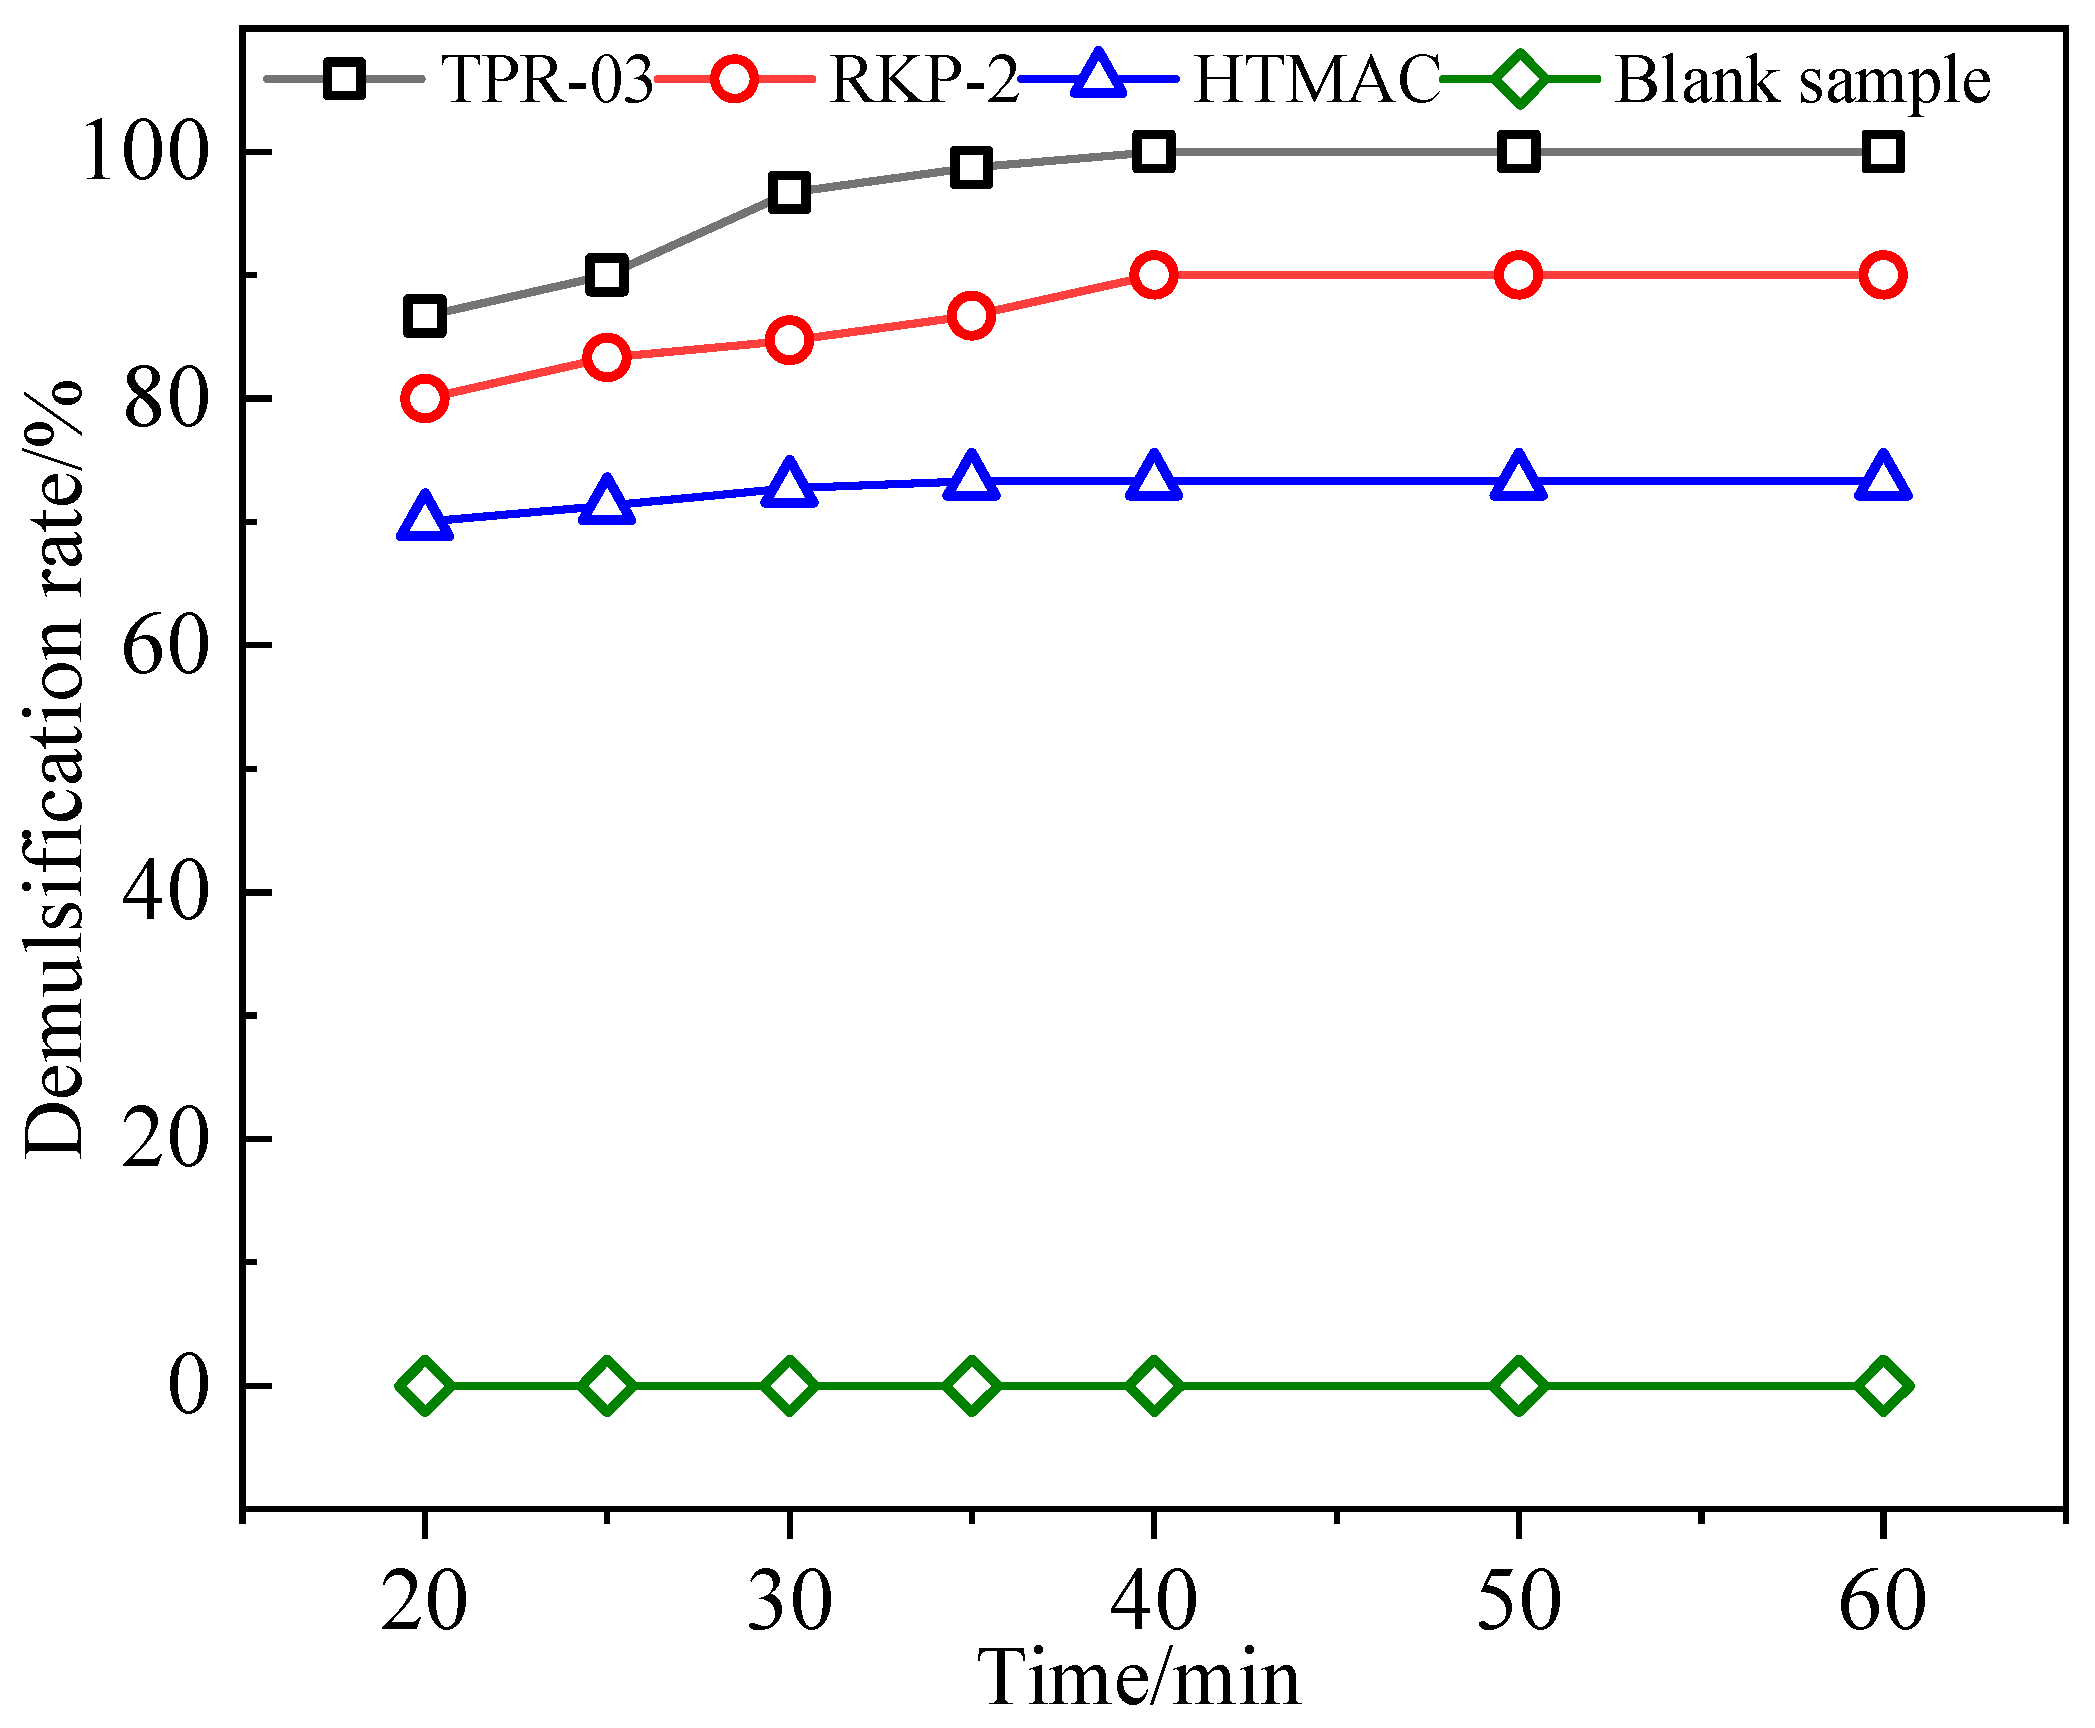
3.3.1. Selection of Demulsifiers

The demulsification efficiency refers to the ratio of the amount of water separated through demulsification to the initial water content of the crude oil emulsion. The demulsification efficiency is calculated using the following formula:
D E = V V o × 100 %
where Vo is the water content of the initial crude oil emulsion, %; and V is the amount of water separated by demulsification, %.
The water content of crude oil after demulsification is calculated by the following formula:
η w = V o V 1 V t V 1 × 100 %
where Vo is the water content of the initial crude oil emulsion, %; V1 is the amount of water finally separated by demulsification, %; and Vt is the total amount of crude oil emulsion, %.
The demulsification temperature was set at 50 °C, with a sedimentation time of 60 min and a demulsifier concentration of 150 mg/L. The demulsification effects at different times are illustrated in Figure 9, while the demulsification efficiency curve is presented in Figure 10. It is evident that the demulsification effects of the three demulsifiers vary significantly. HTMAC exhibits a poor demulsification effect on the crude oil emulsion of sample 4. In contrast, the demulsification effects of RKP-2 and TPR-03 are relatively favorable. Table 5 is the evaluation of demulsifier demulsification effect. Notably, the final demulsification efficiency of the TPR-03 demulsifier is 100%, indicating that TPR-03 has the best demulsification effect on the crude oil emulsion of sample 4.

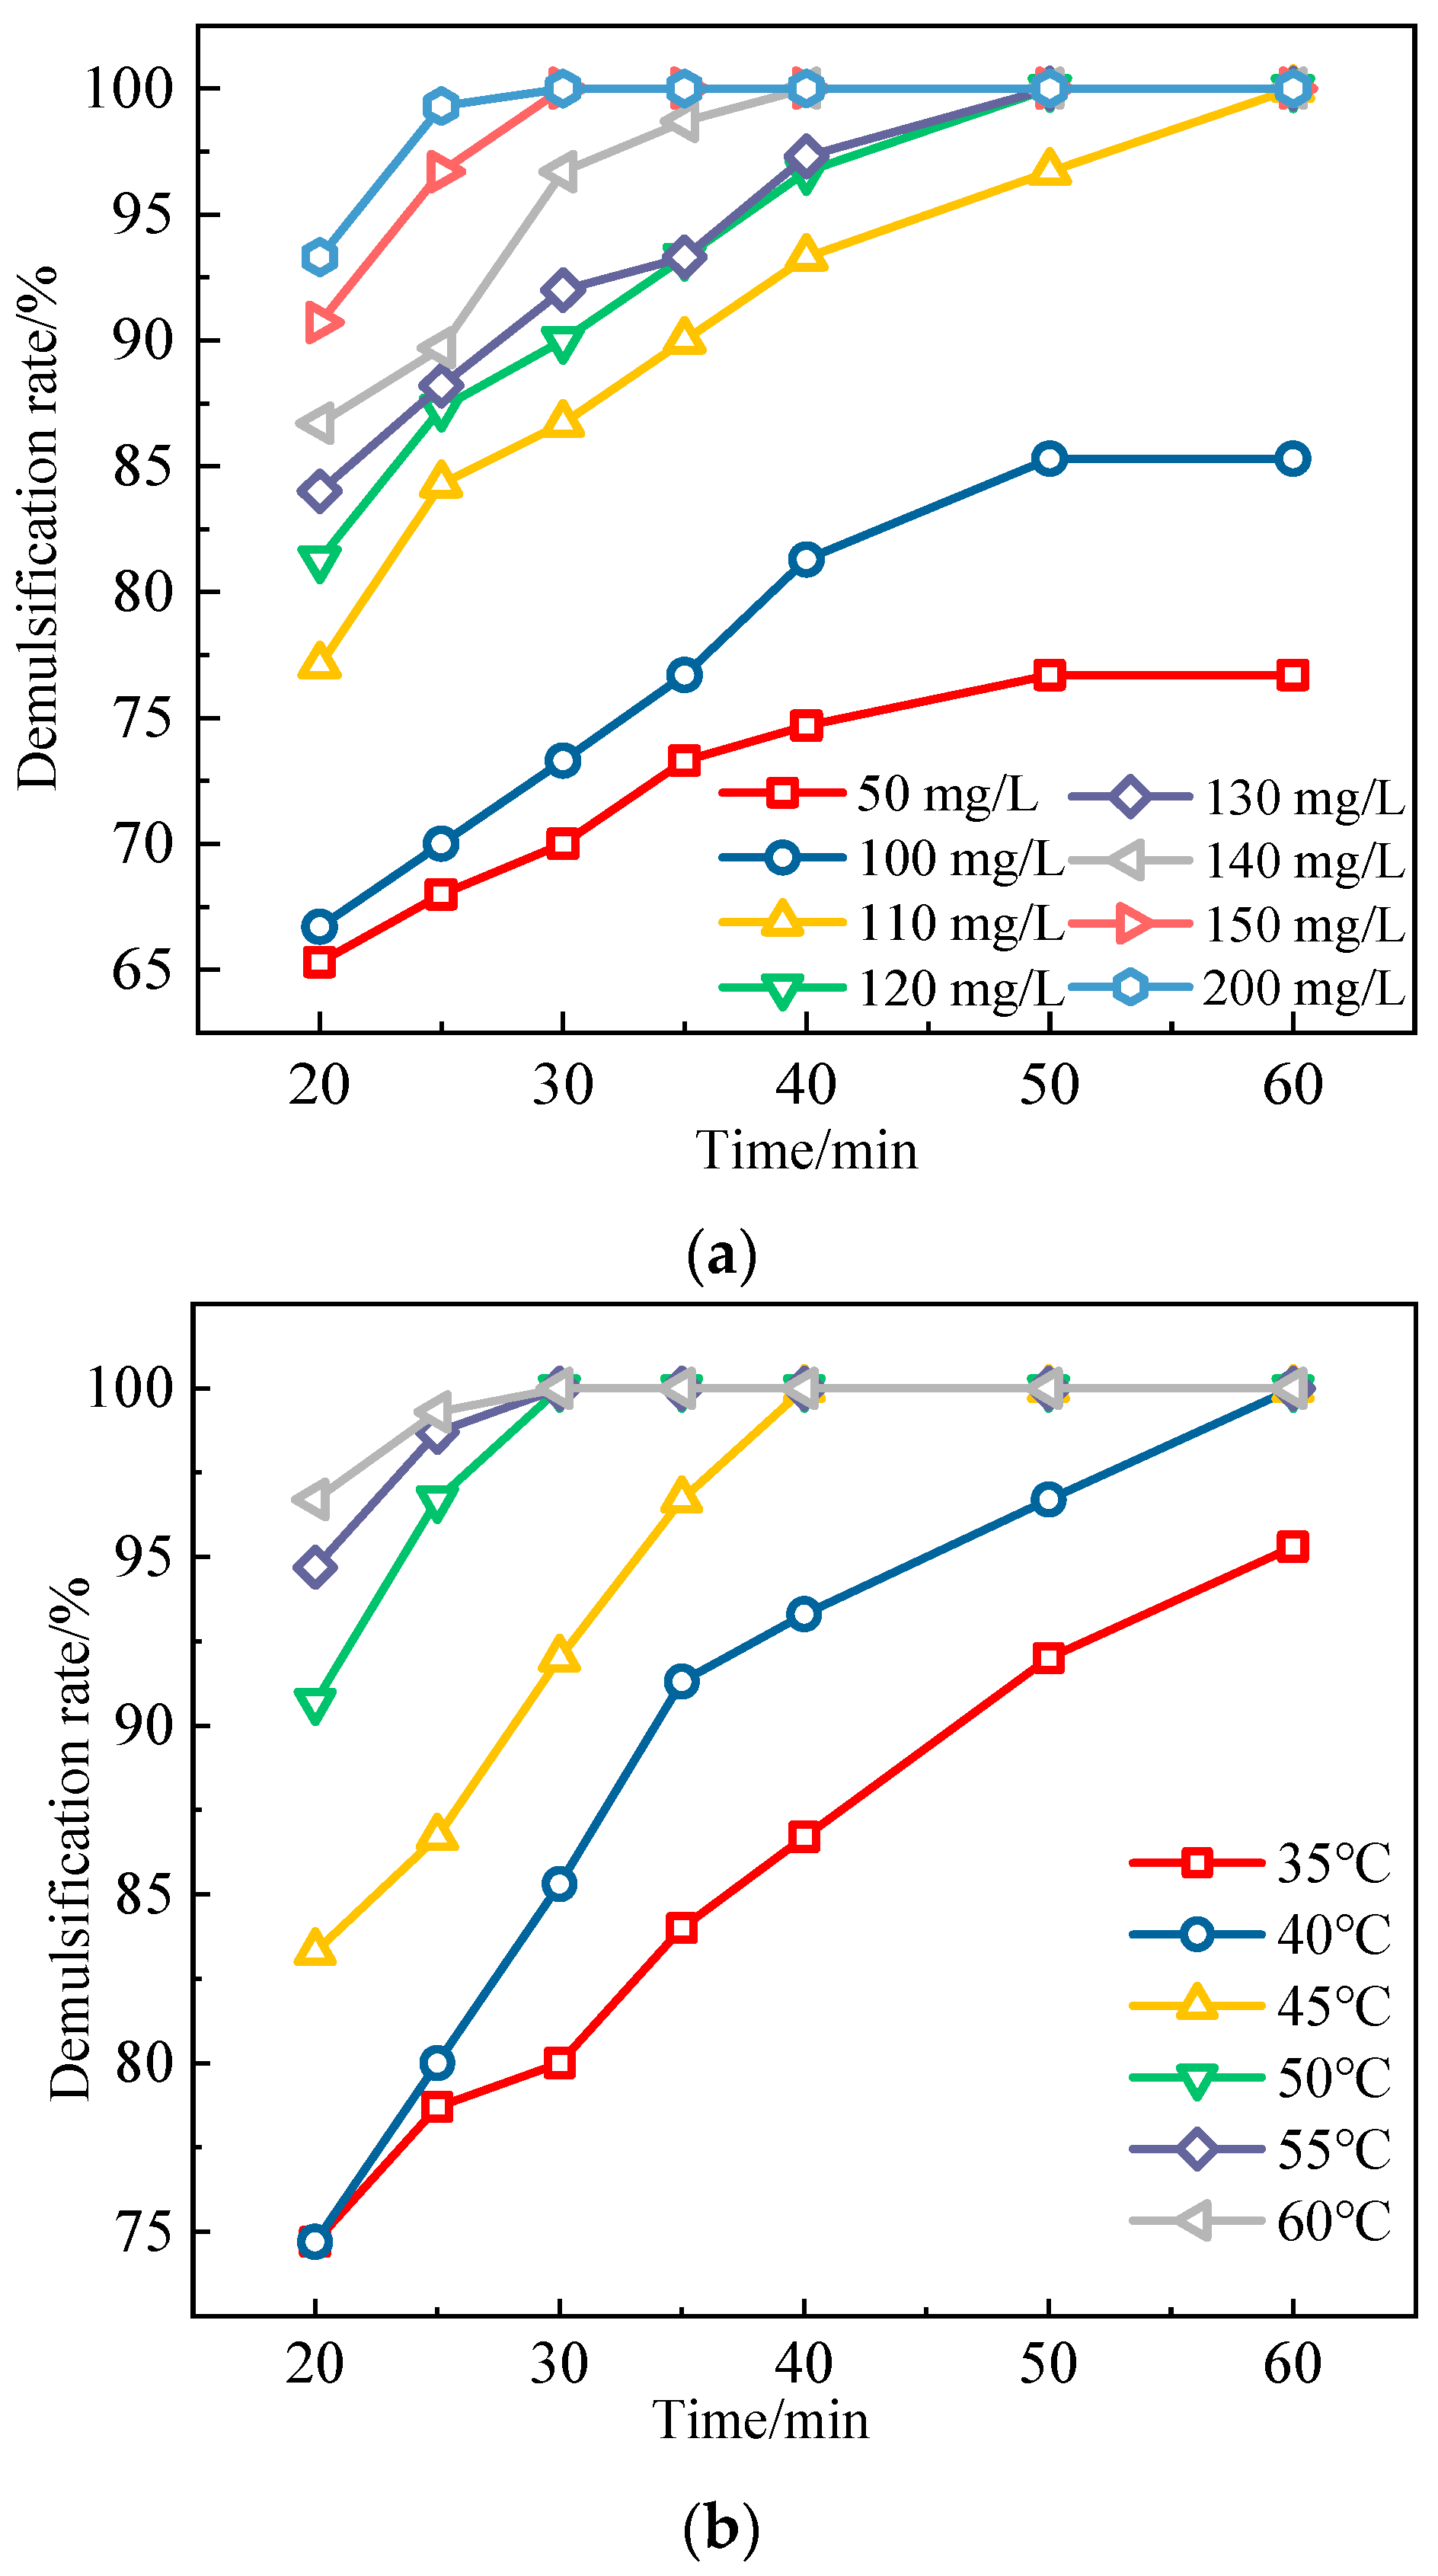
3.3.2. Selection of Demulsification Temperature and Dosage of Additives

Figure 11a is the demulsification rate curve of different concentrations of TPR-03 demulsifier at different times under the condition of 50 °C. It can be seen that there are differences in demulsification efficiency under different demulsifier concentration conditions. As the demulsification time increases, the demulsification rate under each concentration condition first continuously increases and then tends to be stable. When the demulsifier concentration is at a minimum of 150 mg/L and the demulsification time is 30 min, the demulsification rate is 100%, and the water content of crude oil drops to 0. Figure 11b is the demulsification rate curve at different times under different temperatures when the concentration of TPR-03 demulsifier is 150 mg/L. It can be seen that as the temperature increases, the demulsification rate at different times is improved. Therefore, for the crude oil emulsion of Well 4, when the temperature is 50 °C, the concentration of TPR-03 demulsifier is 150 mg/L, the demulsification time is 30 min, the demulsification rate is 100%, and the water content is 0, which meets the requirements of on-site gathering and transportation processes. Therefore, TPR-03 is selected as the crude oil demulsifier for sample 4. The optimal demulsification temperature is 50 °C and the demulsifier concentration is 150 mg/L.

4. Conclusions

Through the analysis of the viscosity–temperature characteristics and pressure-dependent yield values of different dissolved CO2 crude oils and produced fluids, the following conclusions can be drawn:
The viscosity of dissolved CO2 crude oil decreases with increasing temperature. At 25 °C, the viscosity of dissolved CO2 crude oil is significantly higher than at other temperatures, primarily due to its proximity to the pour point, resulting in poor fluidity. As pressure increases, the viscosity of dissolved CO2 crude oil also decreases. The pressure-dependent yield value of dissolved-gas crude oil decreases with increasing temperature and pressure. When the temperature exceeds 24 °C, the yield stress approaches zero, indicating improved fluidity. The increase in temperature enhances fluidity, while the increase in pressure raises the solubility of CO2, further reducing the pressure-dependent yield value.
Taking the produced fluid of sample 2 as an example, the viscosity of the emulsion decreases with increasing temperature and exhibits the non-Newtonian characteristic of shear thinning. The viscosity of emulsions from different wells varies in response to shear time. The stability of some emulsions increases with shear time, while that of others first increases and then decreases. After dissolving CO2, the viscosity of the emulsion generally decreases, and with increasing shear time, the viscosity shows a downward trend. Dissolved CO2 exacerbates the oil–water separation phenomenon in the produced fluid and reduces the stability of the emulsion.
The demulsification effects of the three demulsifiers on the crude oil emulsion of sample 4 differ significantly. HTMAC exhibits poor demulsification performance. The final demulsification efficiency of TPR-03 is 100%, making it the most effective demulsifier for the crude oil emulsion of sample 4. There are variations in demulsification efficiency under different concentrations of demulsifiers and temperature conditions. Generally, increasing the concentration of the demulsifier and the demulsification temperature enhances the demulsification rate. For sample 4, the optimal demulsification temperature for the TPR-03 demulsifier is 50 °C, with a concentration of 150 mg/L.
In conclusion, dissolved CO2 has a significant influence on the viscosity and rheology of crude oil and produced fluids. Changes in temperature and pressure affect their fluidity and stability. The selection of demulsifiers, along with their concentration and demulsification temperature, all impact the demulsification effect. These research results provide important references for pipeline design, pump selection, and oil–water separation in the oilfield production process. Given the rheological properties of crude oil and produced fluids, the study conditions in this paper do not cover some special conditions. Further research should appropriately expand the range of temperature and pressure to enhance the robustness of the research conclusions.

Author Contributions

Writing—original draft, M.Q.; Writing—review & editing, F.Z.; Project administration, W.L. All authors have read and agreed to the published version of the manuscript.

Funding

This research received no external funding.

Data Availability Statement

The original contributions presented in the study are included in the article, further inquiries can be directed to the corresponding author.

Conflicts of Interest

The authors declare no conflict of interest.

References

  1. Mon, M.T.; Tansuchat, R.; Yamaka, W. CCUS Technology and Carbon Emissions: Evidence from the United States. Energies 2024, 17, 1748. [Google Scholar] [CrossRef]
  2. Gür, T.M. Carbon dioxide emissions, capture, storage and utilization: Review of materials, processes and technologies. Prog. Energy Combust. Sci. 2022, 89, 100965. [Google Scholar] [CrossRef]
  3. Fakher, S.; Imqam, A. Application of carbon dioxide injection in shale oil reservoirs for increasing oil recovery and carbon dioxide storage. Fuel 2020, 265, 116944. [Google Scholar] [CrossRef]
  4. Ruina, X.; Tiancheng, J.; Taojie, L.; JIANG, P. Research progress on heat and mass transfer in carbon geological storage and enhanced oil/gas/geothermal recovery technology. J. Tsinghua Univ. (Sci. Technol.) 2022, 62, 634–654. [Google Scholar]
  5. Roussanaly, S.; Grimstad, A.-A. The Economic Value of CO2 for EOR Applications. Energy Procedia 2014, 63, 7836–7843. [Google Scholar] [CrossRef]
  6. Liu, Y.; Rui, Z. A Storage-Driven CO2 EOR for a Net-Zero Emission Target. Engineering 2022, 18, 79–87. [Google Scholar] [CrossRef]
  7. Martirosyan, A.V.; Ilyushin, Y.V.; Afanaseva, O.; Kukharova, T.V.; Asadulagi, M.-A.M.; Khloponina, V. Development of an Oil Field’s Conceptual Model. Int. J. Eng. 2025, 38, 381–388. [Google Scholar] [CrossRef]
  8. Farajzadeh, R.; Eftekhari, A.A.; Dafnomilis, G.; Lake, L.W.; Bruining, J. On the sustainability of CO2 storage through CO2—Enhanced oil recovery. Appl. Energy 2020, 261, 114467. [Google Scholar] [CrossRef]
  9. Pham, V.; Halland, E. Perspective of CO2 for Storage and Enhanced Oil Recovery (EOR) in Norwegian North Sea. Energy Procedia 2017, 114, 7042–7046. [Google Scholar] [CrossRef]
  10. Imurec, N.G.-M.; Novak-Mavar, K.; Maji, M. Carbon Capture and Storage (CCS): Technology, Projects and Monitoring Review. Min.-Geol.-Pet. Eng. Bull. 2018, 33, 1–15. [Google Scholar]
  11. Ren, B.; Duncan, I.J. Reservoir simulation of carbon storage associated with CO2 EOR in residual oil zones, San Andres formation of West Texas, Permian Basin, USA. Energy 2019, 167, 391–401. [Google Scholar] [CrossRef]
  12. Yuan, S.; Ma, D.; Li, J.; Zhou, T.; Ji, Z.; Han, H. Progress and prospects of carbon dioxide capture, EOR-utilization and storage industrialization. Pet. Explor. Dev. 2022, 49, 955–962. [Google Scholar] [CrossRef]
  13. Eyinla, D.S.; Leggett, S.; Badrouchi, F.; Emadi, H.; Adamolekun, O.J.; Akinsanpe, O.T. A comprehensive review of the potential of rock properties alteration during CO2 injection for EOR and storage. Fuel 2023, 353, 129219. [Google Scholar] [CrossRef]
  14. Isah, A.; Arif, M.; Hassan, A.; Mahmoud, M.; Iglauer, S. A systematic review of Anhydrite-Bearing Reservoirs: EOR Perspective, CO2-Geo-storage and future research. Fuel 2022, 320, 123942. [Google Scholar] [CrossRef]
  15. Edouard, M.N.; Okere, C.J.; Ejike, C.; Dong, P.; Suliman, M.A. Comparative numerical study on the co-optimization of CO2 storage and utilization in EOR, EGR, and EWR: Implications for CCUS project development. Appl. Energy 2023, 347, 121448. [Google Scholar] [CrossRef]
  16. Song, Y.; Jun, S.; Na, Y.; Kim, K.; Jang, Y.; Wang, J. Geomechanical challenges during geological CO2 storage: A review. Chem. Eng. J. 2023, 456, 140968. [Google Scholar] [CrossRef]
  17. Ozowe, W.; Daramola, G.O.; Ekemezie, I.O. Innovative approaches in enhanced oil recovery: A focus on gas injection synergies with other EOR methods. Magna Sci. Adv. Res. Rev. 2024, 11, 311–324. [Google Scholar] [CrossRef]
  18. Snæbjörnsdóttir, S.Ó.; Sigfússon, B.; Marieni, C.; Goldberg, D.; Gislason, S.R.; Oelkers, E.H. Carbon dioxide storage through mineral carbonation. Nat. Rev. Earth Environ. 2020, 1, 90–102. [Google Scholar] [CrossRef]
  19. Ali, M.; Jha, N.K.; Pal, N.; Keshavarz, A.; Hoteit, H.; Sarmadivaleh, M. Recent advances in carbon dioxide geological storage, experimental procedures, influencing parameters, and future outlook. Earth-Sci. Rev. 2022, 225, 103895. [Google Scholar] [CrossRef]
  20. Zheng, B.; Niu, J.; Zhang, K. Current Status and Outlook of CCUS Industry in China. In Annual Report on China’s Petroleum, Gas and New Energy Industry (2022–2023); China International United Petroleum, Chemicals Co., Ltd., Chinese Academy of Social Sciences, Peking University, Eds.; Springer Nature: Singapore, 2024; pp. 289–306. [Google Scholar] [CrossRef]
  21. Leng, J.; Bump, A.; Hosseini, S.A.; Meckel, T.A.; Wang, Z.; Wang, H. A comprehensive review of efficient capacity estimation for large-scale CO2 geological storage. Gas Sci. Eng. 2024, 126, 205339. [Google Scholar] [CrossRef]
  22. Xu, Z.-X.; Li, S.-Y.; Li, B.-F.; Chen, D.-Q.; Liu, Z.-Y.; Li, Z.-M. A review of development methods and EOR technologies for carbonate reservoirs. Pet. Sci. 2020, 17, 990–1013. [Google Scholar] [CrossRef]
  23. Liu, Z.-X.; Liang, Y.; Wang, Q.; Guo, Y.-J.; Gao, M.; Wang, Z.-B.; Liu, W.-L. Status and progress of worldwide EOR field applications. J. Pet. Sci. Eng. 2020, 193, 107449. [Google Scholar] [CrossRef]
  24. Samnioti, A.; Gaganis, V. Applications of Machine Learning in Subsurface Reservoir Simulation—A Review—Part II. Energies 2023, 16, 6727. [Google Scholar] [CrossRef]
  25. Wang, H.; Pang, Y.; Chen, S.; Wang, M.; Hui, G. Robust prediction for CH4/CO2 competitive adsorption by genetic algorithm pruned neural network. Geoenergy Sci. Eng. 2024, 234, 212618. [Google Scholar] [CrossRef]
  26. Huang, R.; Wei, C.; Wang, B.; Yang, J.; Xu, X.; Wu, S.; Huang, S. Well performance prediction based on Long Short-Term Memory (LSTM) neural network. J. Pet. Sci. Eng. 2022, 208, 109686. [Google Scholar] [CrossRef]
  27. Davoodi, S.; Al-Shargabi, M.; Wood, D.A.; Mehrad, M.; Rukavishnikov, V.S. Carbon dioxide sequestration through enhanced oil recovery: A review of storage mechanisms and technological applications. Fuel 2024, 366, 131313. [Google Scholar] [CrossRef]
  28. Mahboob, A.; Kalam, S.; Kamal, M.S.; Hussain, S.S.; Solling, T. EOR Perspective of microemulsions: A review. J. Pet. Sci. Eng. 2022, 208, 109312. [Google Scholar] [CrossRef]
  29. Hao, X.; Elakneswaran, Y.; Shimokawara, M.; Kato, Y.; Kitamura, R.; Hiroyoshi, N. Impact of the Temperature, Homogenization Condition, and Oil Property on the Formation and Stability of Crude Oil Emulsion. Energy Fuels 2024, 38, 979–994. [Google Scholar] [CrossRef]
  30. Wong, S.F.; Lim, J.S.; Dol, S.S. Crude oil emulsion: A review on formation, classification and stability of water-in-oil emulsions. J. Pet. Sci. Eng. 2015, 135, 498–504. [Google Scholar] [CrossRef]
  31. Sun, G.; Li, C.; Yang, S.; Yang, F.; Chen, Y. Experimental Investigation of the Rheological Properties of a Typical Waxy Crude Oil Treated with Supercritical CO2 and the Stability Change in Its Emulsion. Energy Fuels 2019, 33, 4731–4739. [Google Scholar] [CrossRef]
  32. Hu, R.; Crawshaw, J. Measurement of the Rheology of Crude Oil in Equilibrium with CO2 at Reservoir Conditions. JoVE 2017, 124, e55749. [Google Scholar] [CrossRef]
Figure 1. CO2 storage methods existing in the EOR process: (a) structural storage; (b) mineralization storage; (c) residual storage; (d) dissolution storage.
Energies 18 00739 g001
Figure 2. Viscosity–temperature characteristic curves of the dissolved CO2 crude oil of sample 1 under different pressures and shear rates.
Energies 18 00739 g002
Figure 3. The curve of the influence of pressure on the viscosity of the dissolved-gas crude oil of sample 1 at a temperature of 30 °C.
Energies 18 00739 g003
Figure 4. Variation in the pressure-dependent yield value of the dissolved-gas crude oil of sample 1 with temperature under different pressures.
Energies 18 00739 g004
Figure 5. Viscosity–temperature curve diagram of the sample 2 emulsion.
Energies 18 00739 g005
Figure 6. Variation in the viscosity of oil–water emulsion with shear time.
Energies 18 00739 g006
Figure 7. Variation in the viscosity of CO2-dissolved emulsion with shear time (sample 5).
Energies 18 00739 g007
Figure 8. Variation in the viscosity of CO2-dissolved emulsion with shear time (sample 6).
Energies 18 00739 g008
Figure 9. Photographs of demulsification after 60 min (the crude oil emulsion of sample 4, a demulsifier dosage of 150 mg/L, with the temperature at 50 °C; (a) represents TPR-03, (b) represents RKP-2, (c) represents HTMAC, and (d) represents the blank sample).
Energies 18 00739 g009
Figure 10. Demulsification rate curves of three demulsifiers (crude oil emulsion of sample 4, the dosages are all 150 mg/L, and the temperature is 50 °C).
Energies 18 00739 g010
Figure 11. Demulsification rate curves under (a) different demulsifier concentrations and (b) different demulsification temperatures.
Energies 18 00739 g011
Table 1. Test results of oil-sample group composition.
Well No.Asphaltene (%)Saturates (%)Aromatics (%)Resin (%)
10.3985.019.225.38
24.6746.9917.2031.14
39.0839.3120.9430.68
434.8853.018.993.11
52.8377.5712.497.10
619.0863.9212.254.74
Table 2. Test results of density.
Sample No.123456
Density (g/cm3)0.85310.85600.85100.85490.84830.8465
Table 3. Test results of water content in oil.
Sample No.123456
water content. (%)73.8859.8511.0958.316.9213.54
Table 4. Distribution of experimental points.
Sample No.Demulsifier TypeConcentration (mg/L)Temperature (°C)Time (min)
4HTMAC\TPR-03\RKP-150/100/110/120
/130/140/150/200
35/40/45
/50/55/60
20/25/30/35
/40/50/60
Table 5. Evaluation of demulsifier demulsification effect (crude oil emulsion of sample 4).
Demulsifier TypeConcentration (mg/L)Temperature
(°C)
Time
(min)
Demulsification Rate (%)Water Content (%)Cleanliness of Aqueous Phase
RKP-2150506090.023.11
TPR-031505040100.001
HTMAC150506073.344.43
Disclaimer/Publisher’s Note: The statements, opinions and data contained in all publications are solely those of the individual author(s) and contributor(s) and not of MDPI and/or the editor(s). MDPI and/or the editor(s) disclaim responsibility for any injury to people or property resulting from any ideas, methods, instructions or products referred to in the content.

