Article

Experimental Study on R290 Performance of an Integrated Thermal Management System for Electric Vehicle

1
College of Energy Engineering, Zhejiang University, Hangzhou 310012, China
2
Provincial Key Laboratory of New Energy Vehicles Thermal Management, Longquan 323700, China
3
Longquan Industrial Innovation Research Institute, Longquan 323700, China
4
Anhui Jianghuai Automobile Group Corp, Ltd., Hefei 230041, China
5
Polytechnic Institute, Zhejiang University, Hangzhou 310015, China
*
Author to whom correspondence should be addressed.
Energies 2025, 18(4), 802; https://doi.org/10.3390/en18040802
Submission received: 23 December 2024 / Revised: 2 February 2025 / Accepted: 7 February 2025 / Published: 9 February 2025
(This article belongs to the Section E: Electric Vehicles)

Abstract

:
Integrated thermal management system (ITMS) technology for electric vehicles (EV) has become a major industry research direction. However, R290 refrigerants are still not applied on a large scale in EVs. Therefore, we developed a suitable thermal management system for R290 in this study. This architecture adapts an unusual indirect design, which can coordinate the heat between the air conditioner, battery pack, and electric motor. We focused on heat pump air conditioning systems for EV thermal management; thus, we carried out the performance analysis of R290 under the cooling and heating conditions of our ITMS through an experimental approach. The current study explores various aspects affecting the performance of heat-pump air conditioners: refrigerant charge, electronic expansion valve (EXV) opening, compressor speed, and performance between R290 and R134a under different external temperatures. We aim to improve cooling and heating efficiencies. Among these parameters, the EXV opening and compressor speed have the greatest impact on the performance of the ITMS, as evidenced by the optimal EXV opening and lower compressor speed to maximize the coefficient of performance (COP) and increase the heat transfer rate. In addition, this study has shown that, compared to an ITMS equipped with R134a, R290 has a smaller refrigerant charge, better heat transfer rate and COP under heating conditions, and similar performance under cooling conditions.

1. Introduction

Currently, the global sales of new energy vehicles are booming, of which the pure electric vehicle (EV) accounts for the largest share; their limited driving range is one of the critical issues for EV development. As the most energy-consuming part of EVs, the thermal management system not only needs to consider the passenger thermal compartment [1,2] but also the greenhouse effect of refrigerants [3,4,5,6]. Air conditioning systems with a heat pump (HP) are designed from the perspective of system integration with battery cooling (BC) and motor cooling (MC), which can coordinate the heat between components [7]. However, the use of different refrigerants can also lead to performance and system construction changes in EVs. In this regard, not only is high economic efficiency in cooling and heating necessary, but refrigerant substitution is also of great significance.
Currently, the global sales of new energy vehicles are booming, of which pure electric vehicles (EV) account for the largest share. However, their limited driving range is one of the critical issues for EV development. As the most energy-consuming part of EVs, the thermal management system needs to consider the passenger thermal compartment [1,2] and the greenhouse effect of refrigerants [3,4,5,6]. Many researchers designed air conditioning systems with a heat pump (HP), from the perspective of system integration with battery cooling (BC) and motor cooling (MC). This can coordinate the heat between the components [7]. However, the use of different refrigerants can also lead to changes in the performance and system construction of EVs. In this regard, not only is economical high cooling and heating necessary, but refrigerant substitution is also significant.
EV HP and integrated thermal management system (ITMS) design has undergone several stages. Traditional air conditioning with a positive temperature coefficient (PTC) electric heating system has the advantage of being highly reliable for low-temperature heating. However, first-generation ITMSs are usually equipped with PTC systems, which are highly inefficient in terms of energy utilization [8]. Using PTC systems all the time instead of heat pumps severely limits the range of electric cars [9]; therefore, they cannot be directly applied to EVs. For this reason, various electric vehicle thermal management systems (EVTMSs) have been designed [10,11]. The principles are based on switching the valve on the refrigerant or coolant water circuit to achieve heating or cooling. Tian et al. [12] carried out system performance tests in the environment chamber with variations of refrigerant charge, electronic expansion valve (EXV) opening, compressor speed, environmental temperature, and waste heat amount. Results showed that the optimal charge of R134a is 810 g, and the optimal EXV opening ranges from 70% to 90%.
Subsequently, many researchers proposed a simple coupling system [13], which can connect the battery’s liquid cooling system in parallel with an evaporator in the air conditioner. Further, a more integrated thermal management system [14] is designed to enable heat exchange between the three subsystems: a heating ventilation and air conditioning (HVAC) system, a battery thermal management system (BTMS), and an electrical motor thermal management system (EMCTMS).
Regarding waste heat recovery, Ahn et al. [15] pointed out that ice formation occurs on the external heat exchanger surface when the environmental temperature is below −10 °C, sharply decreasing the heating performance of the air source HP. Li et al. [16] proposed a thermal management system that utilizes phase-changed material to recover waste heat from the CO2 HP system, which can insulate the battery during winter parking. Tian et al. [17] proposed an EVTMS with waste heat recovery from the motor, and their experiment showed that increasing the amount of waste heat would contribute to performance improvement.
In summary, designing a thermal management system with multifunctional switching between passenger cabin cooling and heating, battery cooling and heating, motor cooling, and waste heat recovery is essential. Then, a performance analysis based on this system has to be conducted. If the ITMS is direct or indirect, based on whether or not the subsystems share the same work mass with each other [18], then the system we design is closer to the indirect type, because our system enables each system to utilize a different heat transfer working substance. However, unlike most indirect system architectures, we have separated the HVAC system from the refrigerant circuit as well, and the fluid used for heat exchange with the humid air in the vehicle is the coolant, not the refrigerant. This is because the use of coolant as a working fluid can be adapted to most of the subsystem components of EVs. Owing to this unusual indirect design, the refrigerant circuit can be formed as a module in our system, which can achieve Module/HVAC, Module/BTMS, and Module/EMCTMS. Therefore, it is possible to realize both HVAC/EMCTMS and BTMS/EMCTMS.
Concerning carbon emissions and refrigerant substitution, refrigerants for EVs are being renewed. Ozone depletion potential (ODP) and global warming potential (GWP) are used to assess environmental friendliness [19]. In EVs, chlorofluorocarbons (CFCs), represented by R12, have been eliminated from the automotive industry. Meanwhile, hydrochlorofluorocarbons (HCFCs), represented by R22, are on the verge of being phased out because their ODP is extensive [20]. Hydrofluorocarbons (HFCs), represented by R134a, and hydrofluoroolefins (HFOs), represented by R1234yf, have an ODP of 0 and GWP values of 1430 and 4, respectively. Although most EV heat pump air conditioners are equipped with R134a, R134a is currently listed as a greenhouse gas by the Kigali Amendment [21]. Hydrocarbons (HCs), represented by R290 (propane), have an ODP of 0 and a GWP of 3. R744 (CO2) has an ODP of 0 and a GWP of 1. It is foreseeable that the application of vehicle refrigerants will move towards smaller ODP and GWP values. Zhang et al. [22] obtained the physical properties of the R290 and R744 mixture through theoretical calculation, laying a foundation for applying mixed refrigerant under a low-temperature environment. Huang et al. [23] chose R290 as the working medium to set up a performance test platform, and their experimental results showed that the R290 system has a higher refrigeration capacity than the CO2 system under 55 °C. Dhamodharan et al. [24] compared the cooling performances of R290 and R1234yf in the battery thermal management system. Then, they confirmed that R290 performs better than R1234yf at a saturation temperature at 16 °C on the heat transfer coefficient increment.
The selection of refrigerants for EV air conditioning can be explained in terms of the following three parameters. Firstly, the boiling point determines the lowest ambient temperature during the heating mode in the HP. Secondly, the critical temperature determines the highest ambient temperature during the air conditioning (AC) cooling mode. Thirdly, the critical pressure determines the system’s safety pressure. Considering the extremely low and high temperatures that may exist, the range of environmental operating temperatures that an air conditioning system with an HP needs to realize is −40 °C to 65 °C. As stated in the previous paragraph, the refrigerant mediums that currently can be considered are R134a, R1234yf, and R290. Their boiling points are −26.1 °C, −29.4 °C, and −42.1 °C, respectively, and their critical temperatures are all over 94 °C. As for CO2, although its boiling point can be as low as −78.6 °C, its critical temperature is only 31.1 °C [25]. Therefore, the majority of its working cycles are in the supercritical state, and the phase change can only be realized during the evaporation stage. The critical pressures of R134a and R290 are close, 4.1 Mpa and 4.2 Mpa, respectively. In addition, the refrigeration capacity per unit of mass of R290 is 263.46 kJ/kg [26], and that of R134a is 136.4 kJ/kg [27], which means that the former can achieve similar performance to an R134a system with a smaller charge. It is reasonable to assume that R290 can produce more heat and is more efficient than R134a at low temperatures. Thus, in the new prototype thermal management system, using a more optimal refrigeration medium is vital for improving the system performance while reducing the carbon emissions of the entire EV. Despite the good heating performance, the disadvantages of the CO2 thermal management system are evident. The critical pressure of CO2 is as high as 7.4 MPa [28]; therefore, the cost of EV mechanical components is extremely high, which means that the carbon emissions of the entire EV are high. Meanwhile, the system is very prone to leakage.
Although there are studies in the existing literature on the performance of R290 in the thermal management system of an entire vehicle, there is a lack of comparison with the performance of R134a refrigerant in the same system. Li et al. [29] pointed out that R290 is challenging to ignite at low temperatures, and at high temperatures, the flame will only occur when there is a high leakage mass flow rate. For safety, we chose the secondary heat exchanger under the double-plate heat exchanger configuration.
In summary, considering the safety of R90 refrigerant, and achieving heat exchange between different subsystems, we designed an indirect integrated thermal management system for automotive thermal management. There are two plate heat exchangers present in the system architecture, which can provide conditions for heat exchange. Thus, the specific objectives are summarized as follows:
(1)
To conduct an experimental investigation of R290’s performance using the heat transfer rate and coefficient of performance (COP). Additionally, we compared the performance of R290 and R134a under identical operating conditions.
(2)
Establish a test bench and clarify the optimal refrigerant charges of R290 and R134a.
(3)
Model the performance analysis method of the ITMS.

2. Experimental Design of the ITMS

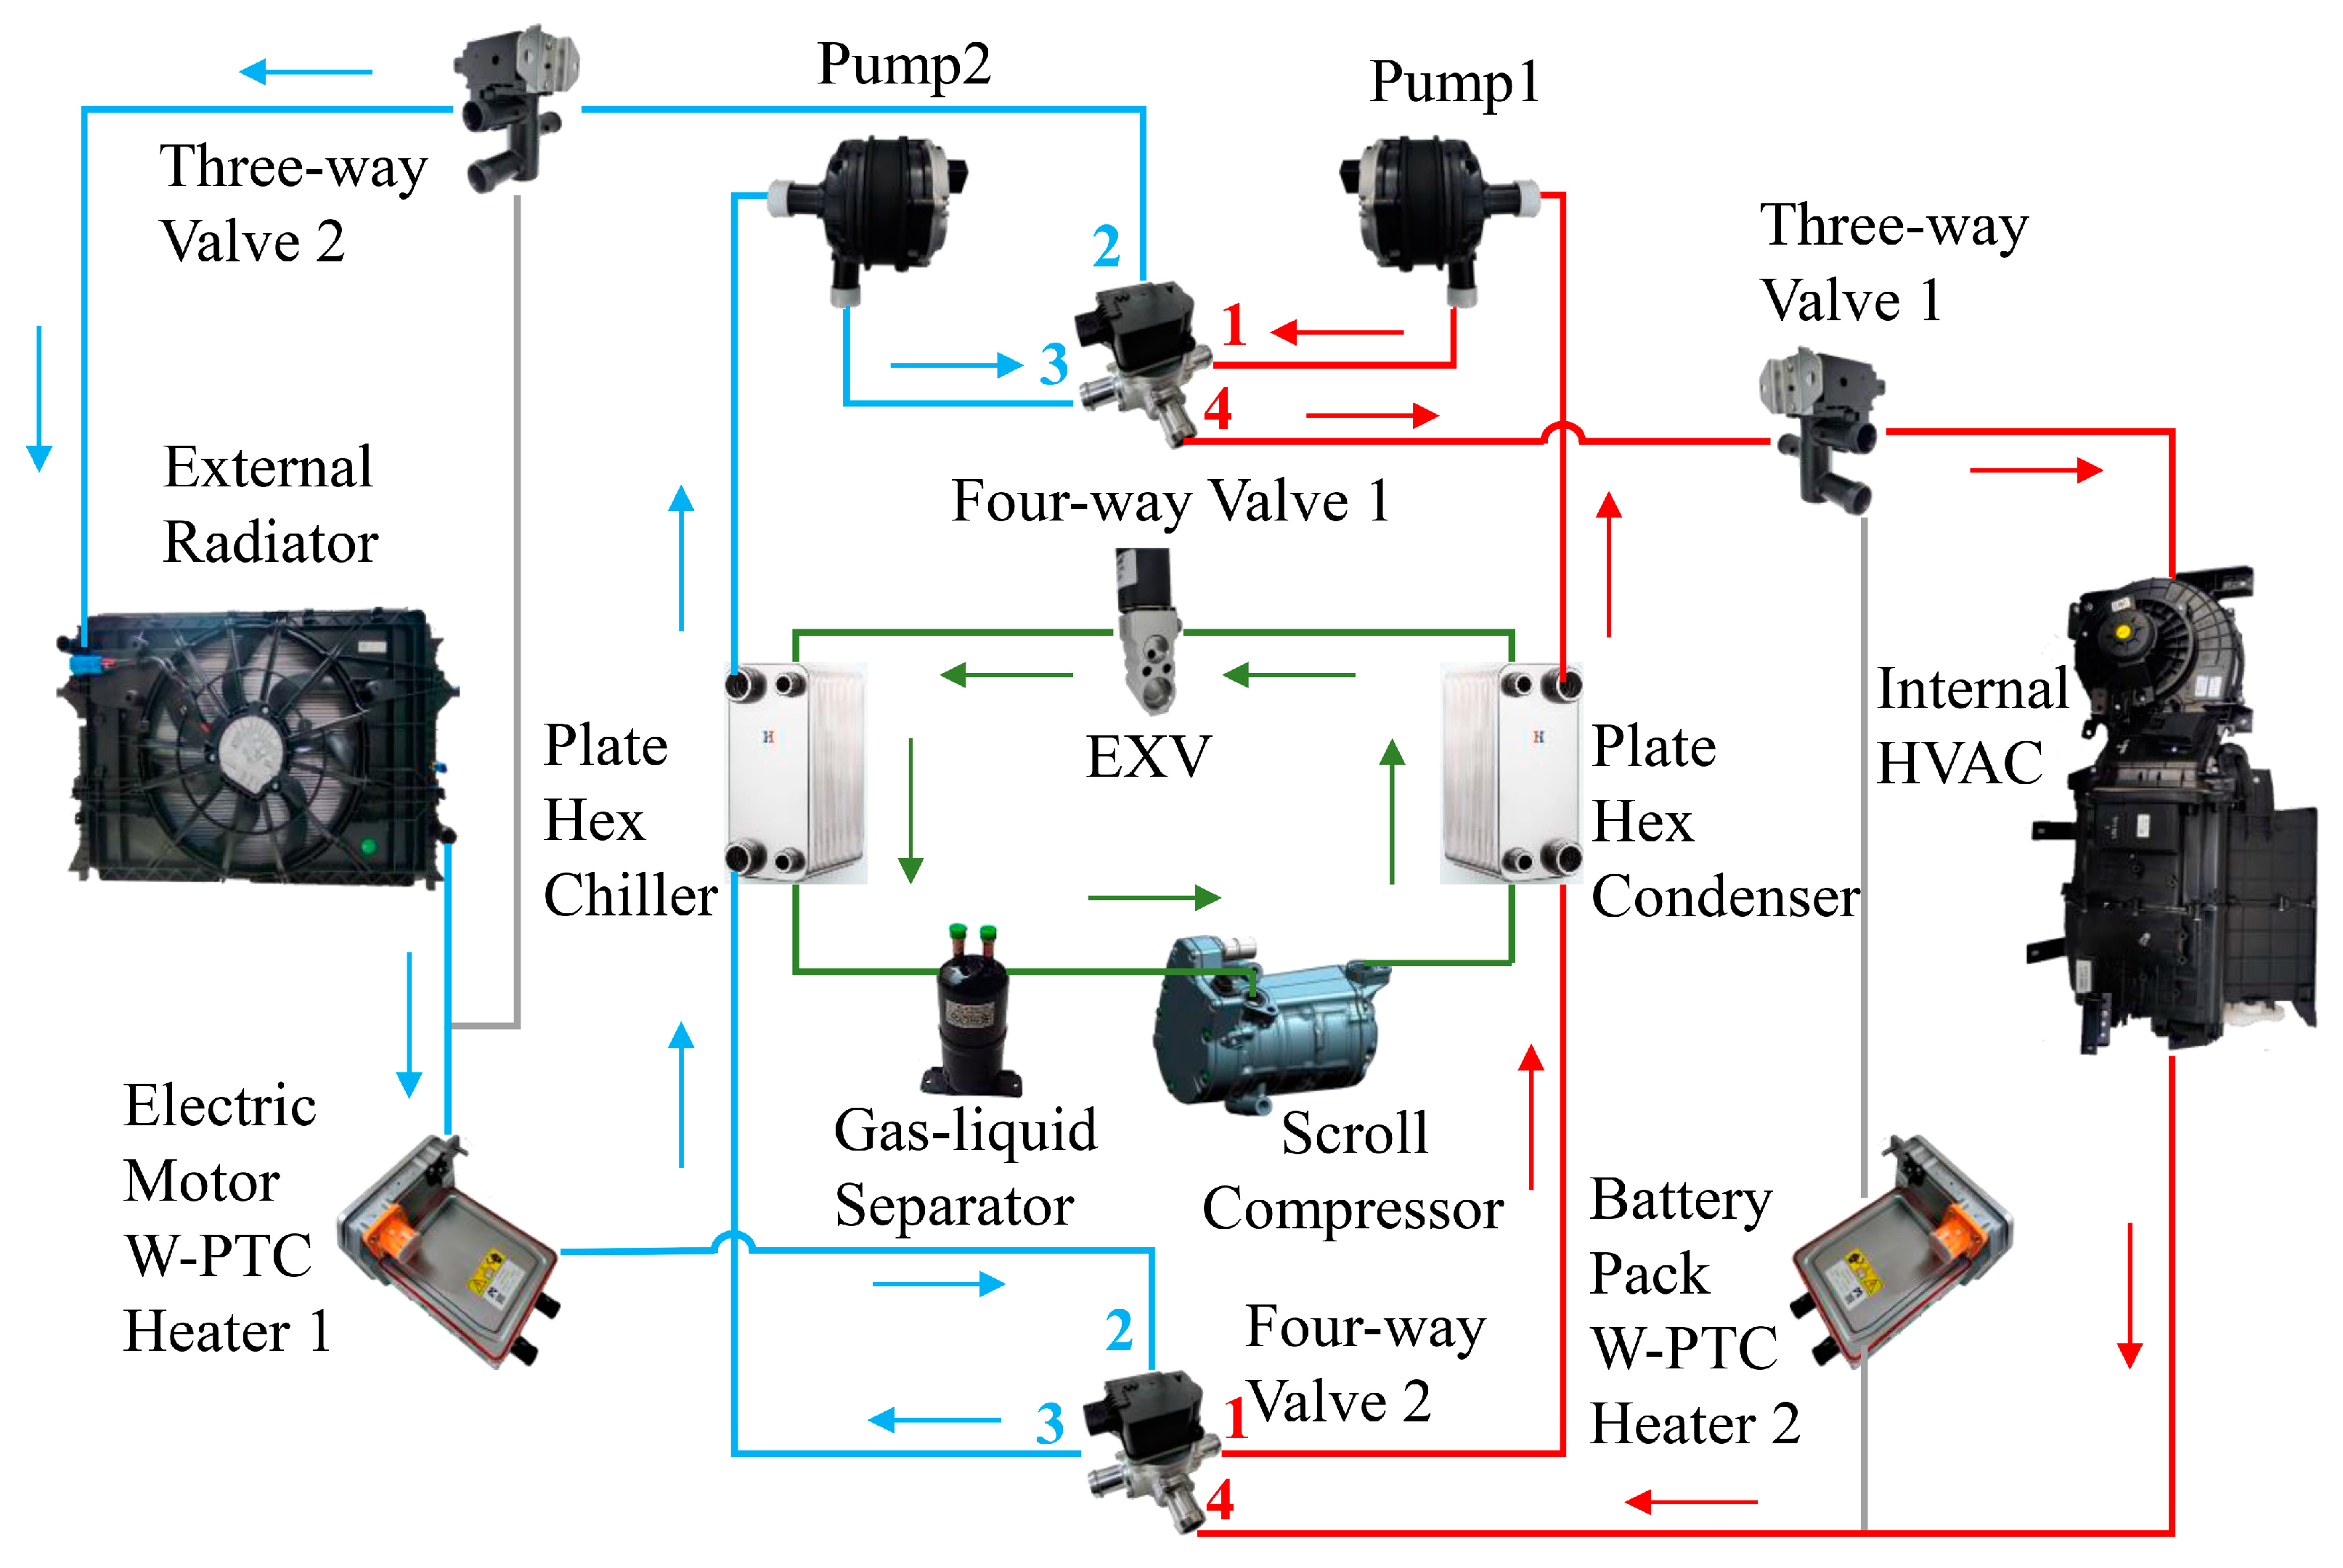
2.1. ITMS Bench Working Principles

The ITMS illustrated in Figure 1 consists of a refrigerant circuit, an MC branch, a BC branch, and the HVAC branch. The refrigerant circuit maintains the same operating mode in winter or summer conditions. Thus, cold water and hot water are always available at the plate heat exchanger chiller and condenser outlet, respectively. The connection between each branch and the plate heat exchanger is realized by switching the turn-off states of the four-way valve under different operating conditions. Each coolant water branch uses a 50% volume fraction of ethylene glycol.
The water-positive temperature coefficient (W-PTC) heaters 1 and 2 simulate the electric motor and battery pack’s heat transfer rate, respectively, because there is no need to consider the actual heat capacity of the battery and motor in a steady state. The turn-off states of the water valve and W-PTC under different operating modes are shown in Table 1, which provide a total of 12 modes that can be operated in this system. There are six operating modes for both summer and winter conditions. In summer conditions, the chiller is connected to the BC branch or HVAC branch, which can achieve safe battery running or cool the passenger compartment. At the same time, the condenser is connected to the MC branch on the basis of AC, BC, and AC + BC modes. Turning on the MC mode depends on the radiator’s heat dissipation capacity. In winter conditions, the connection is reversed, and the waste heat generated from the motor is considered a heat source that can be used to improve the performance of the HP. HVAC heating or battery heating can be achieved by switching the opening of the three-way valve 1 under the HP and HP + MC modes, respectively. Since the radiator fan is opened under all operating conditions, the operating mode of waste heat recovery by MC alone under winter conditions would not be considered.
Meanwhile, Figure 2 and Figure 3 provide the refrigerant’s path under different valve states, which can explain the different cooling and heating modes. In our experiments, we only study two operating modes: HP and AC modes.
The control and data acquisition (DAQ) solutions in this experiment are shown in Figure 4, which shows the transducers, actuators, microcontrollers, and DAQ modules used in the bench. The principles of the two customized data communication protocols are also presented. Both the microprogrammed control unit and DAQ module communicate with a computer through the physical connection of the serial port and the application layer protocol of Modbus RTU. The only difference is that TTL and RS485 voltage levels transmit control and data signals, respectively.
The instruments used in this experiment can be categorized as transducers and actuators. On the transducer side, each outputs a signal as an analog value, and DAQ modules are applied to acquire data. On the side of the actuator, the rotation speed of the electric centrifugal water pump, radiator fan, and HVAC fan are driven by the control signal with pulse width modulation. In contrast, the rotation speed of the scroll compressor, EXV opening, state of the four-way valve, state of the three-way valve, and heating power of the W-PTC are driven through a local interconnected network (LIN) bus.

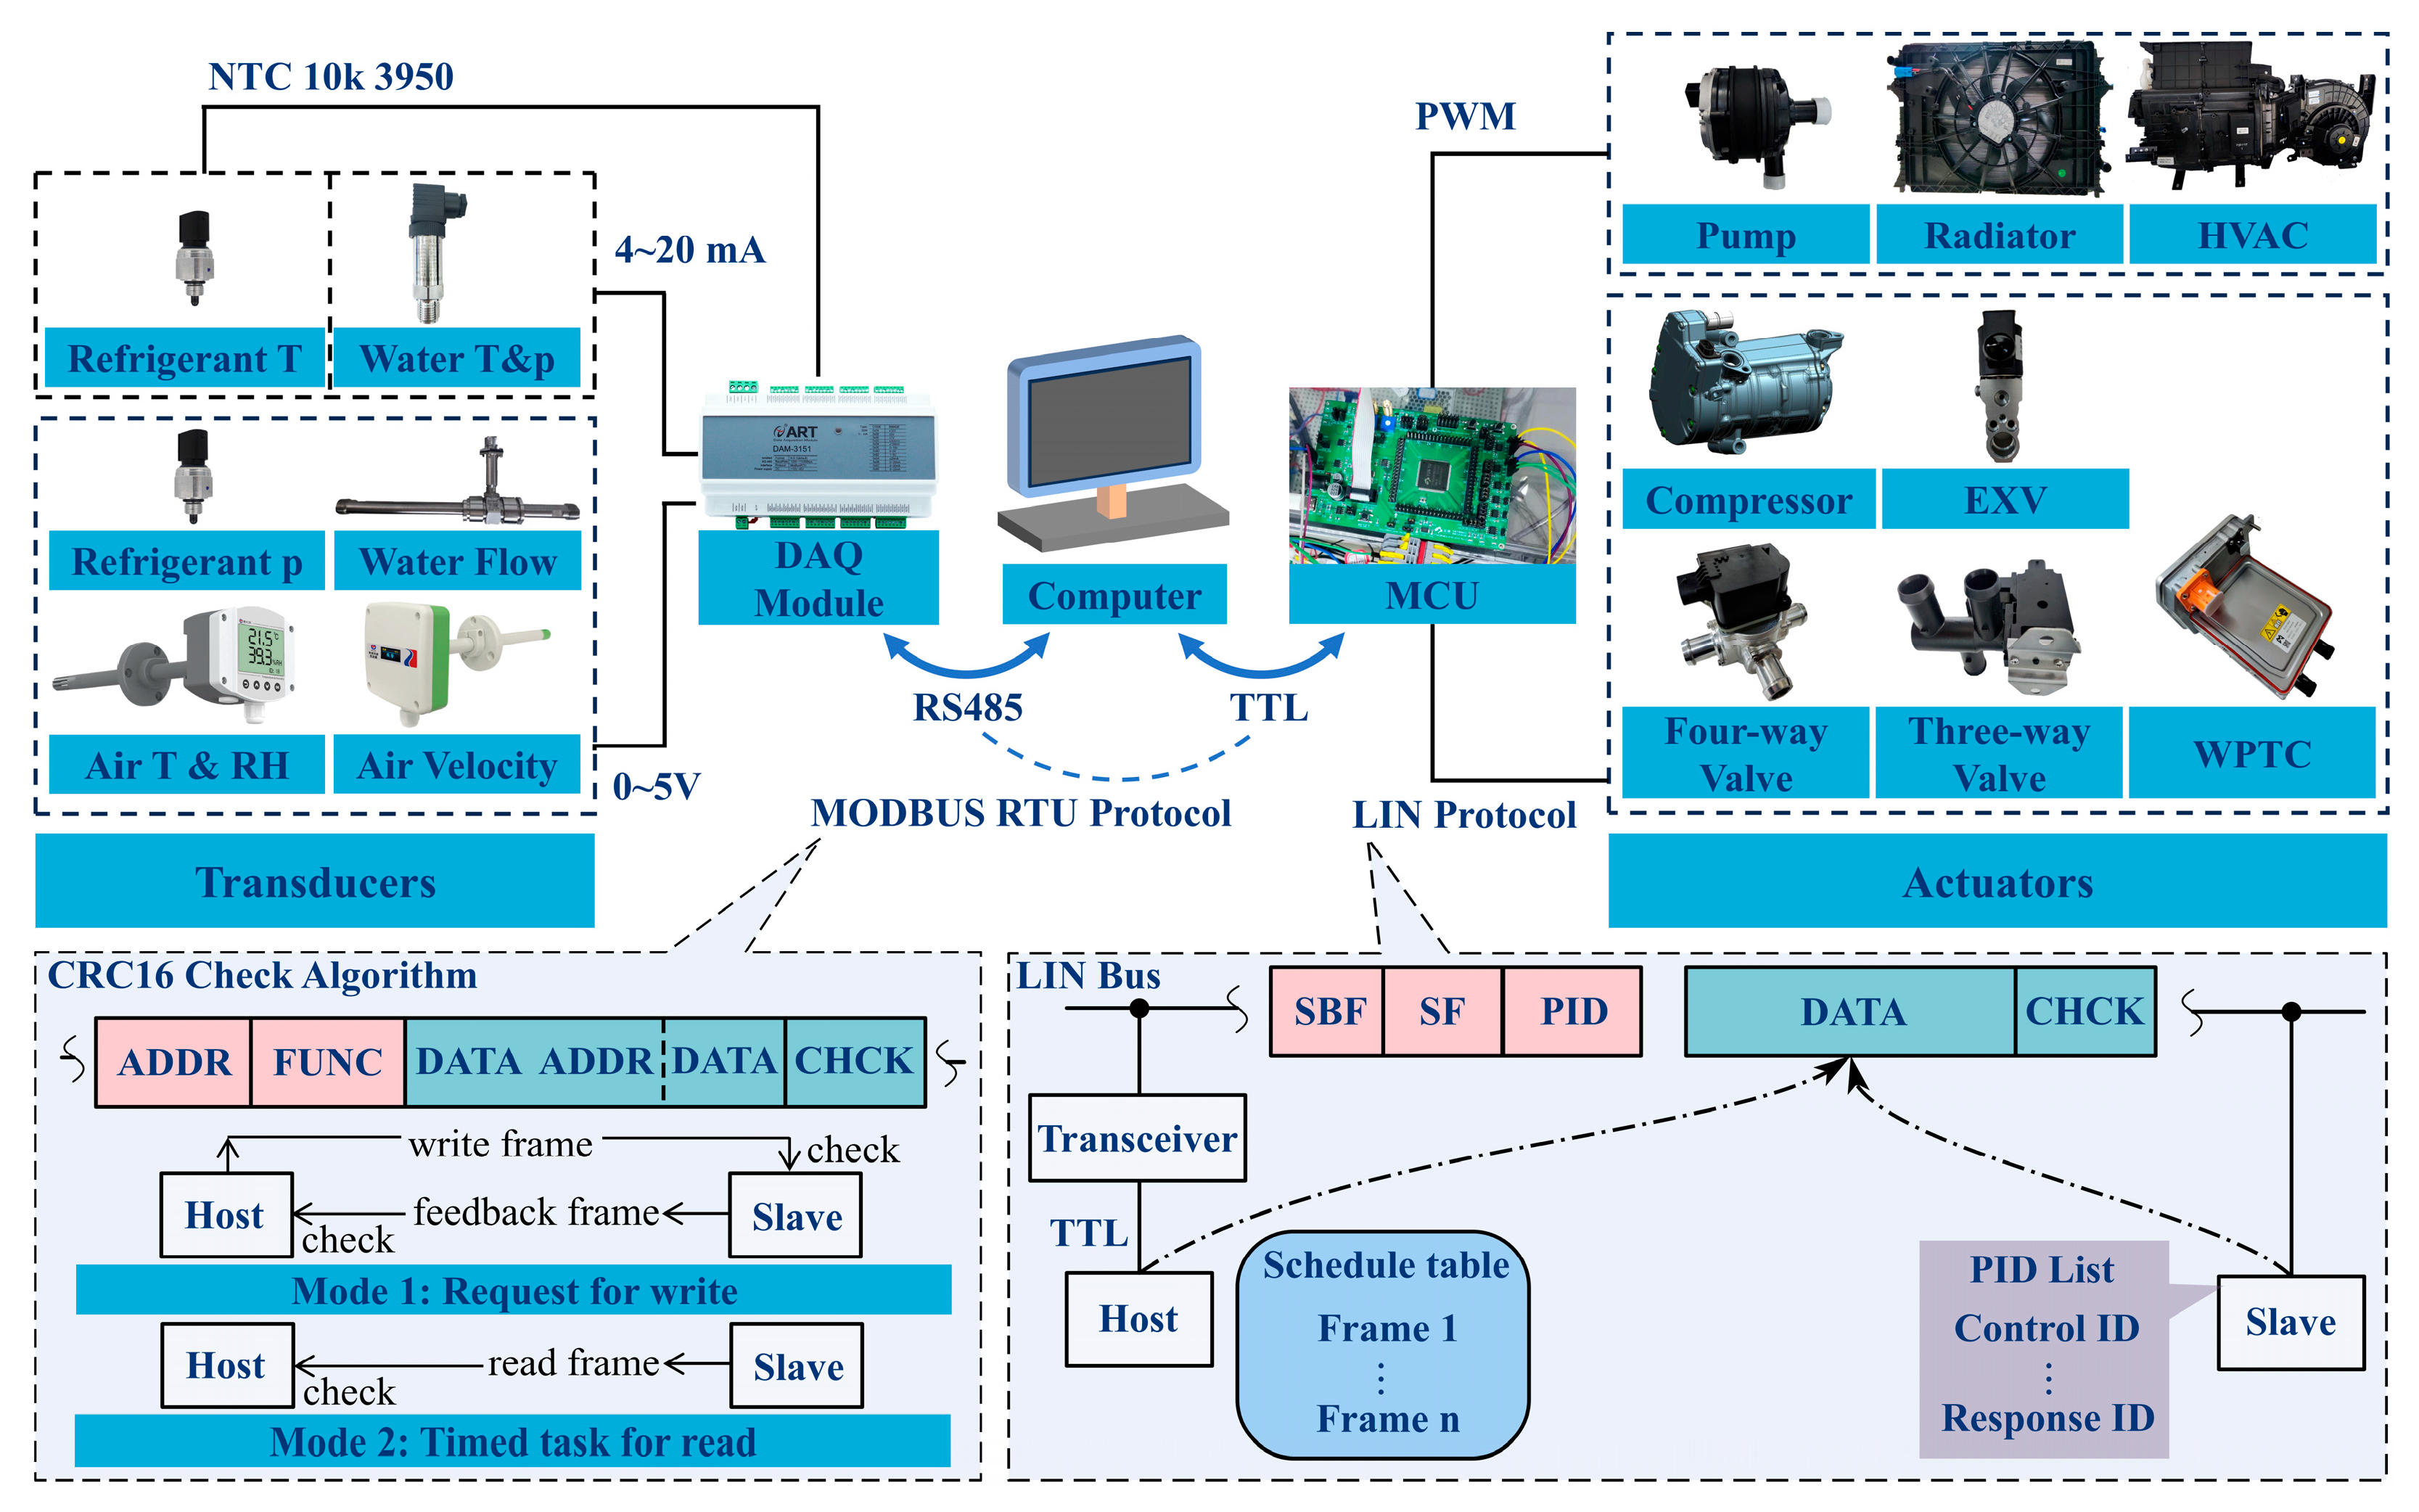
2.2. Experimental Setup and Test Conditions

It is important to note that we conducted the performance tests, not the passenger compartment simulation tests. This means that our experiments can be operated without using an enthalpy difference laboratory. We refer to the environment in which the ITMS test bench was placed as the external environment, and the environment in which the HVAC test bench was placed as the internal environment.
Based on the experimental setup shown in Figure 5, ITMS performance tests were carried out in two walk-in high–low temperature and humidity test chambers. The HVAC bench was placed in a test chamber that simulated the passenger cabin inside the vehicle. The ITMS bench was placed in another test chamber, which simulated the environment outside the car. The compressors and blowers controlled the two test chambers’ temperature and relative humidity (RH).
The component parameter specifications of the ITMS and the test chamber are listed in Table 2. The number of pulses of the EXV is 0 to 480 pulses, corresponding to an opening of 0% to 100%. The refrigerants used in this experiment were R290 and R134a; therefore, at the beginning, we started with refrigerant charge tests under HP mode, and the purpose was to determine the optimal charge for the system as the charge for subsequent experiments.
The test conditions were determined, as shown in Table 3, and the test was carried out in AC and HP modes. The purpose of the experiment was to investigate the performance of our ITMS system under specific operating conditions. We kept the water pump running at 100% duty cycle during all experiments, and we fixed the duty cycle of the radiator fan and HVAC fan to maintain the air velocities at 7 m·s−1 and 6.4 m·s−1, respectively. The system was then charged with refrigerant R290, the compressor speed was fixed, and the EXV opening was adjusted under preset conditions. After the R290 experiments, the refrigerant was switched to R134a to repeat some identical processes.
Before the experiment, a shielding layer was installed on each signal transmission line; this ensured that the other signals did not affect the voltage attenuation between the output and acquisition terminals. In addition, the range and accuracy of all transducers were calibrated; this eliminates the constant-value systematic error and guarantees the precision of the acquired data.
The response time of the transducers was up to 25 s, and the DAQ frequency was 1 Hz. The system was considered steady when all operating parameters fell within preset deviations and maintained over 5 min.
After the DAQ stage, the negligence error was eliminated first, and all parameters’ mean value was calculated. Finally, we calculated the two performance analysis criteria, heat transfer rate Φ and COP, using the equations in the next section.

2.3. Performance Analysis Model

This section makes the following assumptions to analyze the performance of the ITMS:
(1)
All the processes are operated in a steady state with uniform flow in the pipeline.
(2)
The refrigerant and coolant water’s kinetic and gravitational potential energies are neglected.
(3)
The pressure drops in the three-way valve, four-way valve, and heat exchanger are neglected.
(4)
The reference state for specific enthalpy is set at T0 = 273.15 K and p0 = 101.325 kPa.
(5)
The coolant pipelines, refrigerant pipelines, plate exchanger, and compressors are adiabatic from environment.
(6)
Dry air and water vapor in moist air are ideal gases, and their specific heat capacities are treated as constant over the experimental temperature range. It is assumed that condensation does not occur at all times.
(7)
The coolant is assumed to be pressure independent in terms of density and specific heat capacity, which are only single-valued functions of the water temperature.
(8)
For parallel flow heat exchangers, we use the average heat transfer rate of the coolant water and moist air to indicate the actual heat transfer rate because of the complete heat transfer.
System components, including the heat exchanger, scroll compressor, and EXV, follow the mass conservation equation described in Equation (1). The first law of thermodynamics is used for energy analysis of ITMS components. Both the refrigerant circuit and two coolant water circuits can be viewed as a control mass system by applying the energy conservation Equation (2), and each component can be viewed as a control volume (CV) system using the steady flow Equation (3).
m ˙ in = m ˙ out
Φ in = Φ out + W out
Φ in + h in m ˙ in = h out m ˙ out + W out
where m ˙ is the mass flow rate, Φ, and P refer to the heat transfer and work transfer rates, respectively, and h represents the specific enthalpy. The subscripts in and out represent from outside to inside and from inside to outside, respectively. In the ITMS, the work transfer rate done by the fluid to outside Wout equals 0. The heat transfer rate and work transfer rate models of the ITMS components are listed in Table 4.
Meanwhile, the physical parameters for the model calculation are listed in Table 5, including their detailed equations and constants. The saturation pressure of water vapor was calculated using the Magnus empirical formula. Given that the water temperature range in this experiment was from −30 to 50 °C, the specific heat capacity of the coolant water was obtained. It is derived using a 2nd order polynomial fit with the least squares method, referring to the American Society of Heating, Refrigerating, and Air-Conditioning Engineers (ASHRAE) handbook [30].

2.4. Performance Criteria and Uncertainty Estimation

In our experiments, the ratio of the cooling and heating capacity of the HVAC to the electrical power consumed by the compressor during the process is defined as COPcool and COPheat. They are essential criteria for studying system performance. The cooling and heating COP are calculated using Equations (4) and (5), respectively.
COP cool = Φ mcHEx , HVAC , AC P comp
COP heat = Φ mcHEx , HVAC , HP P comp
It is not economically feasible to evaluate the uncertainty of Φ and COP by conducting repeated and independent experiments to obtain the uncertainty components introduced by each input parameter due to random effects. Therefore, we assess the uncertainty only by obtaining the uncertainty components introduced by each input variable due to the systematic impacts of the measurement instrument specifications. Simultaneously, the random error caused by the fluctuations after the system reaches a steady state can be neglected. Sources of uncertainty include measurement, indication, and rounding of readings. In this experiment, only the transducer indication error was considered.
The accuracies of various transducers are presented in Table 6, and each parameter obeys a uniform distribution and 100% of the actual value, which falls within the respective accuracy interval; thus, the inclusion factor equals 3 . The standard deviation of the parameters can then be calculated using Equation (6), which can express its standard uncertainty, where u is the standard uncertainty, FSR is the full-scale range, δ is the accuracy, and kP is the inclusion factor. The degrees of freedom of each parameter are infinite because the relative standard deviation of the uncertainty is zero.
u = FSR × δ k P = FSR × δ 3
At the same time, some parameters in this experiment are transmitted and recorded in analog value form; therefore, the accuracy of the DAQ instrument also affects the uncertainty. Since the uncertainties of the transducers and DAQ modules are independent, the final standard uncertainty of the transducer can be obtained via the root sum square method, which is provided in Equation (7), where Uout and Iout are the analog values of the parameter, uDAQ is the uncertainty of the DAQ module, and x / U out and x / I out are the sensitivity coefficients of the parameter x to its analog value. The analog value and its equation can be found in the manuals, while the accuracy of the DAQ module is ±0.1%. The final standard uncertainty results after the calculation are also recorded in Table 6.
u ( x ) = u 2 + x U out u DAQ 2 ( U out ) u 2 + x I out u DAQ 2 ( I out )
It is important to note that the parameters in Table 6 are either independent or weakly correlated. In this experiment, both the derived parameters Φ and COP can be expressed as Equation (8), where y is the derived parameter, and xi is the directly measured parameter. Their compound uncertainties are described as the relative standard uncertainty, which is given in Equation (9), where urel is the relative standard uncertainty, uc(y) is the compound uncertainty, and u(xi) is the standard uncertainty of each input parameter.
y = m x 1 l 1 x 2 l 2 x n l n
u rel ( y ) = u c ( y ) y = i = 1 n [ l i u rel ( x i ) ] 2
Since the compound uncertainties are different under each operating condition, we use the maximum uncertainty in the experiment to estimate them. After checking the t-distribution table, we take the inclusion factor kP as 1.96 under the adequate infinite degrees of freedom and the confidence probability of 95%. The extended uncertainty of Φ and COP are estimated as 4.49% and 5.26%, respectively.

3. Results and Discussion

3.1. Charge Test of R290 and R134a

Charge tests were used to determine the optimal charges of R290 and R134a for the ITMS, directly affecting the system’s performance. We carried out the optimal refrigerant charge tests of the ITMS under HP mode, fixing the compressor speed at 4000 rpm and maintaining the EXV opening at 37.5%.
Figure 6a and Figure 7a show the results of heat transfer rate (Φheat) and heating COP (COPheat) with different Rc. It can be seen that there is a slight difference in the parameters around the R290 charge range of 450 g, and a slight difference in the parameters around the R134a charge near 900 g. The COP of the R290 varies from 1.14 to 1.91 and reaches its maximum at its Rc of 450 g. The COP of the R134a varies from 0.74 to 1.48 and reaches its maximum at its Rc of 900 g. Meanwhile, the Φheat keeps rising as Rc increases, but the growth decreases. And Figure 6b and Figure 7b show that the compressor electric power (Pcomp) keeps increasing as Rc increases; thus, the COPheat cannot increase anymore when Rc exceeds a certain value.
The reason can be explained as follows: when the Rc is too small, the lubricating oil recirculating in the pipes is blocked, and the compressor mechanical efficiency is low; thus, the compressor electrical power cannot be efficiently transferred into refrigerant, and the Φheat is low. With an increase in Rc, the mass flow rate of refrigerant is increased, so the Φheat keeps increasing, and the compressor electric power (Pcomp) increases also. After Rc exceeds the optimal charge, increasing Rc would lead to elevated compressor power, higher friction loss, and reduced isentropic efficiency. At the same time, too high a mass transfer rate would lead to fluid accumulation, which causes heat accumulation in the plate heat exchanger. Both of these reasons are reflected in the decline in COPheat and the narrowing of the growth of the heat transfer rate. Moreover, since R134a has a lower heating capacity than R290, it is easier to have a situation of COPheat < 1.
In summary, it can be determined that in the ITMS, the charge at which the COPheat is maximized is the optimal charge. Therefore, the optimal charge of R290 is 450 g, and the optimal charge of R134a is 900 g in our ITMS. Moreover, it can be found that the optimal charge of R290 is about 50% less than that of R134a. The R290 will have a smaller charge than the R134a.

3.2. R290 Performance Analysis with EXV Opening and Compressor Speed

In this section, the performance of the ITMS was analyzed by adjusting the EXV opening (NEXV) and compressor speed (Ncomp), which have the greatest impact on the performance of the thermal management system. Two typical summer outdoor temperatures and winter outdoor temperatures were selected for analysis, and the results are shown in Figure 8 and Figure 9, respectively.

3.2.1. The Effect of EXV Opening

As shown in Figure 8a and Figure 9a, it can be found that as the NEXV increases, both the Φ and COP initially increase and then decrease.
Under the external environment temperature (text,env) of 35 °C, the optimum opening for the ITMS is 62.5%. Relative to the NEXV of 25%, the cooling capacity can be increased from 1546 W to 2732 W at the Ncomp of 5000 rpm, which means 76.7% growth, while the growth rate of COP is up to 77.7%, with the value ranging from 0.72 to 1.28. And the cooling capacity can be increased from 2804 W to 4600 W at the Ncomp of 7000 rpm, which corresponds to 64% growth; meanwhile, the growth rate of COP is 67.2%, with the value ranging from 0.64 to 1.07.
When the text,env is −7 °C, the optimum value for the ITMS is 50%. Relative to the NEXV of 25%, the heating capacity can be increased from 1708 W to 3046 W at the Ncomp of 5000 rpm, which means 78.3% growth; meanwhile, the growth rate of COP is 64.3%, with the value ranging from 1.81 to 2.98. And the heating capacity is increased from 4687 W to 6075 W at the Ncomp of 7000 rpm, which means 29.6% growth; meanwhile, the growth rate of COP is 20.5%, with the value ranging from 1.95 to 2.35.
Meanwhile, as shown in Figure 8b and Figure 9b, the compressor electrical power exhibits almost no change below the optimal NEXV, and slightly decreases when NEXV is over the optimum value. It indicates that Pcomp is not sensitive to changes in the NEXV.
The reason can be explained as follows: the pressure drop is large and mass flow rate is small when NEXV is small, therefore, the Φ is low. As the NEXV increases, the cross-sectional area increases, so the mass flow rate increases, which leads to a higher Φ. When the NEXV is larger than optimum value, the expansion of the refrigerant is insufficient, thus the heat transfer is not sufficient; therefore, the Φ would decrease. Since the Pcomp is slightly changed, the COP follows the same trend as Φ.

3.2.2. The Effect of Compressor Speed

The compressor speed is also a critical parameter for the ITMS, as shown in Figure 8b and Figure 9b. As the compressor speed increases, the compressor power (Pcomp) increases significantly. The greater suction refrigerant mass can explain this phenomenon, because too much working fluid involved in compression can lead to more friction loss and lower isentropic efficiency. Thus, the Pcomp is higher.
As shown in Figure 8a and Figure 9a, it is demonstrated that whether in heating or cooling mode, the Ncomp affects the system in a way that maintains one trend, i.e., as the speed rises, the Φ increases, but the COP decreases. The higher Φ can be explained by faster working fluid, i.e., the more working fluid flows per unit time, the stronger the heat exchange capacity carried. The lower COP can be explained by the faster growth of Pcomp, but slower growth of Φ.
The closer the expansion valve opening is to its optimal value, the more pronounced the decrease in COP will be due to the increase in compressor speed. Similarly, at 5000 to 7000 rpm variations in Ncomp, when the text,env is 35 °C, the reduction rate of COP is as high as 16.4% at an NEXV of 62.5%, while reduction rate of COP is only 12.3% at an NEXV of 37.5%. When the text,env is −7 °C, the reduction rate of COP is as high as 21.1% at an NEXV of 50%, while the reduction rate of COP is only 12.8% at an NEXV of 37.5%.

3.3. Performance Comparison Between R290 and R134a

The purpose of this section is to explore the differences in cooling and heating performance in the ITMS between R290 and R134a and investigate the effect of changes in performance with variations in external environment temperature (text,env).
With the compressor speed fixed at 7000 rpm, Figure 10, Figure 11, Figure 12, and Figure 13 show the heat transfer and COP curves of R290 and R134a at text,env of 43 °C, 35 °C, 0 °C, and −7 °C, respectively. It can be found that in our ITMS, the R134a and R290 maintain the same regularity in performance. Therefore, we can use Figure 14 to show the optimal performance comparison of R290 and R134a at different text,env, i.e., the performance at the optimal expansion valve opening.
The results show that when the text,env decreases in the cooling mode, the COP will increase, and the situation of COP > 1 will appear at text,env of 35 °C. This phenomenon is attributed to the decline in condensing temperature. At the same time, the Φ will decrease, but the maximum value of Φ is almost unchanged, which is owing to the increased COP. Once the environment temperature increases in the heating mode, both the COP and Φ will increase, which is attributed to the increase in evaporating temperature.
As shown in Figure 14, it indicates that R290 performs better than R134a, which is reflected in a higher COP in heating mode, higher heat transfer rate in heating mode, slightly higher heat transfer rate in cooling mode, and slightly lower COP in cooling mode. And the lower the temperature, the more pronounced this change is, and the more pronounced the difference between R290 and R134a.
As shown in Figure 10 and Figure 11, the difference between R290 and R134a would be gradually reduced along the direction to the maximum COP. This indicates that the two have approximately the same cooling performance under the optimal matching of EXV.
Figure 15 and Figure 16 show the EXV opening results for HP mode under text,env of −20 °C and −30 °C, respectively. It shows that R290 can be operated at text,env of −20 °C with COP > 1. However, although it can be operated at −30 °C, the COP is too low.
This section does not compare R290 and R134a at −20 °C and −30 °C. The reason is that R134a cannot absorb heat from the environment for the HP cycle in such conditions. The reasonable explanation is R134a itself has a boiling point of −26.1 °C, so the coolant water outlet of the plate heat exchanger chiller is higher than the environment temperature; thus, it is more challenging to realize the low-temperature heating.
In a summary, R290 has much better heating performance than R134a under the optimal matching of EXV. The COP of R290 is up to 2.51 under text,env of 0 °C at the Ncomp of 7000 rpm, while the value of R134a is only 1.68 under the same condition. The COP of R290 is up to 2.35 under text,env of −7 °C at the Ncomp of 7000 rpm, while the value of R134a is only 1.51 in the same condition. Especially at the Ncomp of 5000 rpm, the COP of R290 is up to 3.17, 2.98, 1.22, and 0.74 under text,env of 0 °C, −7 °C, −20 °C, and −30 °C, respectively.

4. Conclusions

This paper proposes an indirect integrated thermal management system for EVs, which is suitable for R290 refrigerants. The heat transfer rate and coefficient of performance have been modeled. The charge impact on working performance and the influence of EXV opening and compressor speed on R290 were studied for the ITMS. Meanwhile, we compared the performance between R290 and R134a under different external environment temperatures. From the above discussion, the conclusions can be reached as follows:
(1)
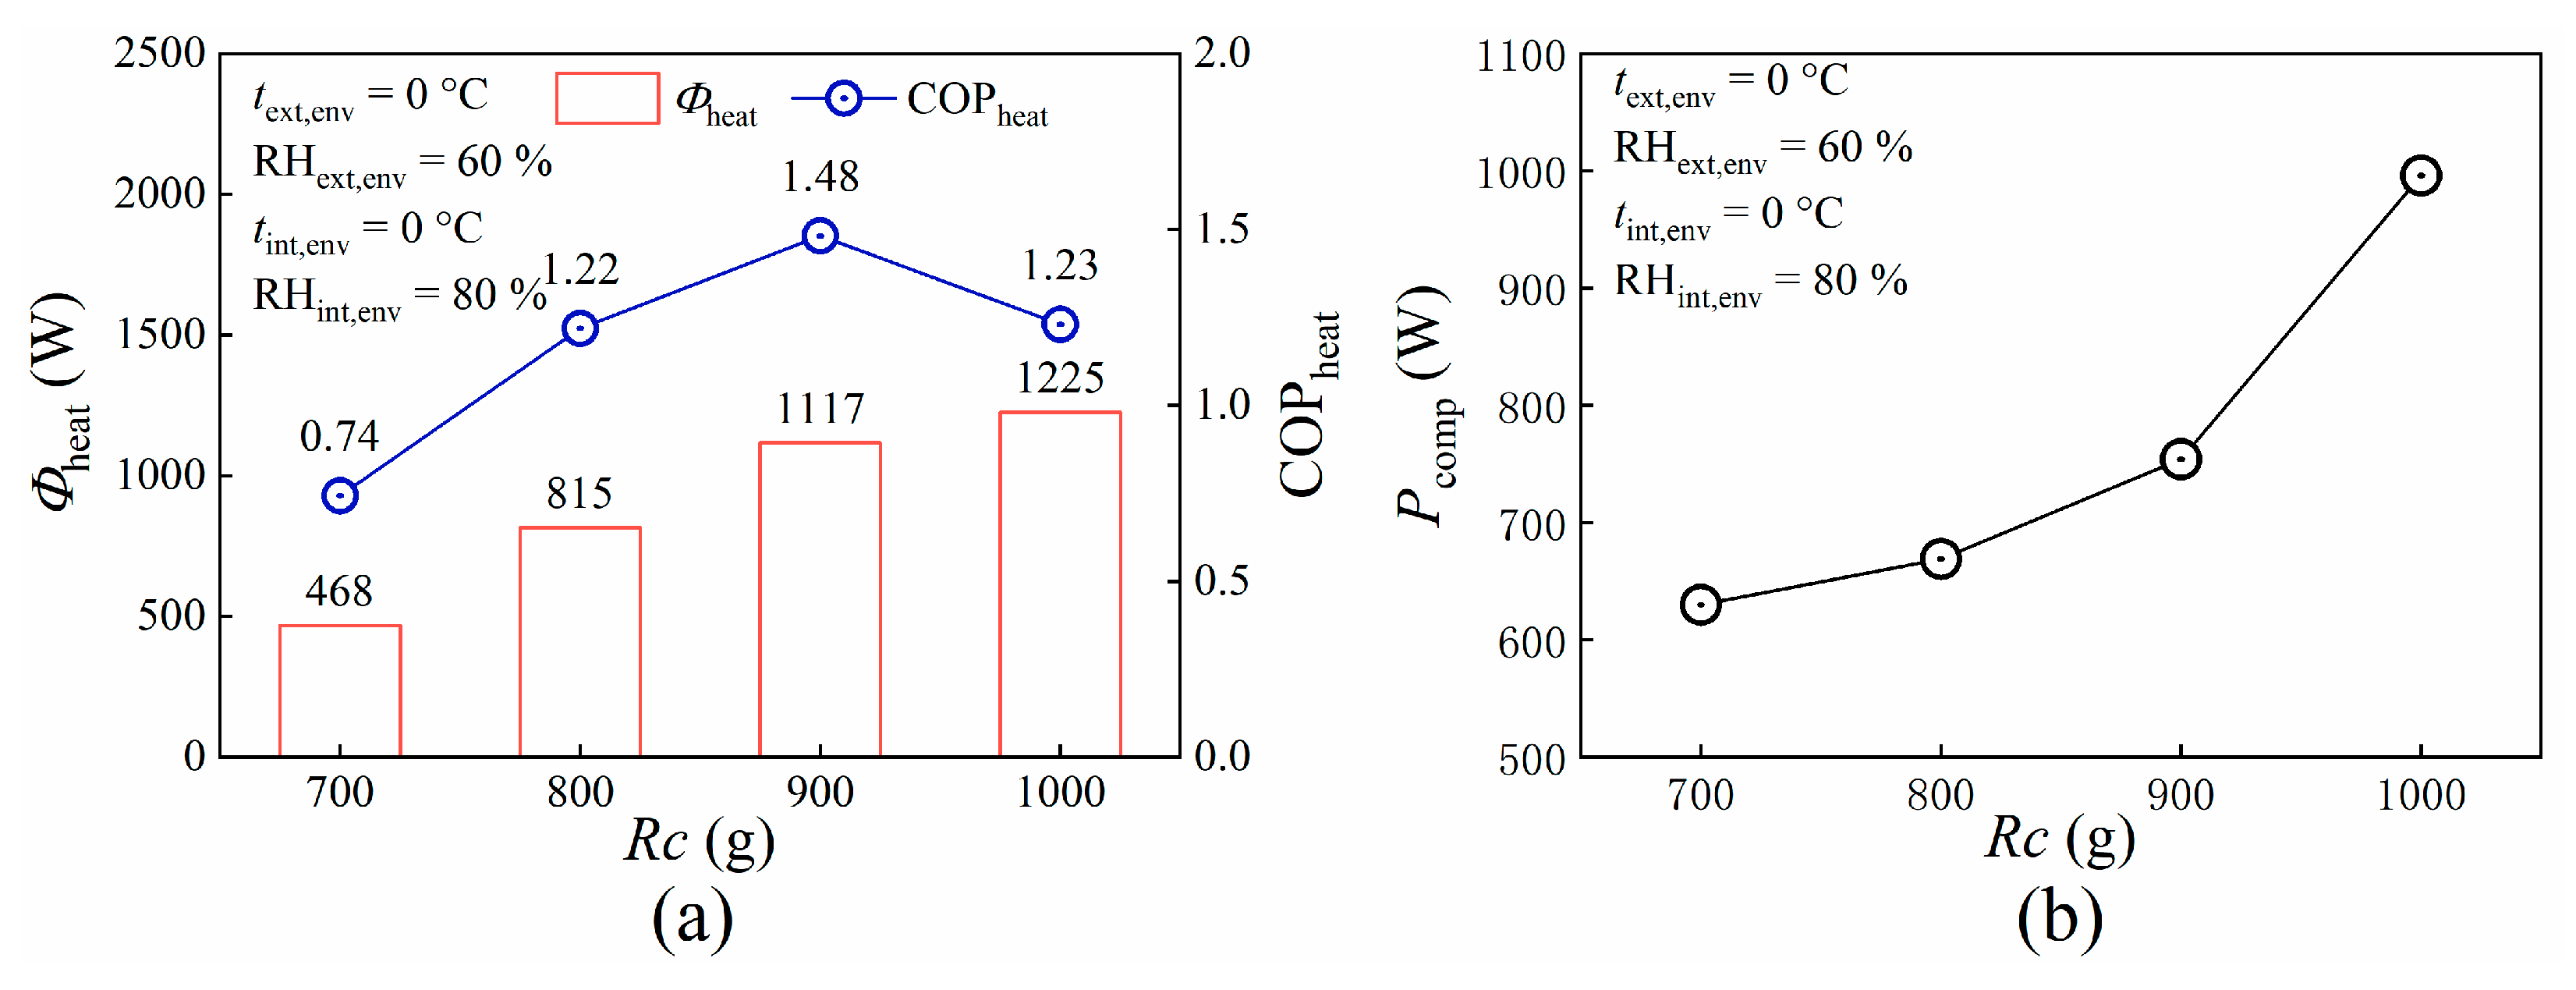
The optimal charge of R290 and R134a are 450 g and 900 g at HP mode under an external temperature of 0 °C, respectively. The results showed that R290 has a lower refrigerant charge than R134a. And the heat transfer rate keeps increasing as the refrigerant charge increases, but the growth decreases. And the compressor electric power keeps increasing with increases in refrigerant. With the increase in the charge, the COP first increased and then decreased.
(2)
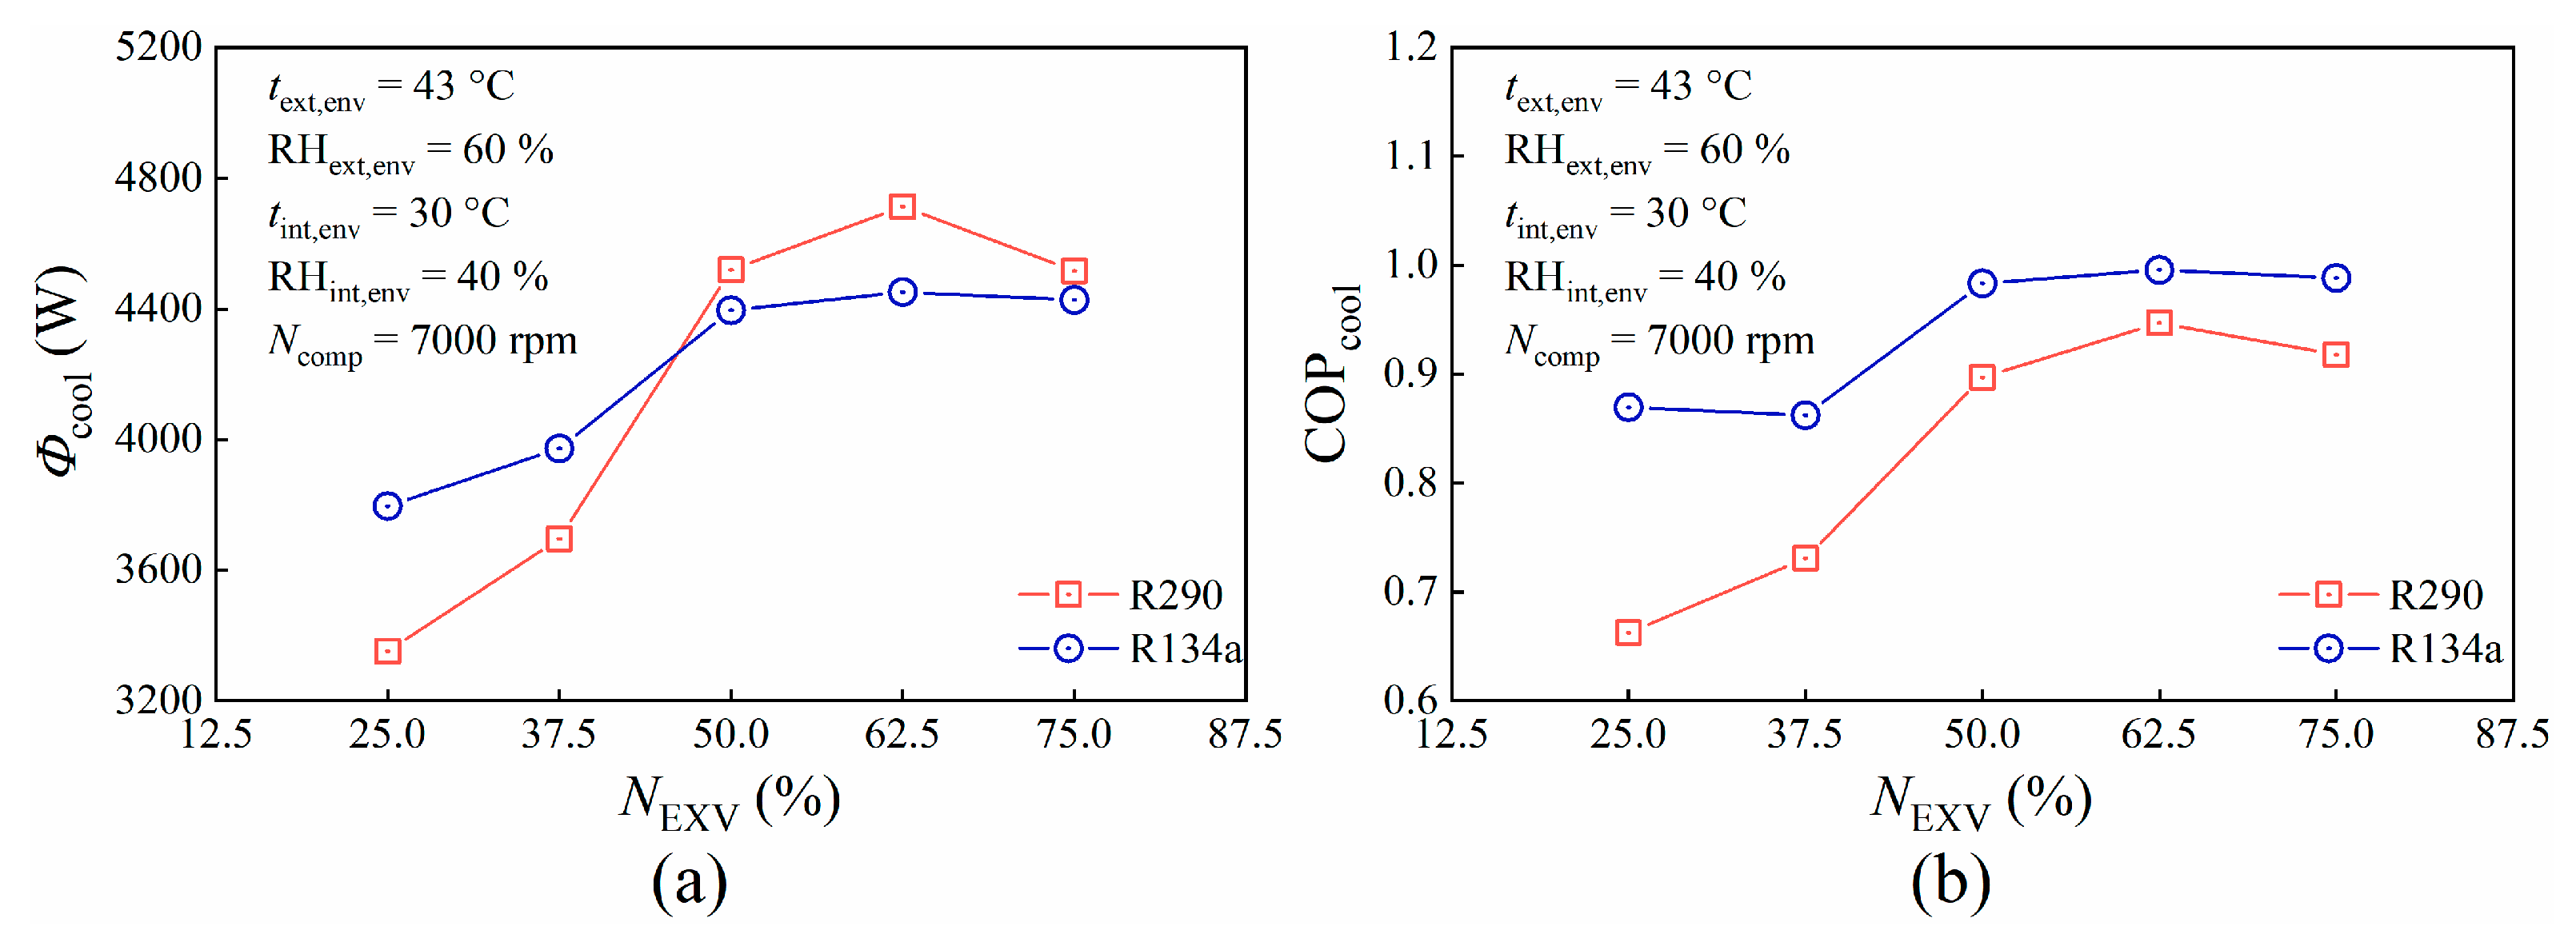
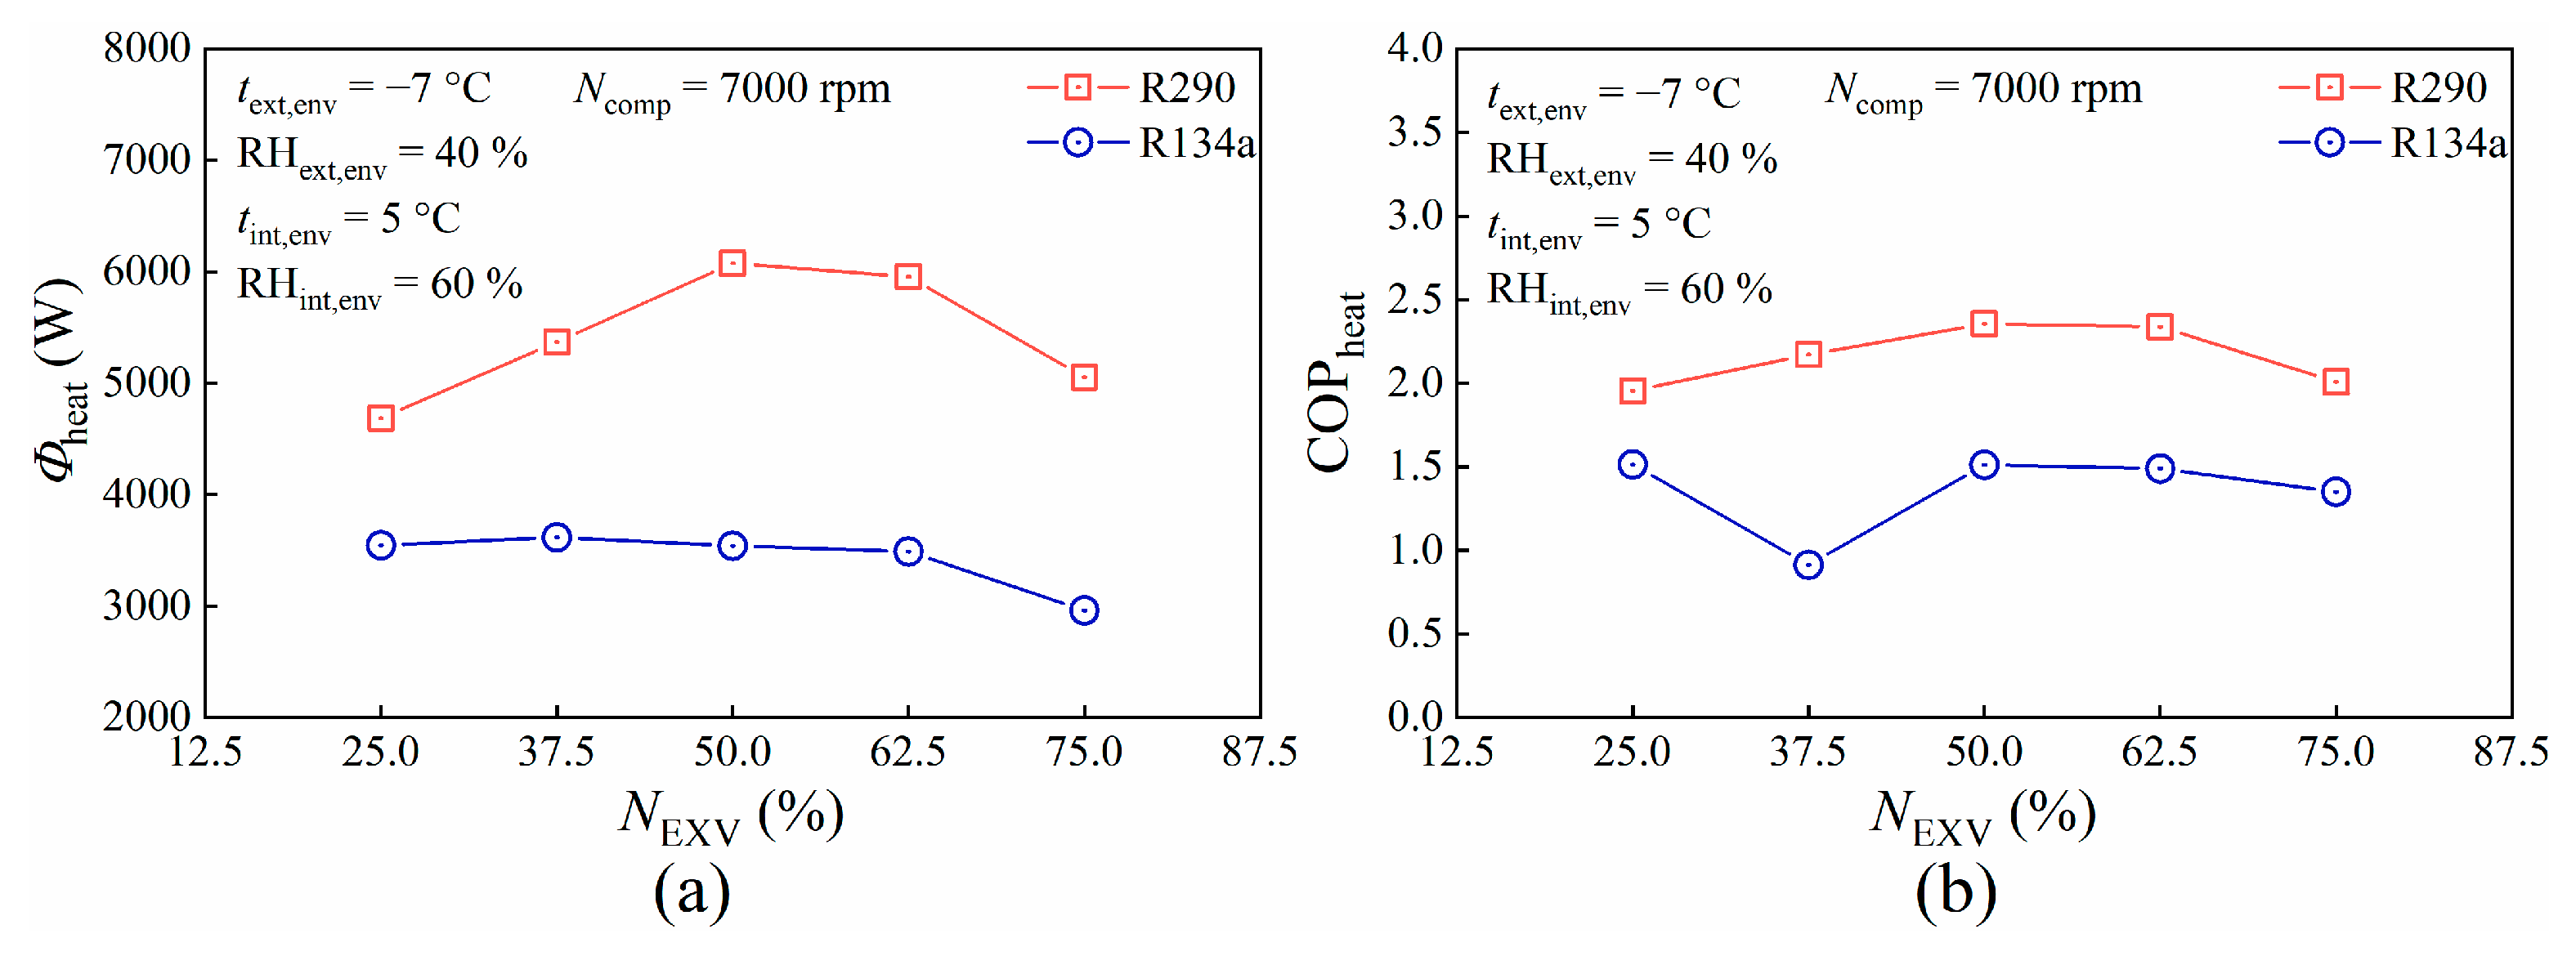
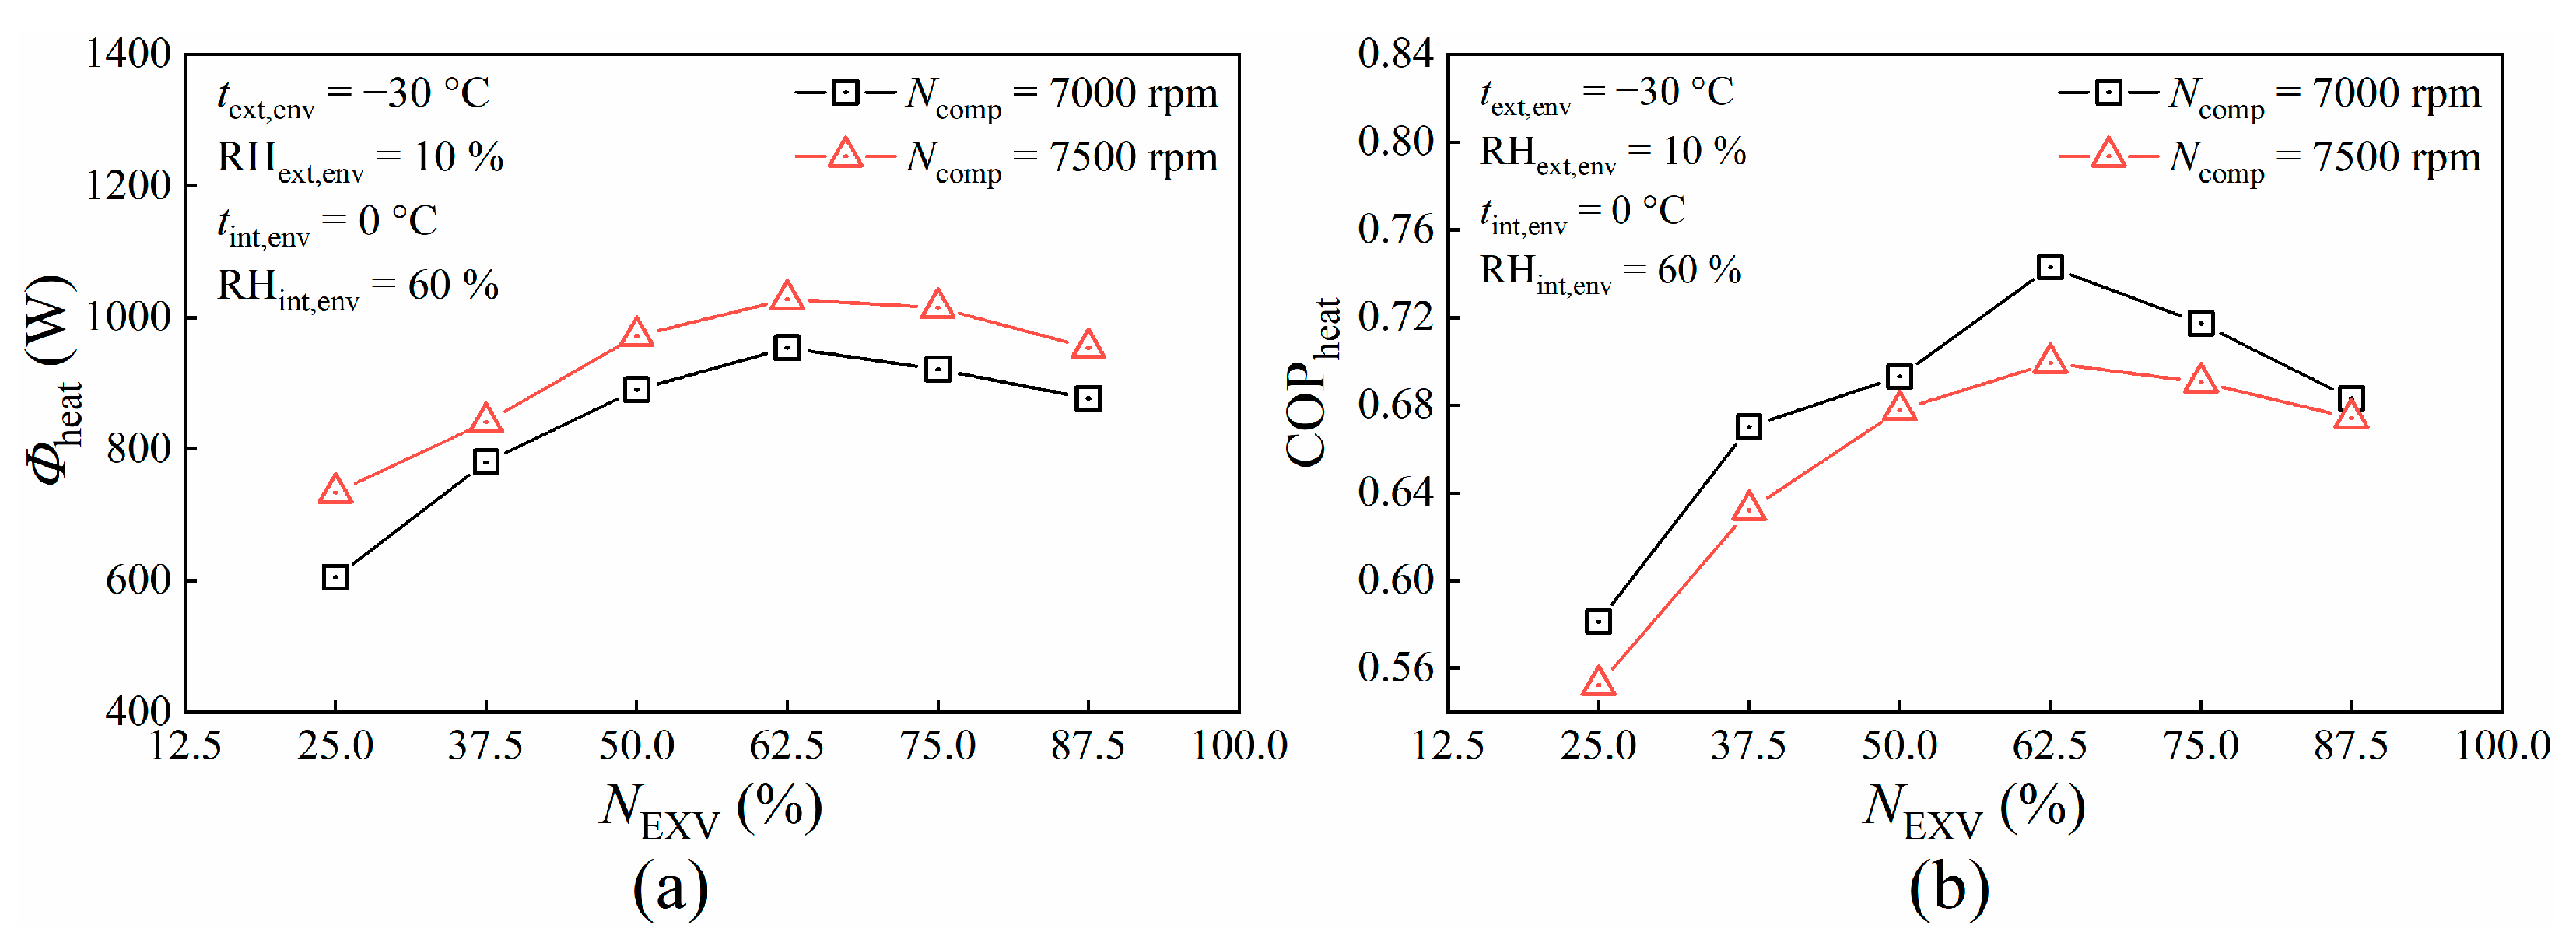
EXV opening and compressor speed have significant influence on performance. The compressor electrical power slightly changes with variations in EXV opening, while it strongly increases when the compressor speed increases. And as the EXV opening increases, both the heat transfer rate and COP initially increase and then decrease. And as the compressor speed increases, the heat transfer rate would increase and COP would decrease. Under the external environment temperature of 35 °C, the optimum opening for the ITMS is 62.5%, and when the external environment temperature is −7 °C, the optimum value for the ITMS is 50%. Furthermore, the closer the EXV opening is to its optimal value, the more pronounced the decrease in COP will be due to the increase in compressor speed.
(3)
Whether in heating or cooling mode, R290 performs better than R134a. This is reflected in the higher COP and heat transfer rate in heating mode and a slightly lower COP but slightly higher heat transfer rate in cooling mode. Meanwhile, in our ITMS, under HP mode, the system equipped with R134a can no longer absorb heat from the environment under temperatures of −20 °C and −30 °C. However, the system equipped with R290 can reach a COP of 1.22 under an environment temperature of −20 °C and can absorb heat from the air at −30 °C, but the COP will be as low as 0.74.
In future research, we can use PTC heating or waste heat recovery from the electric motor to continue analyzing the static performance of R290 under a low-temperature environment. And dynamic characteristics studies considering the driving cycle, such as a control strategy based on this system architecture on EVs, are worthwhile.

Author Contributions

Conceptualization, S.X. and M.W.; data curation, Z.L. and J.Z.; funding acquisition, S.X. and M.W.; investigation, Z.L.; methodology, Z.L. and J.Z.; project administration, S.X.; resources, Z.L.; software, Y.Z.; supervision, M.W.; validation, Z.L., J.Z. and Y.Z.; visualization, Z.L.; writing—original draft, Z.L.; writing—review and editing, S.X. and J.Z. All authors have read and agreed to the published version of the manuscript.

Funding

This research was funded by Zhejiang Province’s “Spearhead and Leading Goose + X” Research and Development Breakthrough Plan, grant no. 2024C01229, and Zhejiang Province’s “Spearhead and Leading Goose” Research and Development Key Program, grant no. 2023C01239. The additional support received from Anhui Jianghuai Automobile Group Corp., Ltd., is greatly appreciated.

Data Availability Statement

Data are contained within the article.

Conflicts of Interest

Author Min Wen was employed by the company Anhui Jianghuai Automobile Group Corp., Ltd. The remaining authors declare that the research was conducted in the absence of any commercial or financial relationships that could be construed as a potential conflict of interest.

Abbreviations

  • Nomenclature
Aarea (m2)
cpspecific heat capacity (kJ·kg−1·K−1)
ffunction of input parameter
hspecific enthalpy (kJ·kg−1)
kPinclusion factor under confidence
m ˙ mass flow rate (kg·s−1)
Mmolar mass (g·mol−1)
Ncompcompressor rotation speed (r·min−1)
NEXVEXV opening (%)
ppressure (kPa)
Pelectric power (W)
Qvolumetric flow rate (m3·s−1)
Rgas constant (J·kg−1·K−1)
Rcrefrigerant charge (g)
t (T)temperature (°C or K)
Uvoltage (V)
ustandard uncertainty
vvelocity (m·s−1)
Wwork transfer rate (W)
xinput parameter
yderived parameter
  • Greek letters
γlatent heat of vaporization of water (kJ·kg−1)
δtransducer accuracy (%)
ρdensity (kg·m−3)
Φheat transfer rate (W)
  • Subscripts
ccompound
chillchiller
compcompressor
condcondenser
coolcooling mode
dadry air
envenvironment
extexternal
heatheating mode
ininside
mamoist air
mcHExmicro-channel parallel flow heat exchanger
outoutside
pHExplate heat exchanger
pfHExparallel flow heat exchanger
intinternal
radradiator
relrelative
satsaturation
wcoolant water
wvwater vapor
0reference state
  • Acronyms
ACair conditioning
AHabsolute humidity
BCbattery cooling
BTMSbattery thermal management system
COPcoefficient of performance
DAQdata acquisition
EVelectric vehicle
EMCTMSelectrical motor thermal management system
EVTMSelectric vehicle thermal management system
ITMSintegrated thermal management system
EXVelectronic expansion valve
FSRfull-scale range
GWPglobal warmup potentiality
HPheat pump
HExheat exchanger
HVACheating, ventilation, and air conditioning
MCmotor cooling
ODPozone depletion potential
RHrelative humidity
W-PTCwater-positive temperature coefficient

References

  1. Baskovic, U.; Lorenz, M.; Butala, V. Adiabatic flow simulation in an air-conditioned vehicle passenger compartment. Int. J. Simul. Model 2014, 13, 42–53. [Google Scholar] [CrossRef]
  2. Lajunen, A.; Yang, Y.; Emadi, A. Review of Cabin Thermal Management for Electrified Passenger Vehicles. IEEE Trans. Veh. Technol. 2020, 69, 6025–6040. [Google Scholar] [CrossRef]
  3. Ahmadi, P. Environmental impacts and behavioral drivers of deep decarbonization for transportation through electric vehicles. J. Clean Prod. 2019, 225, 1209–1219. [Google Scholar] [CrossRef]
  4. Ji, H.; Pei, J.; Cai, J.; Ding, C.; Guo, F.; Wang, Y. Review of Recent Advances in Transcritical CO2 Heat Pump and Refrigeration Cycles and Their Development in the Vehicle Field. Energies 2023, 16, 4011. [Google Scholar] [CrossRef]
  5. Lv, R.; Li, Z.; Wang, Y.; Li, M. Heating performance of heat pump air conditioning system for battery electric vehicle with different refrigerants. Proc. Inst. Mech. Eng. Part D-J. Automob. Eng. 2024, 238, 702–718. [Google Scholar] [CrossRef]
  6. Qi, Z. Advances on air conditioning and heat pump system in electric vehicles—A review. Renew. Sustain. Energy Rev. 2014, 38, 754–764. [Google Scholar] [CrossRef]
  7. Xue, Y.; Diao, X.; Li, X. Heat management system of electric vehicle based on heat pump and energy recovery of removable battery. Therm. Sci. 2023, 27, 1215–1221. [Google Scholar] [CrossRef]
  8. Qin, F.; Xue, Q.; Albarracin Velez, G.M.; Zhang, G.; Zou, H.; Tian, C. Experimental investigation on heating performance of heat pump for electric vehicles at −20 °C ambient temperature. Energy Convers. Manag. 2015, 102, 39–49. [Google Scholar] [CrossRef]
  9. Park, M.; Kim, S. Heating Performance Enhancement of High Capacity PTC Heater with Modified Louver Fin for Electric Vehicles. Energies 2019, 12, 2900. [Google Scholar] [CrossRef]
  10. Min, H.; Zhang, Z.; Sun, W.; Min, Z.; Yu, Y.; Wang, B. A thermal management system control strategy for electric vehicles under low-temperature driving conditions considering battery lifetime. Appl. Therm. Eng. 2020, 181, 13. [Google Scholar] [CrossRef]
  11. Zou, H.; Wang, W.; Zhang, G.; Qin, F.; Tian, C.; Yan, Y. Experimental investigation on an integrated thermal management system with heat pipe heat exchanger for electric vehicle. Energy Conv. Manag. 2016, 118, 88–95. [Google Scholar] [CrossRef]
  12. Tian, Z.; Gu, B. Analyses of an integrated thermal management system for electric vehicles. Int. J. Energy Res. 2019, 43, 5788–5802. [Google Scholar] [CrossRef]
  13. Zhang, Z.; Wang, J.; Feng, X.; Chang, L.; Chen, Y.; Wang, X. The solutions to electric vehicle air conditioning systems: A review. Renew. Sustain. Energy Rev. 2018, 91, 443–463. [Google Scholar] [CrossRef]
  14. Zhang, N.; Lu, Y.; Ouderji, Z.H.; Yu, Z. Review of heat pump integrated energy systems for future zero-emission vehicles. Energy 2023, 273, 127101. [Google Scholar] [CrossRef]
  15. Ahn, J.; Lee, J.; Baek, C.; Kim, Y. Performance improvement of a dehumidifying heat pump using an additional waste heat source in electric vehicles with low occupancy. Energy 2016, 115, 67–75. [Google Scholar] [CrossRef]
  16. Li, K.; Shi, L.; Zhang, Y.; Yao, Y.; Zhang, C.; Tian, H.; Shu, G. Study on electric vehicle thermal management system using phase change materials and CO2 heat pump waste heat recovery under cold conditions. Appl. Therm. Eng. 2024, 252, 16. [Google Scholar] [CrossRef]
  17. Tian, Z.; Gu, B.; Gao, W.; Zhang, Y. Performance evaluation of an electric vehicle thermal management system with waste heat recovery. Appl. Therm. Eng. 2020, 169, 11. [Google Scholar] [CrossRef]
  18. Zhu, Z.; Zhang, Y.; Chen, A.; Chen, J.; Wu, Y.; Wang, X.; Fei, T. Review of integrated thermal management system research for battery electrical vehicles. J. Energy Storage 2025, 106, 114662. [Google Scholar] [CrossRef]
  19. Yadav, S.; Liu, J.; Kim, S. A comprehensive study on 21st-century refrigerants-R290 and R1234yf: A review. Int. J. Heat Mass Transf. 2022, 182, 18. [Google Scholar] [CrossRef]
  20. Lawrence, P. Technology-transfer funds and the law-recent amendments to the montreal protocol on substances that deplete the ozone-layer. J. Environ. Law 1992, 4, 15–27. [Google Scholar] [CrossRef]
  21. Birmpili, T. Montreal Protocol at 30: The governance structure, the evolution, and the Kigali Amendment. C. R. Geosci. 2018, 350, 425–431. [Google Scholar] [CrossRef]
  22. Zhang, L.; Yang, C.; Liu, H.; Du, P.; Gao, H. Theoretical Investigation on the Properties of R744/R290 Mixtures. Procedia Eng. 2017, 205, 1620–1626. [Google Scholar] [CrossRef]
  23. Huang, Y.; Wu, X.; Jing, J. Research on the electric vehicle heat pump air conditioning system based on R290 refrigerant. Energy Rep. 2022, 8, 447–455. [Google Scholar] [CrossRef]
  24. Dhamodharan, P.; Salman, M.; Prabakaran, R.; Kim, S. Comparative analysis of R290 and R1234yf cooling performance in offset strip-fin plate heat exchanger for electric-vehicle battery thermal management. Int. Commun. Heat Mass Transf. 2024, 157, 107708. [Google Scholar] [CrossRef]
  25. Song, P.; An, Z.; Wei, M.; Sun, X.; Zhao, Y.; Dan, D.; Zhang, Y. Cooling performance and optimization of a thermal management system based on CO2 heat pump for electric vehicles. Energy Conv. Manag. 2024, 306, 118299. [Google Scholar] [CrossRef]
  26. Wu, J.; Lin, J.; Zhang, Z.; Chen, Z.; Xie, J.; Lu, J. Experimental investigation of dynamic characteristics of a rotary compressor and its air conditioner using R290 during warm startup. Appl. Therm. Eng. 2017, 125, 1469–1477. [Google Scholar] [CrossRef]
  27. Kim, S.W.; Park, M.; Trisna, B.A.; Lee, J. Comprehensive analysis of refrigerant R134a: Implications for estimating and managing greenhouse gas emissions. Int. J. Refrig. 2024, 158, 135–143. [Google Scholar] [CrossRef]
  28. Hua, T.; Yitai, M.; Minxia, L.; Wei, W. Study on expansion power recovery in CO2 trans-critical cycle. Energy Conv. Manag. 2010, 51, 2516–2522. [Google Scholar] [CrossRef]
  29. Li, K.; Wang, J.; Luo, S.; Wang, Z.; Zhou, X.; Fang, J.; Su, L.; Tu, R. Experimental investigation on combustion characteristics of flammable refrigerant R290/R1234yf leakage from heat pump system for electric vehicles. R. Soc. Open Sci. 2020, 7, 15. [Google Scholar] [CrossRef]
  30. American Society of Heating, Refrigerating, and Air-Conditioning Engineers, Inc. ASHRAE® Handbook—Fundamentals, I-P ed.; American Society of Heating, Refrigeranting and Air-Conditioning Engineers, Inc.: Atlanta, GA, USA, 2021. [Google Scholar]
Figure 1. Schematic of the integrated thermal management system (ITMS).
Energies 18 00802 g001
Figure 2. ITMS under AC or BC or AC + BC modes with four-way valve states: 1-2, 3-4.
Energies 18 00802 g002
Figure 3. ITMS under HP or HP + MC modes with four-way valve states: 1-4, 2-3.
Energies 18 00802 g003
Figure 4. Diagram of the ITMS bench’s controls and DAQ.
Energies 18 00802 g004
Figure 5. Diagrammatic representation of the experimental configuration.
Energies 18 00802 g005
Figure 6. The results of the R290 refrigerant charge test: (a) Φheat and COPheat, (b) Pcomp.
Energies 18 00802 g006
Figure 7. The results of the R134a refrigerant charge test: (a) Φheat and COPheat, (b) Pcomp.
Energies 18 00802 g007
Figure 8. EXV opening and compressor speed results for AC mode at 35 °C of R290: (a) Φcool and COPcool, (b) Pcomp.
Energies 18 00802 g008
Figure 9. EXV opening and compressor speed results for HP mode at −7 °C of R290: (a) Φheat and COPheaet, (b) Pcomp.
Energies 18 00802 g009
Figure 10. EXV opening results for AC mode at 43 °C at 7000 rpm with a comparison of R290 and R134a: (a) Φcool, (b) COPcool.
Energies 18 00802 g010
Figure 11. EXV opening results for AC mode at 35 °C at 7000 rpm with a comparison of R290 and R134a: (a) Φcool, (b) COPcool.
Energies 18 00802 g011
Figure 12. EXV opening results for HP mode at 0 °C at 7000 rpm with a comparison of R290 and R134a: (a) Φheat, (b) COPheat.
Energies 18 00802 g012
Figure 13. EXV opening results for HP mode at −7 °C at 7000 rpm with a comparison of R290 and R134a: (a) Φheat, (b) COPheat.
Energies 18 00802 g013
Figure 14. Performance comparison between R290 and R134a under different external environment temperatures.
Energies 18 00802 g014
Figure 15. EXV opening results for HP mode at −20 °C of R290 with a comparison of Ncomp: (a) Φheat, (b) COPheat.
Energies 18 00802 g015
Figure 16. EXV opening results for HP mode at −30 °C of R290 with a comparison of Ncomp: (a) Φheat, (b) COPheat.
Energies 18 00802 g016
Table 1. The water valve and W-PTC states under different operating modes.
ConditionFour-Way
Valves 1 and 2
Working
Mode
Three-Way
Valve 1
Motor
W-PTC
Battery
W-PTC
Summer3-4, 1-2AC1-2offoff
BC1-3offon
AC + BC1-2 + 1-3offon
AC + MC1-2onoff
BC + MC1-3onon
AC + BC + MC1-2 + 1-3onon
Winter1-4, 2-3HP1-2offoff
1-3offon
1-2 + 1-3offon
HP + MC1-2onoff
1-3onon
1-2 + 1-3onon
Note: - Symbolizes a connection. Abbreviation: AC stands for air conditioning; BC for battery cooling; MC for motor cooling; HP for heat pump; W-PTC for water-positive temperature coefficient.
Table 2. Specifications of the test chamber and ITMS.
CategoryComponentSpecification
Refrigerant CircuitScroll CompressorDischarge: 34 cc
Speed: 800–8500 rpm
Volumetric efficiency: 92%
Rated voltage: high 350–800 V
Plate Hex CondenserPlate area: 0.04 m2
Plate number: 76
Plate Hex ChillerPlate area: 0.04 m2
Plate number: 50
EXVDiameter: 1.65 mm
Gas–liquid SeparatorVolume: 1.3 L
MC BranchRadiatorType: parallel flow
Pass number: 1
Air area: 0.1634 m2
HVAC/BC BranchHVACType: micro-channel parallel flow
Pass number: 2, 2
Tube number: 45, 52
Microchannel number: 14, 2
Air area: 0.016 m2
AnotherPumps 1 and 2Lift head: 140 kPa
Rated flow rate: 21 L·min−1
W-PTC heaters 1 and 2Rated voltage: high 250–460 V
Adjustable power: 0–7 kW
Test chambers 1 and 2ChamberSpace volume: 12.6 m3
CompressorHeat capacity: 0–30 kW
BlowerTemperature range: −65 to 125°C
Humidity range: 20–98%
Abbreviation: Hex stands for heat exchanger; EXV for electronic expansion valve; HVAC for heating, ventilation, and air conditioning.
Table 3. Test conditions.
ParameterAC Condition HP Condition
12 1234
text,env (°C)4335 0−7−20−30
RHext,env (%)6060 40401510
tint,env (°C)3025 10500
RHint,env (%)4040 60606060
RefrigerantR290, R134a
Ncomp (rpm)5000, 7000, 7500
NEXV (%)25%, 37.5%, 50%, 62.5%, 75%, 87.5%
vma,HVAC (m·s−1)6.4
vma,rad (m·s−1)7
Abbreviation: RH stands for relative humidity.
Table 4. Heat transfer rate models of the system components.
CategoryComponentModel for Analyzing Heat Transfer Rates
Refrigerant
Circuit
Plate Hex
Condenser
AC mode:
Φ pHEx , cond , AC = m ˙ w , 1 h w , 1 h w , 2
HP mode:
Φ pHEx , cond , HP = m ˙ w , 1 h w , 1 h w , 2
Plate Hex
Chiller
AC mode:
Φ pHEx , chill , AC = m ˙ w , 3 ( h w , 4 h w , 3 )
HP mode:
Φ pHEx , chill , HP = m ˙ w , 3 ( h w , 4 h w , 3 )
MC
Branch
RadiatorAC mode:
Φ pfHEx , rad , AC = m ˙ w , 14 h w , 13 h w , 14 + m ˙ ma , 18 h ma , 18 h ma , 17 2
HP mode:
Φ pfHEx , rad , HP = m ˙ w , 14 h w , 14 h w , 13 + m ˙ ma , 18 h ma , 17 h ma , 18 2 Φ pfHEx , rad , HP = Φ pHEx , chill , HP
HVAC/BC
Branch
HVACAC mode:
Φ mcHEx , HVAC , AC = m ˙ w , 21 h w , 21 h w , 19 + m ˙ ma , 25 h ma , 24 h ma , 25 2
HP mode:
Φ mcHEx , HVAC , HP = m ˙ w , 21 h w , 19 h w , 21 + m ˙ ma , 25 h ma , 25 h ma , 24 2
Table 5. Physical parameters for computation of heat transfer rate analysis models.
CategoryParameterEquation and Constant Value
Moist air ρ ma (kg·m−3) RH = p wv p wv , sat × 100 %
p wv , sat = 611.2 exp 17.62 t ma t ma + 243.12
Mda = 28.965 (g·mol−1)
Mwv = 18.015 (g·mol−1)
AH ma = M wv M da p wv p ma p wv
Rda = 287.05 (J·kg−1·K−1)
Rwv = 416.5 (J·kg−1·K−1)
ρ ma = 1 + AH ma R da + AH ma R wv p ma T ma
m ˙ ma (kg·s−1) m ˙ ma = A frontal v ma ρ ma
h ma (kJ·kg−1)cp,da = 1.006 (kJ·kg−1·K−1)
cp,wv = 1.86 (kJ·kg−1·K−1)
γ0 = 2501 (kJ·kg−1)
h ma = c p , da t ma + AH ma γ 0 + c p , wv t ma 1 + AH ma
Coolant water ρ w (kg·m−3) ρ w ( t ) = ρ 0 + a t w + b t w 2 ρ 0 = 1081.08 a 1 = 3.3812 × 10 1 a 2 = 2.4338 × 10 3
m ˙ w (kg·s−1) m ˙ w = ρ w Q w
c p , w (kJ·kg−1·K−1) c p , w ( t ) = 3.2034 + 3.856 × 10 3 t w
h w (kJ·kg−1) h w t = 3.2034 t w + 1.928 × 10 3 t w 2
Table 6. Accuracies and uncertainties of experimental transducers.
ParameterInstrumentRangeAccuracyStandard Uncertainty
Water
temperature
(°C)
PT100
temperature
transducer
−40 to 100±0.5%0.41
Water volumetric
flow rate
(L·min−1)
Liquid
turbine flowmeter
0 to 20±1%0.12
Air temperature
(°C)
Temperature
transducer
−40 to 80±1.5%1.04
Air humidity
(%)
Humidity
transducer
0 to 100±2%1.15
Air velocity
(m·s−1)
Velocity
transducer
0 to 15±2%0.17
Compressor
power input (W)
Direct transmission0 to 20,000±0.5%57.73
Disclaimer/Publisher’s Note: The statements, opinions and data contained in all publications are solely those of the individual author(s) and contributor(s) and not of MDPI and/or the editor(s). MDPI and/or the editor(s) disclaim responsibility for any injury to people or property resulting from any ideas, methods, instructions or products referred to in the content.

