Article

Performance and Kinetics of Anaerobic Digestion of Sewage Sludge Amended with Zero-Valent Iron Nanoparticles, Analyzed Using Sigmoidal Models

by
Luiza Usevičiūtė
,
Tomas Januševičius
,
Vaidotas Danila
,
Aušra Mažeikienė
*,
Alvydas Zagorskis
,
Mantas Pranskevičius
and
Eglė Marčiulaitienė
Research Institute of Environmental Protection, Vilnius Gediminas Technical University, LT-10223 Vilnius, Lithuania
*
Author to whom correspondence should be addressed.
Energies 2025, 18(6), 1425; https://doi.org/10.3390/en18061425
Submission received: 7 February 2025 / Revised: 27 February 2025 / Accepted: 10 March 2025 / Published: 13 March 2025
(This article belongs to the Section B: Energy and Environment)

Abstract

:
Sewage sludge was treated with nanoscale zero-valent iron (nZVI) to enhance biogas and methane (CH4) production, and the influence of key parameters on the material’s anaerobic digestion (AD) efficiency was analyzed using sigmoidal mathematical models. In this study, three dosages of nZVI (0.5%, 1.5% and 3%) were added to the anaerobic sludge digestion system to enhance and accelerate the sludge decomposition process. The results showed that cumulative biogas yield after 41 days of digestion increased by 23.9% in the reactor with a nZVI dosage of 1.5%. Correspondingly, the highest CH4 production enhancement by 21.5% was achieved with a nZVI dosage of 1.5% compared to the control. The results indicated that this nZVI dosage was optimal for the AD system, as it governed the highest biogas and CH4 yields and maximum removal of total and volatile solids. Additionally, to predict biogas and CH4 yields and evaluate kinetic parameters, eight kinetic models were applied. According to the results of the modified Gompertz, Richards and logistic models, the nZVI dosage of 1.5% shortened the biogas lag phase from 11 to 5 days compared to the control. The Schnute model provided the best fit to the experimental biogas and CH4 data due to highest coefficients of determination (R2: 0.9997–0.9999 at 1.5% and 3% nZVI dosages), as well as the lowest Akaike’s Information Criterion values and errors. This demonstrated its superior performance compared to other models.

1. Introduction

In municipal wastewater treatment plants (WWTPs), large amounts of sludge are generated during the wastewater treatment process, which accumulates in primary and secondary settling tanks [1,2]. Larger solid particles settle in the primary settling tanks, while biologically degradable materials accumulate in the secondary ones [3,4]. Sludge management accounts for up to 50% of all operational costs of WWTPs, making efficient sludge handling essential to reduce environmental pollution and optimize operational expenses [5].
Sludge management methods include disposal and secondary utilization. Disposal involves sludge incineration for energy production or landfill disposal; however, these methods can have a negative environmental impact [6]. Secondary utilization, such as using sludge in agriculture as fertilizer, requires strict control due to potential contaminants [7]. Therefore, anaerobic sludge digestion is becoming an attractive alternative, enabling a reduction in sludge volume and the production of biogas, which can be used for energy generation [8,9]. Anaerobic sludge digestion is a process where microorganisms break down organic matter present in wastewater sludge without oxygen, producing biogas, the main component of which is methane (CH4) [10,11]. This method reduces sludge volume, stabilizes its composition, and generates renewable energy [12,13]. However, traditional anaerobic digestion (AD) processes have certain drawbacks, such as long processing times (20–30 days) and low organic matter degradation efficiency (30–40%) [9,14].
Despite its advantages, AD faces challenges such as the slow degradation rate of excess activated sludge and insufficient CH4 yield [15,16,17]. Additionally, contaminants present in the sludge can inhibit microbial activity, and hydrogen sulfide (H₂S) formed in the biogas can cause corrosion and require additional cleaning. Therefore, it is necessary to explore ways to improve process efficiency and biogas quality [18,19,20].
To increase CH4 yield and improve biogas quality, various methods for optimizing the AD process are being investigated. These include sludge pretreatment, such as ultrasonic disintegration, thermal treatment, chemical additives, optimization of microbial communities and application of a static magnetic field (SMF) [21,22,23]. Applying an SMF is an effective, innovative, and sustainable approach to enhance the biodegradation of organic matter and biogas production [23]. Additionally, it can serve as a pretreatment for sewage sludge to facilitate precipitation of compounds with fertilizing properties, such as struvite [24]. It is also important to control process parameters, such as temperature, pH, mixing intensity, and hydraulic retention time, to ensure optimal conditions for methanogenic bacteria [25,26,27]. One effective way to enhance the AD process is the addition of specific supplements, such as iron compounds [28]. Iron additives can reduce hydrogen sulfide concentrations in biogas, improve microbial activity, and increase CH4 concentration [29].
Iron is a vital micronutrient, playing a crucial role in enhancing microbial growth [30]. Several studies showed that H2 generated from the corrosion of nZVI stimulates hydrogenotrophic methanogenesis and reduces the oxidation–reduction potential to provide a better anaerobic environment for methanogens [31,32]. Wang et al. [33] also indicated that nZVI addition was beneficial for hydrogenotrophic methanogens rather than acetoclastic methanogens as the relative abundances of the genera Methanobacterium, Methanospirillum and Methanolinea were positively correlated with the nZVI dosages. However, elevated nZVI dosages can have a negative impact on bacterial activity. For example, a study performed by Yang et al. [34] indicated that Fe2⁺ or Fe(OH)+ released from nZVI can react with S2⁻ to form FeS or bind with PO43⁻ to create stable complexes, thus hindering phosphorus uptake by methanogens.
Different studies have shown that the introduction of iron additives enhances the startup phase and the rate at which total solids decompose as the content of volatile solids is directly linked to biogas production. It was shown that sludge treatment with nanoscale zero-valent iron (nZVI) improved the hydrolysis stage and methanogenic activity. For example, research performed by Feng et al. [35] observed an increase in CH4 production up to 43.5% and an increase in activities of several hydrolysis/acidification enzymes up to 0.6/1 times in the presence of zero-valent iron. Other research indicated that iron oxide-based additives can increase CH4 concentration in biogas by up to 8% [36]. Although the number of studies addressing the improvement in biogas quality has been growing recently, there is still a significant lack of recommendations to ensure this process in practice. The AD of wastewater sludge is not fully controlled, and there is a shortage of practically applicable measures to optimize the operation of wastewater treatment plants.
Mathematical models are important tools for understanding and predicting the dynamics of the AD process. They help analyze the impact of various parameters on process efficiency, optimize operating conditions, and predict biogas and CH4 yields [37,38]. For example, modeling and simulation studies indicate that properly selecting process parameters can improve biogas production in plug–flow reactors [39]. Sigmoidal kinetic models have gained significant attention in the study of AD of sewage sludge due to their ability to accurately describe the characteristic S-shaped behavior of cumulative biogas and CH4 production over time. These models, such as the modified Gompertz, Richards and logistic function equations, effectively capture the distinct phases of the AD process, including the initial lag phase, biogas production potential and biogas production rate. Unlike simple first-order or Monod-type models, sigmoidal models account for the adaptation period of microbial communities, substrate availability, and potential inhibitory effects, providing a more realistic representation of the dynamic nature of anaerobic systems. Studies have demonstrated the superior performance of sigmoidal models in fitting experimental biogas production data, with the modified Gompertz model showing high accuracy across various substrates and operational conditions [40,41]. Their flexibility and ease of parameter estimation make them valuable tools for predicting biogas and CH4 yields, assessing process performance, and optimizing operational conditions in sewage sludge digestion processes.
Currently, most studies that have treated sludge with nZVI have primarily used the modified Gompertz model to assess the kinetics of the anaerobic digestion process [42,43,44]. However, there is a notable lack of comprehensive evaluations of AD of sewage sludge treated with nZVI using a variety of other sigmoidal kinetic models. Therefore, the aim of this study was to investigate the sludge digestion process using nZVI additive to enhance biogas yield, CH4 concentration and the overall performance of AD. Eight different sigmoidal models were employed to analyze the kinetic parameters of AD, identify the best-fitting model for biogas and CH4 production data, and determine the optimal dosage of nZVI.

2. Materials and Methods

2.1. Materials

Substrate (a mixture of primary and secondary sludge, SS) and inoculum (anaerobically digested sludge, Inoc.) were collected from a wastewater treatment plant located in Vilnius, Lithuania. The plant treats 120,000 m3 of wastewater daily. The collected substrate and inoculum were stored in stainless steel tanks before the start of the experiments. The characteristics of substrate, inoculum and their mixture are presented in Table 1. The substrate showed high concentrations of total solids (TS), volatile solids (VS) and chemical oxygen demand (COD) (8.52%, 5.14% and 82.9 g/L, respectively), and this proved its high potential for biogas production. Zero-valent iron nanoparticles (NANOFER STAR) in the form of agglomerates were purchased from Nano Iron s.r.o. (Židlochovice, Czech Republic). The nZVI particles were activated by mixing these with deionized water.

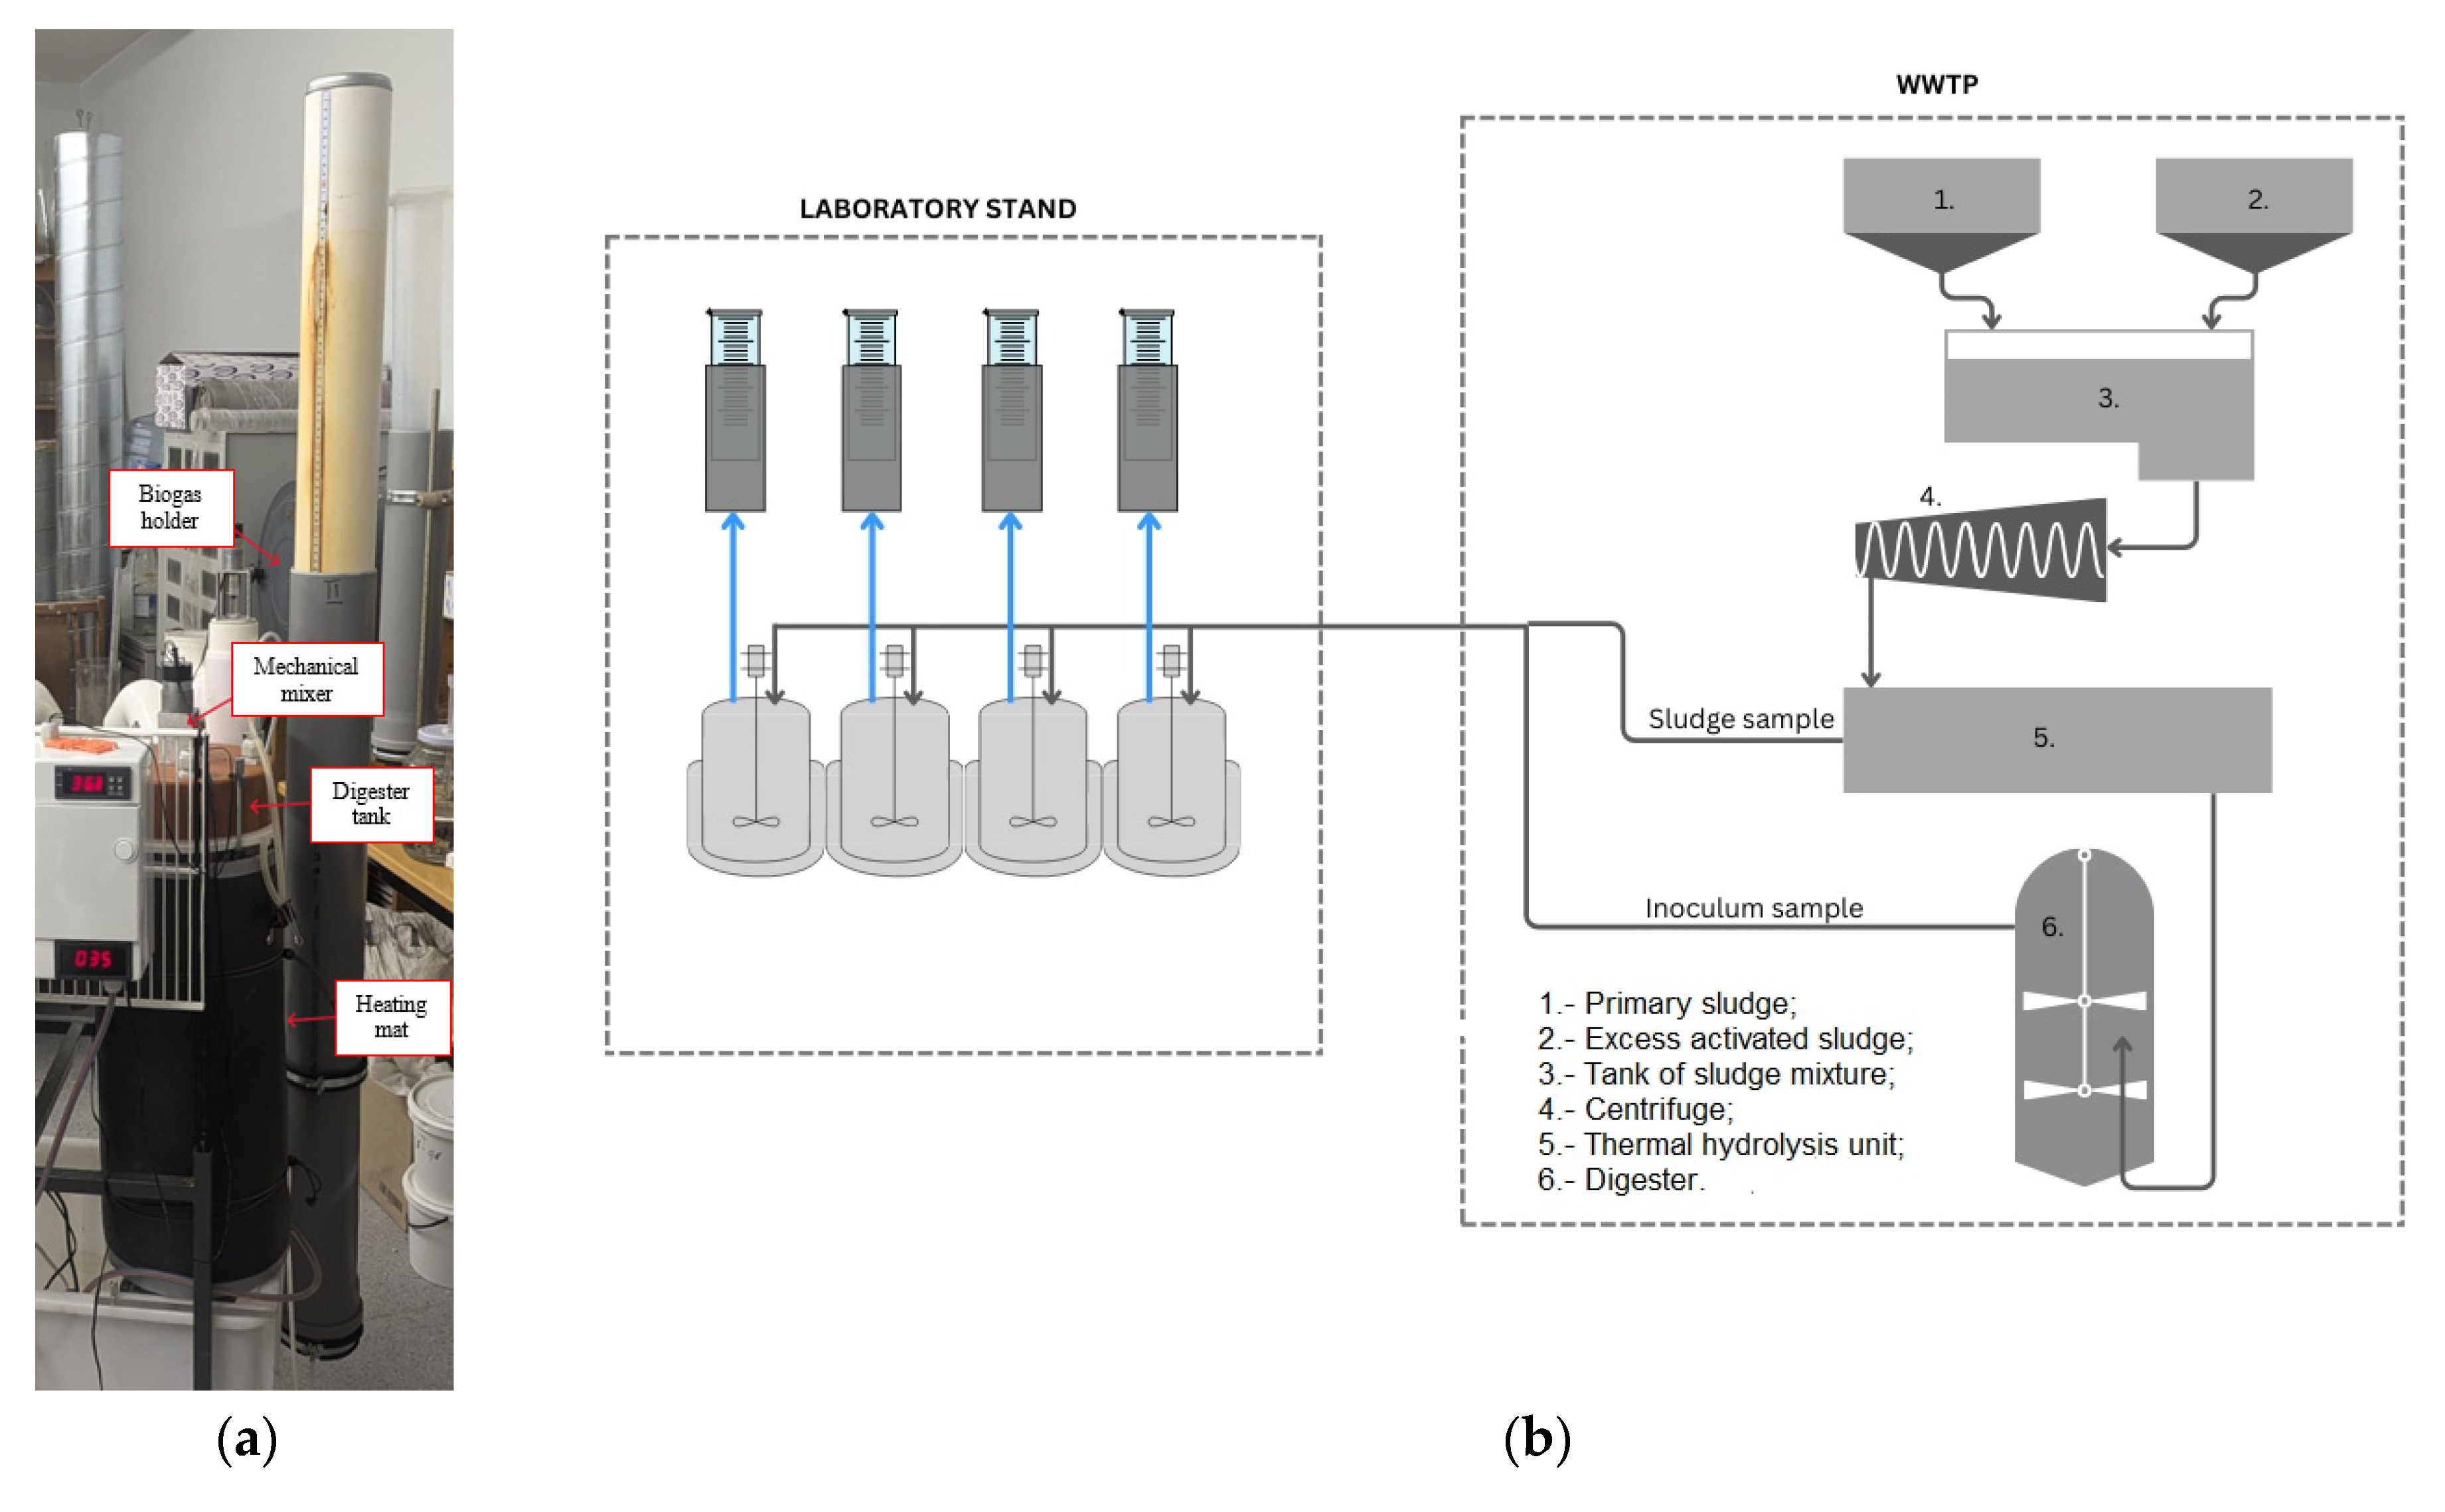
2.2. Experimental Setup

Figure 1 displays the schematic diagram of the experimental AD system used. The experiments were performed in batch mode and mesophilic conditions. The AD system consisted of four reactors, which were constructed using digestion tanks wrapped in heating mats and biogas collection tanks. All reactors were equipped with mechanical mixers with speed control (120 rpm). Additionally, the scheme is supplemented with visual representation of wastewater treatment plant, which was chosen to collect a mixture of primary and secondary sludge, and anaerobically digested sludge material (substrate and inoculum) for the AD experiment.
Each reactor had a total capacity of 17 L, with 14 L as the working volume. To each reactor, 10.5 L of sewage sludge and 3.5 L of inoculum were added to create 3 L of head space. Aliquots of nZVI particles were then added into three reactors (B2, B3 and B4) to reach final concentrations of 0.5%, 1.5% and 3% (based on TS) in the AD systems. The control (blank group without nZVI particles, B1) was subjected to the same procedures. The experimental design is presented in Table 2. After filling the reactors with the respective combination of substrate, inoculum and aliquots of nZVI, the reactors were tightly sealed. Once it was ensured that the reactors were properly sealed, they were placed in a temperature-controlled environment with heating mats and a temperature-controlling device, which was set to a mesophilic temperature of 37 °C ± 1 °C [45]. The amount of produced biogas was measured using the water displacement technique each day for 41 days. The biogas collection system was made up of graduated cylinders positioned upside down inside water-filled containers. This study was carried out until biogas production was completed. The whole experiment was performed in triplicate.

2.3. Analytical Methods and Performance Parameters

Biogas composition (CH4, carbon dioxide and residual other gases in percentage) was analyzed using a calibrated and portable Gas Analyzer (GFM 406, Gas Data Ltd., Coventry, UK). pH was measured with a digital pH meter (SevenMultiTM, Mettler Toledo GmbH, Schwerzenbach, Switzerland). TS and VS were measured by the standard methods and determined by differential weighing after drying at 105 °C and 550 °C, respectively [46,47]. COD was analyzed using a chemical oxygen demand colorimeter (Lovibond MD100, Tintometer GmbH, Dortmund, Germany). Specific biogas/CH4 production in AD is typically represented based on the mass of added VS, serving as a measure of assay’s precision. Specific biogas/CH4 production and the performance of the digestion were calculated according to Equations (1) and (2), respectively [48,49]:
Specific   biogas   or   C H 4 production   ( m l g V S a d d e d ) = Volume   of   biogas / C H 4 Mass   of   added   VS   content ,
Biogas   or   C H 4   ( % ) = ( Biogas / C H 4 ) t r e a t e d ( B i o g a s / C H 4 ) u n t r e a t e d ( B i o g a s / C H 4 ) u n t r e a t e d × 100 ,
where (CH4)treated—CH4 production value obtained for the reactor with nZVI particles; (CH4)untreated—CH4 production value obtained from the control reactor. COD, TS and VS reduction is also usually used to evaluate the reactor performance and stability of the digestate; therefore, the removal efficiencies (%) of COD, TS and VS were calculated according to Equation (3) [50,51]:
C O D R E or   T S R E   or   V S R E   ( % ) = C 0 C t C 0 × 100 ,
where C0—initial COD/TS/VS concentration (g/L); Ct—final COD/TS/VS concentration (g/L).

2.4. Kinetic Simulation

Eight kinetic models, i.e., the Gompertz model (GM), modified Gompertz model (MGM), Richards model (RM), modified Richards model (MRM), logistic model (LM), modified logistic model (MLM), Cone model (CM) and Schnute model (SM), were used to describe the cumulative biogas/CH4 potential and kinetic parameters. A description of these models, their equations and kinetic parameters is presented in Table 3. The kinetic parameters were determined using a cost function aimed at minimizing the residual sum of squares (RSS) between the model-predicted results and the experimentally obtained values. For this calculation, the generalized reduced gradient (GRG) non-linear solver in Microsoft Excel was utilized [52]. The mathematical formula for RSS is provided in Equation (4):
R S S = i = 1 n ( Y i , e x p Y i , c a l ) 2 ,
Generally speaking, all cumulative models can be classified into two types: exponential models (such as first-order, CM) and sigmoidal models (RM, GM, LM in their original or modified form) [53]. Sigmoidal models can be recognized by the inclusion of a lag factor (λ) in their equations, which accounts for the initial delay in growth before the exponential phase begins. The MGM, one of the most commonly used sigmoidal equations, effectively describes the decomposition of simple organic feedstock by utilizing a reverse L-shaped curve and the decomposition of more complex substrates using an S-shaped curve [54]. The MGM is an empirical non-linear regression approach used to characterize cell density during the growth phases of methanogenic bacteria, accounting for both exponential growth rates and the duration of the λ. Previous studies have demonstrated that the MGM equation is a widely used model for predicting biogas and CH4 yields during the degradation of simple organic substrates. The RM incorporates a fourth parameter (the shape factor, v), which enhances its ability to align more closely with the experimental data [55]. RM is almost the same as MRM, which includes the fifth additional parameter (initial biogas/CH4 production, P0). Substituting the growth rate parameter (α) and scaling parameter (β) in the Schnute equation leads to the MRM [56]. Some studies have shown that CM demonstrates the highest performance in accurately modeling CH4 production from co-digestion [40,57]. RM, CM and LM successfully represent S-shape curves, which are typical for complex substrates like those containing fats and lipids [54]. One kinetic parameter, which was described in this study more detailed, is λ, which is a crucial parameter that indicates the effectiveness of AD and can be calculated using different kinetic models (MGM, MLM, RM and MRM).
Table 3. Various kinetic sigmoidal models, their equations and parameters.
ModelEquation Form and Parameter DefinitionReference
Gompertz P t = P m a x × e x p r 0 α × e x p × α t ,
where α: decay constant or growth rate parameter (1/d); r0: initial rate of biogas production (mL/g-VSadded/d).
[55]
Modified Gompertz P ( t ) = P m a x × e x p e x p R m a x × e P m a x × λ t + 1 ,
where P(t): cumulative biogas/CH4 production at time t (mL/g-VSadded); Pmax: maximum production potential of biogas/CH4 (mL/g-VSadded); Rmax: maximum biogas/CH4 production rate (ml/g-VSadded/d); λ: duration of the lag phase (d); t: time of anaerobic digestion (d); e: Euler’s constant, which is equal to 2.7183.
[58]
Richards P t = P m a x × 1 + v × e x p ( 1 + v ) × e x p R m a x P m a x × 1 + v × 1 + 1 v × λ t 1 v ,
where ν: shape factor (dimensionless).
[59]
Modified Richards P ( t ) = P 0 + P m a x × 1 + v × e x p ( 1 + v ) × e x p R m a x P m a x × ( 1 + v ) × ( 1 + 1 v ) × ( λ t ) 1 v ,
where P0: initial biogas/CH4 production (mL/g-VSadded).
[56,60]
Logistic P ( t ) = P m a x 1 + e k ( t t 0 ) ,
where k: specific growth rate constant or reaction rate coefficient (1/d); t0: time at which production rate is the highest (d).
[61]
Modified
logistic
P ( t ) = P m a x 1 + e x p 4 × R m a x × ( λ t ) P m a x + 2 [59]
Cone P t = P m a x 1 + k × t n ,
where n: shape factor (dimensionless); k: hydrolysis rate constant (1/d).
[62]
Schnute P t = P m a x × e x p α t β exp α t β r 0 α + β r 0 ,
where β: scaling parameter controlling the curve shape (dimensionless).
[63]

2.5. Kinetic Model Accuracy Evaluation

Additionally, the coefficient of determination (R2), which is known as a fitness index of the models, root mean square error (RMSE), normalized root mean square error (NRMSE, %), Akaike’s Information Criterion (AIC) and Akaike’s weight were used to statistically compare the data fits obtained by the previously mentioned kinetic models [58]. The R2 and RMSE are two standard criteria, which are used to report the final model performance. The RMSE is commonly used as a standard statistical metric to evaluate the performance of kinetic models. The RMSE measures how much the predicted values deviate from the actual measured values, expressed in the same units as the variable. By normalizing the RMSE (NRMSE), readers can more effectively evaluate the accuracy of the model’s predictions. The AIC is a widely used tool in statistical modeling and is broadly accepted as a criterion for model selection, including selection of kinetic models applied to the biogas production in an AD system [52]. Lower RMSE, NRMSE, AIC values and higher R2 and Akaike’s weight indicate that the model has a better fit. For each model, the R2, RMSE, NRMSE, AIC values and Akaike’s weight were determined using the following equations, respectively [60,64,65,66,67]:
R 2 = 1 Y i , e x p Y i , c a l 2 Y i , e x p Y ¯ 2 ,
R M S E = 1 n i = 1 n Y i , e x p Y i , c a l i 2 ,
N R M S E = R M S E Y m a x Y m i n × 100 ,
A I C = N l n R S S N + 2 K ,
A k a i k e s   w e i g h t = e x p ( Δ A I C 2 ) 1 + e x p ( Δ A I C 2 ) ,
where Yi,exp—observed biogas/CH4 production data point (mL/g-VSadded); Yi,cal—predicted biogas/CH4 production data point (mL/g-VSadded); Ymax—maximum experimental value of biogas/CH4 production (mL/g-VSadded); Ymin—minimum experimental value of biogas/CH4 production (mL/g-VSadded); Y ¯ —mean of the observed biogas/CH4 production data (mL/g-VSadded); N—number of data points; RSS—residual sum of squares; K—number of model parameters; ΔAIC—the relative difference between two AIC values.

2.6. Statistical Analysis

All physical and chemical analyses were conducted three times, and the average values along with the standard errors (SD) were reported. A one-way ANOVA was performed to determine statistical significance between groups, with a p value of less than 0.05 indicating significance [68]. All calculations and graphs were prepared using Microsoft Excel.

3. Results

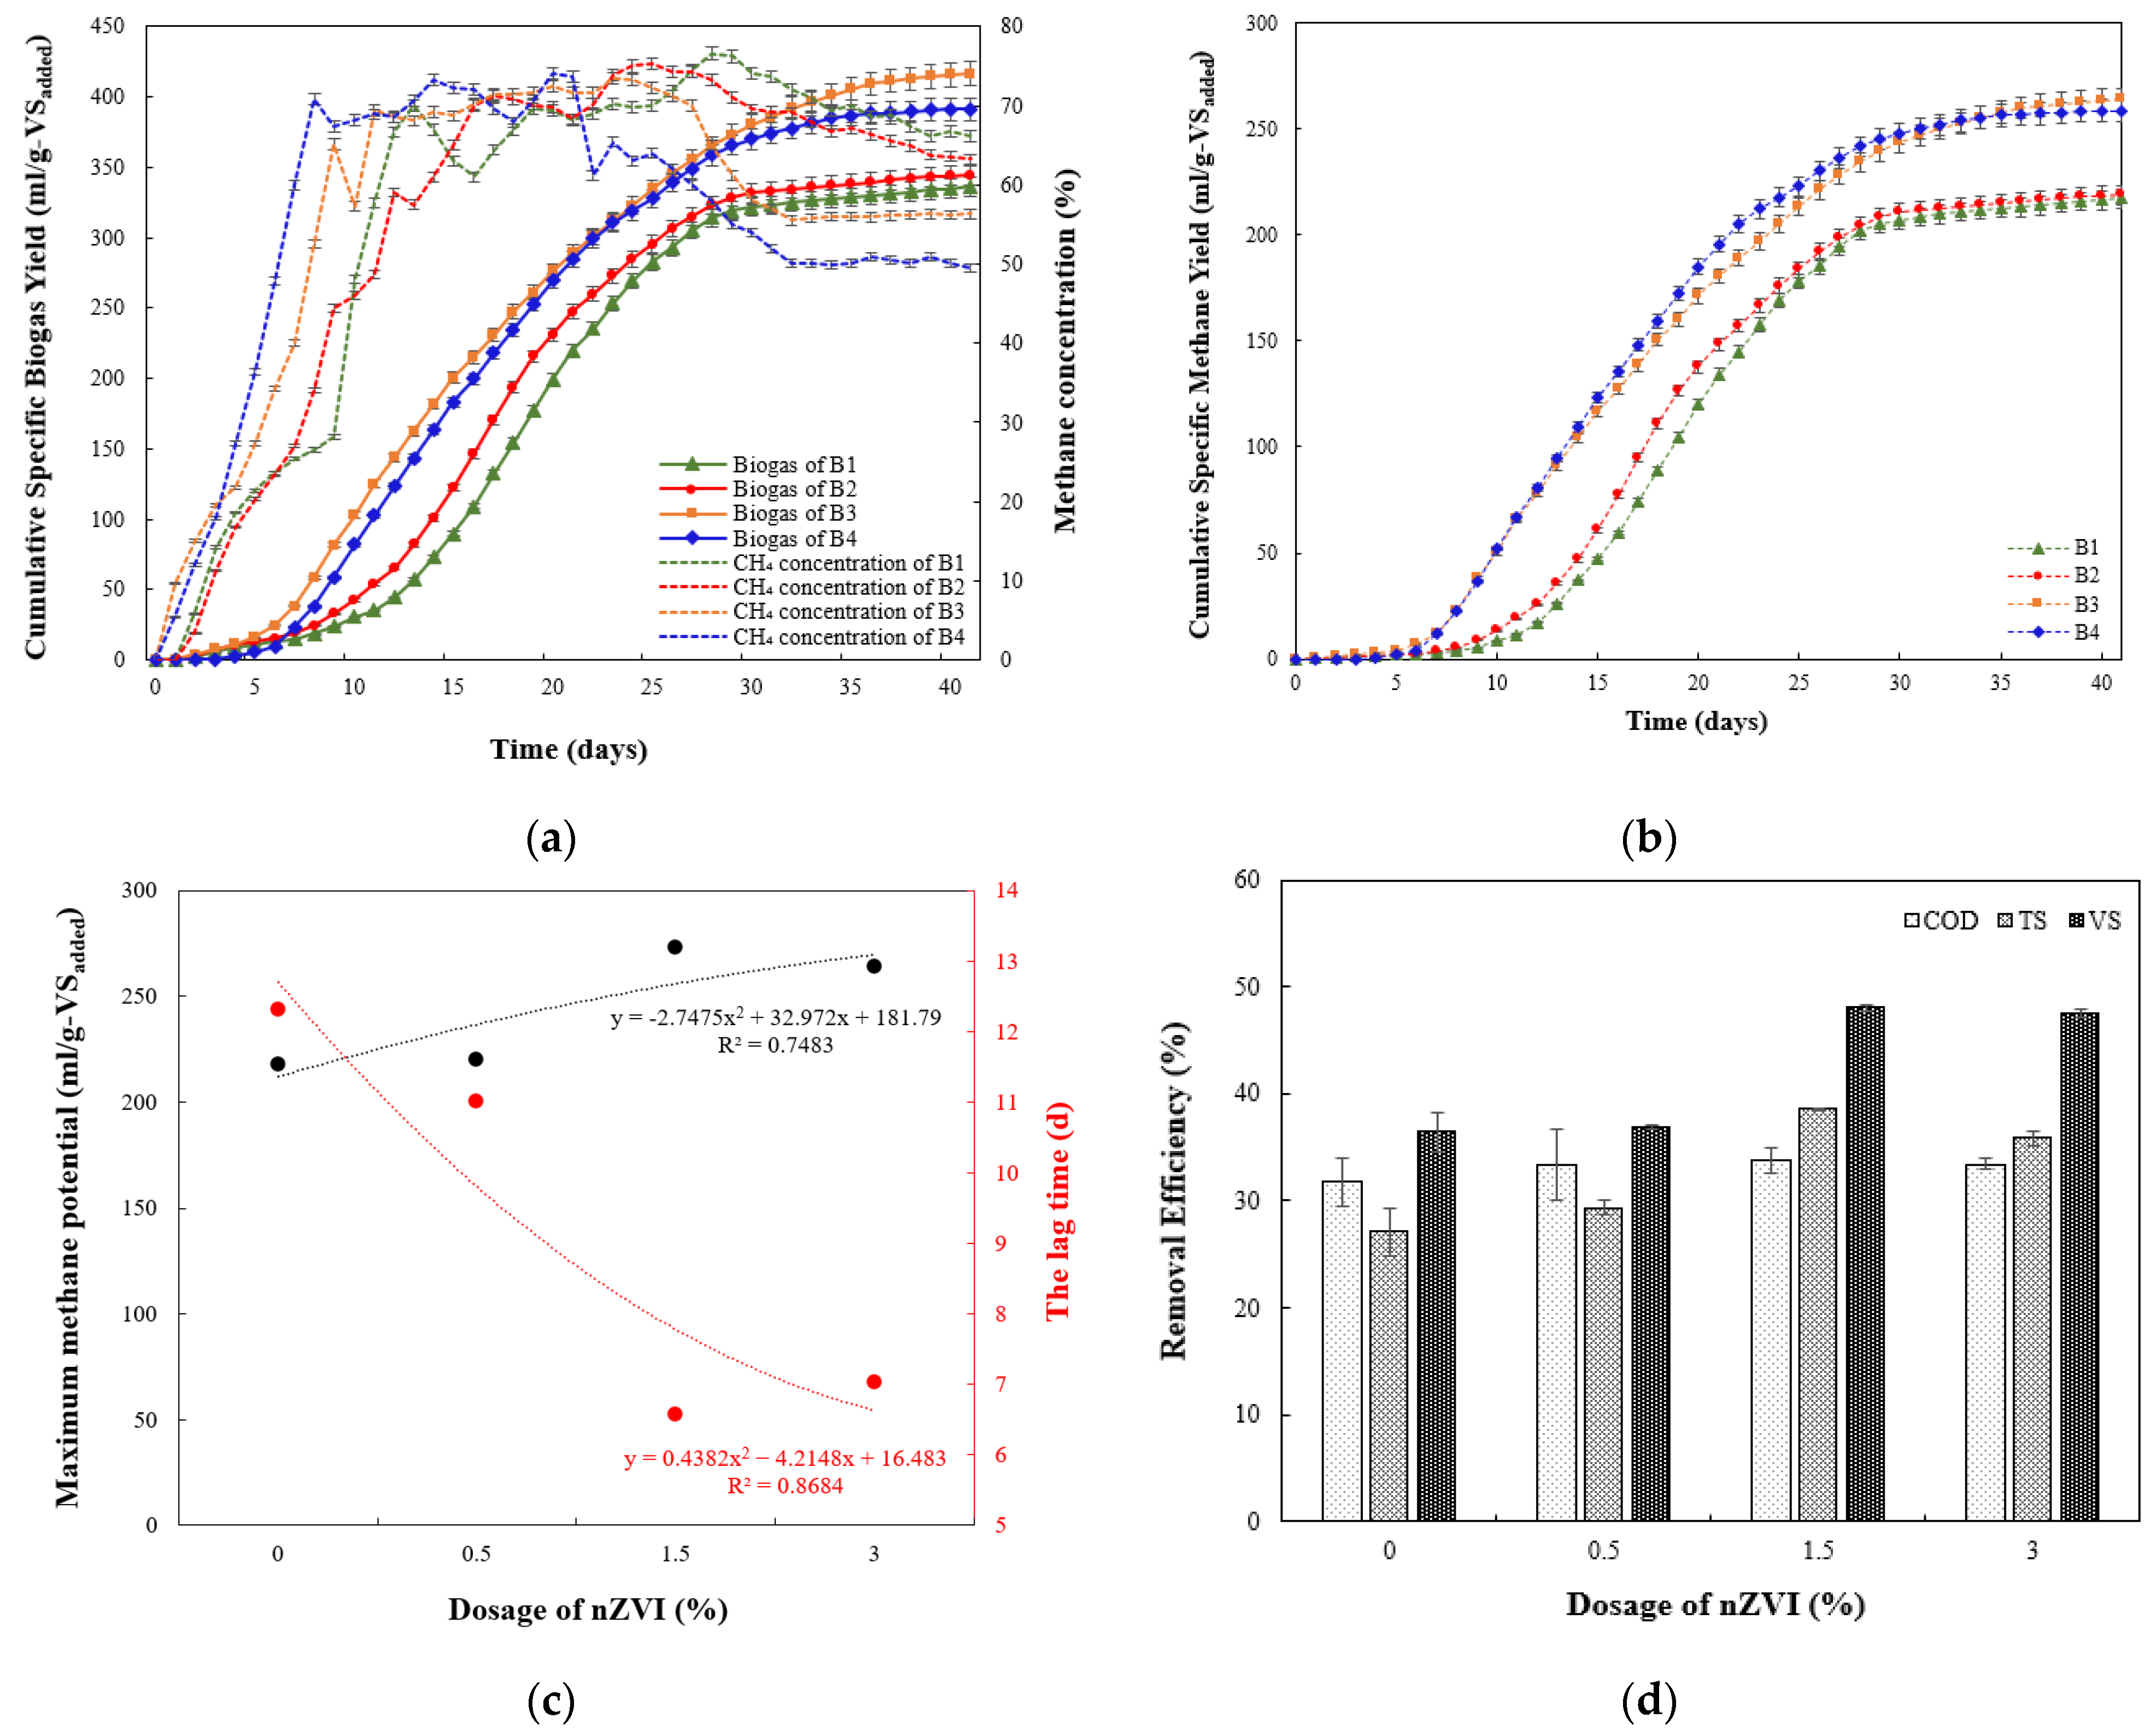
3.1. Effect of nZVI on Cumulative Biogas/Methane Generation and AD Performance

The experimental Cumulative Specific Biogas Yield (CSBY), CH4 content, Cumulative Specific Methane Yield (CSMY), kinetic parameters, TS, VS and COD removal efficiency results can be seen in Figure 2. The cumulative biogas and CH4 production in each reactor kept rising until it stabilized on the 41st day, indicating that digestion was complete. The maximum CSBY in the control reactor B1 was 336.1 mL/g-VSadded and much higher than compared to other AD studies with sewage sludge (132 mL/g-VS, 167 mL/g-VS) [42,69]. As can be seen from Figure 2a and Table 4, the CSBY for digester B2 was similar to B1 and reached 344.5 mL/g-VSadded after 41 d. However, with the addition of higher nZVI dosages, the biogas yields improved remarkedly. CSBY increased to 416.4 mL/g-VSadded (B3) and to 391.2 mL/g-VSadded (B4) (p < 0.05). The reactor B3 had the highest CSBY, which increased by 23.9% compared to the control. This falls in a range found in other studies, which showed that a nZVI dosage of 1 g/L resulted in increased biogas production up to 18.11% and 29.55% [70,71]. This shows that CSBY improved significantly at the higher doses of nZVI; however, it was slightly inhibited at a dose of 3%. Similarly, Jia et al. [70] found that a nZVI dosage of 1 g/L (what is equal to 1.5% nZVI concentration in this study) was optimal for biogas generation due to largest cumulative production, while 2 g/L nZVI concentration decreased biogas production up to 46.45% due to an inhibitory effect on methanogen activity. Therefore, it can be stated that high concentrations of nZVI particles can have a toxic effect on the AD of sewage sludge, as previously reported [45]. However, it can be noted that 3% of nZVI in this study did not indicate serious process inhibition, as the biogas/CH4 and VS removal values obtained were similar to a nZVI concentration of 1.5%.
Biogas enhancement, specifically the increase in CH4 concentration in biogas, was also observed in sewage sludge treated with nZVI particles during AD. At the beginning of the AD process (day 3rd–6th), the CH4 concentration was very low in all groups (18–32%). It was mainly because microbial activity was not high enough and was still undergoing an adaptation period [70]. From the 2nd day to the 13th day, the CH4 concentration increased faster due to a rapid increase in methanogens in the early stage [71]. The concentration of CH4 gradually increased from 5.9% to 57.7% in the control, but from 9.6% to 69.4% in the B3 reactor. This accounts for an 11.7% increase in the CH4 concentration in the presence of 1.5% of nZVI compared to the control. This is in agreement with another study, which showed that the presence of nZVI accounts for a 5.1 13.2% increase in CH4 content [72]. This could be explained by several mechanisms. Firstly, the dissolution of nZVI leads to the generation of H2 gas, which, in turn, is important for stimulating the activity of homoacetogenesis bacteria and promoting hydrogenotrophic methanogenesis. Furthermore, the H2 produced enhances the CH4 content in the biogas by facilitating the conversion of CO2 into CH4 (CO2 + 4H2 → CH4 + 2H2O) [73]. The conversion of CO2 to CH4 is one of the main pathways for methane production, which is driven by hydrogenotrophic methanogens [74]. During the steady period, the average CH4 concentration of the biogas in four reactors was 69.91% (B1), 71.48% (B2), 71.75% (B3) and 71.57% (B4) (Table 4).
At a nZVI dosage of 0%, 0.5%, 1.5% and 3%, CSMY after 41 d was 217.2 mL/g-VSadded, 218.9 mL/g-VSadded, 263.9 mL/g-VSadded and 258.7 mL/g-VSadded, respectively. The maximum CSMY in the B1 reactor was 217.2 mL/g-VSadded, which falls within the range of 191–282 mL/g-VSadded found in other studies [75,76]. Compared with the control, CSMY significantly increased up to 21.5% and 19.13% (at 1.5% and 3% nZVI dosages, respectively, p < 0.05). Similarly, Suanon et al. [77] showed that a 0.1% nZVI dose increased methane yield by 25.2% during the AD of sludge. Figure 2b shows CSMY during the AD of sludge with nZVI particles. The increase in CH4 production in the presence of nZVI could be explained by the generation of electrons (Fe0 → Fe2+ + 2e−), which enriched the AD process, enhanced the growth of hydrogenotrophic methanogens, and resulted in increased CH4 yields.
Kinetic parameters were calculated according to the RM to provide an in-depth investigation of the effect of nZVI dosages on AD (Figure 2c). A positive and moderately strong (R2 = 0.75) relationship existed between the maximum CH4 production potential (Pmax) and the nZVI dosage, while a stronger but negative relationship (R2 = 0.87) was observed between the lag time (λ) and the nZVI dosage. However, it should be noted that Pmax was highest and λ was lowest in reactor B3 (272.9 mL/g-VSadded and 6.58 d, respectively), suggesting that a 1.5% nZVI dosage had a greater effect on methanogenic activity than 0.5% or 3% dosages.
The removal efficiency (RE, %) plays a key role in evaluating the effectiveness of the AD process. The effect of different dosages of nZVI on sewage sludge reduction in the AD was characterized by changes in COD, TS and VS. Figure 2d shows the COD, TS and VS degradability assay of sludge under different nZVI dosages. COD removal can be defined as the amount of COD that is degraded by bacteria [78]. Overall, COD exhibited a decreasing trend across all reactors throughout the AD process, when COD decreased from 70.97 ± 0.03 g/L in the beginning of the experiment to 48.4 ± 1.57 g/L (B1) to 47 ± 0.87 g/L (B3) at the end. The average COD removal efficiencies in all treatment groups were similar and ranged from 31.79 ± 2.2% in the control reactor to 33.78 ± 1.2% in the B3 reactor. However, there was no significant difference between these two groups (p > 0.05) and the addition of 1.5% nZVI improved the COD degradation rate by only 2%. However, COD removal was higher compared to another study which showed 21% COD removal during the AD of waste activated sludge [79]. COD reduction occurs due to microbial activity, when microbes consume and break down organic matter [77]. After 41 d from the start of AD, a decrease in TS was also observed. VS reduction and TS reduction are commonly used as indicators to assess the efficiency of anaerobic sludge digestion. It can be summarized that a higher VS removal was observed in reactors B3 and B4 along with higher biogas and CH4 production (Table 4). The decrease in VS suggests that organic matter was transformed into intermediate volatile fatty acids for CH4 production [80]. VS destruction in the control reached 36.4 ± 1.8%, which was more than 10% less than the highest value obtained in the reactor B3 (48.05 ± 0.2%). In this study, VS reduction with 1.5% nZVI was higher than many other references, including ozone or microwave pretreatment (36% and 23.2% VS reduction, respectively) [81,82]. A similar trend was observed in the case of TS removal results, with a higher nZVI dose resulting in better TS destruction. The highest TS removal value was obtained in reactor B3 (38.54 ± 0.1%). The TS and VS removal findings can be attributed to the enhanced degradation of organic matter due to the addition of nZVI [71].

3.2. Biogas Production and Kinetics

Modeling the biogas data from sewage sludge amended with nZVI particles involved estimating kinetic parameters by fitting the experimental data from AD tests to various models, including the Gompertz (GM), modified Gompertz (MGM), Richards (RM), modified Richards (MRM), logistic (LM), modified logistic (MLM), Schnute (SM), and Cone (CM) models. As shown in Table 5, these kinetic models were validated using error functions such as R2, RMSE, NRMSE, AIC and Akaike’s weight. The selected statistical parameters helped to reduce the differences between the experimental results and the model predictions.
The experimental values obtained from all the reactors were simulated with the modified MGM and MLM, both of which provided the values of maximum biogas yield potential (Pmax), biogas production rate (Rmax) and lag phase time (λ) (Table 5). According to the MGM, the Pmax value was the highest (430.1 mL/g-VSadded) in the reactor B3, which was predicted with lower errors (R2 = 0.9991, RMSE = 5.6195, NRMSE = 1.3495%). This was followed by the B4 reactor with a Pmax value of 401.7 mL/g-VSadded. Additionally, it can be seen from the MGM results that a 1.5% nZVI dosage resulted in the lowest λ (5.15 d), indicating the early hydrolysis and AD startup. The λ value represents the adaptation period of microorganisms to the changes in the reactor’s environment [58]. Pmax increased rapidly with the increase in nZVI dosage up to 1.5%, while Rmax and λ gradually decreased. According to the MGM results, Pmax increased up to 22.34%, while Rmax and λ decreased up to 11.78% and 51.86% compared to the control, respectively. These findings suggest that the addition of a 1.5% nZVI dosage gradually enhances biogas production potential and reduces the start-up time during the AD while simultaneously slowing down the biogas production rate. The same trends were observed based on the MLM’s results; however, comparing all models, MLM provided the best fit to Pmax values in the reactor B1 due to the highest R2 (0.9999)/Akaike’s weight (0.3978) and lowest AIC (62.881)/RMSE (1.9683)/NRMSE (0.5857). The LM produced identical simulation results for the B1 reactor (Figure 3a). The predicted results for reactor B1 using MLM and LM were accurate due to NRMSE values being below 1%. Compared to other kinetic studies, Deepanraj et al. [83] used three kinetic models (GM, MGM and logistic) to predict cumulative biogas production from AD of food waste. The best fit was obtained using the MGM due to the highest R2, which was above 0.997 in all cases. Shitophyta et al. [84] compared four kinetic models for the modeling of biogas production from corn stover. The best fit and most accurate model was found to be logistic due to the smallest RMSE and lowest deviation. The logistic model was also determined to be the best fit for the prediction of cumulative biogas production during the anaerobic co-digestion of solid waste of vegetables, fruits and sewage sludge [52].
Biogas production from all reactors was simulated using other two similar S-shaped models (the Richards model (RM) and modified Richards model (MRM)), which provided the values of Pmax, Rmax, λ and fourth parameter, and shape factor (v). The MRM additionally included a fifth parameter, initial biogas/methane production (P0). The kinetic constants obtained are presented in Table 5. The Rmax in the RM was recorded in the ranges from 0.0625 mL/g-VSadded/d to 18.688 mL/g-VSadded/d. The theoretical cumulative biogas production ranged between 334.82 mL/g-VSadded and 430.09 mL/g-VSadded according to the RM and was similar or slightly lower compared to the MRM (334.57 and 431.33 mL/g-VSadded). The shape factor values calculated by the RM were close to zero, which ranged from 0.0011 to 0.6511. Comparing all models, the RMSE, NRMSE and AIC values according to the RM were observed to be lowest in the B2 reactor. Therefore, the RM provided the best fit to the Pmax values in the B2 reactor (0.5% nZVI) due to the highest R2 (0.9999), Akaike’s weight (0.4223) and lowest AIC (79.972) and errors (RMSE = 2.3556, NRMSE = 0.6838%) (Figure 3b).
Table 5 shows the kinetic values of the Gompertz model (GM) and Schnute model (SM), as well as their statistical parameters. Both models provided the values of Pmax, initial rate of biogas production (r0) and growth rate parameter (α). The SM additionally included a fourth parameter, scaling or Schnute parameter (β). The SM is a more generalized extension of the GM that incorporates a time-derivative approach [47]. The α value ranged from 0.1239 to 0.1746 in the case of the GM and from 0.1022 to 0.1713 in the case of the SM. Both models showed a good fit to the experimental biogas production results due to NRMSE values lower than 5% and R2 values higher than 0.99. Comparing all models, the SM provided the best fit to the Pmax values in the B3 and B4 reactors due to the highest R2 (0.9997 and 0.9999, respectively)/Akaike’s weights (0.975 and 0.9996, respectively), lowest errors (RMSE = 3.5178, NRMSE = 0.8448 and RMSE = 3.2649, NRMSE = 0.8345, respectively) and AIC (113.66 and 107.39, respectively) (Figure 3c,d). Comparing the α values obtained by the GM and different studies, it is evident that an environment such as sludge with 1.5% nZVI particles was more favorable due to the higher microorganism growth rate parameter, which was 1.4 times faster compared to the value obtained for the AD of waste activated sludge [79].
The other two models, the Cone model (CM) and the logistic model (LM), were used to fit measured biogas data, both providing the kinetic parameters of Pmax and reaction or hydrolysis rate coefficient (k). The difference between these two models is that the CM includes a third parameter, the shape factor (n), while the third parameter of LM is t0 (time at which the production rate is highest). The calculated kinetic parameters for the two fitted models can be found in Table 5. A comparison of the k values obtained using the CM showed that higher nZVI dosages (1.5% and 3% nZVI) resulted in slightly higher degradation rates (0.0579 d−1 and 0.0608 d−1, respectively) compared to the control. It is known that a larger k value represents a higher degradation rate [40]. However, since the differences in k values among all treatment groups were minimal, it can be concluded that varying nZVI dosages did not significantly enhance the hydrolysis rate. A comparison of n values derived from CM showed that in all nZVI treatment cases, it was higher than 1, indicating the presence of a lag phase. In general, these models showed a good fit to experimental biogas data obtained from reactor B1 due to a high coefficient of determination (R2 > 0.99). However, the LM provided a better fit to B1 data due to lower error values, which were interestingly identical to the statistical parameters calculated using MLM data. This indicates that the LM and MLM can be used equally well to accurately predict biogas production from the control sewage sludge (Figure 3a). The R2 and RMSE values obtained by the CM were similar to the SM results in the case of AD of sewage sludge amended with higher nZVI dosages (1.5% and 3%); therefore, it could be argued that the CN was the second best after the SM for biogas production in reactors B3 and B4. However, when comparing RMSE, NRMSE, AIC values and Akaike’s weights, the SM showed the best fit to the experimental biogas data from reactors B3 and B4 among all models (Table 5). Correspondingly, a study conducted by Zhang et al. [85] found that the CM was the most suitable for modeling biogas production kinetics due to the highest R2 (>0.999), as well as the lowest RMSE (0.44) and AIC (−89.59) values. It was suggested that the CM could be used to evaluate the biogas kinetics of AD of waste sludge amended with nZVI particles more reasonably.
The modeled results using all models were plotted together with cumulative biogas production and are shown in Figure 3. The predicted performance of biogas in reactor B1 can be ranked as follows: MLM/LM > MRM > CM > RM > MGM/GM > SM. Meanwhile, the predicted performance of biogas in B2 has the following order: RM > MRM > MLM/LM > CM > MGM/GM > SM. The opposite trend was determined in reactors B3 and B4, when the Schnute model was superior: SM > CM > MGM/GM > RM > MRM > MLM/LM. It can be seen that all models provided reasonably good fits for the experimental biogas data. The sigmoidal models used accurately reproduced experimental S-shape curves for the pretreated sewage sludge with nZVI particles. All models demonstrated a high goodness of fit (R2 > 0.99) for all nZVI dosages. The lag phase time calculated using MGM, MLM, RM and MRM gave similar results, ranging from 11 for the control group to 5 6 days for the group with a 1.5% nZVI dosage. Information about the lag phase time can help to determine the sludge retention time for the methanogenesis stage, ensuring optimal interaction between the feedstock and the bacterial biomass [50].

3.3. Methane Production and Kinetics

Methane yield is an important performance index of reactor efficiency. Therefore, the experimental CH4 results were fitted with eight sigmoidal models to determine a more suitable nZVI dosage for sludge AD and methane production (Table 6). The MGM and MLM theoretically predicted a relatively long lag phase, ranging from 7 days in the 1.5% nZVI group to 12–13 days in the control group. The 0.5% nZVI group exhibited a similar lag time (11 d) to that of the control. Therefore, it can be stated that conditions without nZVI particles or with a low dosage require more time to reach the maximum CH4 production potential. This could indicate that methanogens may slowly adapt to inhibitory compounds released during the thermal hydrolysis process of thickened waste activated sludge [86]. According to both models, the Rmax values obtained with 0.5% (15–16 mL/g-VSadded/d) and 3% (15–16 mL/g-VSadded/d) nZVI particles were similar to those of the control group (16 mL/g-VSadded/d), while the 1.5% nZVI group showed a slightly lower maximum methane production rate (13–14 mL/g-VSadded/d). Therefore, it can be concluded that the reduced lag phase and maximum methane production rate contributed to the higher methane yield. The R2 value was highly significant (>0.99) in all sludge treatment cases according to the MGM and MLM. However, the MGM provided a better fit for the experimental CH4 results in reactors B2, B3 and B4 due to lower RMSE, NRMSE (<1.5%) and AIC values, as well as higher Akaike’s weights, compared to the MLM. In the case of the control group, the MLM provided a better fit for the same reasons. Another study [87] showed that the MGM and MLM had a good fit to the experimental CH4 production results from the AD of dense primary sludge (R2 = 0.976 and error = −0.35; R2 = 0.964 and error = −0.35%, respectively). Bakraoui et al. [88] compared four sigmoidal models (RM, LM, MGM and CM) and demonstrated that the MGM was the most suitable for predicting CH4 production from the AD of sludge and wastewater recycled pulp and paper. The duration of lag phase obtained in this study using the MGM (12.08–10.87 days for reactors B1 and B2, respectively) was similar to the values of 10.17–14.60 days observed during anaerobic co-digestion of liquid manure with winemaking waste, food waste and biowaste [89]. The maximum methane production rate of 13.89–16.02 mL/g-VSadded/d obtained in this study was comparable to values reported in other AD studies. For instance, when sewage sludge was amended with silver nanoparticles, researchers observed Rmax values of 16.62 mL/g-VSadded/d and 16.42 mL/g-VSadded/d using modified Gompertz and logistic function models, respectively [90].
Two other models (RM and MRM) were used to fit experimental CH4 production data and were compared using appropriate statistical parameters. For CH4 production modeled with the RM and MRM in reactors B1 and B2, the R2 values were 0.9999 and very close to 1. It can be seen that the RMSE and NRMSE values were nearly identical; however, the RM demonstrated a better fit and higher accuracy for reactors B1 and B2 due to lower AIC values (33.959 and 51.484, respectively) and higher Akaike’s weights (0.3619 and 0.3519, respectively). Therefore, it can be concluded that the RM provided the best fit for CH4 production data in reactors B1 and B2. Compared to other studies, Farghali et al. [87] showed that the RM was capable of accurately simulating the kinetic patterns of CH4 generation due to its high R2 value (0.987) and low error (−0.35%) in the AD of dense primary sludge. Meanwhile, Ali et al. [55] observed a similar model performance for the RM in CH4 generation from cow and sheep manure (R2 = 0.975 and R2 = 0.981, respectively).
The cumulative specific methane yields obtained from the AD of four reactors were fitted using two other models, the GM and SM. The SM results showed that the R2 values were identical (0.9999) across all treatment groups, confirming that the SM provided an almost perfect fit for representing the CH4 accumulation process. The GM demonstrated a similarly strong fit (R2 > 0.999). Among all examined models, the SM was the most accurate in predicting CH4 data for the 1.5% and 3% nZVI groups due to the lowest RMSE, NRMSE (<1%) and AIC values, and highest Akaike’s weights (>0.99). According to the SM results, nZVI dosages of 1.5% and 3% positively affected the maximum CH4 production potential of primary sludge, enhancing it by 25.05% and 20.06%, respectively, compared to the control. Notably, the highest increase in Pmax was achieved at a nZVI dosage of 1.5%. This finding is consistent with another study, which showed that both the GM and SM effectively fitted the experimental methane production data due to high R2 values (>0.99) [63]. The referenced study evaluated the AD of Thai rice noodle wastewater amended with varying amounts of chicken manure. However, it was noted that the SM provided greater flexibility and should be preferred for general use.
Based on the CM results, the methane yield potential of sludge pre-treated with 0.5%, 1.5% and 3% nZVI dosages was 224.7 mL/g-VSadded, 290.63 mL/g-VSadded and 274.33 mL/g-VSadded, respectively. The same trend was observed in the LM results (216.19 mL/g-VSadded, 260.15 mL/g-VSadded and 255.48 mL/g-VSadded, respectively). Both models suggested that the methane yield potential in the 1.5% nZVI group was slightly higher than that of the 3% nZVI group. The Pmax values predicted were in good agreement with the experimental yields, as indicated by high R2 values (>0.999) and low RMSE/NRMSE values for the CM. Other studies have also established a good fit of the CM to experimental methane data. For example, Pan et al. [91] compared several kinetic models for methane production from anaerobic co-digestion of food waste with sewage sludge and demonstrated that the CM yielded better performance parameters (AIC: 54–181; R2: 0.98–0.99).
Figure 4 illustrates the best-fit model, determined by plotting the observed CSMYs against the predicted values from eight cumulative sigmoidal models. All models resembled an elongated S-shape curve and closely fitted the experimental CSMY data (R2 > 0.99). The CH4 production data predicted for the B1 (control) reactor followed this order: RM > MRM > CM > MLM/LM > MGM/GM > SM. The same trend was observed for the B2 (0.5% nZVI) reactor, when the RM provided the best fit and the SM the worst, which is consistent with biogas modeling data. Among all models, the SM was the most accurate for reactors B3 (1.5% nZVI) and B4 (3% nZVI), as was previously determined for biogas data. This suggests that the AD process of sludge with nZVI additives could be effectively predicted using the Schnute model, a more generalized and flexible growth model capable of approximating various growth patterns, including exponential, linear and sigmoidal growth under certain conditions.

4. Discussion

Several studies have shown that incorporating nanoparticles into the sewage sludge during the AD process enhances AD efficiency and reduces the lag phase. For example, Grosser et al. [90] reported that the addition of silver nanoparticles to sewage sludge significantly increased biogas and CH4 yields by 15% and 25%, respectively, compared to the control. Additionally, it was reported that silver nanoparticles had a positive effect on kinetic parameters, such as a shorter lag time and a higher CH4 production rate. The duration of the lag phase in the aforementioned study was shorter (3 days according to the MGM and MLM) than in our study with a 1.5% nZVI dosage (7 days according to the MGM, MLM, RM and MRM). It is worth noting that the maximum CH4 production rate in our study (13–14 mL/g-VSadded/d) was lower compared to the value (16 mL/g-VSadded/d) obtained by Grosser et al. [90] using the MGM and MLM. In another study, Bakari et al. [92] studied the effect of micro-scale ZVI (in the form of iron scrap and steel wool) on the AD of domestic wastewater. The authors found that iron scrap and a steel wool concentration of 10 g/L increased CH4 production by 38.3% and 30.7%, respectively. In addition, it was reported that both types of ZVI shortened the lag phase (according to the MGM, LM, and RM) from 3 days to 2 days. The maximum CH4 production rate achieved with ZVI ranged from 56.6 to 70.7 mL/g-VSadded/d, depending on the kinetic model used. Therefore, a correlation can be observed between a higher maximum CH4 production rate and a shorter lag time. This relationship is largely influenced by microbial adaptation and activity. Faster adaptation of methanogens results in their accelerated growth, leading to shorter lag times and a higher CH4 production rates. The length of the lag phase is influenced by various factors, including the initial cell concentration, the time needed for cells to recover from physical damage or stress, the time required to produce essential coenzymes or division factors, and the time necessary to synthesize new enzymes for metabolizing available substrates in the medium. During this phase, microbial growth is nearly zero [60], which was also evident in our study.
Higher doses of Fe additives can prolong the lag phase, as observed in our study. This study showed that the addition of 1.5% (equivalent to 1 g/L) significantly shortened the lag phase from 11 days to 5–6 days for biogas production and from 12–13 days to 7 days for CH4 production, according to different models. However, increasing the nZVI dose to 3.0% (in our study) increased the lag phase to approximately 7 days. Similarly, Lizama et al. [42] reported that the highest dose of nZVI (9 mg/g-VS) caused a greater lag phase compared to lower nZVI doses. This was explained by the fact that a higher amount of solubilization could have caused negative effects on the anaerobic microorganisms.
A study by Wang et al. [33] found that the optimal nZVI dosage for methanogens was 1 g/L, while higher concentrations of iron nanoparticles inhibited the process due to long-term accumulation of byproducts from nZVI particle corrosion. The adverse impact of elevated nZVI concentrations is primarily attributed to the buildup of these corrosion byproducts in anaerobic digesters, which inhibits bacterial growth and reduces biogas production. The byproducts of nZVI particle corrosion include ferrous iron (Fe2+), ferric iron (Fe3+), hydrogen gas (H2), electrons (e), and reactive oxygen species [73]. Dong et al. [93] investigated microbial community changes in the anaerobic seed prepared by cultivating digested sludge under varying nZVI concentrations. Their study found that the highest nZVI dose (25 g/L) drastically reduced the DNA concentration of anaerobes. Moreover, the relative abundance of homoacetogens (Clostridium) increased, while the relative abundance of methanogens (Methanosarcina and Methanobacteriales) decreased. High doses of nZVI may cause DNA damage and disrupt metabolic activities of bacteria due to the strong reducing capacity of nZVI. This could also explain the slightly slower and lower biogas and methane production in our study with a 3% nZVI addition.
The operational characteristics of reactors, such as the intensity of mixing, can significantly influence their biogas and methane production efficiency [94]. The slow mixing rate (120 rpm) in this study is consistent with several other studies, which showed that lower mixing intensities (<200 rpm) can enhance biogas production and the CH4 content. Stafford [95] observed lower gas production from primary sewage sludge at higher stirring rates (>700 rpm) due to shear forces separating the hydrolytic bacteria from their polymer substrates, while a low mixing speed at 150 rpm maximized biogas production. Intense mixing generates higher shear stress, which can disrupt and break apart flocculent formations, ultimately leading to a decrease in biogas production. Ghanimesh et al. [96] showed that digester with continuous mixing at 100 rpm produced a higher CH4 content, which was 0.6 L/g-VS. In summary, anaerobic digestion studies should prioritize a lower mixing intensity. An appropriate level of mixing ensures an enhancement in biogas production, uniform substrate distribution, prevention of solid settlement and a consistent environment for anaerobic bacteria, which is a key factor in achieving optimal digestion [97]. Additionally, the optimization of mixing during anaerobic digestion is crucial for decreasing energy demand, as it can vary from 14% to 54% of the total energy demand in a plant [98]. Hydrodynamics and the energy required for mixing can be evaluated through experiments in operational plants, laboratory tests, or numerical simulations (e.g., computational fluid dynamics models) [99].
Temperature is another key operational parameter that plays a crucial role in the efficiency of the AD process [100]. It significantly influences both physicochemical properties and the composition of microbial communities, which adapt to changes in temperature. Many researchers have compared the advantages and disadvantages of thermophilic (55–60 °C) and mesophilic (35–40 °C) modes of sludge AD. A study performed by Chen et al. [101] observed that cumulative CH4 production during mesophilic (37 ± 1 °C) anaerobic digestion (MAD) was higher than in thermophilic (55 ± 1 °C) anaerobic digestion (TAD), and nZVI effectively improved the methanogenesis in both processes. Moreover, both digestion temperatures and nZVI addition influenced the composition of functional bacterial and archaeal communities. In MAD, nZVI promoted the dominance of Candidatus Microthrix and Methanothrix, while in TAD, it enhanced the presence of Coprothermobacter and Methanothermobacter. Song et al. [102] found a similar trend, as single-stage MAD (35 ± 2 °C) outperformed TAD (55 ± 1 °C) in terms of specific methane yield, effluent quality and process stability. Therefore, it could be speculated that the mesophilic temperature (37 ± 1 °C) used in our study may yield better results compared to the thermophilic temperature.
The results of this study showed that nZVI could be a promising material for improv-ing the AD of sewage sludge. This technology could be easily integrated into existing wastewater treatment plant operations without requiring significant modifications. nZVI could be directly dosed into sludge before entering the AD process. However, proper dosing and monitoring would be necessary as high doses of nZVI may negatively impact microbial communities in AD processes. Nevertheless, practical application may be challenging due to the high cost of nZVI (100–500 EUR/kg). The potential economic benefits of nZVI for industrial applications should be further investigated through a techno-economic analysis.

5. Conclusions

This study demonstrated that the addition of nZVI particles during the anaerobic digestion of sewage sludge significantly increased the cumulative biogas and methane yields. Specifically, the addition of 1.5% nZVI particles led to a significant increase in the cumulative specific biogas yield by 23.9% and cumulative specific methane yield by 21.5%. Eight sigmoidal models were analyzed to accurately simulate biogas and methane production, with the Schnute model being the most suitable for the prediction of anaerobic digestion of sludge amended with 1.5% and 3% of nZVI particles. This was attributed to the highest R2 values (0.9999), the lowest AIC, RMSE and NRMSE values, and the highest Akaike’s weights. The modified Gompertz, Richards and logistic model results showed that the addition of 1.5% and 3% nZVI particles can shorten the lag phase of biogas and methane production during the anaerobic digestion of sewage sludge by 51.9% and 45.3%, respectively, compared to the control. Future research should be conducted to evaluate and compare various kinetic parameters of anaerobic digestion of sewage sludge treated with other iron additives, such as magnetite (Fe3O4) or micro-scale ZVI. Additionally, it is important to carry out the kinetic modeling of anaerobic digestion of sewage sludge amended with iron additives by changing the sludge mixing rate and temperature.

Author Contributions

Conceptualization, L.U., T.J., A.M., V.D. and A.Z.; methodology, L.U., T.J., A.M. and V.D.; validation, T.J., A.Z. and M.P.; formal analysis, T.J., A.M., M.P. and E.M.; investigation, L.U., T.J., V.D., A.M. and A.Z.; resources, T.J., V.D., M.P. and E.M.; data curation, L.U., T.J., V.D. and M.P.; writing—original draft preparation, L.U., V.D., A.M., M.P. and E.M.; writing—review and editing, L.U., T.J., V.D., A.M. and A.Z.; visualization, L.U., A.M. and E.M.; supervision, L.U., T.J. and A.M. All authors have read and agreed to the published version of the manuscript.

Funding

This research was conducted as part of the execution of Project “Mission-driven Implementation of Science and Innovation Programmes” (No. 02-002-P-0001), funded by the Economic Revitalization and Resilience Enhancement Plan “New Generation Lithuania”.

Data Availability Statement

Data are contained within this article.

Conflicts of Interest

The authors declare no conflict of interest.

References

  1. Marguti, A.L.; Ferreira Filho, S.S.; Piveli, R.P. Full-scale effects of addition of sludge from water treatment stations into processes of sewage treatment by conventional activated sludge. J. Environ. Manag. 2018, 215, 283–293. [Google Scholar] [CrossRef] [PubMed]
  2. Gulhan, H.; Dizaji, R.F.; Hamidi, M.N.; Abdelrahman, A.M.; Basa, S.; Kurt, E.S.; Koyuncu, I.; Guven, H.; Ozgun, H.; Ersahin, M.E.; et al. Use of water treatment plant sludge in high-rate activated sludge systems: A techno-economic investigation. Sci. Total Environ. 2023, 901, 66431. [Google Scholar] [CrossRef] [PubMed]
  3. Lasaki, B.A.; Maurer, P.; Schönberger, H. Uncovering the reasons behind high-performing primary sedimentation tanks for municipal wastewater treatment: An in-depth analysis of key factors. J. Environ. Chem. Eng. 2024, 12, 112460. [Google Scholar] [CrossRef]
  4. James, O.O.; Cao, J.-S.; Kabo-Bah, A.T.; Wang, G. Assessing the impact of Solids Retention Time (SRT) on the secondary clarifier capacity using the State Point Analysis. KSCE J. Civ. Eng. 2015, 19, 1265–1270. [Google Scholar] [CrossRef]
  5. Romero-Güiza, M.S.; Flotats, X.; Asiain-Mira, R.; Palatsi, J. Enhancement of sewage sludge thickening and energy self-sufficiency with advanced process control tools in a full-scale wastewater treatment plant. Water Res. 2022, 222, 118924. [Google Scholar] [CrossRef]
  6. Siddiqua, A.; Hahladakis, J.N.; Al-Attiya, W.A.K.A. An overview of the environmental pollution and health effects associated with waste landfilling and open dumping. Environ. Sci. Pollut. Res. Int. 2022, 29, 58514–58536. [Google Scholar] [CrossRef]
  7. Mabrouk, O.; Hamdi, H.; Sayadi, S.; Al-Ghouti, M.A.; Abu-Dieyeh, M.H.; Zouari, N. Reuse of Sludge as Organic Soil Amendment: Insights into the Current Situation and Potential Challenges. Sustainability 2023, 15, 6773. [Google Scholar] [CrossRef]
  8. Giwa, A.S.; Maurice, N.J.; Luoyan, A.; Liu, X.; Yunlong, Y.; Hong, Z. Advances in sewage sludge application and treatment: Process integration of plasma pyrolysis and anaerobic digestion with the resource recovery. Heliyon 2023, 9, e19765. [Google Scholar] [CrossRef]
  9. Chojnacka, K.; Moustakas, K. Anaerobic digestate management for carbon neutrality and fertilizer use: A review of current practices and future opportunities. Biomass Bioenergy 2024, 180, 106991. [Google Scholar] [CrossRef]
  10. Enebe, N.L.; Chigor, C.B.; Obileke, K.; Lawal, M.S.; Enebe, M.C. Biogas and Syngas Production from Sewage Sludge: A Sustainable Source of Energy Generation. Methane 2023, 2, 192–217. [Google Scholar] [CrossRef]
  11. Harirchi, S.; Wainaina, S.; Sar, T.; Nojoumi, S.A.; Parchami, M.; Parchami, M.; Varjani, S.; Khanal, S.K.; Wong, J.; Awasthi, M.K.; et al. Microbiological insights into anaerobic digestion for biogas, hydrogen or volatile fatty acids (VFAs): A review. Bioengineered 2022, 13, 6521–6557. [Google Scholar] [CrossRef] [PubMed]
  12. Bezirgiannidis, A.; Chatzopoulos, P.; Tsakali, A.; Ntougias, S.; Melidis, P. Renewable energy recovery from sewage sludge derived from chemically enhanced precipitation. Renew. Energy 2020, 162, 1811–1818. [Google Scholar] [CrossRef]
  13. Mahmoudi, A.; Mousavi, S.A.; Darvishi, P. Performance and recent development in sewage sludge-to-bioenergy using microbial fuel cells: A comprehensive review. Int. J. Hydrogen Energy 2024, 50, 1432–1455. [Google Scholar] [CrossRef]
  14. Cucina, M. Integrating anaerobic digestion and composting to boost energy and material recovery from organic wastes in the Circular Economy framework in Europe: A review. Bioresour. Technol. Reports 2023, 24, 101642. [Google Scholar] [CrossRef]
  15. Nayeri, D.; Mohammadi, P.; Bashardoust, P.; Eshtiaghi, N. A comprehensive review on the recent development of anaerobic sludge digestions: Performance, mechanism, operational factors, and future challenges. Results Eng. 2024, 22, 102292. [Google Scholar] [CrossRef]
  16. Manyi-Loh, C.E.; Lues, R. Anaerobic Digestion of Lignocellulosic Biomass: Substrate Characteristics (Challenge) and Innovation. Fermentation 2023, 9, 755. [Google Scholar] [CrossRef]
  17. Liao, X.; Li, H.; Zhang, Y.; Liu, C.; Chen, Q. Accelerated high-solids anaerobic digestion of sewage sludge using low-temperature thermal pretreatment. Int. Biodeter. Biodegr. 2016, 106, 141–149. [Google Scholar] [CrossRef]
  18. Jung, H.; Kim, D.; Choi, H.; Lee, C. A review of technologies for in-situ sulfide control in anaerobic digestion. Renew. Sustain. Energy Rev. 2022, 157, 112068. [Google Scholar] [CrossRef]
  19. Sihlangu, E.; Luseba, D.; Regnier, T.; Magama, P.; Chiyanzu, I.; Nephawe, K.A. Investigating Methane, Carbon Dioxide, Ammonia, and Hydrogen Sulphide Content in Agricultural Waste during Biogas Production. Sustainability 2024, 16, 5145. [Google Scholar] [CrossRef]
  20. Vu, H.P.; Nguyen, L.N.; Wang, Q.; Ngo, H.H.; Liu, Q.; Zhang, X.; Nghiem, L.D. Hydrogen sulphide management in anaerobic digestion: A critical review on input control, process regulation, and post-treatment. Bioresour. Technol. 2022, 346, 126634. [Google Scholar] [CrossRef]
  21. Nguyen, V.K.; Chaudhary, D.K.; Dahal, R.H.; Trinh, N.H.; Kim, J.; Chang, S.W.; Hong, Y.; La, D.D.; Nguyen, X.C.; Ngo, H.H.; et al. Review on pretreatment techniques to improve anaerobic digestion of sewage sludge. Fuel 2021, 285, 119105. [Google Scholar] [CrossRef]
  22. Martín, M.A.; Serrano, A.; Rincón, B.; Gutiérrez, M.C.; Amil-Ruiz, F.; Barbudo-Lunar, M.; Alhama, J.; Michán, C.; Siles, J.A. Biomethanisation of sewage sludge: Sonication pretreatment and monitoring of microbial communities. Environ. Technol. Innov. 2024, 36, 103750. [Google Scholar] [CrossRef]
  23. Zielinski, M.; Zielinska, M.; Cydzik-Kwiatkowska, A.; Rusanowska, P.; Debowski, M. Effect of static magnetic field on microbial community during anaerobic digestion. Bioresour. Technol. 2021, 323, 124600. [Google Scholar] [CrossRef] [PubMed]
  24. Di Costanzo, N.; Di Capua, F.; Cesaro, A.; Mascolo, M.C.; Pirozzi, F.; Esposito, G. Impact of high-intenisty static magnetic field on chemical properties and anaerobic digestion of sewage sludge. Waste Biomass Valori. 2023, 14, 2469–2479. [Google Scholar] [CrossRef]
  25. Sarker, S.; Lamb, J.J.; Hjelme, D.R.; Lien, K.M. A Review of the Role of Critical Parameters in the Design and Operation of Biogas Production Plants. Appl. Sci. 2019, 9, 1915. [Google Scholar] [CrossRef]
  26. Issahaku, M.; Derkyi, N.S.A.; Kemausuor, F. A systematic review of the design considerations for the operation and maintenance of small-scale biogas digesters. Heliyon 2024, 10, e24019. [Google Scholar] [CrossRef]
  27. Hajji, A.; Rhachi, M.; Garoum, M.; Laaroussi, N. The effects of pH, temperature and agitation on biogas production under mesophilic regime. In Proceedings of the 2016 3rd International Conference on Renewable Energies for Developing Countries (REDEC), Zouk Mosbeh, Lebanon; 2016; pp. 1–4. [Google Scholar] [CrossRef]
  28. Elsayed, A.; Kakar, F.L.; Abdelrahman, M.A.; Ahmed, N.; AlSayed, A.; Zagloul, M.S.; Muller, C.; Bell, K.Y.; Santoro, D.; Norton, J.; et al. Enhancing anaerobic digestion Efficiency: A comprehensive review on innovative intensification technologies. Energy Convers. Manag. 2024, 320, 118979. [Google Scholar] [CrossRef]
  29. Mutegoa, E.; Sahini, M.G. Approaches to mitigation of hydrogen sulfide during anaerobic digestion process—A review. Heliyon 2023, 9, e19768. [Google Scholar] [CrossRef]
  30. Wang, R.; Al-Dhabi, N.A.; Jiang, Y.; Dai, X.; Li, R.; Tang, W.; Guo, R.; Fu, S. Effect of nano zero-valent iron on the anaerobic digestion of food waste: Performance and mechanism. Fuel 2024, 366, 131342. [Google Scholar] [CrossRef]
  31. He, C.-S.; He, P.-P.; Yang, H.-Y.; Li, L.-L.; Lin, Y.; Mu, Y.; Yu, H.-Q. Impact of zero-valent iron nanoparticles on the activity of anaerobic granular sludge: From macroscopic to microscopic investigation. Water Res. 2017, 127, 32–40. [Google Scholar] [CrossRef]
  32. Xiang, Y.; Yang, Z.; Zhang, Y.; Xu, R.; Zheng, Y.; Hu, J.; Li, X.; Jia, M.; Xiong, W.; Cao, J. Influence of nanoscale zero-valent iron and magnetite nanoparticles on aanaerobic digestion performance and macrolide, aminoglycoside, β-lactam resistance genes reduction. Bioresour. Technol. 2019, 294, 122139. [Google Scholar] [CrossRef] [PubMed]
  33. Wang, Y.; Wang, D.; Fang, H. Comparison of enhancement of anaerobic digestion of waste activated sludge through adding nano-zero valent iron and zero valent iron. RSC Adv. 2018, 48, 27181–27190. [Google Scholar] [CrossRef] [PubMed]
  34. Yang, Y.; Guo, J.; Hu, Z. Impact of nano zero valent iron (NZVI) on methanogenic activity and population dynamics in anaerobic digestion. Water Res. 2013, 47, 6790–6800. [Google Scholar] [CrossRef]
  35. Feng, Y.; Zhang, Y.; Quan, X.; Chen, S. Enhanced anaerobic digestion of waste activated sludge digestion by the addition of zero valent iron. Water Res. 2014, 52, 242–250. [Google Scholar] [CrossRef]
  36. Dauknys, R.; Mažeikienė, A. Process Improvement of Biogas Production from Sewage Sludge Applying Iron Oxides-Based Additives. Energies 2023, 16, 3285. [Google Scholar] [CrossRef]
  37. Elagroudy, S.; Radwan, A.G.; Banadda, N.; Mostafa, N.G.; Owusu, P.A.; Janajreh, I. Mathematical models comparison of biogas production from anaerobic digestion of microwave pretreated mixed sludge. Renew. Energy 2020, 155, 1009–1020. [Google Scholar] [CrossRef]
  38. Mihi, M.; Ouhammou, B.; Aggour, M.; Daouchi, B.; Naaim, S.; Kousksou, T. Modeling and forecasting biogas production from anaerobic digestion process for sustainable resource energy recovery. Heliyon 2024, 10, e38472. [Google Scholar] [CrossRef]
  39. Panaro, D.B.; Mattei, M.R.; Esposito, G.; Steyer, J.P.; Capone, F.; Frunzo, L. A modelling and simulation study of anaerobic digestion in plug-flow reactors. Commun. Nonlinear Sci. Numer. 2022, 105, 106062. [Google Scholar] [CrossRef]
  40. Zhan, Y.; Zhu, J.; Xiao, Y.; Schrader, L.C.; Wu, S.X.; Robinson, N.A., Jr.; Wang, Z. Employing micro-aeration in anaerobic digestion of poultry litter and wheat straw: Batch kinetics and continuous performance. Bioresour. Technol. 2023, 368, 128351. [Google Scholar] [CrossRef]
  41. Zhang, L.; Lim, E.Y.; Loh, K.-C.; Ok, Y.S.; Lee, J.T.E.; Shen, Y.; Wang, C.-H.; Dai, Y.; Tong, Y.W. Biochar enhanced thermophilic anaerobic digestion of food waste and pilot-scale application. Energy Convers. Manag. 2020, 209, 112654. [Google Scholar] [CrossRef]
  42. Lizama, A.C.; Figueiras, C.C.; Pedreguera, A.Z.; Espinoza, J.E.R. Enhancing the performance and stability of the anaerobic digestion of sewage sludge by zero valent iron nanoparticles dosage. Bioresour. Technol. 2019, 275, 352–359. [Google Scholar] [CrossRef] [PubMed]
  43. Zhou, H.; Cao, Z.; Zhang, M.; Ying, Z.; Ma, L. Zero-valent iron enhanced in-situ advanced anaerobic digestion for the removal of antibiotics and antibiotic resistance genes in sewage sludge. Sci. Total Environ. 2021, 754, 142077. [Google Scholar] [CrossRef] [PubMed]
  44. Zhou, J.; Zhou, Y.; You, X.; Zhang, H.; Gong, L.; Wang, J.; Zuo, T. Potential promotion of activated carbon supported nano zero-valent iron on anaerobic digestion of waste activated sludge. Environ. Technol. 2022, 43, 3538–3551. [Google Scholar] [CrossRef] [PubMed]
  45. Suanon, F.; Sun, Q.; Mama, D.; Li, J.; Dimon, B.; Yu, C.-P. Effect of nanoscale zero-valent iron and magnetite (Fe3O4) on the fate of metals during anaerobic digestion of sludge. Water Res. 2016, 88, 897–903. [Google Scholar] [CrossRef]
  46. American Public Health Association (APHA). Standard Methods for the Examination of Water and Wastewater; American Public Health Association (APHA): Washington, DC, USA, 1995. [Google Scholar]
  47. Men, Y.; Zheng, L.; Zhang, L.; Li, Z.; Wang, X.; Zhou, X.; Cheng, S.; Bao, W. Effects of adding zero valent iron on the anaerobic digestion of cow manure and lignocellulose. Front. Bioeng. Biotechnol. 2020, 8, 590200. [Google Scholar] [CrossRef]
  48. Sapkaite, I.; Barrado, E.; Fdz-Polanco, F.; Perez-Elvira, S.I. Optimization of thermal hydrolysis process for sludge pre-treatment. J. Environ. Manag. 2017, 192, 25–30. [Google Scholar] [CrossRef]
  49. Lim, Y.F.; Chan, Y.J.; Hue, F.S.; Ng, S.C.; Hashma, H. Anaerobic co-digestion of palm oil mill effluent (POME) with decanter cake (DC): Effect of mixing ratio and kinetic study. Bioresour. Tech. Rep. 2021, 15, 100736. [Google Scholar] [CrossRef]
  50. Phan, H.N.Q.; Leu, J.H.; Nguyen, V.N.D. The combination of anaerobic digestion and electro-oxidation for efficient COD removal in beverage wastewater: Investigation of electrolytic cells. Sustainability 2023, 15, 5551. [Google Scholar] [CrossRef]
  51. Ovi, D.; Chang, S.W.; Wong, J.W.C.; Johravindar, D.; Varjani, S.; Jeung, J.H.; Chung, W.J.; Thirupathi, A. Effect of rice husk and palm tree-based biochar addition on the anaerobic digestion of food waste/sludge. Fuel 2022, 315, 123188. [Google Scholar] [CrossRef]
  52. Leite, V.D.; Ramos, R.O.; Lopes, W.S.; Araujo, M.C.U.; Almeida, V.E.; Oliveira, N.M.S.; Viriato, C.L. Kinetic modeling of anaerobic co-digestion of plant solid waste with sewage sludge: Synergistic influences of total solids and substrate particle size in biogas generation. Bioenergy Res. 2024, 17, 744–755. [Google Scholar] [CrossRef]
  53. Emebu, S.; Pecha, J.; Janacova, D. Review on anaerobic digestion models: Model classification & elaboration of process phenomena. Renew. Sustain. Energy Rev. 2022, 160, 112288. [Google Scholar] [CrossRef]
  54. Basinas, P.; Chamradova, K.; Rusin, J.; Kaldis, S.P. Anaerobic digestion performance and kinetics of biomass pretreated with various strains utilizing exponential and sigmoidal equation models. Renew. Eenrgy 2024, 235, 121390. [Google Scholar] [CrossRef]
  55. Ali, M.M.; Dia, N.; Bilal, B.; Ndongo, M. Theoretical models for prediction of methane production from anaerobic digestion: A critical review. Int. J. Phys. Sci. 2018, 13, 206–216. [Google Scholar] [CrossRef]
  56. Zhang, H.; An, D.; Cao, Y.; Tian, Y.; He, J. Modeling the methane production kinetics of anaerobic co-digestion of agricultural wastes using sigmoidal functions. Energies 2021, 14, 258. [Google Scholar] [CrossRef]
  57. Zahan, Z.; Othman, M.Z.; Muster, T.H. Anaerobic digestion/co-digestion kinetic potentials of different agro-industrial wastes: A comprehensive batch study for C/N optimisation. Waste Manag. 2018, 71, 663–674. [Google Scholar] [CrossRef]
  58. Pramanik, S.K.; Suja, F.B.; Porhemmat, M.; Pramanik, B.K. Performance and kinetic model of a single-stage anaerobic digestion system operated at different successive operating stages for the treatment of food waste. Processes 2019, 7, 600. [Google Scholar] [CrossRef]
  59. Roberts, S.; Mathaka, N.; Zeleke, M.A.; Nwaigwe, K.N. Comparative analysis of five kinetic models for prediction of methane yield. J. Inst. Eng. A 2023, 104, 335–342. [Google Scholar] [CrossRef]
  60. Murunga, S.I.; Were, F. Predicting microbial growth in anaerobic digester using Gompertz and logistic models. IRE J. 2019, 3, 2456–8880. [Google Scholar]
  61. Altaş, L. Inhibitory effect of heavy metals on methane-producing anaerobic granular sludge. J. Hazard. Mater. 2009, 162, 1551–1556. [Google Scholar] [CrossRef]
  62. Bedoić, R.; Špehar, A.; Puljko, J.; Čuček, L.; Ćosić, B.; Pukšec, T.; Duić, N. Opportunities and challanges: Experimental and kinetic analysis of anaerobic co-digestion of food waste and rendering industry streams for biogas production. Renew. Sustain. Energy Rev. 2020, 130, 109951. [Google Scholar] [CrossRef]
  63. Jijai, S.; Siripatana, C. Kinetic model of biogas production from co-digestion of thai rice noodle wastewater (khanomjeen) with chicken manure. Energy Procedia 2017, 138, 386–392. [Google Scholar] [CrossRef]
  64. Alrawashdeh, K.A.B.; Al-Sameraie, L.; Bsoul, A.A.; Khasawneh, A.; Al-Tabbal, J. Correlation between kinetic parameters, reactor performance, and biogas and methane potential of co-digestion and mono-digestion of active sludge and olive mill wastewater. Int. J. Low Carbon Technol. 2024, 19, 1501–1515. [Google Scholar] [CrossRef]
  65. Arora, V.; Mahla, S.K.; Leekha, R.S.; Dhir, A.; Lee, K.; Ko, H. Intervention of artificial neural network with an improved activation function to predict the performance and emission characteristics of a biogas powered dual fuel engine. Electronics 2021, 10, 584. [Google Scholar] [CrossRef]
  66. Lima, D.R.S.; Adarme, O.F.H.; Baêta, B.E.L.; Gurgel, L.V.A.; Aquino, S.F. Influence of different thermal pretreatments and inoculum selection on the biomethanation of sugarcane bagasse by solid-state anaerobic digestion: A kinetic analysis. Ind. Crops Prod. 2018, 111, 684–693. [Google Scholar] [CrossRef]
  67. Zaidi, A.A.; RuiZhe, F.; Shi, Y.; Khan, S.Z.; Mushtaq, K. Nanoparticles augmentation on biogas yield from microalgal biomass anaerobic digestion. Int. J. Hydrogen Energy 2018, 31, 14202–14213. [Google Scholar] [CrossRef]
  68. Xu, R.; Xu, S.; Zhang, L.; Florentino, A.P.; Yang, Z.; Liu, Y. Impact of zero valent iron on blackwater anaerobic digestion. Bioresour. Technol. 2019, 285, 121351. [Google Scholar] [CrossRef]
  69. Lizama, A.C.; Figueiras, C.C.; Herrera, R.R.; Pedreguera, A.Z.; Espinoza, J.E.R. Effects of ultrasonic pretreatment on the solubilization and kinetic study of biogas production from anaerobic digestion of waste activated sludge. Int. Biodeterior. Biodegrad. 2017, 123, 1–9. [Google Scholar] [CrossRef]
  70. Jia, T.; Wang, Z.; Shan, H.; Liu, Y.; Gong, L. Effect of nanoscale zero-valent iron on sludge anaerobic digestion. Resour. Conserv. Recy. 2017, 127, 190–195. [Google Scholar] [CrossRef]
  71. Zhou, J.; You, X.; Jis, T.; Niu, B.; Gong, L.; Yang, X.; Zhou, Y. Effect of nanoscale zero-valent iron on the change of sludge anaerobic digestion process. Environ. Technol. 2020, 41, 3199–3209. [Google Scholar] [CrossRef]
  72. Su, L.; Shi, X.; Guo, G.; Zhao, A.; Zhao, Y. Stabilization of sewage sludge in the presence of nanoscale zero-valent iron (nZVI): Abatement of odor and improvement of biogas production. J. Mater. Cycles Waste Manag. 2013, 15, 461–468. [Google Scholar] [CrossRef]
  73. Eljamal, O.; Eljamal, R.; Falyouna, O.; Maamoun, I.; Thompson, I.P. Exceptional contribution of iron nanoparticle and aloe vera biomass additives to biogas production from anaerobic digestion of waste sludge. Energy 2024, 302, 131761. [Google Scholar] [CrossRef]
  74. Zhang, Y.; Feng, Y.; Quan, X. Zero-valent iron enhanced methanogenic activity in anaerobic digestion of waste activated sludge after heat and alkali pretreatment. Waste Manag. 2015, 38, 297–302. [Google Scholar] [CrossRef] [PubMed]
  75. Zhang, T.; Zhang, Y.; Wang, X.; Zhang, G.; Zhao, Z. Synergic role of potassium ferrate pretreatment and zero valent iron for enhancement of waste activated sludge anaerobic digestion. Renew. Energy 2024, 235, 121387. [Google Scholar] [CrossRef]
  76. Qin, Y.; Chen, L.; Wang, T.; Ren, J.; Cao, Y.; Zhou, S. Impacts of ferric chloride, ferrous chloride and solid retention time on the methane-producing and physicochemical characterization in high-solids sludge anaerobic digestion. Renew. Energy 2019, 139, 1290–1298. [Google Scholar] [CrossRef]
  77. Suanon, F.; Sun, Q.; Li, M.; Cai, X.; Zhang, Y.; Yan, Y.; Yu, C. Application of nanoscale zero valent iron and iron powder during sludge anaerobic digestion: Impact on methane yield and pharmaceutical and personal care products generation. J. Hazard. Mater. 2017, 321, 47–53. [Google Scholar] [CrossRef]
  78. Syaichurrozi, I.; Sumardiono, B.S. Predicting kinetic model of biogas production and biodegradability organic materials: Biogas production from vinasse at variation of COD/N ratio. Bioresour. Technol. 2013, 149, 390–397. [Google Scholar] [CrossRef]
  79. Gaur, R.Z.; Suthar, S. Anaerobic digestion of activated sludge, anaerobic granular sludge and cow dung with food waste for enhanced methane production. J. Clean. Prod. 2017, 164, 557–566. [Google Scholar] [CrossRef]
  80. D’Silva, T.C.; Isha, A.; Verma, S.; Shirsath, G.; Chandra, R.; Vijay, V.K.; Subbarao, P.M.V.; Kovacs, K.L. Anaerobic co-digestion of dry fallen leaves, fruit/vegetable wastes and cow dung without an active inoculum—a biomethane potential study. Bioresour. Technol. Rep. 2022, 19, 101189. [Google Scholar] [CrossRef]
  81. Erden, G.; Demir, O.; Filibeli, A. Disintegration of biological sludge: Effect of ozone oxidation and ultrasonic treatment on aerobic digestibility. Bioresour. Technol. 2010, 101, 8093–8098. [Google Scholar] [CrossRef]
  82. Park, B.; Ahn, J.H.; Kim, J.; Hwang, S. Use of microwave pretreatment for enhanced anaerobiosis of secondary sludge. Water Sci. Technol. 2004, 50, 17–23. [Google Scholar] [CrossRef]
  83. Deepanraj, B.; Sivasubramanian, V.; Jayaraj, S. Experimental and kinetic study on anaerobic digestion of food waste: The effect of total solids and pH. J. Renew. Sustain. Energy 2015, 7, 063104. [Google Scholar] [CrossRef]
  84. Shitophyta, L.M.; Arnita, A.; Wulansari, H.D. Evaluation and modelling of biogas production from batch anaerobic digestion of corn stover with oxalic acid. J. Agr. Eng. 2023, 69, 151–157. [Google Scholar] [CrossRef]
  85. Zhang, Y.; Yang, Z.; Xu, R.; Xiang, Y.; Jis, M.; Hu, J.; Zheng, Y.; Xiong, W.; Cao, J. Enhanced mesophilic anaerobic digestion of waste sludge with the iron nanoparticles addition and kinetic analysis. Sci. Total Environ. 2019, 683, 124–133. [Google Scholar] [CrossRef] [PubMed]
  86. Azizi, S.M.M.; Dastyar, W.; Meshref, M.N.A.; Maal-Bared, R.; Dhar, B.R. Low-temperature thermal hydrolysis of anaerobic digestion facility in wastewater treatment plant with primary sludge fermentation. Chem. Eng. J. 2021, 426, 130485. [Google Scholar] [CrossRef]
  87. Farghali, M.; Mohamed, I.M.A.; Hassan, D.; Iwasaki, M.; Yoshida, G.; Umetsu, K.; Ihara, I. Kinetic modeling of anaerobic co-digestion with glycerol: Implications for process stability and organic overloads. Biochem. Eng. J. 2023, 199, 109061. [Google Scholar] [CrossRef]
  88. Bakraoui, M.; Karouach, F.; Ouhammou, B.; Lahboubi, N.; Gnaoui, Y.E.; Kerrou, O.; Aggour, M.; Bari, H.E. Kinetics study of methane production from anaerobic digestion of sludge and wastewater recycled pulp and paper. IOP Conf. Ser. Mater. Sci. Eng. 2020, 946, 012009. [Google Scholar] [CrossRef]
  89. Bakhov, Z.K.; Korazbekov, K.U.; Lakhanova, K.M. The kinetics of methane production from co-digestion of cattle manure. Pak. J. Biol. Sci. 2014, 17, 1023–1029. [Google Scholar] [CrossRef]
  90. Grosser, A.; Grobelak, A.; Rorat, A.; Courtois, P.; Vandelbulcke, F.; Lemiere, S.; Guyoneaud, R.; Attard, E.; Celary, P. Effects of silver nanoparticles on performance of anaerobic digestion of sewage lsudge and asociated microbial communities. Renew. Energy 2021, 171, 1014–1025. [Google Scholar] [CrossRef]
  91. Pan, Y.; Zhi, Z.; Zhen, G.; Lu, X.; Bakonyi, P.; Li, Y.-Y.; Zhao, Y.; Banu, J.B. Synergistic effect and biodegradation of sewage sludge and food waste mesophilic anaerobic co-digestion and the underlying stimulation mechanisms. Fuel 2019, 253, 40–49. [Google Scholar] [CrossRef]
  92. Bakari, O.; Njau, K.N.; Noubactep, C. Effects of zero-valent iron on sludge and methane production in anaerobic digestion of domestic wastewater. Case Stud. Chem. Environ. Eng. 2023, 8, 100377. [Google Scholar] [CrossRef]
  93. Dong, D.; Aleta, P.; Zhao, X.; Choi, O.K.; Kim, S.; Lee, J.W. Effects of nanoscale zero valent iron (nZVI) concentration on the biochemical conversion of gaseous carbon dioxide (CO2) into methane (CH4). Bioresour. Technol. 2019, 275, 314–320. [Google Scholar] [CrossRef] [PubMed]
  94. Mohammadrezaei, R.; Zareei, S.; Behroozi-Khazaei, N. Optimum mixing rate in biogas reactors: Energy balance calculations and computational fluid dynamics simulation. Energy 2018, 159, 54–60. [Google Scholar] [CrossRef]
  95. Stafford, D.A. The effects of mixing and volatile fatty acid concentrations on anaerobic digester performance. Biomass 1982, 2, 43–55. [Google Scholar] [CrossRef]
  96. Ghanimesh, S.; Fadel, M.E.; Saikaly, P. Mixing effect on thermophilic anaerobic digestion of source-sorted organic fraction of municipal solid waste. Bioresour. Technol. 2012, 117, 63–71. [Google Scholar] [CrossRef]
  97. Neuner, T.; Meister, M.; Pillei, M.; Senfter, T.; Draxl-Weiskopf, S.; Ebner, C.; Winkler, J.; Rauch, W. Impact of design and mixing strategies on biogas production in anaerobic digesters. Water 2024, 16, 2205. [Google Scholar] [CrossRef]
  98. Zhang, Y.; Yu, G.; Yu, L.; Siddhu, M.A.H.; Gao, M.; Abdeltawab, A.A.; Al-Deyab, S.S.; Chen, X. Computational fluid dynamics study on mixing mode and power concumption in anaerobic mono- and co-digestion. Bioresour. Technol. 2016, 203, 166–172. [Google Scholar] [CrossRef]
  99. Terashima, M.; Goel, R.; Komatsu, K.; Yasui, H.; Takahashi, H.; Li, Y.Y.; Noike, T. CFD simulation of mixing in anaerobic digesters. Bioresour. Technol. 2009, 100, 2228–2233. [Google Scholar] [CrossRef]
  100. Gebreeyessus, G.D.; Jenicek, P. Thermophilic versus mesophilic anaerobic digestion of sewage sludge: A comparative review. Bioengineered 2016, 3, 15. [Google Scholar] [CrossRef]
  101. Chen, J.; Li, L.; Pang, L.; Chatzisymeon, E.; Lu, Y.; Yang, P. Using metagenomics to reveal the effects of zero-valent iron with different sizes on the mesophilic and thermophilic anaerobic digestion of sludge. Biochem. Eng. J. 2025, 217, 109688. [Google Scholar] [CrossRef]
  102. Song, Y.-C.; Kwon, S.-J.; Woo, J.H. Mesophilic and thermophilic temperature co-phase anaerobic digestion compared with single-stage mesophilic- and thermophilic digestion of sewage sludge. Water Res. 2004, 38, 1653–1662. [Google Scholar] [CrossRef]
Figure 1. Parts of the reactor (a) and schematic diagram of the experimental AD system (b).
Energies 18 01425 g001
Figure 2. Cumulative specific biogas yield and methane concentration (a), cumulative specific methane yield (b), effect of nZVI dosage on maximum methane potential and lag phase time (according to RM results) (c) and removal efficiency of TS, VS and COD at different nZVI dosages (d) during the anaerobic digestion of sewage sludge (mean ± SD), n = 3.
Energies 18 01425 g002
Figure 3. Experimental average cumulative biogas production results obtained at different nZVI dosages and their fit to eight sigmoidal models. The black dotted line represents the best-fit model.
Energies 18 01425 g003
Figure 4. Experimental average cumulative methane production results obtained at different nZVI dosages and their fit to eight sigmoidal models. The black dotted line represents the best-fit model.
Energies 18 01425 g004
Table 1. Characteristics of substrate (SS), inoculum (Inoc.) and a mixture of SS and Inoc. (mean ± SD), n = 3.
ParametersSubstrateInoculumMixed Sludge (SS + Inoc.)
Total solids (TS, %)8.52 ± 0.034.29 ± 0.037.33 ± 0.06
Volatile solids (VS, %)5.14 ± 0.022.53 ± 0.024.39 ± 0.04
VS/TS (%)60.2758.9659.86
pH5.41 ± 0.117.69 ± 0.156.96 ± 0.003
Chemical oxygen demand (COD, g/L)82.967 ± 0.58635.533 ± 0.20870.967 ± 0.252
Table 2. Overview of the anaerobic batch experiments.
ReactorAdded Substrate Amount (kg)Added Inoculum Amount (kg)Added nZVI Amount (g)
B110.53.50
B25
B315.1
B430.2
Table 4. Efficiency (mean) of anaerobic digestion process in four reactors without (B1) and with nZVI particles (B2–B4).
ParameterB1B2B3B4
Max. CH4 content (%)76.6 (day 28th)75.3 (day 25th)73.5 (day 23rd)74.05 (day 20th)
Avg. CH4 content during steady period (%)69.9171.4871.7571.57
Cum. biogas yield (mL)206,317211,493266,412256,428
Cum. CH4 yield (mL)133,106134,204168,614169,579
Cum. specific biogas yield (mL/g-VSadded)336.08344.51416.42391.24
Cum. specific CH4 yield (mL/g-VSadded)217.19218.97263.99258.73
Biogas increase respect to the control (%)-2.508323.90516.413
Table 5. Summary of kinetic analysis based on cumulative biogas data using eight sigmoidal models for the anaerobic digestion of sewage sludge amended with varying nZVI dosages.
ModelParameterTreatment
Control0.5% nZVI1.5% nZVI3% nZVI
GompertzPmax345.83353.27430.13401.67
r03.07822.05770.63741.0339
α0.17460.16760.12390.1454
R20.99790.99860.99910.9995
RMSE7.2785.67285.61954.1385
NRMSE2.16561.64671.34951.0578
AIC172.73151.79151125.31
Akaike’s weight5.5752 × 10−251.0729 × 10−167.59875 × 10−90.0001
Modified GompertzPmax345.83353.26430.128401.67
Rmax22.2221.78419.60221.484
λ10.7048.99655.15346.6156
R20.99790.99860.99910.9995
RMSE7.2785.67285.61954.1385
NRMSE2.16561.64671.34951.0578
AIC172.73151.79151125.31
Akaike’s weight5.5752 × 10−251.0729 × 10−167.59875 × 10−90.0001
RichardsPmax344.17334.82430.09401.56
Rmax1.83118.6880.06740.0625
v0.03110.65110.00130.0011
λ10.8599.36035.15486.6159
R20.99790.99990.99910.9995
RMSE7.09512.35565.63174.1456
NRMSE2.11120.68381.35241.0596
AIC172.5979.972153.19127.45
Akaike’s weight5.9794 × 10−250.42232.54208 × 10−94.40391 × 10⁻⁵
Modified RichardsPmax334.57334.82431.33401.53
P020.19816.1970.42360.3667
Rmax1.01090.65090.00440.0041
ν3.12593.34680.10270.0916
λ11.2969.36025.11926.6182
R20.99990.99990.99890.9995
RMSE1.93592.35565.67774.1649
NRMSE0.58540.68381.36341.0645
AIC66.8481.972155.87129.84
Akaike’s weight0.05490.15546.65634 × 10−101.33308 × 10⁻⁵
LogisticPmax334.65341.81409.4386.44
k0.27140.26110.19730.2289
t018.65617.27816.11616.119
R20.99990.99990.99420.9955
RMSE1.96833.277913.34211.117
NRMSE0.58570.95153.20392.8416
AIC62.881105.73223.64208.32
Akaike’s weight0.39781.07736 × 10−61.27987 × 10−241.21099 × 10⁻²²
Modified logisticPmax334.65341.81409.4386.44
Rmax22.70922.31220.19622.113
λ11.2889.61875.98047.3813
R20.99990.99990.99420.9955
RMSE1.96833.277913.34211.117
NRMSE0.58570.95153.20392.8416
AIC62.881105.73223.64208.32
Akaike’s weight0.39781.07736 × 10−61.27987 × 10−241.21099 × 10⁻²²
ConePmax349.55359.909473.5422.93
k0.05360.05780.05790.0608
n4.66724.07642.44663.0501
R20.99830.99870.99960.9997
RMSE6.33895.36973.93164.1621
NRMSE1.88621.55870.94411.0638
AIC161.12147.18120.99125.79
Akaike’s weight1.8507 × 10−221.07549 × 10−150.02490.0001
SchnutePmax346.14354.08442.83406.83
r0253.84157.39256.25367.07
α0.17130.16190.10220.1302
β0.06120.09230.2980.1902
R20.99770.99810.99970.9999
RMSE7.74926.41293.51783.2649
NRMSE2.30581.86150.84480.8345
AIC179.99164.09113.66107.39
Akaike’s weight1.4783 × 10−262.28901 × 10−190.9750350170.9996
Abbreviations: RMSE: root mean square error, NRMSE: normalized root mean square error, AIC: Akaike’s Information Criterion.
Table 6. Summary of kinetic analysis based on cumulative methane data using eight sigmoidal models for the anaerobic digestion of sewage sludge amended with varying nZVI dosages.
ModelParameterTreatment
Control0.5% nZVI1.5% nZVI3% nZVI
GompertzPmax221.58222.49272.4264.03
r05.28874.02570.88421.3165
α0.19180.18930.13410.1585
R20.99990.99990.99970.9998
RMSE2.82992.23283.23032.5219
NRMSE1.30291.01971.22360.9747
AIC93.38273.474104.4983.701
Akaike’s weight4.51867 × 10−145.90669 × 10−61.16604 × 10−50.0035
Modified GompertzPmax221.58222.49272.39264.03
Rmax15.6415.49513.43915.401
λ12.07710.8676.60887.0439
R20.99990.99990.99970.9998
RMSE2.82992.23283.23032.5219
NRMSE1.30291.01971.22360.9747
AIC93.38273.474104.4983.701
Akaike’s weight4.51867 × 10−145.90669 × 10−61.16604 × 10−50.0035
RichardsPmax217.64219.88272.85264.1
Rmax11.8319.11180.33920.0488
v0.50960.33120.00940.0012
λ12.30511.016.57797.0355
R20.99990.99990.99960.9998
RMSE1.36211.67813.30112.5263
NRMSE0.62710.76641.25040.9764
AIC33.95951.484108.3285.848
Akaike’s weight0.36190.35191.71807 × 10−60.0012
Modified RichardsPmax217.41220.13272.29263.92
P011.5487.51480.08350.0394
Rmax0.53880.29140.00080.0004
ν2.95583.30620.08890.0841
λ12.34410.9756.61437.0233
R20.99990.99990.99970.9998
RMSE1.35391.66653.23482.5262
NRMSE0.62340.76111.22530.9764
AIC35.45152.9108.6187.843
Akaike’s weight0.17160.17341.48617 × 10−60.0004
LogisticPmax215.01216.19260.15255.48
k0.29790.29180.21370.2473
t019.36418.25516.79915.835
R20.99990.99990.99790.9982
RMSE2.23443.45737.94696.9838
NRMSE1.02881.57893.01032.6992
AIC73.534110.2180.11169.26
Akaike’s weight9.22464 × 10−106.25741 × 10−144.4263 × 10−229.10726 × 10⁻²²
Modified logisticPmax215.01216.19260.15255.48
Rmax16.01515.77113.89715.793
λ12.65111.4017.43967.7469
R20.99990.99990.99790.9982
RMSE2.23443.45737.94696.9838
NRMSE1.02881.57893.01032.6992
AIC73.534110.2180.11169.26
Akaike’s weight9.22464 × 10−106.25741 × 10−144.4263 × 10−229.10726 × 10⁻²²
ConePmax222.87224.7290.63274.33
k0.05170.05490.05740.0627
n5.33144.8962.8883.334
R20.99990.99990.99980.9999
RMSE2.15761.92092.92262.8108
NRMSE0.99340.87721.10711.0864
AIC70.59760.83396.08792.81
Akaike’s weight4.006 × 10−90.00320.00083.63324 × 10−5
SchnutePmax221.79222.88277.34266.27
r0359.42282.69288.49367.28
α0.18890.18490.11760.1456
β0.03840.05130.21210.1552
R20.99990.99990.99990.9999
RMSE2.99992.42172.40672.1522
NRMSE1.38131.10590.91170.8318
AIC100.2882.29481.77372.384
Akaike’s weight1.43592 × 10−157.17968 × 10−80.99920.9902
Abbreviations: RMSE: root mean square error, NRMSE: normalized root mean square error, AIC: Akaike’s Information Criterion.
Disclaimer/Publisher’s Note: The statements, opinions and data contained in all publications are solely those of the individual author(s) and contributor(s) and not of MDPI and/or the editor(s). MDPI and/or the editor(s) disclaim responsibility for any injury to people or property resulting from any ideas, methods, instructions or products referred to in the content.

