Article

Ventilation Air Methane (VAM) Utilisation: Comparison of the Thermal and Catalytic Oxidation Processes

1
Institute of Chemical Engineering, Polish Academy of Sciences, Bałtycka 5, 44-100 Gliwice, Poland
2
Central Mining Institute—National Research Institute, Plac Gwarków 1, 40-166 Katowice, Poland
3
Division of Machines and Equipment, KOMAG Institute of Mining Technology, Pszczyńska 37, 44-101 Gliwice, Poland
*
Author to whom correspondence should be addressed.
Energies 2025, 18(6), 1428; https://doi.org/10.3390/en18061428
Submission received: 3 February 2025 / Revised: 7 March 2025 / Accepted: 11 March 2025 / Published: 13 March 2025
(This article belongs to the Special Issue Experiments and Simulations of Combustion Process II)

Abstract

:
A significant problem in hard coal mining is the utilisation of ventilation air methane (VAM). Two basic methane combustion methods, thermal (homogeneous) and catalytic oxidation, are analysed in detail in this paper. Both processes are compared based on numerical simulations, applying the reaction kinetics developed in previous works, assuming a few typical monolithic reactor packings. The reactor’s mathematical model and kinetic equations are presented. The results are presented graphically as the temperature and reactant concentration distributions along the reactor, assuming different inlet methane concentrations in the VAM, inlet gas temperature and flow velocity. Interstage reactor cooling is simulated with a higher methane concentration for the catalytic process. The energetic problems of the process are analysed in terms of the heat recovery and resulting exergy, as well as the Carnot efficiency. The problem of toxic carbon monoxide emissions is also modelled and discussed, and the pros and cons of both VAM combustion methods are identified.

1. Introduction

Ventilation air methane (VAM) is created during the venting of underground methane coal mines. The ventilation system’s primary role is to ensure safe working conditions by removing solid and gaseous pollutants from the working environment.
Methane is a serious hazard released during mining operations in hard coal mines. Methane can cause deadly explosions. The lower explosion limit of methane (LEL) is 4.9% v/v, and the upper explosion limit (UEL) is 15% v/v, assuming a sufficient oxygen concentration. According to Polish mining regulations, if the methane concentration exceeds 2% v/v, the operation should be stopped, and people should be evacuated; the maximum concentration in the ventilation shaft cannot exceed 0.75% v/v [1]. According to the EU Methane Regulation, starting from January 2027, there will be limitations on the discharge of methane through ventilation shafts in coal mines, other than coking coal mines [2], due to the high global warming potential (GWP) of methane (the emission of 1 metric tonne of methane into the atmosphere corresponds to an impact of 29.8 metric tonnes of CO2) [3].
The amount of methane determines the technology that should be considered for its utilisation. Selecting the technology for methane utilisation is a difficult task. Ventilation air methane is not only a mixture of air and methane but includes dust and a high amount of water [4,5], and it may contain gaseous pollutants such as H2S or SO2 [6,7,8]. The technology should be suited to individual shafts. Emission characteristics must be considered, including the VAM flow rate, methane concentration, and their variability over time [9]. Typically, ventilation shafts emit large amounts of air with minimal concentrations of methane; as a result, appropriate technologies are needed to oxidise the methane into CO2 and H2O. The scale of the flow rate means that installations are usually designed in the form of modules, ensuring better control of their operation [10,11]. Another good solution would be to use VAM in power plant boilers instead of atmospheric air, as methane (and, possibly, other flammable components) burns at high temperatures, reducing energy consumption. For a somewhat similar problem—NOx emissions in power boilers operating at variable power—in the work presented in [12], the use of advanced neural networks for feedforward process control was proposed. A future concept for VAM elimination is presented in [13]. Methane can be absorbed in a multilayer coating material under ambient conditions. The first layer adsorbs and transfers methane to the second layer, where it is catalytically oxidised to formaldehyde; the latter can potentially polymerise to form a solid coating. Such coatings can form on the surface of mine tunnels, eliminating up to 99% of the methane under ambient conditions [13].
Depending on the VAM emission conditions, in particular, the ventilation air flow rate and methane concentration, the following technologies can be used for its disposal:
  • Catalytic technologies
  • Catalytic reverse flow reactor;
  • Catalytic monolithic reactor;
  • Catalytic lean burn gas turbine.
  • Thermal technologies
  • Thermal reverse flow reactor;
  • Recuperative gas turbine.
  • Adsorption technology
  • Methane concentrator.
Considering the methane concentration in VAM (often less than 1% v/v in Polish coal mines, with the concentration ranging from 0.01 to 0.43% v/v [14]) and the volume and variability of the streams, thermal or catalytic oxidation seem to be the most promising method of utilisation. In the catalytic process, a catalyst allows for oxidation at lower temperatures and low methane concentrations. However, it requires a much higher degree of purity than a thermal solution. According to the literature, the minimum methane concentration of 0.2% v/v is required for the realisation of the oxidation process in reversal flow reactors [15,16], 0.3% v/v for thermal reactors [9,17], and about 0.1% v/v [18,19] for catalytic converters. A higher concentration results in a higher temperature inside the reactor; the excess energy can then be utilised. In the case of catalytic reactors, however, even a short-term increase in the methane concentration can destroy the catalyst thermally [20]. However, in industrial VAM installations, the vast majority oxidises methane thermally; regenerative thermal oxidation (RTO) is a technology used for methane concentrations below 1.5% [5,19]. Although this process is characterised by high destruction efficiency and operational capacity, it also has the following disadvantages: the installation takes up a large area, consumes a lot of energy, requires continuous operation and emits other unwanted pollutants such as CO and NOx [21].
Both of the VAM utilisation technologies (i.e., thermal and catalytic) have pros and cons. The thermal process requires higher temperatures and sometimes additional energy for very dilute mixtures. The catalytic process, in turn, is sensitive to overheating in the case of higher methane concentrations, thus leading to thermal catalyst deactivation. Additionally, a catalyst may be poisoned by contaminants present in ventilation air, such as sulphur compounds. The catalytic process places greater demands on the purity of the ventilation air, and there is always the risk of the catalyst’s destruction. Moreover, the catalyst contains noble metals (e.g., platinum or palladium) and has a limited lifetime; thus, it needs to be replaced from time to time, which affects the overall cost of the process [22]. However, this process can run at lower temperatures than the thermal one, which is beneficial from an economic point of view. Another advantage of the catalytic process is—in many cases—the absence of a dangerous intermediate product, carbon monoxide. Carbon monoxide usually appears in thermal processes, and its complete combustion (which is necessary for this dangerous poison) requires a much longer reactor and sometimes even an additional catalytic reactor to oxidise the remaining CO [23,24].
Dust, humidity, and possibly sulphur compounds have an essential impact on the VAM utilisation process. The amount of dust changes depending on the mining work [6], and it contains combustible (coal) and incombustible (stone) ingredients [25]. Coal may combust in a high-temperature process, creating hot spots that are dangerous for catalysts. The hard coal dust usually contains sulphur, which may poison the catalyst [26]. The second ingredient of the dust is stone dust, which may cause the sintering of dust particles [27]. Well-selected reactor packing that ensures free dust flow, such as a monolith with relatively large channel dimensions (e.g., 3 × 3 mm), may not increase the gas hydraulic resistance [28]. Water vapour is another pollutant with particular importance for catalytic methods. Water may cover the catalyst’s active centres, inhibiting the oxidation reaction [29,30,31], although the deactivation is more or less reversible [32,33]. Moreover, the presence of water in the VAM stream affects the stable operation of the catalytic reactor.
In the present study, both VAM oxidation methods, catalytic and thermal, are compared based on numerical simulations using a differential mathematical model of the reactor, applying the reaction kinetics developed in previous works [24,34,35]. The assessment considered many aspects, including the concentration and temperature distributions, as well as the process efficiency. The novelty of this work lies in the determination of the reactor length necessary to achieve the required methane conversion, as well as CO removal. The thermal deactivation of the catalyst is also analysed. The calculation results are presented in graphs, allowing for an evaluation and comparison of both approaches. A discussion is presented, and both methods’ pros and cons are considered.

2. Modelling

The mathematical model of the catalytic and thermal reactors for the oxidation of lean methane–air mixtures is based on the external surface of the reactor packing.
The mass balance of reagent A is formulated for the assumed conditions of a steady state and no axial dispersion [34], as follows:
w 0 d C A d x + a k C C A C A S = 0 ,
The reagent transported to the catalyst’s (solid reactor packing) surface is balanced by the following chemical reaction:
k C C A C A S = k r C A S ,
which introduces the following:
k C r = k C k r k C + k r ,
The mass balance is as follows:
w 0 d C A d x + a k C r C A = 0 ,
with the following boundary condition:
x = 0 :   C A = C A i n ,
From the definition of the kCr coefficient in Equation (3), it follows that when kr >> kC, then kCrkC. Such is the case in these calculations, since kr is at least one order of magnitude larger than kC. In other words, this is the slowest stage, which limits the entire process. This explains why, despite different types of reactions (homogeneous and heterogeneous), both processes look similar.
The energy balance, formulated under similar assumptions (i.e., steady state and no axial heat conduction), is as follows:
w 0 ρ c p d T d x + a α T T S + k H P C A c T T H = 0 ,
with the following boundary condition:
x = 0 :   T = T i n ,
The heat transport from the reactor packing to the flowing gas phase is as follows:
a α T T S = H r a k C r C A ,
After joining (8) and (6), we obtain the following:
w 0 ρ c p d T d x = H r a k C r C A k H P c A c T T H ,
Alternatively, assuming a negligible heat loss, there is the following:
w 0 ρ c p d T d x = H r a k C r C A ,
The above assumptions are typical ones that can be found in the literature [24,35,36,37].

2.1. Kinetics of the Thermal Oxidation

In the case of thermal methane combustion, two reactions have to be considered (methane’s oxidation to water and carbon monoxide), as follows:
CH4 + 1.5O2 = CO + 2H2O  reaction 1,
and the monoxide to dioxide oxidation occurs as follows:
CO + 0.5O2 = CO2   reaction 2,
The kinetic equation in [23] was formulated for each reaction’s two temperature ranges, called the low-/high-temperature ranges (LT/HT). According to [23], if reaction 1’s rate for the LT range is higher than that for the HT range (i.e., r1-LT > r1-HT), then the LT value for reaction 2, r2-LT, has to be used in the calculations, and vice versa.
The kinetic equations are as follows:
R e a c t i o n   1 L T : r 1 L T = 0.228   e x p 1.20 · 10 5 R T C A 0.9 ,
R e a c t i o n   1 H T : r 1 H T = 82.9 · 1 0 3   e x p 2.23 · 10 5 R T C A 0.8 ,
R e a c t i o n   2 L T : r 2 L T = 41.5   e x p 1.46 · 10 5 R T C A 1.1 ,
R e a c t i o n   2 H T : r 2 H T = 66.8 · 1 0 6   e x p 2.94 · 10 5 R T C A 0.3 ,
The reactions enthalpies are as follows:
ΔHr1 = −519.60∙106 J/kmol
ΔHr2 = −283.12∙106 J/kmol
Because of an important temperature increase, the reagent volume (mole) mass fraction is most convenient for the combustion case. The relationship between the mole fraction, yA, and the mole concentration, CA, is as follows:
C A = P R T y A ,
The mass balances for the two reagents, CH4 (1) and CO (2), are as follows:
d y 1 d x = a w 0 k C r 1 y 1 ,
d y 2 d x = d y 1 d x a w 0 k C r 2 y 2 ,
The energy balance for the two thermal combustion reactions becomes the following:
d T d x = 1 ρ c p H r 1 d y 1 d x + H r 2 d y 2 d x P R T ,
The mass transfer coefficient, kC, was calculated for the case of a square monolith channel and a fully developed laminar flow with the H1 boundary condition (i.e., constant heat or mass flux at the channel wall); thus, the Nusselt and Sherwood numbers are as follows:
N u = α d H λ = S h = k C d H D A = 3.608 ,
Apart from a very short inlet section, the fluid velocity has no effect on the mass and heat transfers in the capillary channels of the monoliths. There, a fully developed laminar flow exists and the heat and mass transport (Sherwood and Nusselt numbers) are constant and non-affected by the fluid velocity; thus, Nu and Sh numbers with constant values are commonly used in similar cases [38].

2.2. Kinetics of the Catalytic Oxidation

For the catalytic oxidation of methane, the palladium catalyst was chosen, as described by Gancarczyk et al. [24]. The catalyst was prepared using the sonication method. It can be layered on carriers with diverse structures, including classic ceramic monoliths. In the presence of a catalyst, methane oxidation may be considered as a one-step reaction, as the amount of produced carbon dioxide was found to be negligible [24], as follows:
CH4 + 2O2 = CO2 + 2H2O reaction 3,
The reaction enthalpy is as follows:
ΔHr3 = −802.72∙106 J/kmol
The kinetics equation derived in [34] was first-order, as follows:
R e a c t i o n   3 c a t a l y t i c : r 3 = 1.07 · 1 0 10   e x p 1.10 · 10 5 R T C A

2.3. Simulation Assumptions

The mathematical simulations of the lean methane mixture’s oxidation, both thermal and catalytic, were performed using MATLAB 2024a software for a reasonably wide range of process parameters, like temperature, flow velocity, and inlet methane concentration.
A scheme of the reactor considered in the article is presented in Figure 1. The figure shows a three-stage reactor with interstage coolers, preventing the catalyst’s deactivation temperature from exceeding. Such a system is considered for catalytic reactors, and depending on the methane concentration, several coolers can be used. For the thermal process, the division of the packing into stages, as well as the interstage cooling, are not necessary. It should be emphasised that, in this work, the issues of heating the inlet gas stream and heat recovery from the exhaust gases were not considered, as these problem were recently discussed in [35].
The reactor was assumed to be isolated with mineral wool (100 mm thick, thermal conductivity coefficient of 0.040 Wm−1K−1). The heat losses were assumed to be negligibly small in light of the modelling presented in [35]. The omission of heat losses into the environment (i.e., the simplifications of Equation (9) to Equation (10)), results from really low heat losses, much lower than 1% of the total released reaction heat in the device, and do not significantly affect the calculation results.
The process was stationary. The following equations describing the mass and energy balance were solved simultaneously: for the thermal process, Equations (18) and (19) (mass) and Equation (20) (energy), and for the catalytic process, Equations (4) (mass) and (10) (energy). The inlet’s superficial gas velocity, w0, is given for the standard conditions (i.e., 1 atm and 0 °C); thus, the actual gas velocity in the reactor is much higher than the given inlet velocity, and this changes (increases) with the process temperature.
The mathematical model, Equations (1)–(10), basically comes down to solving two differential Equations (4) and (10) with boundary conditions (5) and (7). This is the initial value problem of the system of ordinary differential equations, which was solved using the built-in MATLAB function ode45, which uses the Dormand–Prince (RKDP) method to solve ordinary differential equations (ODEs). This method is a member of the Runge–Kutta family of ODE solvers. It uses six function evaluations to calculate fourth- and fifth-order accurate solutions. As a single-step solver, it needs only the solution at the immediately preceding time point, y(tn−1), to compute y(tn).
The process was assumed to be performed within a tubular reactor filled with structured catalytic and thermal oxidation internals. During the calculations, typical ceramic monoliths were chosen from 100 cpsi (channels per square inch) up to 900 cpsi to show the specific surface impact. For the catalytic process, the catalyst was assumed to be deposited at the carrier’s (i.e., monolith) surface; thus, the specific surface area was proportional to the amount of catalyst, strongly impacting the reactor’s functioning. The parameters of the monolithic internals are shown in Table 1.
Thermal oxidation does not require a catalyst, often being referred to as “homogeneous oxidation”, in contrast to the catalytic “heterogeneous” process. However, the experiments performed in [23] prove the strong impact of the non-catalytic surface of the reactor internals (ceramic monolith). The phenomenon was explained by the free radicals that generated on the solid surface, and the term “pseudo-catalytic reaction” was formulated. In this modelling, we introduced the specific surface’s influence on the model’s reaction rate.
During the simulation, the following initial reaction temperatures were assumed:
  • Thermal afterburning—700 °C;
  • Catalytic afterburning—400 °C.
The maximum reaction temperature was not limited for the thermal afterburning, while 500 °C was assumed as the maximum temperature for the catalytic process. Since this value may be exceeded at higher methane concentrations, interstage gas cooling was considered in such cases.
However, the amount of heat is not the only parameter describing its value from an energy point of view. Exergy is a convenient tool for analysing the value of thermal energy, representing the maximum possible mechanical work that can be obtained from a given amount of thermal energy (or heat flow) under equilibrium conditions, particularly for the current ambient temperature. Therefore, the temperature potential of the recovered thermal energy (reaction heat) is essential. Since heat is recovered in heat exchangers in the case considered here, the exergy stream will be equal to the value of the heat stream multiplied by the Carnot efficiency, as follows:
B Q = Q T H T o T H = Q · η C ,
where BQ is the exergy stream, Q is the heat stream, To is the ambient temperature (=20 °C), TH is the temperature of the heat source, and ηC is the Carnot efficiency. The heat, Q, and exergy, BQ, are given in kJ/kg of the reactive gas. Temperature TH is assumed to be equal to the reactive gas temperature, either interstage or outlet, as the classic exergy definition assumes equilibrium conditions, thus negligible temperature differences in heat exchangers.

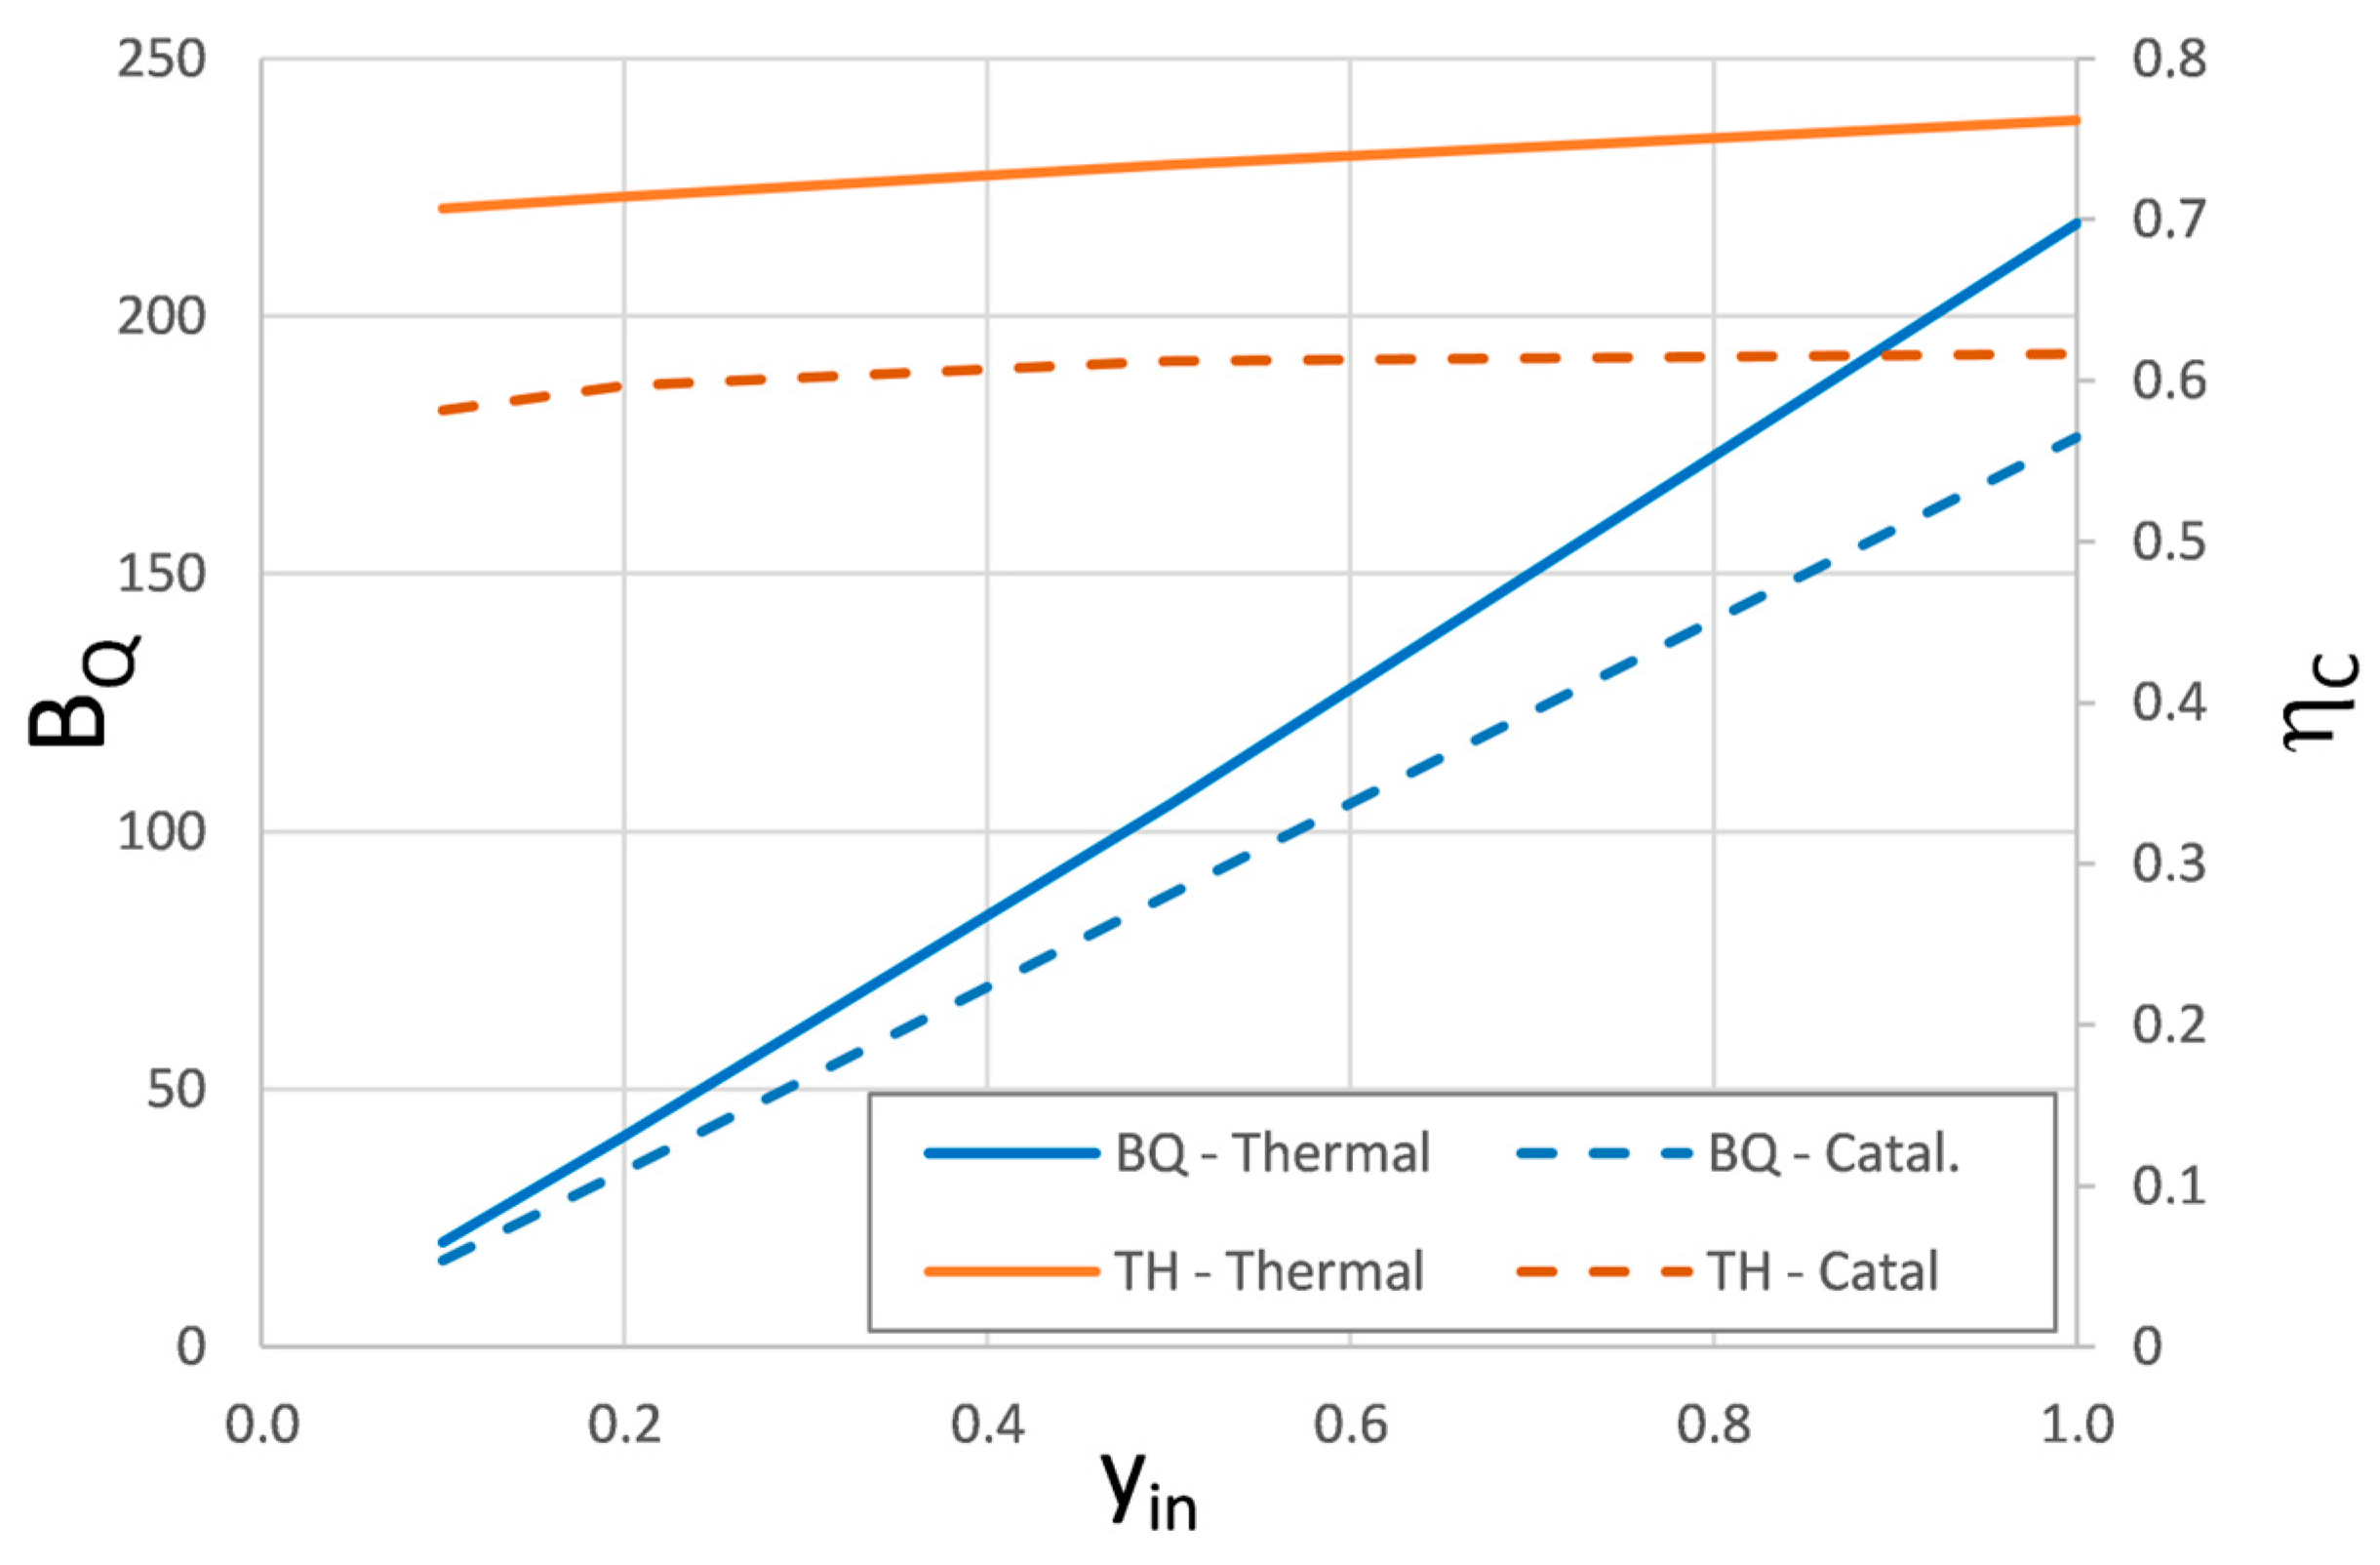
3. Results and Discussion

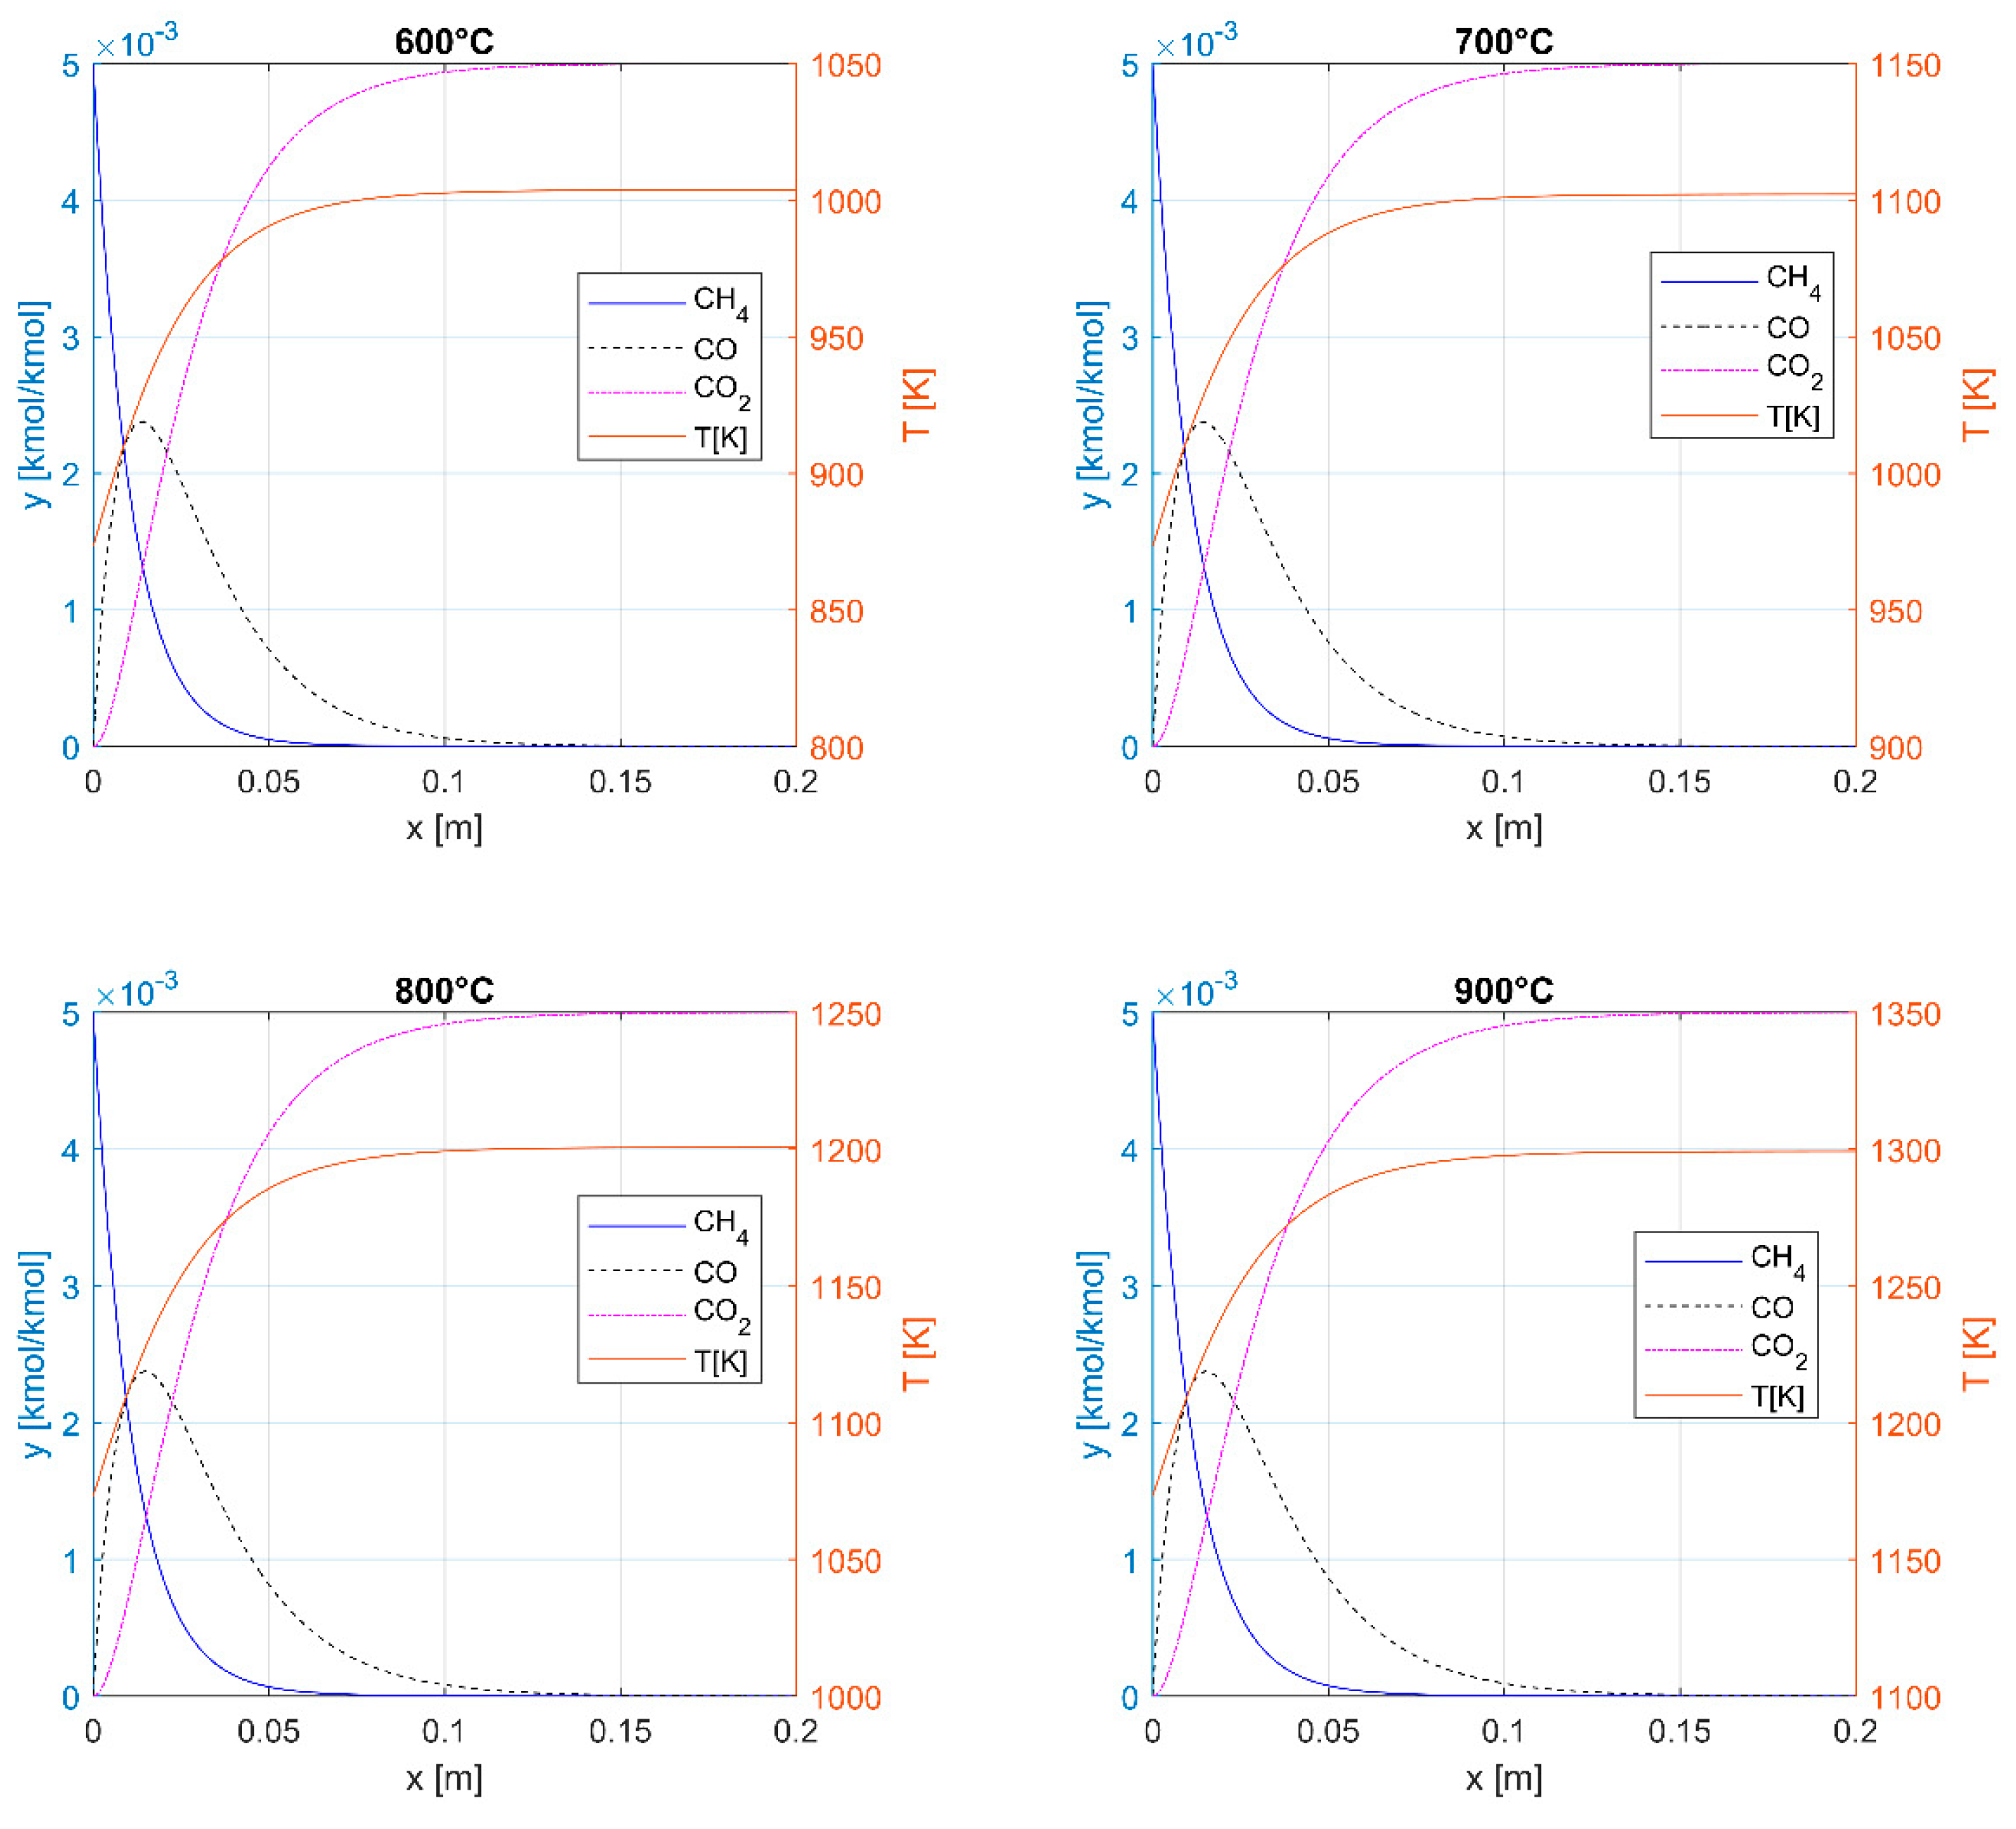
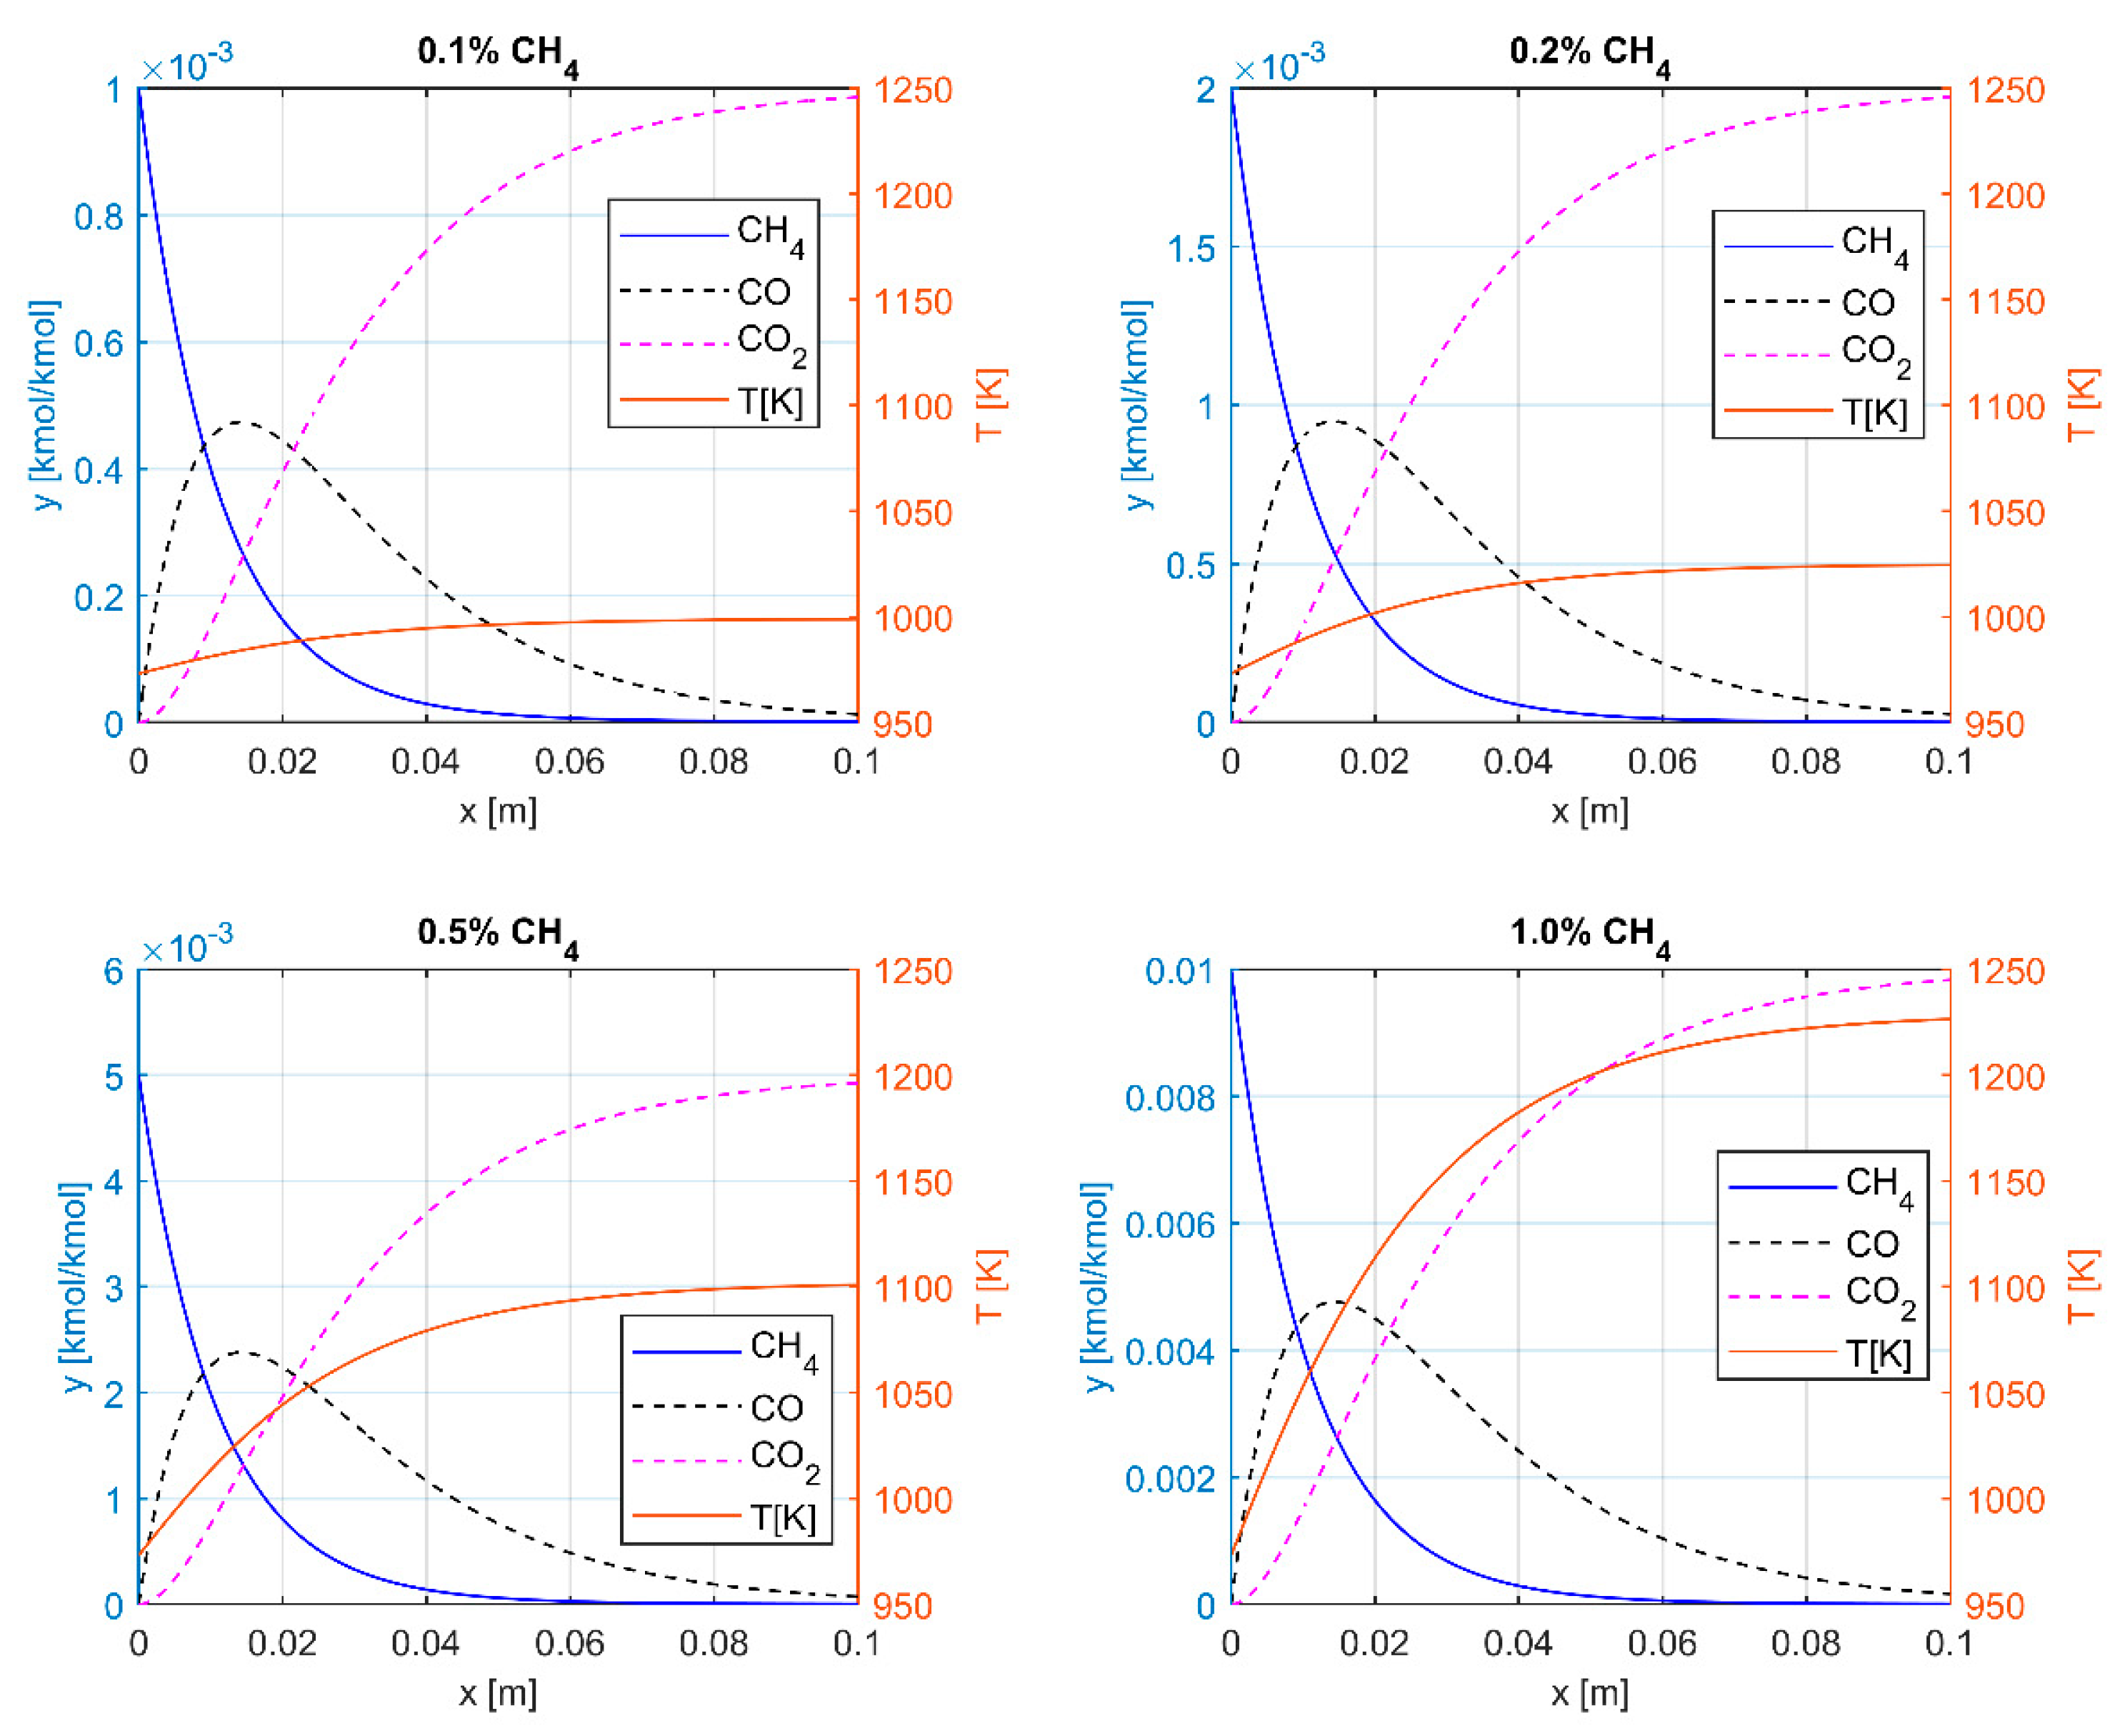
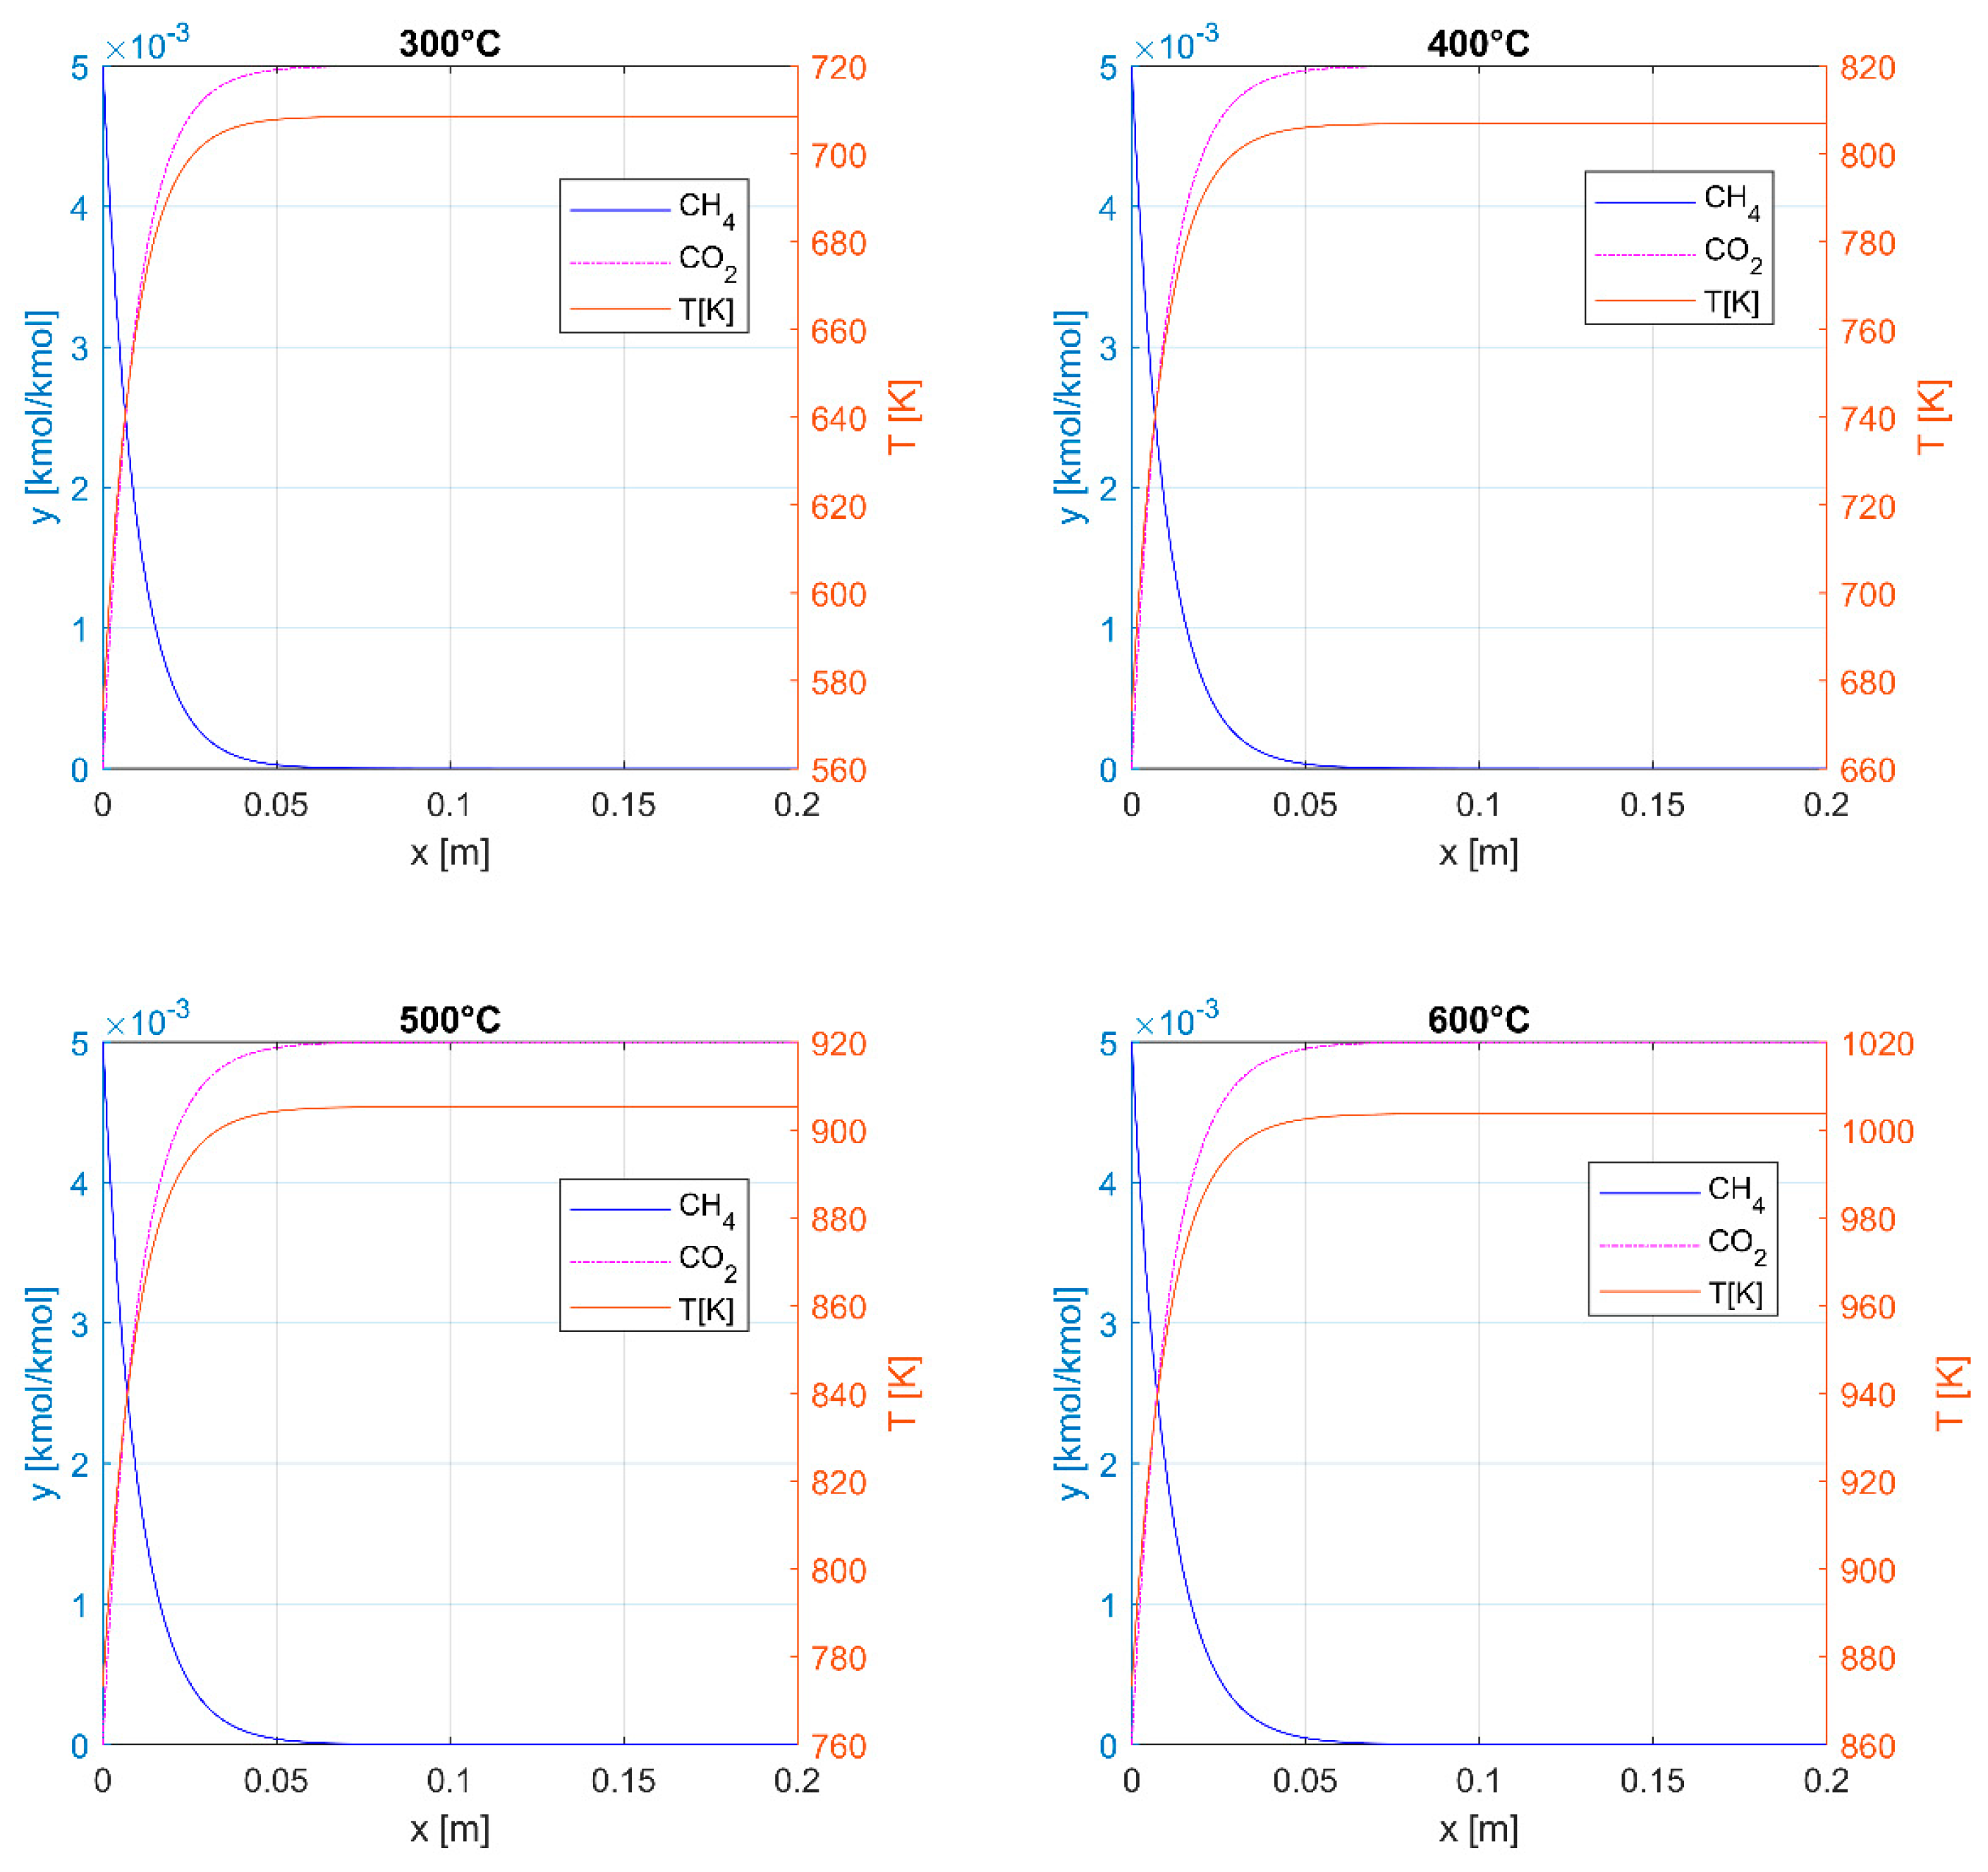
3.1. Thermal Oxidation

An important factor in the functioning of reactors is achieving the desired process conversion, which depends on several process parameters. In this model, for the required conversion (η = 95%) and methane inlet concentration (yin = 1% v/v), the influence of the gas superficial velocity, w0, the specific surface area, a, of the reactor internals and the necessary reactor length, x, were checked. The results are shown in Figure 2. Judging from the modelling performed, the reaction rate in the majority of temperature and velocity ranges is much higher than that of diffusion; thus, the process rate is controlled by diffusion. Therefore, increasing the specific surface area, a, leads to the reactor shortening due to increased reaction kinetics and a larger surface, thus increasing the rate of the reactant’s diffusion to the surface. Increasing the superficial velocity requires a significantly longer reactor to maintain the required residence time, with mass transfer intensification having a minor impact. The greater the expected conversion, the longer the necessary reactor length. Note that a higher inlet temperature or methane concentration produces plots that are similar in shape and have moderate value shifts. Moreover, the plot in Figure 1 refers only to methane conversion, and it does not consider the occurrence of CO in the process, as mentioned above.
The impact of the monolith channel density (i.e., the specific surface area of the structured reactor) is shown in Figure 3. As can be seen, the final process temperature does not depend on the monolith density, but for the higher specific surface area of the packing, it is reached faster. High methane conversion is achieved relatively quickly and is influenced by the packing surface. For a 100 cpsi monolith, a near-zero methane concentration was achieved for a reactor length of about x = 0.12 m; for 200 cpsi, x = 0.06 m; for 400 cpsi, x = 0.04 m; and for 900 cpsi, x = 0.02 m (see Figure 2). However, it is not the methane conversion that is crucial in this case, but the delayed conversion of carbon monoxide to dioxide. A near-zero carbon monoxide concentration was achieved for the 100 cpsi monolith for length x > 0.2 m; for 200 cpsi, x = 0.12 m; for 400 cpsi, x = 0.07 m; and for 900 cpsi, x = 0.03 m. Generally, achieving satisfactory conversion of carbon monoxide to carbon dioxide requires about twice as long a reactor as oxidising methane for “any” product. It must be taken into account here that the emission of carbon monoxide into the atmosphere is subject to stringent restrictions. This highly toxic gas is a very problematic byproduct, and its removal by thermal combustion alone may not be sufficient to meet emission standards. An additional catalytic converter for carbon monoxide removal may be necessary in such a situation.
The impacts of the gas’s superficial velocity on the temperature and concentration profiles are presented in Figure 4. As can be seen, the higher the gas velocity, the greater the required reactor length. The influence of the gas velocity on the mass and heat transport in monoliths, where laminar flow prevails in millimetre channels, is, in practice, negligible, and, according to the theory, the reactor length is proportional to the reactant flow velocity. In other words, to achieve the required conversion, an appropriate residence time is necessary, equal to the ratio of the reactor length to the reactant velocity; the appropriate relationship can easily be derived from Equation (4) after its integration. Of course, the relationships, simple in the case of an (approximately) isothermal process, are complicated and somewhat distorted by the energetic effect of methane combustion, described by the coupled Equation (10).
The temperature distribution along the reactor is affected by the inlet temperature; in particular, the outlet temperature is linearly dependent on the inlet temperature, as shown in Figure 5. The temperature distribution curve is “shifted” vertically, proportionally to the inlet temperature value. However, the distributions of the reactant concentrations along the reactor are identical and do not depend on the inlet temperature. This situation is caused by the relatively slow diffusional transport of reactants to the surface of the reactor packing. Of course, the chemical reaction of the methane oxidation is faster at higher temperatures, but this has practically no effect on the overall rate of the process, which is fully controlled by the diffusion of the reactants.
The impact of the inlet methane concentration on the temperature and concentration profiles along the reactor is presented in Figure 6. The amount of methane supplied to the reactor significantly affects the temperature distribution, particularly the gas outlet temperature, which is justified by the thermodynamics of the process. However, the shapes of the concentration profiles are similar. The methane amount supplied to the reactor affects only the temperature distribution, as a higher reaction heat (enthalpy) is released. Because the gas velocity and the density of the monolith used for modelling are the same for all results presented in Figure 4, the residence time is also the same; thus, the process conversion was (almost) identical despite the different initial methane concentrations.
The heat possible to recover from the outlet gas for different methane inlet concentrations is presented in Table 2, together with the gas outlet temperature, resulting in exergy and Carnot efficiency. The Carnot efficiency slightly increases with the methane concentration due to the higher temperatures of the process. The heat stream Q depends linearly on the methane concentration. As a result, the exergy of the process increases significantly with the methane concentration. A comparison of energy and exergy recovered in the thermal process with the catalytic process is presented later in the article.

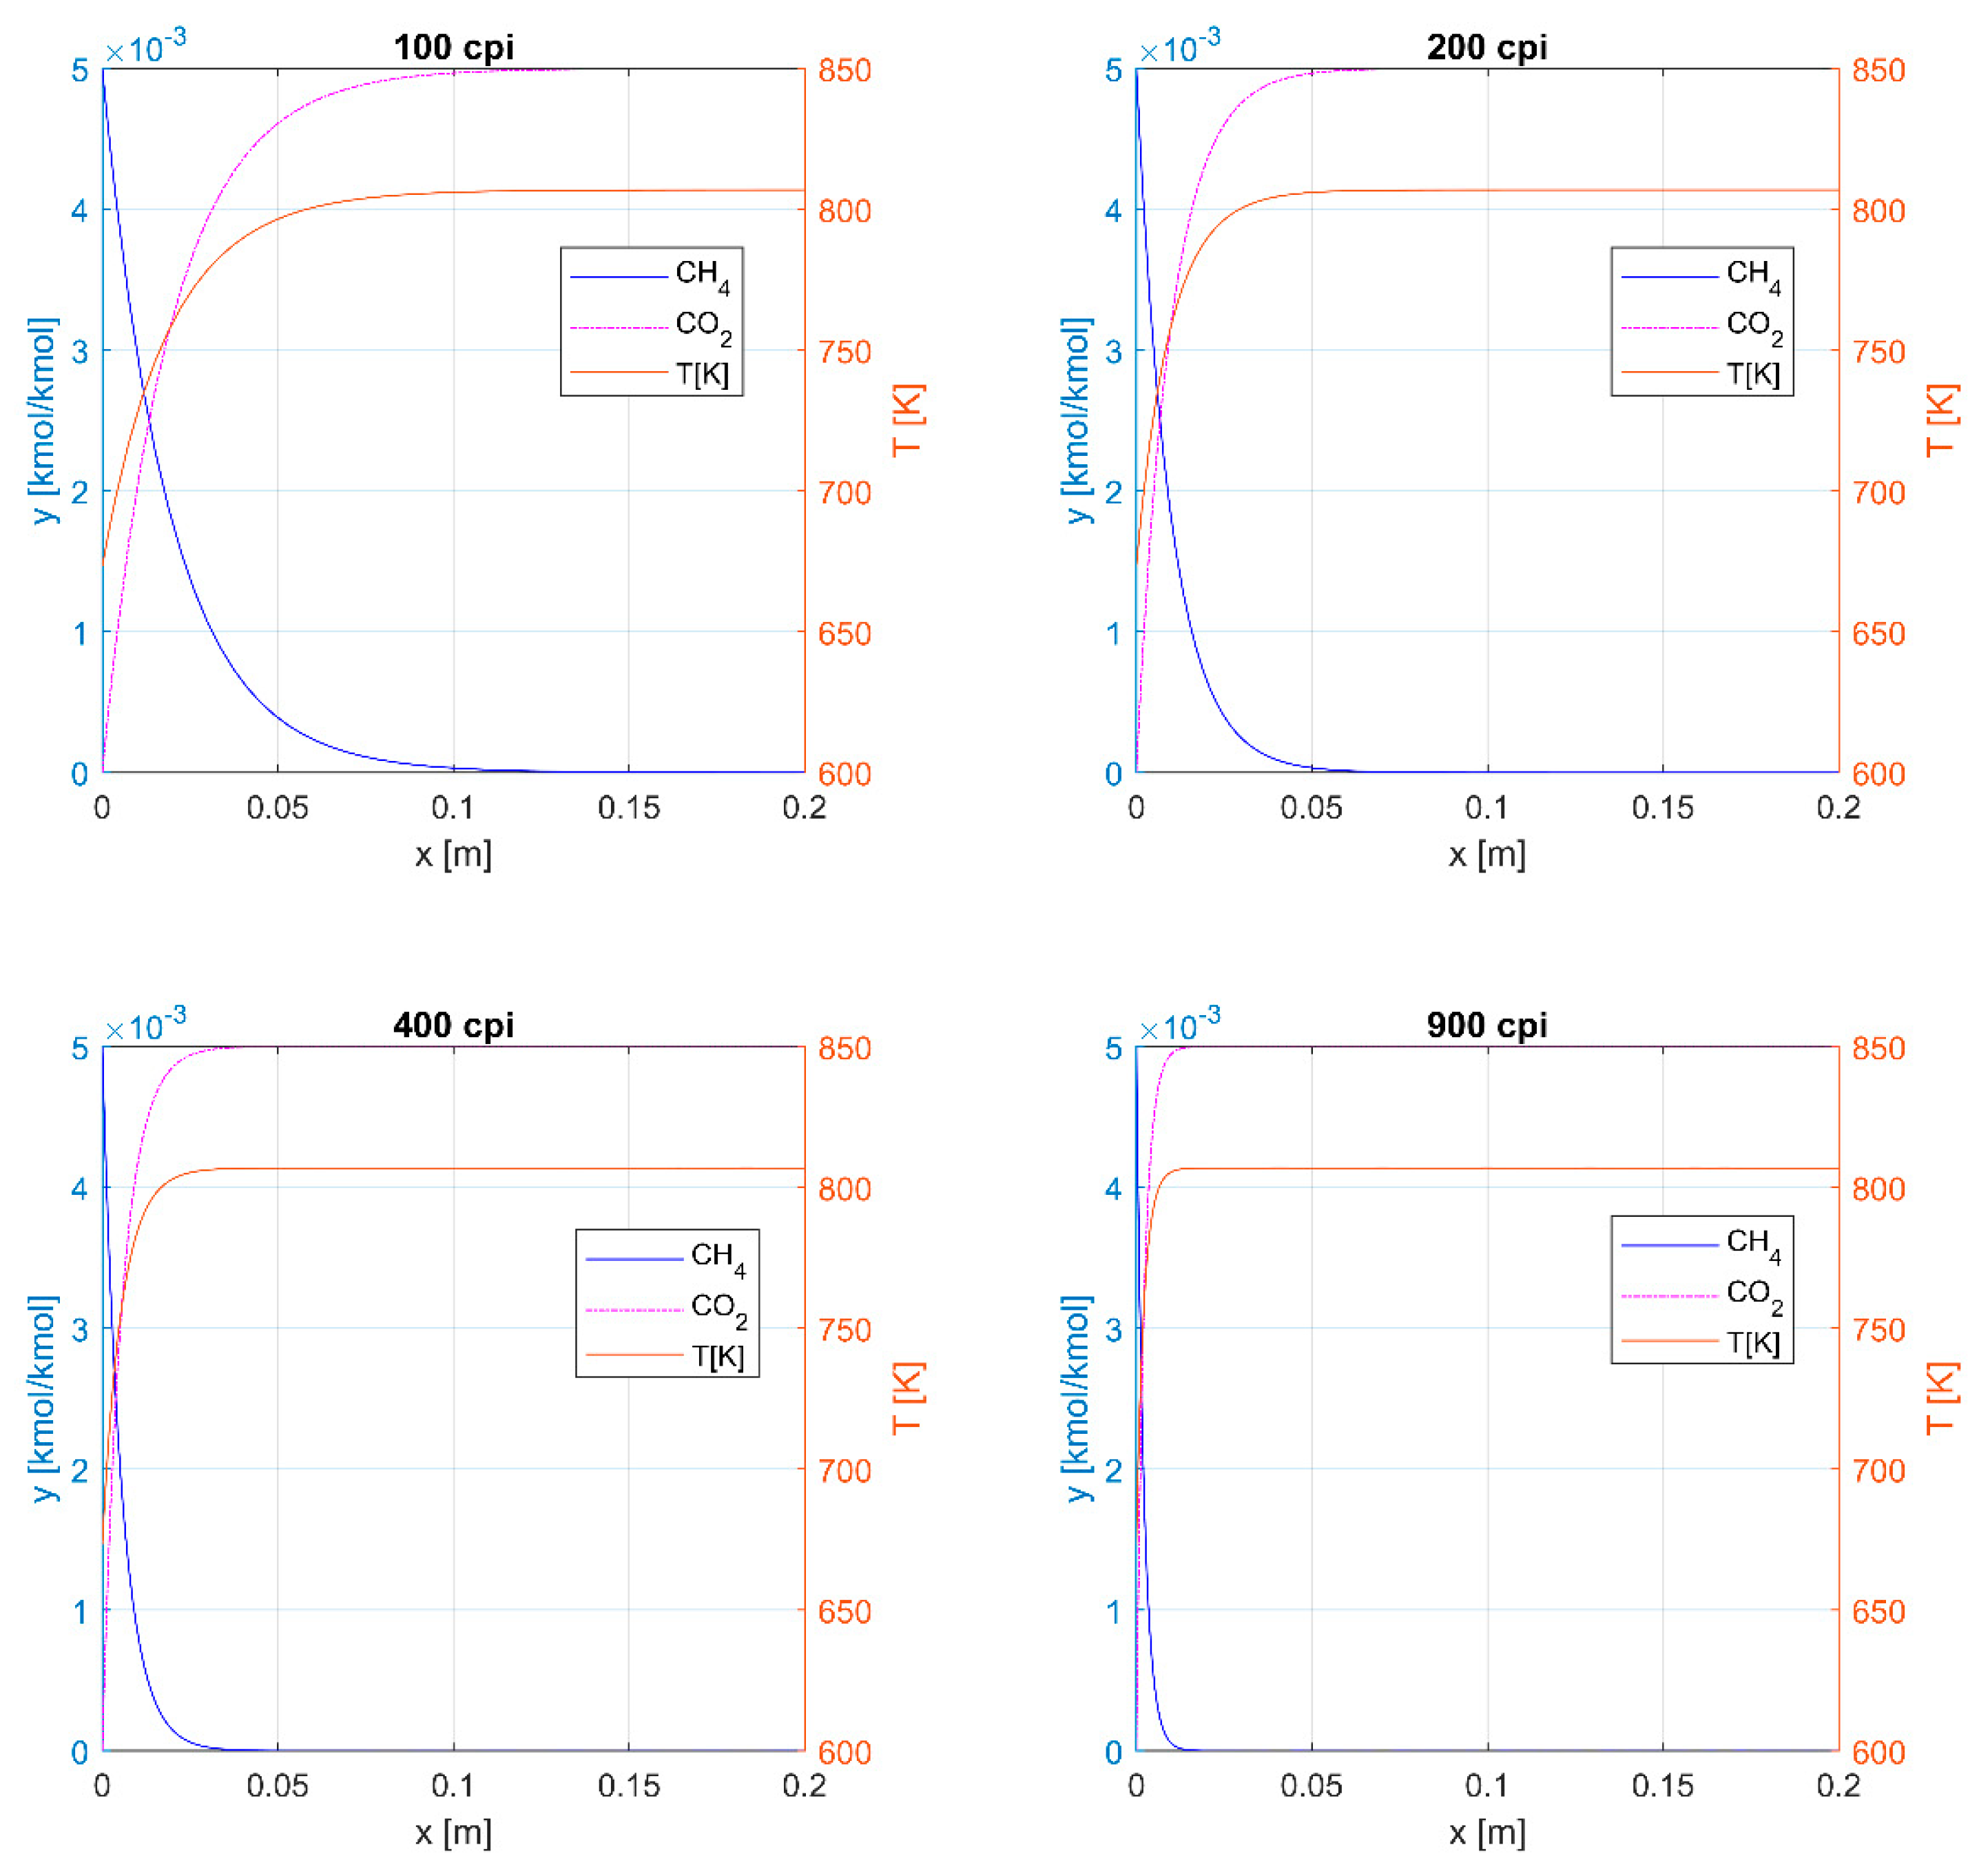
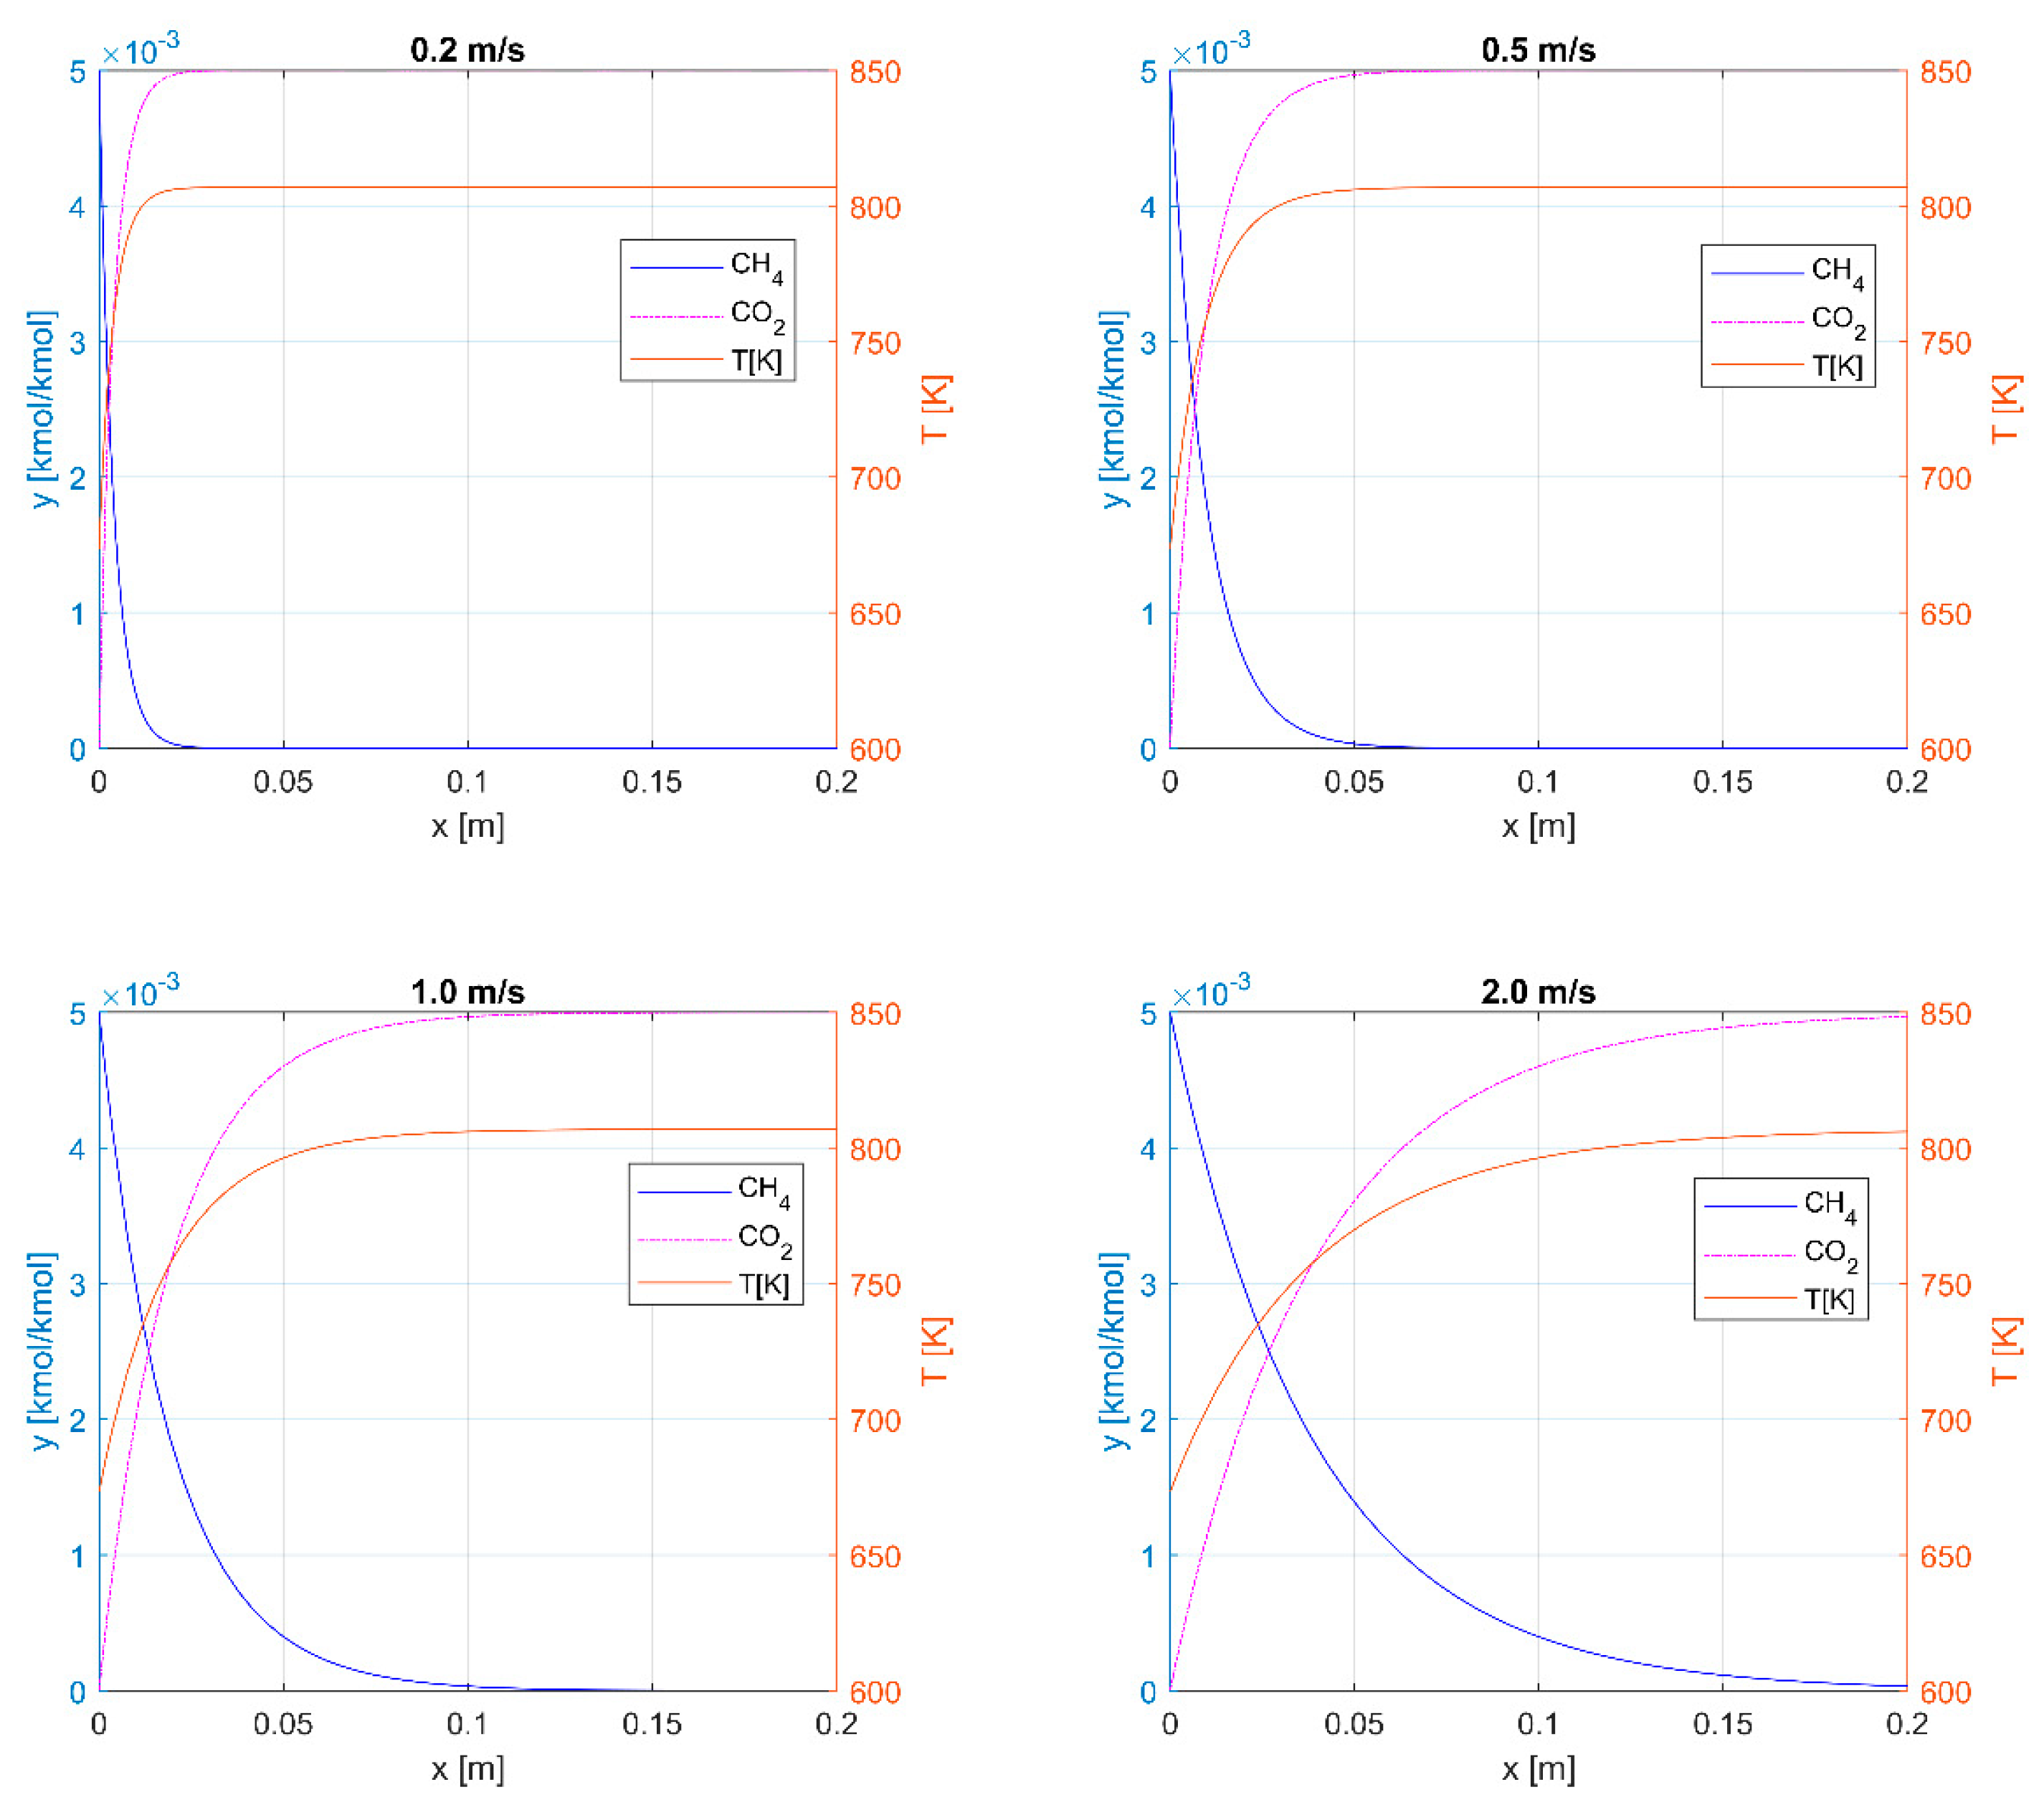
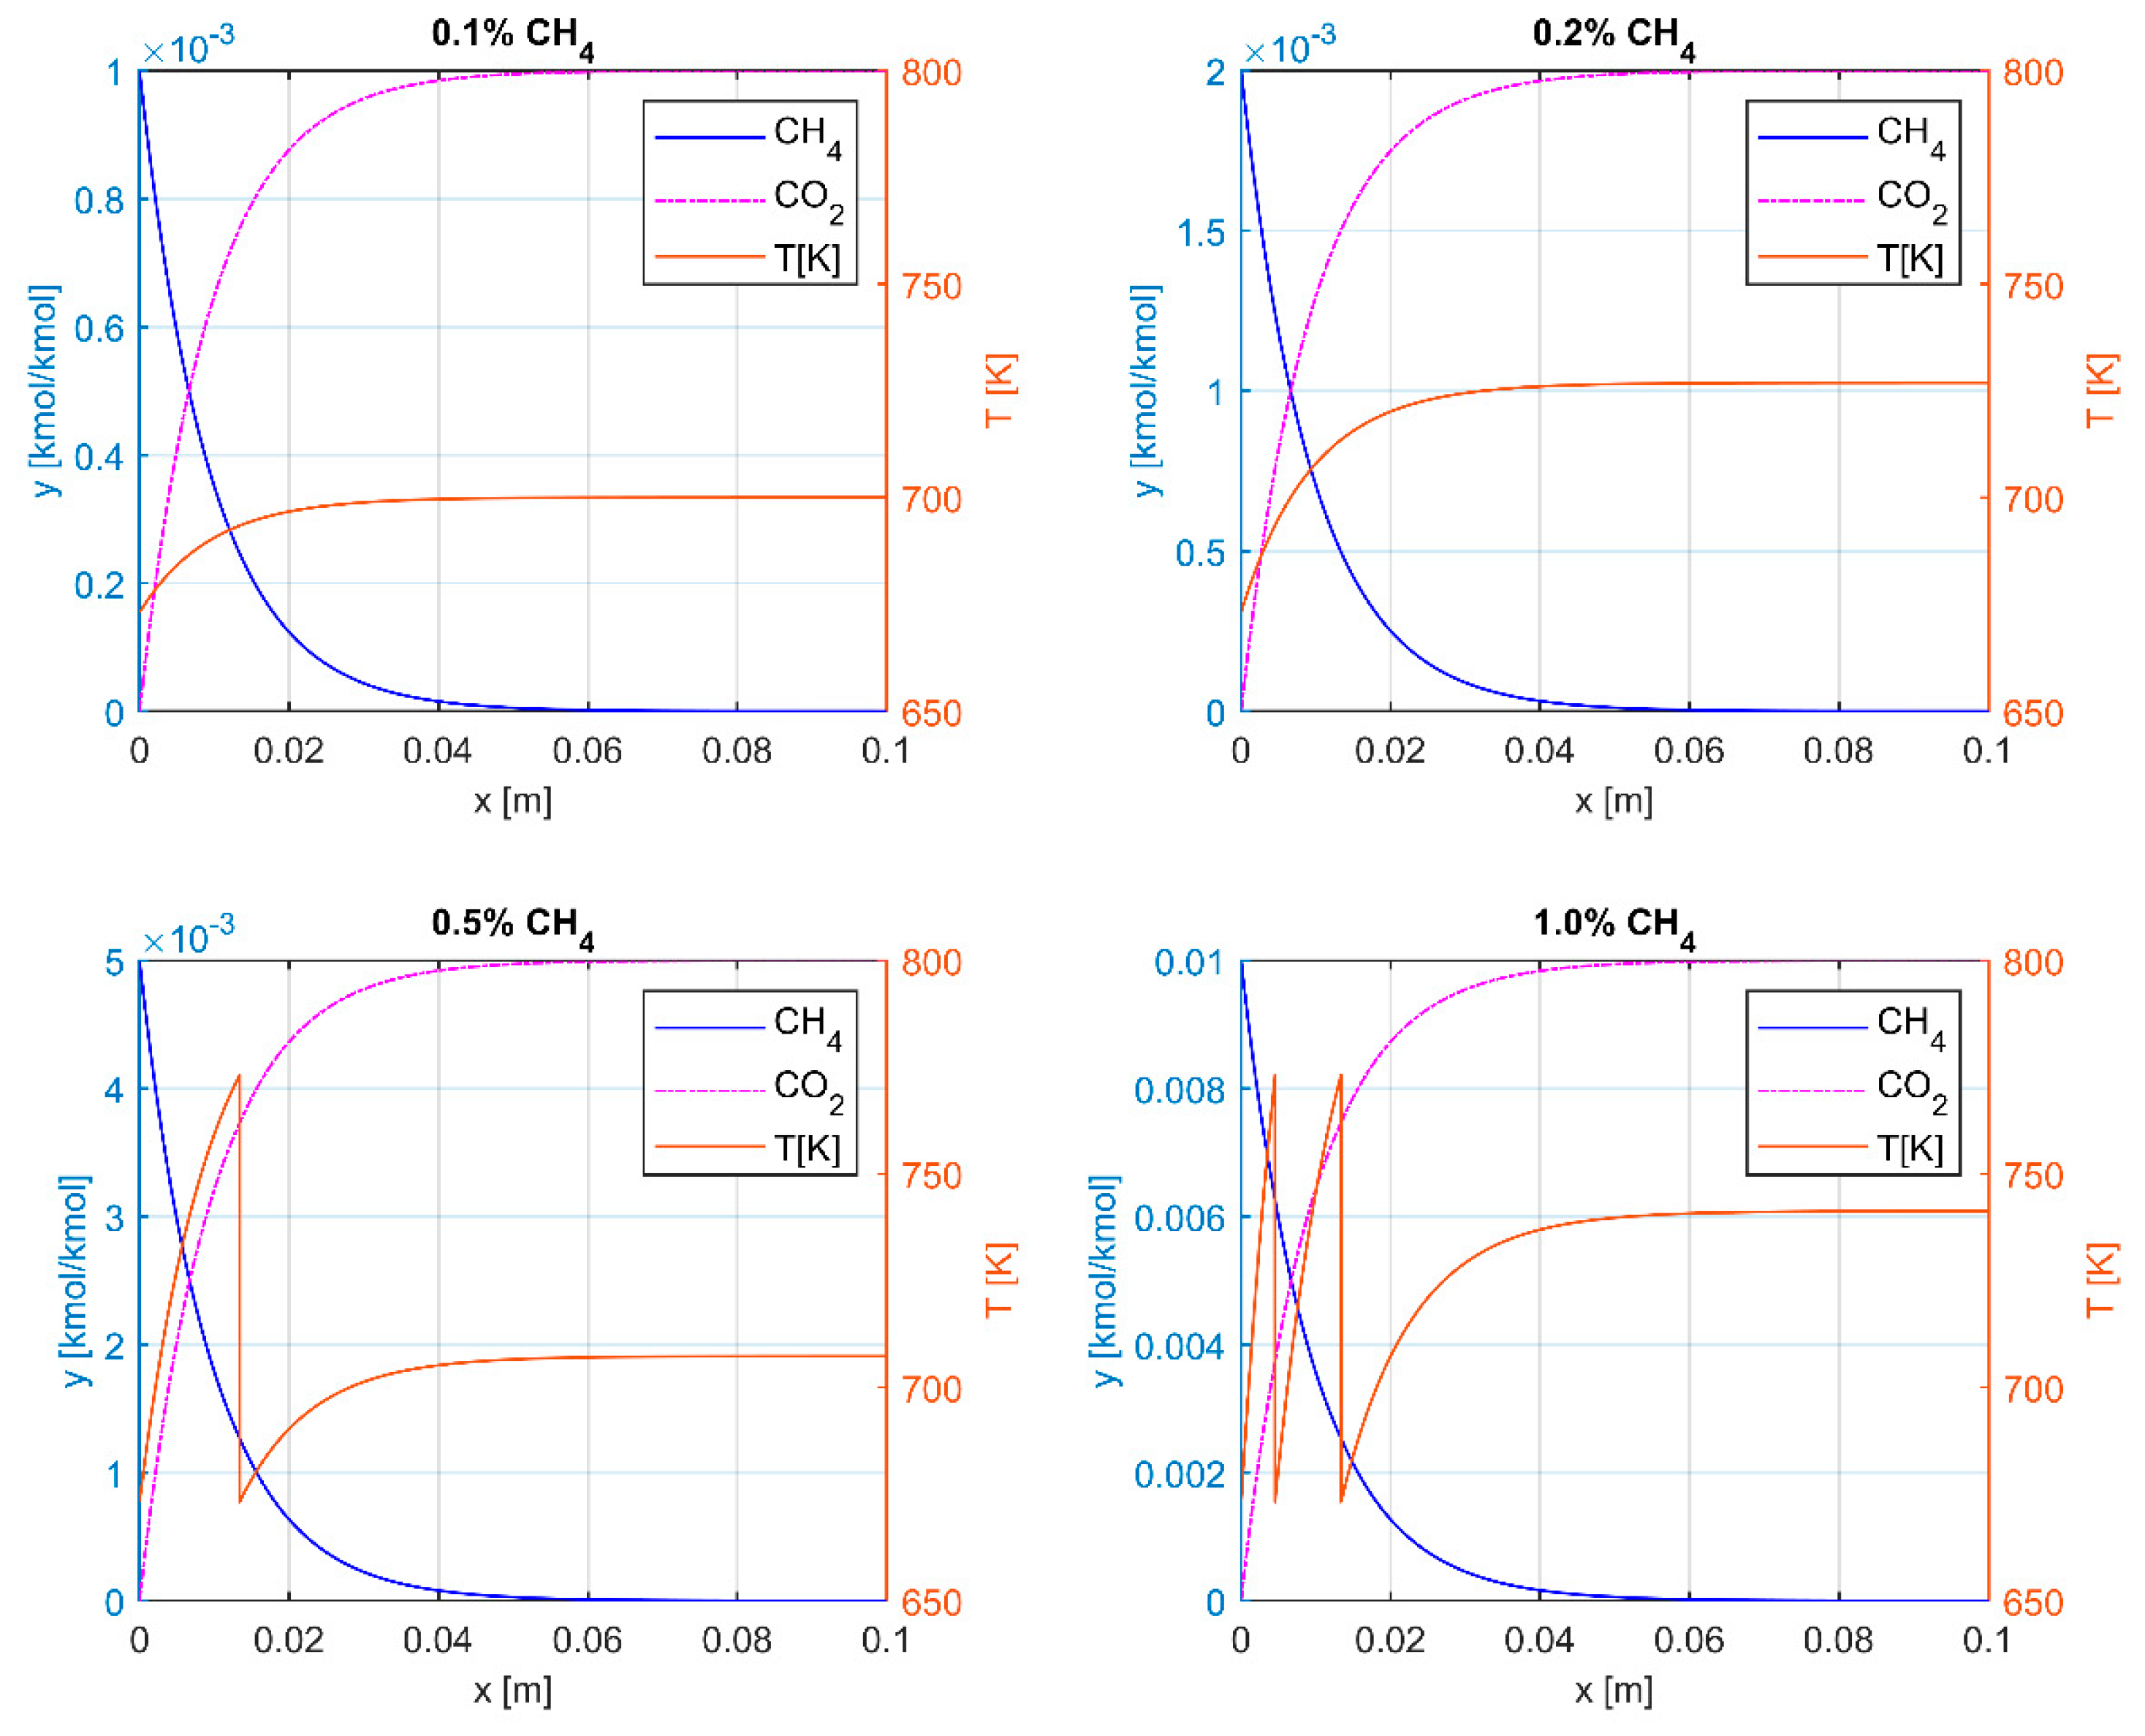
3.2. Catalytic Oxidation

Analogously to the thermal method of methane oxidation (Figure 2), the aw0x diagram was also determined for the catalytic method, obtaining a very similar surface shape. This is because, as stated above, the process is controlled mainly by the diffusion of the reactants and not by the reaction kinetics, and when using an identical monolith and flow rate, the process proceeds identically.
The impact of the monolith channel density on the catalytic methane oxidation is shown in Figure 7 (analogous to Figure 3). The final temperature does not depend on the monolith density. Still, the inlet temperature is 400 °C, which is 300 °C lower than in Figure 3. The reaction runs faster in monoliths with higher specific surface areas due to a larger diffusion rate (effect of more significant mass transfer area). A high methane conversion rate was achieved faster than with thermal oxidation. Table 2 compares the lengths of the monoliths necessary to achieve the nearly complete conversion of methane (95%) by the thermal and catalytic processes. The catalytic process requires a slightly shorter reactor that runs at a temperature 300 degrees lower.
As indicated earlier, a highly harmful byproduct, carbon monoxide, is produced during the thermal process. This dangerous byproduct does not exist when catalytic combustion is considered. Thus, the necessary reactor length is about twice as short as that for the thermal VAM treatment (see Table 3). The absence of highly toxic monoxide is a great advantage of the catalytic process.
Figure 8 presents the impacts of the gas’s superficial velocity on the temperature and concentration profiles in the catalytic process. Analogically, as shown in Figure 4, the higher the gas velocity, the greater the required reactor length. As stated above, the influences of the gas velocity on the mass and heat transport for laminar flow in capillaries are almost negligible; thus, the reactor length is proportional to the reactant flow velocity.
Figure 9 presents the impacts of the inlet gas temperature on the temperature and concentration profiles with the catalytic process. The inlet temperature affects the temperature distribution. The catalytic process takes place at lower temperatures than the thermal one, and, in this case, the temperature must be carefully controlled, and appropriate mechanisms must be used to protect against excessive temperature increases to avoid the catalyst’s thermal deactivation.
The impact of the inlet methane concentration on the catalytic VAM oxidation is presented in Figure 10. Analogous to Figure 6, the methane concentration in the VAM significantly affects the temperature distribution and, thus, the gas outlet temperature. Despite the lower temperatures inside the reactor compared to the thermal process, for the methane concentration of 1% by volume, the outlet temperature reaches almost 700 °C, and the risk of catalyst thermal deactivation occurs. During the numerical simulations, the highest safe temperature was set at 500 °C; after exceeding this limit, enough heat was removed in the interstage heat exchanger to lower the gas temperature to 400 °C.
Table 4 presents the resulting energies recovered for the different methane concentrations and the corresponding exergies and Carnot efficiencies. For a methane concentration of 0.5%, a portion of the energy is recovered in the interstage heat exchanger, referred to as “step 1” in Table 4; for 1.0%, two exchangers (steps 1 and 2) are necessary. The temperature potential of the recovered heat is always the reactive gas temperature, assuming equilibrium conditions according to the definitions of exergy and Carnot efficiency.
When comparing Table 2 and Table 4, the amount of recovered heat is the same for both processes, which is unsurprising given the same methane concentrations and reaction conversions. However, the temperature potentials of the recovered heat (TH) are significantly higher for the thermal process; as a result, the exergy and Carnot efficiency in the thermal process are higher. On the other hand, the necessary reactor length for the thermal process is larger because of the necessity of carbon monoxide removal.
A comparison of the thermal and catalytic processes is shown in Table 5 and Table 6. The exergy available in the thermal operation is over 20% higher than the catalytic process; the Carnot efficiency is also higher. Therefore, the potential of the heat recovered in the thermal process is higher for the production of mechanical or electric energy than in the catalytic process. Although a higher process temperature leads to more significant heat losses, using the recovered heat for various applications is much easier. However, the reactor for the thermal process must be longer than for the catalytic. While the necessary length to remove only the CH4 is similar for both processes, the necessity of the CO removal requires almost twice as long a reactor for the thermal process. This of course causes increased flow resistance through the reactor.
Figure 11 shows the dependence of the recovered exergy and the Carnot efficiency on the inlet methane concentration. Both the exergy, BQ, and the Carnot efficiency, ηC, are significantly higher for the thermal process than for the catalytic; this results from higher temperatures in the case of thermal combustion.

4. Conclusions

This study presented a preliminary comparison of VAM mitigation methods—catalytic and thermal combustion—based on data in the literature and from our previous studies. Many aspects were taken into account in the assessment, including the presence of toxic byproducts and thermal deactivation of the catalyst. The analysis revealed the positive and negative features of both the thermal and catalytic oxidation methods. The simulation results for both alternative implementations are also presented. It was found that with both methods, the chemical reaction rate is a few orders of magnitude higher than the rate of the diffusional transport of the reactants. Consequently, the process rate is controlled by diffusion. It is, therefore, not surprising that the concentration and temperature distributions, process efficiency and the reactor length necessary to achieve the required methane conversion are similar, assuming the same reactor structure (i.e., monolith).
However, there are two fundamental differences between thermal and catalytic combustion. In the case of thermal combustion, an extremely toxic byproduct appears—carbon monoxide. Therefore, the required reactor length is approximately twice as long as the length necessary for catalytic combustion, where carbon monoxide is not produced; for example, the thermal process requires a reactor length equal to 0.12 mm, while the catalytic process requires 0.055 m, using a 200 cpsi monolith.
The second difference is the temperature at which the process takes place. The gas inlet temperature should be about 300 degrees higher for thermal afterburning (700 °C) than for the catalytic process (400 °C). Therefore, the initial heating of the gas is more difficult with thermal combustion. However, a higher process temperature and higher temperature potential of the recovered heat, as a result, lead to greater amount of exergy recovered with thermal combustion (20% higher). Heat has a more significant possibility of producing mechanical energy or being transferred to, for example, heating the inlet gas to the reaction temperature.
Further research should be directed to validate the numerical model against experimental data for both processes, assuming different inlet methane concentrations, inlet gas temperatures and flow velocities. It would be worth considering humidity and dust in the numerical calculations, as well as during experimental tests, to simulate a real mine’s ventilation air and to study the impacts of these pollutants on the overall efficiency of the processes. In addition, such tests will determine the possibility of applying this type of packing in industrial reactors operating in variable dustiness and high humidity conditions.

Author Contributions

Conceptualisation, A.K.; methodology, M.I. and D.B.; software, A.R.; validation, A.P.-K., R.H. and M.S.; writing—original draft preparation, A.K. and M.I.; writing—review and editing, A.P.-K., D.B. and R.H.; visualisation, M.T. and M.S.; supervision, A.G.; funding acquisition, J.S. and A.G. All authors have read and agreed to the published version of the manuscript.

Funding

This research is co-financed by the EU programme “Research Fund for Coal and Steel”, under grant agreement no. 101112618—ProVAM (Reduction of Ventilation Air Methane in the coal mining transformation process). The project is co-financed by the Polish Ministry of Education and Science, under the program called International Co-Financed Projects, contract no. 5647/FBWiS/2023/2.

Data Availability Statement

Data are contained within the article.

Conflicts of Interest

The authors declare no conflicts of interest. The funders had no role in the design of the study; in the collection, analyses, or interpretation of data; in the writing of the manuscript; or in the decision to publish the results.

Nomenclature

Acchannel cross-sectional surface area, m2
amonolith specific surface, m2/m3
BQexergy, J/kg
CAmolar concentration, kmol/m3
cpspecific heat, J/kg K
DAdiffusivity, m2/s
dHhydraulic diameter, m
kCmass transfer coefficient, m/s
kCrtransfer reaction coefficient, Equation (3), m/s
kHheat losses coefficient, m/s
krkinetic constant, m/s
NuNusselt number
Ppressure, Pa
Pcchannel perimeter, m
Qheat recovered, J/kg
Rgas constant, J/kmol K
rreaction rate, kmol/m2s
ShSherwood number
Ttemperature, K
THtemperature potential of recovered heat, K
Toambient temperature, K
w0gas superficial velocity, m/s
xaxial coordinate, m
yAmole fraction, mol/mol
ΔHrreaction enthalpy, J/kmol
αheat transfer coefficient, W/m2K
εporosity
ηreaction conversion
ηCCarnot efficiency
λthermal conductivity, W/mK
ρdensity, kg/m3
Subscripts
Amethane
ininlet
Hexternal reactor wall
Smonolith surface
Abbreviations
VAMventilation air methane
LTlow temperature
HThigh temperature
LELlower explosion limit
UELupper explosion limit
GWPglobal warming potential
CPSIchannel per square inch

References

  1. Regulation of the Polish Minister of Energy 1 of 23 November 2016 on Detailed Requirements for the Operation of Underground Mining Plants (in Polish: Rozporządzenie Ministra Energii 1 z dnia 23 Listopada 2016 r. w Sprawie Szczegółowych Wymagań Dotyczących Prowadzenia Ruchu Podziemnych Zakładów Górniczych), Dz.U.2017.1118. Available online: https://isap.sejm.gov.pl/isap.nsf/DocDetails.xsp?id=WDU20170001118 (accessed on 30 January 2025).
  2. Regulation (EU) 2024/1787 of the European Parliament and of the Council of 13 June 2024 on the Reduction of Methane Emissions in the Energy Sector and Amending Regulation (EU) 2019/942. Available online: https://eur-lex.europa.eu/legal-content/EN/TXT/PDF/?uri=CELEX:32024R1787 (accessed on 30 January 2025).
  3. Intergovernmental Panel on Climate Change. Climate Change 2021: The Physical Science Basis. Contribution of Working Group I to the Sixth Assessment Report (AR6) of the Intergovernmental Panel on Climate Change. 2021. Available online: https://www.ipcc.ch/report/ar6/wg1/downloads/report/IPCC_AR6_WGI_FullReport.pdf (accessed on 30 January 2025).
  4. Zheng, B.; Liu, Y.; Liu, R.; Meng, J.; Mao, M. Experimental Investigation of Flow Resistance in a Coal Mine Ventilation Air Methane Preheated Catalytic Oxidation Reactor. J. Chem. 2015, 2015, 75789. [Google Scholar] [CrossRef]
  5. Deng, W.; Xiaofeng Xie, X.; Guo, Y.; Hu, G. Breakthroughs in CH4 capture technologies: Key to reducing fugitive methane emissions in the energy sector. Carbon Capture Sci. Technol. 2024, 13, 100316. [Google Scholar] [CrossRef]
  6. Su, S.; Chen, H.; Teakle, P.; Xue, S. Characteristics of coal mine ventilation air flows. J. Environ. Manag. 2008, 86, 44–62. [Google Scholar] [CrossRef] [PubMed]
  7. Hinde, P.; Mitchell, I.; Riddell, M. COMET (TM)—A New Ventilation Air Methane (VAM) Abatement Technology. Johns. Matthey Technol. Rev. 2016, 60, 211–221. [Google Scholar] [CrossRef]
  8. Setiawan, A.; Friggieri, J.; Kennedy, E.M.; Dlugogorski, B.Z.; Stockenhuber, M. Catalytic combustion of ventilation air methane (VAM)—Long term catalyst stability in the presence of water vapour and mine dust. Catal. Sci. Technol. 2014, 4, 1793–1802. [Google Scholar] [CrossRef]
  9. Yin, J.J.; Su, S.; Yu, X.X.; Bae, J.S.; Jin, Y.G.; Villella, A.; Jara, M.; Ashby, M.; Cunnington, M.; Loney, M. Site Trials and Demonstration of a Novel Pilot Ventilation Air Methane Mitigator. Energy Fuels 2020, 34, 9885–9893. [Google Scholar] [CrossRef]
  10. Ventilation Air Methane (VAM) Utilization Technologies. Available online: https://www.epa.gov/sites/production/files/2017-01/documents/vam_technologies-1-2017.pdf.pdf (accessed on 30 January 2025).
  11. Shanxi LuAn Group Gaohe Mine VAM Destruction and Utilization Project. Available online: https://cdm.unfccc.int/Projects/DB/TUEV-RHEIN1352801900.72/view (accessed on 30 January 2025).
  12. Wang, Z.; Zhou, H.; Peng, X.; Cao, S.; Tang, Z.; Li, K.; Fan, S.; Xue, W.; Yao, G.; Xu, S. A predictive model with time-varying delays employing channel equalization convolutional neural network for NOx emissions in flexible power generation. Energy 2024, 306, 132495. [Google Scholar] [CrossRef]
  13. Lundberg, D.J.; Kim, J.; Parviz, D.; Strano, M.S. Mitigation of ventilation air methane (VAM) using novel methanotrophic coating materials: A technical analysis. Environ. Res. Lett. 2023, 18, 114039. [Google Scholar] [CrossRef]
  14. Swolkień, J. Polish underground coal mines as point sources of methane emission to the atmosphere. Int. J. Greenh. Gas Control 2020, 94, 102921. [Google Scholar] [CrossRef]
  15. Mao, M.M.; Shi, J.R.; Liu, Y.Q.; Gao, M.; Chen, Q. Experimental investigation on control of temperature asymmetry and nonuniformity in a pilot scale thermal flow reversal reactor. Appl. Therm. Eng. 2020, 175, 115375. [Google Scholar] [CrossRef]
  16. Zheng, B.; Liu, Y.Q.; Sun, P.; Meng, J.; Liu, R.X. Dehydrogenation characteristics of lean methane in a thermal reverse-flow reactor. Int. J. Hydrogen Energy 2019, 44, 5137–5142. [Google Scholar] [CrossRef]
  17. Gao, P.F.; Gou, X.L. Experimental Research on the Thermal Oxidation of Ventilation Air Methane in a Thermal Reverse Flow Reactor. Acs Omega 2019, 4, 14886–14894. [Google Scholar] [CrossRef] [PubMed]
  18. Marin, P.; Vega, A.; Diez, F.V.; Ordonez, S. Control of regenerative catalytic oxidisers used in coal mine ventilation air methane exploitation. Process Saf. Environ. Prot. 2020, 134, 333–342. [Google Scholar] [CrossRef]
  19. Wang, Y.K.; Man, C.B.; Che, D.F. Catalytic Combustion of Ventilation Air Methane in a Reverse-Flow Reactor. Energy Fuels 2010, 24, 4841–4848. [Google Scholar] [CrossRef]
  20. Salomons, S.; Hayes, R.E.; Poirier, M.; Sapoundjiev, H. Flow reversal reactor for the catalytic combustion of lean methane mixtures. Catal. Today 2003, 83, 59–69. [Google Scholar] [CrossRef]
  21. Mundra, I.; Lockley, A. Emergent methane mitigation and removal approaches: A review. Atmos. Environ. X 2024, 21, 100223. [Google Scholar] [CrossRef]
  22. Gosiewski, K.; Pawlaczyk, A. Catalytic or thermal reversed flow combustion of coal mine ventilation air methane: What is better choice and when? Chem. Eng. J. 2014, 238, 78–85. [Google Scholar] [CrossRef]
  23. Pawlaczyk, A.; Gosiewski, K. Combustion of lean methane-air mixtures in monolith beds: Kinetic studies in low and high temperatures. Chem. Eng. J. 2015, 282, 29–36. [Google Scholar] [CrossRef]
  24. Gancarczyk, A.; Iwaniszyn, M.; Piątek, M.; Korpyś, M.; Sindera, K.; Jodłowski, P.J.; Łojewska, J.; Kołodziej, A. Catalytic Combustion of Low-Concentration Methane on Structured Catalyst Supports. Ind. Eng. Chem. Res. 2018, 57, 10281–10291. [Google Scholar] [CrossRef]
  25. Clarke, M.; Seddon, D. Ventilation Air Methane (VAM) Destruction the New Challenge to the Underground Coalmining Industry. 2011. Available online: https://api.semanticscholar.org/CorpusID:201072295 (accessed on 30 January 2025).
  26. Ordonez, S.; Hurtado, P.; Sastre, H.; Diez, F.V. Methane catalytic combustion over Pd/Al2O3 in presence of sulphur dioxide: Development of a deactivation model. Appl. Catal. A-Gen. 2004, 259, 41–48. [Google Scholar] [CrossRef]
  27. Shah, K.; Moghtaderi, B.; Doroodchi, E.; Sandford, J. A feasibility study on a novel stone dust looping process for abatement of ventilation air methane. Fuel Process. Technol. 2015, 140, 285–296. [Google Scholar] [CrossRef]
  28. Liu, Y.; Wang, S.; Gao, D.; Sun, T.; Zhang, C.; Wang, S. Influence of metal oxides on the performance of Pd/Al2O3 catalysts for methane combustion under lean-fuel conditions. Fuel Process. Technol. 2013, 111, 55–61. [Google Scholar] [CrossRef]
  29. Setiawan, A.; Kennedy, E.M.; Dlugogorski, B.Z.; Adesina, A.A.; Stockenhuber, M. The stability of Co3O4, Fe2O3, Au/Co3O4 and Au/Fe2O3 catalysts in the catalytic combustion of lean methane mixtures in the presence of water. Catal. Today 2015, 258, 276–283. [Google Scholar] [CrossRef]
  30. Haojie, G.; Zhongqing, Y.; Li, Z.; Yunfei, Y.; Mingnv, G. Low-concentration methane combustion over a Cu/g-Al2O3 catalyst: Effects of water. RSC Adv. 2015, 5, 18915–18921. [Google Scholar]
  31. Hosseiniamoli, H.; Setiawan, A.; Adesina, A.A.; Kennedy, E.M.; Stockenhuber, M. The stability of Pd/TS-1 and Pd/silicalite-1 for catalytic oxidation of methane—Understanding the role of titanium. Catal. Sci. Technol. 2020, 10, 1193–1204. [Google Scholar] [CrossRef]
  32. Coney, C.; Stere, C.; Millington, P.; Raj, A.; Wilkinson, S.; Caracotsios, M.; McCullough, G.; Hardacre, C.; Morgan, K.; Thompsett, D.; et al. Spatially-resolved investigation of the water inhibition of methane oxidation over palladium. Catal. Sci. Technol. 2020, 10, 1858–1874. [Google Scholar] [CrossRef]
  33. Fernandez, J.; Marin, P.; Diez, F.V.; Ordonez, S. Experimental demonstration and modelling of an adsorption-enhanced reverse flow reactor for the catalytic combustion of coal mine ventilation air methane. Chem. Eng. J. 2015, 279, 198–206. [Google Scholar] [CrossRef]
  34. Levenspiel, O. Chemical Reaction Engineering; John Wiley & Sons, Inc.: New York, NY, USA, 1972. [Google Scholar]
  35. Iwaniszyn, M.; Korpyś, M.; Rotkegel, A.; Ziobrowski, Z.; Kołodziej, A.; Sindera, K.; Suwak, M.; Gancarczyk, A. Innovative Fixed-Bed Reactor Integrated with Heat Transfer System for Lean Methane Mixture Removal. Energies 2024, 17, 4408. [Google Scholar] [CrossRef]
  36. Kołodziej, A.; Łojewska, J.; Tyczkowski, J.; Jodłowski, P.; Redzynia, W.; Iwaniszyn, M.; Zapotoczny, S.; Kuśtrowski, P. Coupled engineering and chemical approach to the design of a catalytic structured reactor for combustion of VOCs: Cobalt oxide catalyst on knitted wire gauzes. Chem. Eng. J. 2012, 200, 329–337. [Google Scholar] [CrossRef]
  37. Gancarczyk, A.; Sindera, K.; Iwaniszyn, M.; Piątek, M.; Macek, W.; Jodłowski, P.J.; Wroński, S.; Sitarz, M.; Łojewska, J.; Kołodziej, A. Metal Foams as Novel Catalyst Support in Environmental Processes. Catalysts 2019, 9, 587. [Google Scholar] [CrossRef]
  38. Cybulski, A.; Moulijn, J.A. Monoliths in heterogeneous catalysis. Catal. Rev. Sci. Eng. 1994, 36, 179–270. [Google Scholar] [CrossRef]
  39. Williams, J.L. Monolith structures, materials, properties and uses. Catal. Today 2001, 69, 3–9. [Google Scholar] [CrossRef]
Figure 1. Scheme of the reactor configuration studied: 1—gas inlet; 2, 4, 6—reactor packing, inert or catalytic (monolith), 3 stages in this case; 3, 5—interstage reactor cooler (for catalytic reaction); 7—gas outlet.
Energies 18 01428 g001
Figure 2. Thermal VAM oxidation. The surface of the required process conversion is equal to 95% of the coordinates for specific surface area, a; gas superficial velocity, w0; and reactor length, x. The inlet temperature is Tin = 700 °C, and the inlet methane concentration is yin = 1.0% vol. CH4. The colour bar indicates the necessary reactor length to reach 95% conversion for the given parameters a and w0.
Energies 18 01428 g002
Figure 3. Thermal VAM oxidation. Distributions of reactant concentrations, y, and temperatures, T, along reactor length, x. Comparison of the density of monolithic reactor packings. Inlet concentration, yin = 0.5% CH4; superficial velocity, w0 = 0.5 m/s; and inlet gas temperature, Tin = 700 °C.
Energies 18 01428 g003
Figure 4. Thermal VAM oxidation. Distributions of the reactant concentrations, y, and temperatures, T, along the reactor length, x. Impact of the gas superficial velocity, with an inlet methane concentration of yin = 0.5% CH4, an inlet gas temperature of Tin = 700 °C, and 200 CPI monolith.
Energies 18 01428 g004
Figure 5. Thermal VAM oxidation. Distributions of the reactant concentrations, y, and temperatures, T, along the reactor length, x. Impact of the inlet gas temperature, with a superficial velocity of w0 = 0.5 m/s, inlet methane concentration of yin = 0.5% CH4, and a 200 CPI monolith.
Energies 18 01428 g005
Figure 6. Thermal VAM oxidation. Distributions of the reactant concentrations, y, and temperatures, T, along the reactor length, x. Impact of the inlet methane concentration, with a superficial velocity of w0 = 0.5 m/s, inlet gas temperature of Tin = 700 °C, and 200 CPI monolith.
Energies 18 01428 g006
Figure 7. Catalytic VAM oxidation. Distributions of the reactant concentrations, y, and temperatures, T, along the reactor length, x. Comparison of the density of monolithic reactor packings, with and inlet concentration of yin = 0.5% CH4, superficial velocity of w0 = 0.5 m/s, and inlet gas temperature of Tin = 400 °C.
Energies 18 01428 g007
Figure 8. Catalytic VAM oxidation. Distributions of the reactant concentrations, y, and temperatures, T, along the reactor length, x. Impact of the gas superficial velocity, with an inlet methane concentration of yin = 0.5% CH4, inlet gas temperature of Tin = 400 °C, and 200 CPI monolith.
Energies 18 01428 g008
Figure 9. Catalytic VAM oxidation. Distributions of the reactant concentrations, y, and temperatures, T, along the reactor length, x. Impact of the inlet gas temperature, with a superficial velocity of w0 = 0.5 m/s, inlet methane concentration of yin = 0.5% CH4, and 200 CPI monolith.
Energies 18 01428 g009
Figure 10. Catalytic VAM oxidation. Distributions of the reactant concentrations, y, and temperatures, T, along the reactor length, x. Impact of the inlet methane concentration, with a superficial velocity of w0 = 0.5 m/s, inlet gas temperature of Tin = 400 °C, and 200 CPI monolith.
Energies 18 01428 g010
Figure 11. Recovered exergy, BQ, and the Carnot efficiency, ηC, for the thermal and catalytic reactions vs. the inlet methane concentration, yin.
Energies 18 01428 g011
Table 1. Parameters of the monolithic internals considered [39].
CPSIεa, m2m−3dH, mm
1000.7213392.15
2000.7318981.54
4000.8527091.26
9000.8343110.77
Table 2. The heat recovered, Q, gas temperature, TH, and resulting exergy, BQ, for the thermal process vs. inlet methane concentration, yin. The ambient temperature was To = 293 K. The Carnot efficiency, ηC, is also provided.
yin
[% CH4]
TH
[K]
Q
[kJ/kg]
BQ
[kJ/kg]
ηC
0.1999.128.720.30.71
0.2102557.441.00.71
0.51102.2143.2105.10.73
11229.2286.1217.90.76
Table 3. Approximate necessary reactor lengths for the near complete removal of selected components, comparing the thermal and catalytic methods.
ComponentMonolithMethod
100200400900
CH40.120.060.040.02Thermal
CO>0.20.120.070.03Thermal
CH40.100.0550.030.02Catalytic
CH40.120.060.040.02Thermal
Table 4. The heat recovered, Q, gas temperature, TH, and the resulting exergy, BQ, for the catalytic process vs. inlet methane concentration, yin. The ambient temperature was To = 293 K. The Carnot efficiency, ηC, is also provided. “Step 1” means that the heat was recovered in the heat exchanger after the first reactor section; “outlet” refers to the reactor outlet conditions.
yin
[% CH4]
TH
[K]
Q
[kJ/kg]
BQ
[kJ/kg]
ηC
0.1 outlet700.128.716.80.58
0.2 outlet726.957.434.30.60
0.5 step 1773106.766.30.62
0.5 outlet707.336.521.40.59
1.0 step 1773106.766.30.62
1.0 step 2773106.766.30.62
1.0 outlet741.372.744.00.60
Table 5. Comparison of the thermodynamic data for the thermal and catalytic processes.
yin, % Thermal ProcessCatalytic ProcessBQ-Therm/BQ-Catal
THQBQηCTH * QBQηC **
0.1999.128.720.30.71700.128.716.80.581.21
0.2102557.441.00.71726.957.434.30.601.20
0.51102.2143.2105.10.73707.3143.287.70.611.20
11229.2286.1217.90.76741.3286.1176.60.621.23
* At the reactor outlet, with the interstage cooling. ** Calculated as BQ/Q.
Table 6. Comparison of the reactor length for the thermal and catalytic processes.
Thermal ProcessCatalytic Process
Monolith, cpsi100200400900100200400900
Length [m] to ηCH4 = 95%0.120.060.040.020.100.0550.030.02
Length [m] to ηCH4+CO = 99.5%>0.20.120.070.030.100.0550.030.02
Disclaimer/Publisher’s Note: The statements, opinions and data contained in all publications are solely those of the individual author(s) and contributor(s) and not of MDPI and/or the editor(s). MDPI and/or the editor(s) disclaim responsibility for any injury to people or property resulting from any ideas, methods, instructions or products referred to in the content.

