Article

Combustion Characteristics of Liquid Ammonia Direct Injection Under High-Pressure Conditions Using DNS

by
Ziwei Huang
,
Haiou Wang
*,
Qian Meng
,
Kun Luo
and
Jianren Fan
State Key Laboratory of Clean Energy Utilization, Zhejiang University, Hangzhou 310027, China
*
Author to whom correspondence should be addressed.
Energies 2025, 18(9), 2228; https://doi.org/10.3390/en18092228
Submission received: 9 March 2025 / Revised: 17 April 2025 / Accepted: 23 April 2025 / Published: 27 April 2025
(This article belongs to the Special Issue Experiments and Simulations of Combustion Process II)

Abstract

:
As a zero-carbon fuel, ammonia can be directly employed in its liquid form. However, its unique physical and chemical properties pose challenges to its application in engines. The direct injection of liquid ammonia is considered a promising technique for internal combustion engines, yet its combustion behavior is still not well understood. In this work, the combustion characteristics of liquid ammonia direct injection under high-pressure conditions were investigated using direct numerical simulation (DNS) in a Eulerian–Lagrangian framework. The ammonia spray was injected via a circular nozzle and underwent combustion under high-temperature and high-pressure conditions, resulting in complex turbulent spray combustion. It was found that the peaks of mass fraction of important species, heat release rate, and gaseous temperature increase with increasing axial distance, and the peaks shifted to richer mixtures. The distribution of scalar dissipation rate at various locations is nearly log-normal. The budget analysis of species transport equations shows that the reaction term is much larger than the diffusion term, suggesting that auto-ignition plays a predominant role in turbulent ammonia spray flame stabilization. It can be observed that both non-premixed and premixed combustion modes co-exist in the ammonia spray combustion. Moreover, the contribution of premixed combustion becomes more significant as the axial distance increases.

1. Introduction

Ammonia (NH3) is regarded as a potential fuel due to its carbon-free characteristics, established production infrastructure, and effective storage and transportation properties [1]. As a result, its large-scale use in power generation systems has the potential to not only reduce greenhouse gas emissions but also address the energy crisis. However, the use of ammonia is hindered by challenges related to ignition and flame stability, which stem from its comparatively lower reactivity relative to traditional hydrocarbon fuel [2]. Consequently, there is considerable interest in achieving effective ammonia combustion, which is vital in advancing zero-carbon energy utilization.
Over the past decade, considerable studies have been devoted to exploring the combustion characteristics of ammonia. Fan et al. [3] conducted experimental investigations on instantaneous pure ammonia/air premixed jet flame structures. Their study revealed the distributions of NO and NH in both laminar and turbulent ammonia flames. Zhang et al. [4] examined the blow-off and macroscopic structures of NH3/air swirl flames through experimental methods. Their results indicated that NH3 flames extinguish more rapidly than CH4 flames during the blow-off process. This accelerated extinction was primarily attributed to significant flame stretching. Rieth et al. [5] conducted a numerical investigation into the formation mechanisms of NO and N2O in NH3/H2/N2–air premixed flames. Their results indicated that NO formation is strongly influenced by flame structures. Tian et al. [6] investigated turbulent premixed NH3/air jet flames using direct numerical simulation (DNS). The DNS data were analyzed to reveal the flame structure and emission properties.
The aforementioned researches primarily focused on the combustion of gaseous ammonia. However, ammonia can also be utilized directly in its liquid form within energy systems. In practical combustors, introducing liquid ammonia into a combustor eliminates the need for pre-vaporization equipment. This approach not only reduces the cost but also shortens the start-up time relative to using gaseous ammonia. Nevertheless, the utilization of pure liquid ammonia is limited by its high latent heat and lower reactivity. Okafor et al. [7] documented an experimental study on co-firing liquid ammonia with methane in a swirl flame. Uchida et al. [8] devised a technique for burning liquid ammonia by injecting it directly into a gas turbine combustor co-fired with natural gas. More recently, Wang et al. [9] experimentally investigated ammonia spray swirl flame structure and analyzed the effects of the addition of preheated swirling air and hydrogen on combustion characteristics. These studies provide an essential understanding of the swirl combustion behavior of liquid ammonia when co-fired with high-reactivity fuels.
The dual direct injection of liquid ammonia and high-reactivity liquid fuels represents a promising technique for enhancing the combustion performance of liquid ammonia. Valentin et al. [10] conducted experimental research on the ignition process of ammonia sprays when piloted by diesel spray. Their findings indicated that a strong interaction between the two fuels is essential for the effective ignition of ammonia sprays. In a follow-up study [11], they explored the combustion behavior and mixing process in direct injection conditions. The results suggested that high mixing requirements between ammonia sprays and combustion products are necessary to achieve auto-ignition, which explains the challenges in stabilizing ammonia flames. Zhang et al. [12] further investigated the combustion processes of ammonia sprays ignited by diesel flames. Their experimental data demonstrated that using diesel flames to induce liquid ammonia combustion is an effective strategy to improve the overall combustion performance of ammonia sprays.
Recent research interest has increasingly placed on the combustion characteristics of liquid ammonia direct injection under conditions relevant to engines. Wang et al. [13] performed experimental investigations into the combustion behavior of ammonia spray under engine-like conditions through direct injection. They successfully observed the auto-ignition process of liquid ammonia. However, the combustion intensity of liquid ammonia was found to be much lower than that of diesel fuel. Direct numerical simulations (DNS), which resolve all flow and flame structures, have been instrumental in elucidating combustion characteristics [14,15]. However, to the best of our knowledge, no high-fidelity DNS studies have yet been conducted on the combustion characteristics of liquid ammonia direct injection under high-pressure conditions. This served as the primary motivation for the present study.
Based on these discussions, the primary objective of the present study is to elucidate the combustion characteristics of liquid ammonia direct injection under high-pressure conditions, which is not well understood yet. The research goals are threefold: Firstly, three-dimensional direct numerical simulations of turbulent liquid ammonia spray combustion are conducted, employing a detailed chemical kinetic mechanism. Secondly, both the instantaneous and mean flame structures are investigated, and the distributions of ammonia sprays are also analyzed. Lastly, the combustion modes are examined, and the flame stabilization mechanism is explored.

2. Configuration Details and Numerical Methods

2.1. Configuration Details

In this study, the configuration of liquid ammonia direct injection combustion was adopted, as illustrated in Figure 1. Liquid ammonia particles carried by air were injected from a circular nozzle into the combustor at a high pressure of 60 bar, with the ambient temperature set at 1800 K. Given the significant heat loss associated with the strong latent heat of liquid ammonia, a high ambient temperature is crucial for stabilizing the ammonia spray flame. The application of liquid ammonia in engines mostly adopts a dual-fuel strategy, such as co-firing with diesel and hydrogen [9,11], which will be explored in our future work. The nozzle diameter D is 0.5 mm and the computational domain size in the current simulation is  L x × L y × L z  = 45 D × 18 D × 18 D. The initial jet temperature  T j  is 600 K and the jet velocity U was 100 m/s. The particle temperature is 300 K and the particle diameter  d 0  is 5 μm. Note that the particle diameter represents a typical size for fine particles in fuel sprays that allows for efficient mixing and combustion in practical systems. In addition, the choice of particle diameter is also constrained by the DNS mesh size when using the point-source method. The global equivalence ratio of the spray jet is maintained at unity, resulting in a mass flow rate of liquid ammonia of 0.1144 g/s. The distribution of particles at the inlet is random and the number of particles is determined based on the global equivalence ratio. The ambient conditions are characterized by the products of combustion from a lean H2/O2/N2 mixture with an equivalence ratio of 0.267.
Non-reflecting boundary conditions are implemented at the inflow and outflow boundaries in the x direction, while the boundaries in the y and z directions are treated as no-slip and adiabatic walls. A hexahedral mesh system with three levels of refinement was utilized. Figure 2 illustrates the distribution of gaseous temperature, with the grid superimposed. The total number of grid cells is 45 million and the minimum cell size is 20  μ m. The size of the smallest eddy is about 10  μ m. Therefore, the Kolmogorov scale is solved with more than 0.5 grid point [16]. Additionally, the particle diameter is smaller than the grid size, indicating that the current setup satisfies the requirements of the point-source assumption [17].
A detailed chemical mechanism for NH3/air combustion [18], which included 20 species and 113 elementary reactions, was employed. This mechanism has been validated in the literature [19] and has to be proven effective in simulating ignition delay times (IDTs) and laminar burning velocities (LBVs). These validations ensure that the mechanism can accurately capture the essential characteristics of ammonia combustion, making it suitable for numerical simulations under engine-relevant conditions.
The simulation was first advanced for 4 τ j  to reach a statistically steady state, where  τ j  is the flow-through time, defined as  τ j  =  L x / U j . After reaching a statistically steady state, the solution was advanced for another 3 τ j  to provide stationary statistics.

2.2. Numerical Methods

2.2.1. Numerical Methods of the Gas Phase

An adaptive mesh refinement DNS solver PeleC [20,21,22,23] was employed for the simulations. The reliability of the PeleC for turbulent combustion numerical simulations has been validated in previous research [22,24,25]. It solves the transport equations for mass, momentum, energy, and species mass fractions in the compressible flow regime as follows:
ρ t + · ( ρ u ) = S ˙ m
( ρ u ) t + · ( ρ u u ) = p + · τ + S ˙ u
( ρ E ) t + · ( ρ u E ) = · q ˙ · ( p u ) + · ( τ · u ) + S ˙ E
( ρ Y k ) t + · ( ρ u Y k ) = · j k + ω ˙ k + S ˙ k
Here,  ρ u , and p denote the density, velocity, and pressure of the gas phase, respectively. The viscous stress tensor is represented by  τ  and E is the total energy.  q ˙  is the diffusive heat flux.  j k  is the diffusive mass flux and  ω ˙ k  is the reaction rate of the kth species. Additionally,  S ˙ m S ˙ u S ˙ k , and  S ˙ E  correspond to the source terms for mass, momentum, species mass fraction, and total energy, respectively.

2.2.2. Numerical Methods of the Liquid Phase

The particles were modeled using the point-source method. In this approach, the particles were treated as spherical entities with uniform internal properties. The governing equations for the position  X p , velocity  u p , mass  m p , and temperature  T p  for the individual particle with form were as follows:
d X p d t = u p
m p d u p d t = F D + m p g
d m p d t = m p ˙
m p C p , L d T p d t = m p ˙ h L ( T p ) + Q p
The  F D  denotes drag force and can be written as
F D = 1 2 ρ g C D A p | u g u p | ( u g u p )
A p  denotes the frontal area of the particle and  C D  is the drag coefficient, which can be estimated as [26,27]
C D = 24 R e p 1 R e p < 1 1 + ( R e p 2 / 3 ) / 6 R e p > 1
The Reynolds number of particle  R e p  is written as
R e p = ρ g ( u g u p ) d p μ v
where  d p  represents the diameter of the particle and  μ v  denotes a reference viscosity.
To properly describe the evaporation process of ammonia particles, the evaporation model proposed by Abramzon et al. [28] was employed. The mass transfer rate  m p ˙  between the gaseous phase and ammonia particle could be calculated as
m p ˙ = π ρ v D v d p Sh l n ( 1 + B M )
Here,  D v  represents the mass diffusion coefficient and  Nu  is the Nusselt number.  B M  corresponds to the Spalding mass transfer number. The heat transfer rate  Q p  between the gaseous phase and ammonia particle could be determined using
Q p = π λ v d p ( T g T p ) Nu l n ( 1 + B T ) B T
Here,  λ v  denotes the thermal conductivity and  Sh  is the Sherwood number.  B T  is the Spalding heat transfer number.
In the DNS, two-way coupling between the ammonia particles and gas phase was accounted for. The source terms  S ˙ m S ˙ u S ˙ E , and  S ˙ k  represent the contributions of particles to the mass, momentum, energy, and species mass fraction equations, respectively. These terms were computed as follows [23,29,30,31]:
S ˙ m = R m p ˙
S ˙ u = R F D
S ˙ E = R ( Q p + m p ˙ h g ( T p ) + 1 2 m p ˙ | u p | 2 + F D · u p )
S ˙ k = R m p ˙ for Y k = Y v a p o r
Here,  R = i N p / V , where V denotes the volume of cell containing the particles and N is the number of particles within that cell.  Y v a p o r  represents the mass fraction of the vapor phase, while  h g ( T p )  denotes the enthalpy of the vapor in the particle surface.

3. Results and Discussion

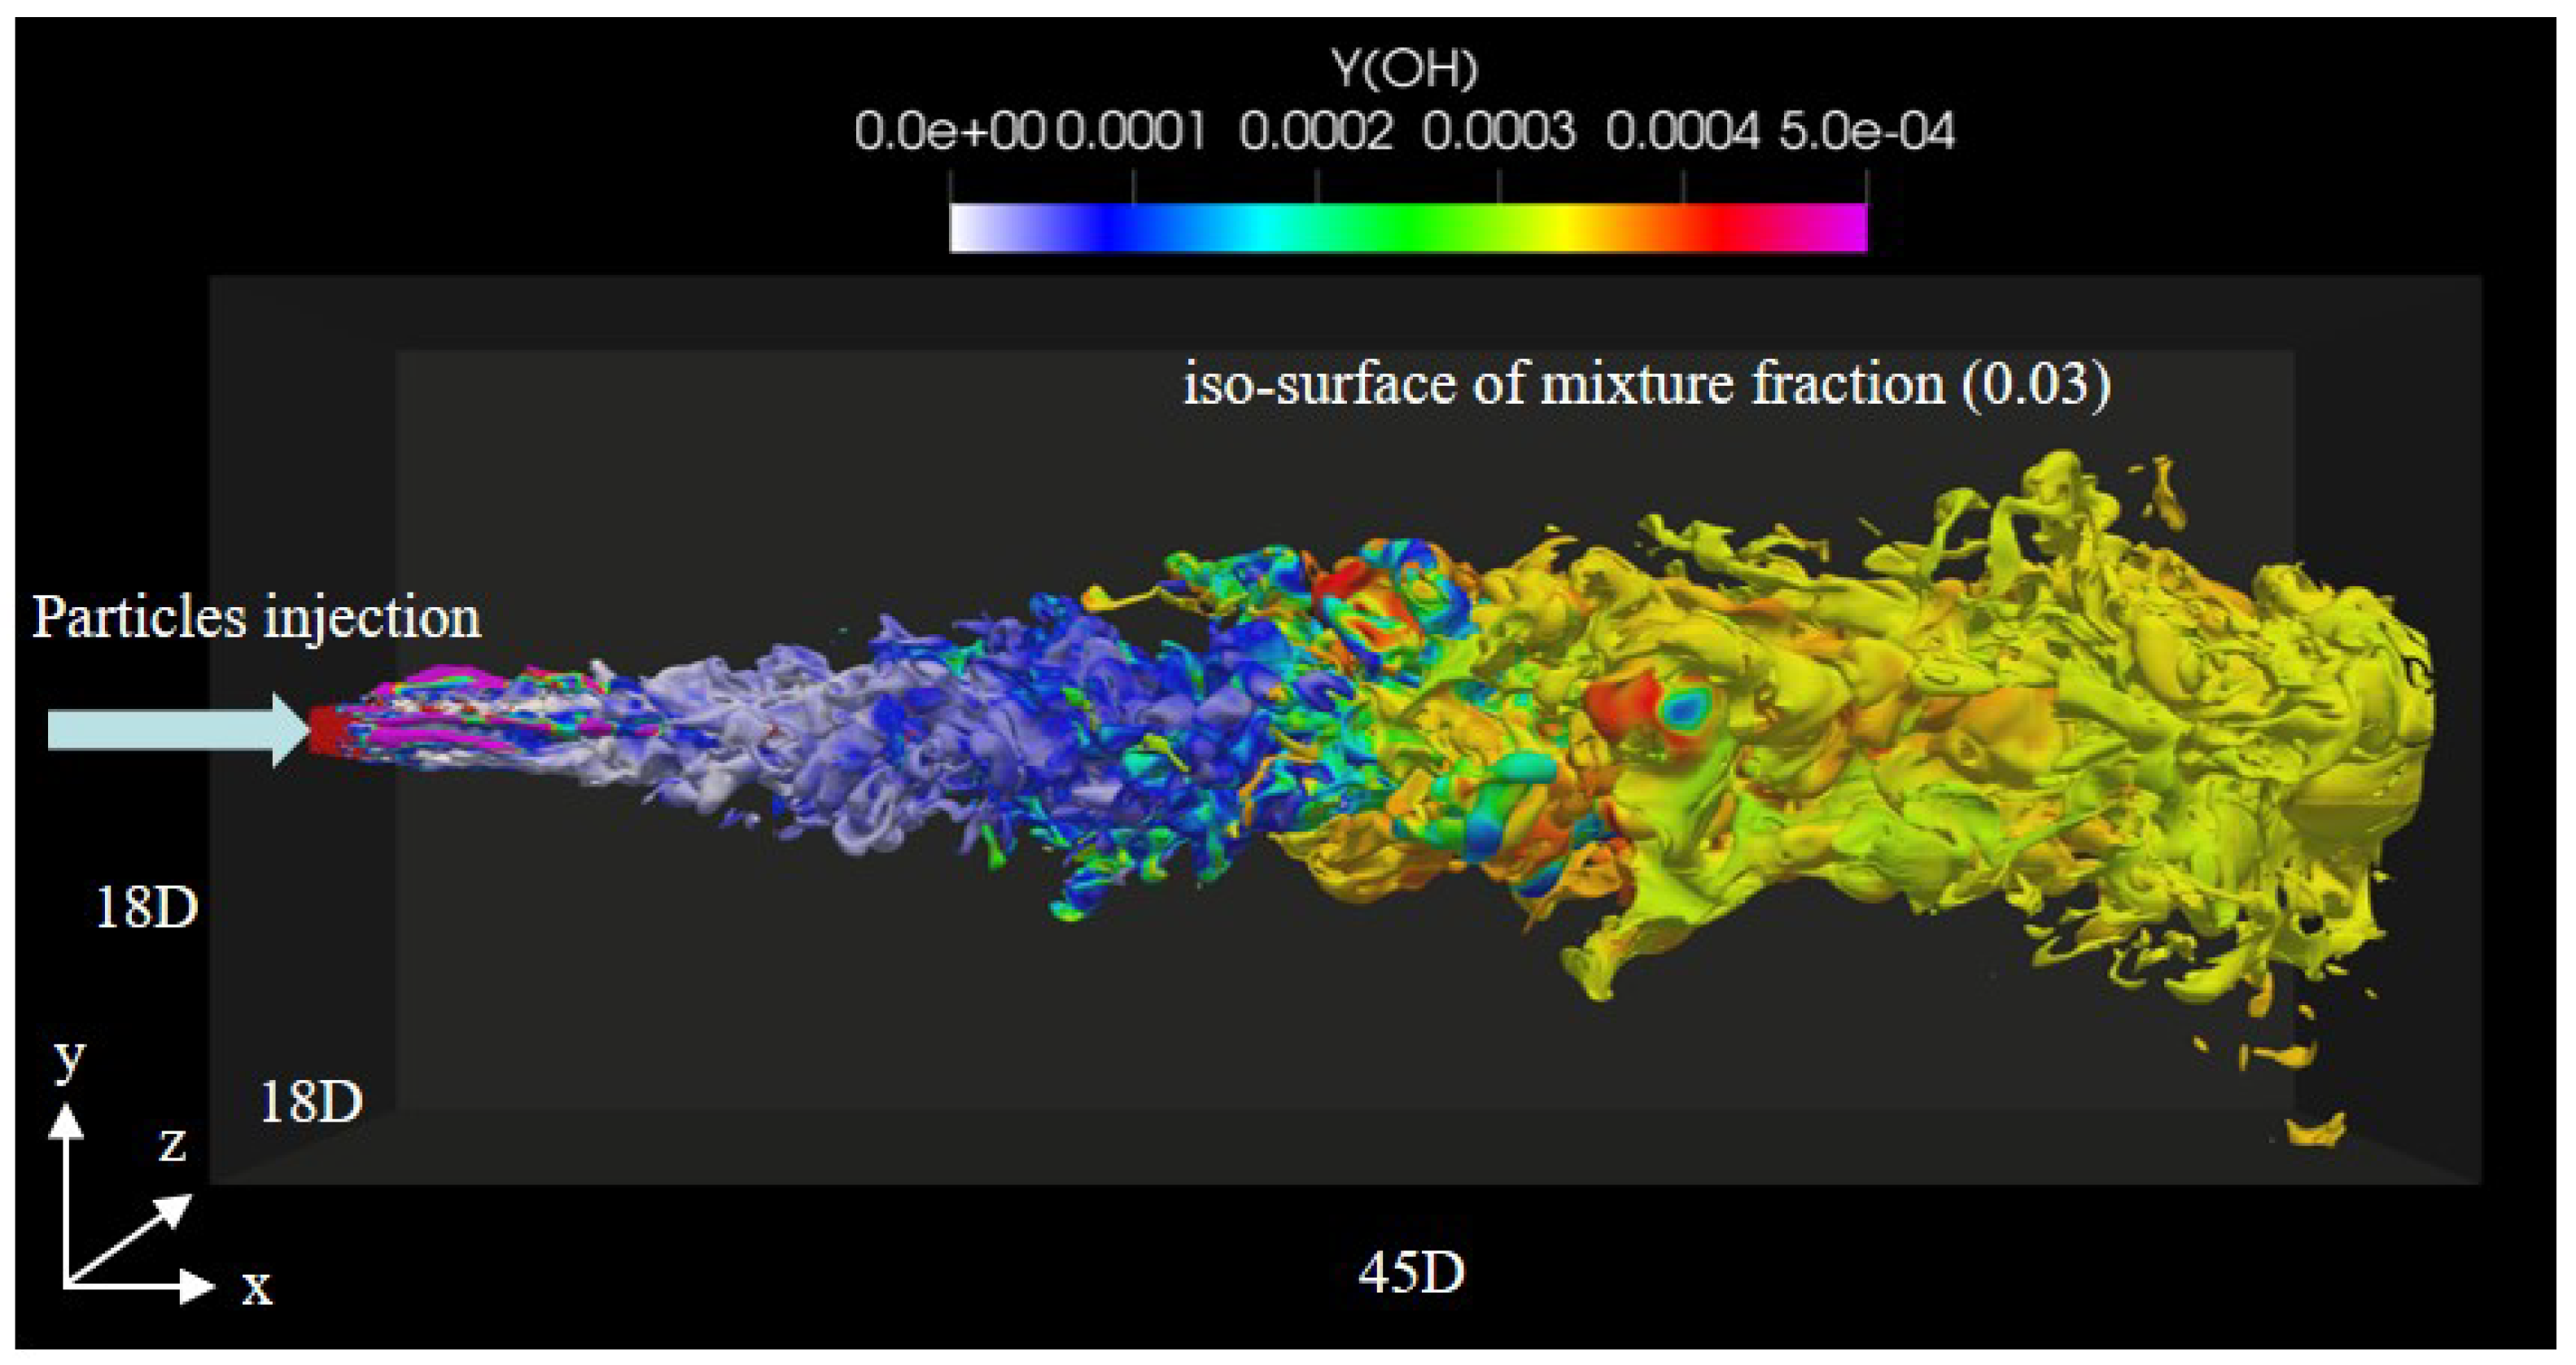
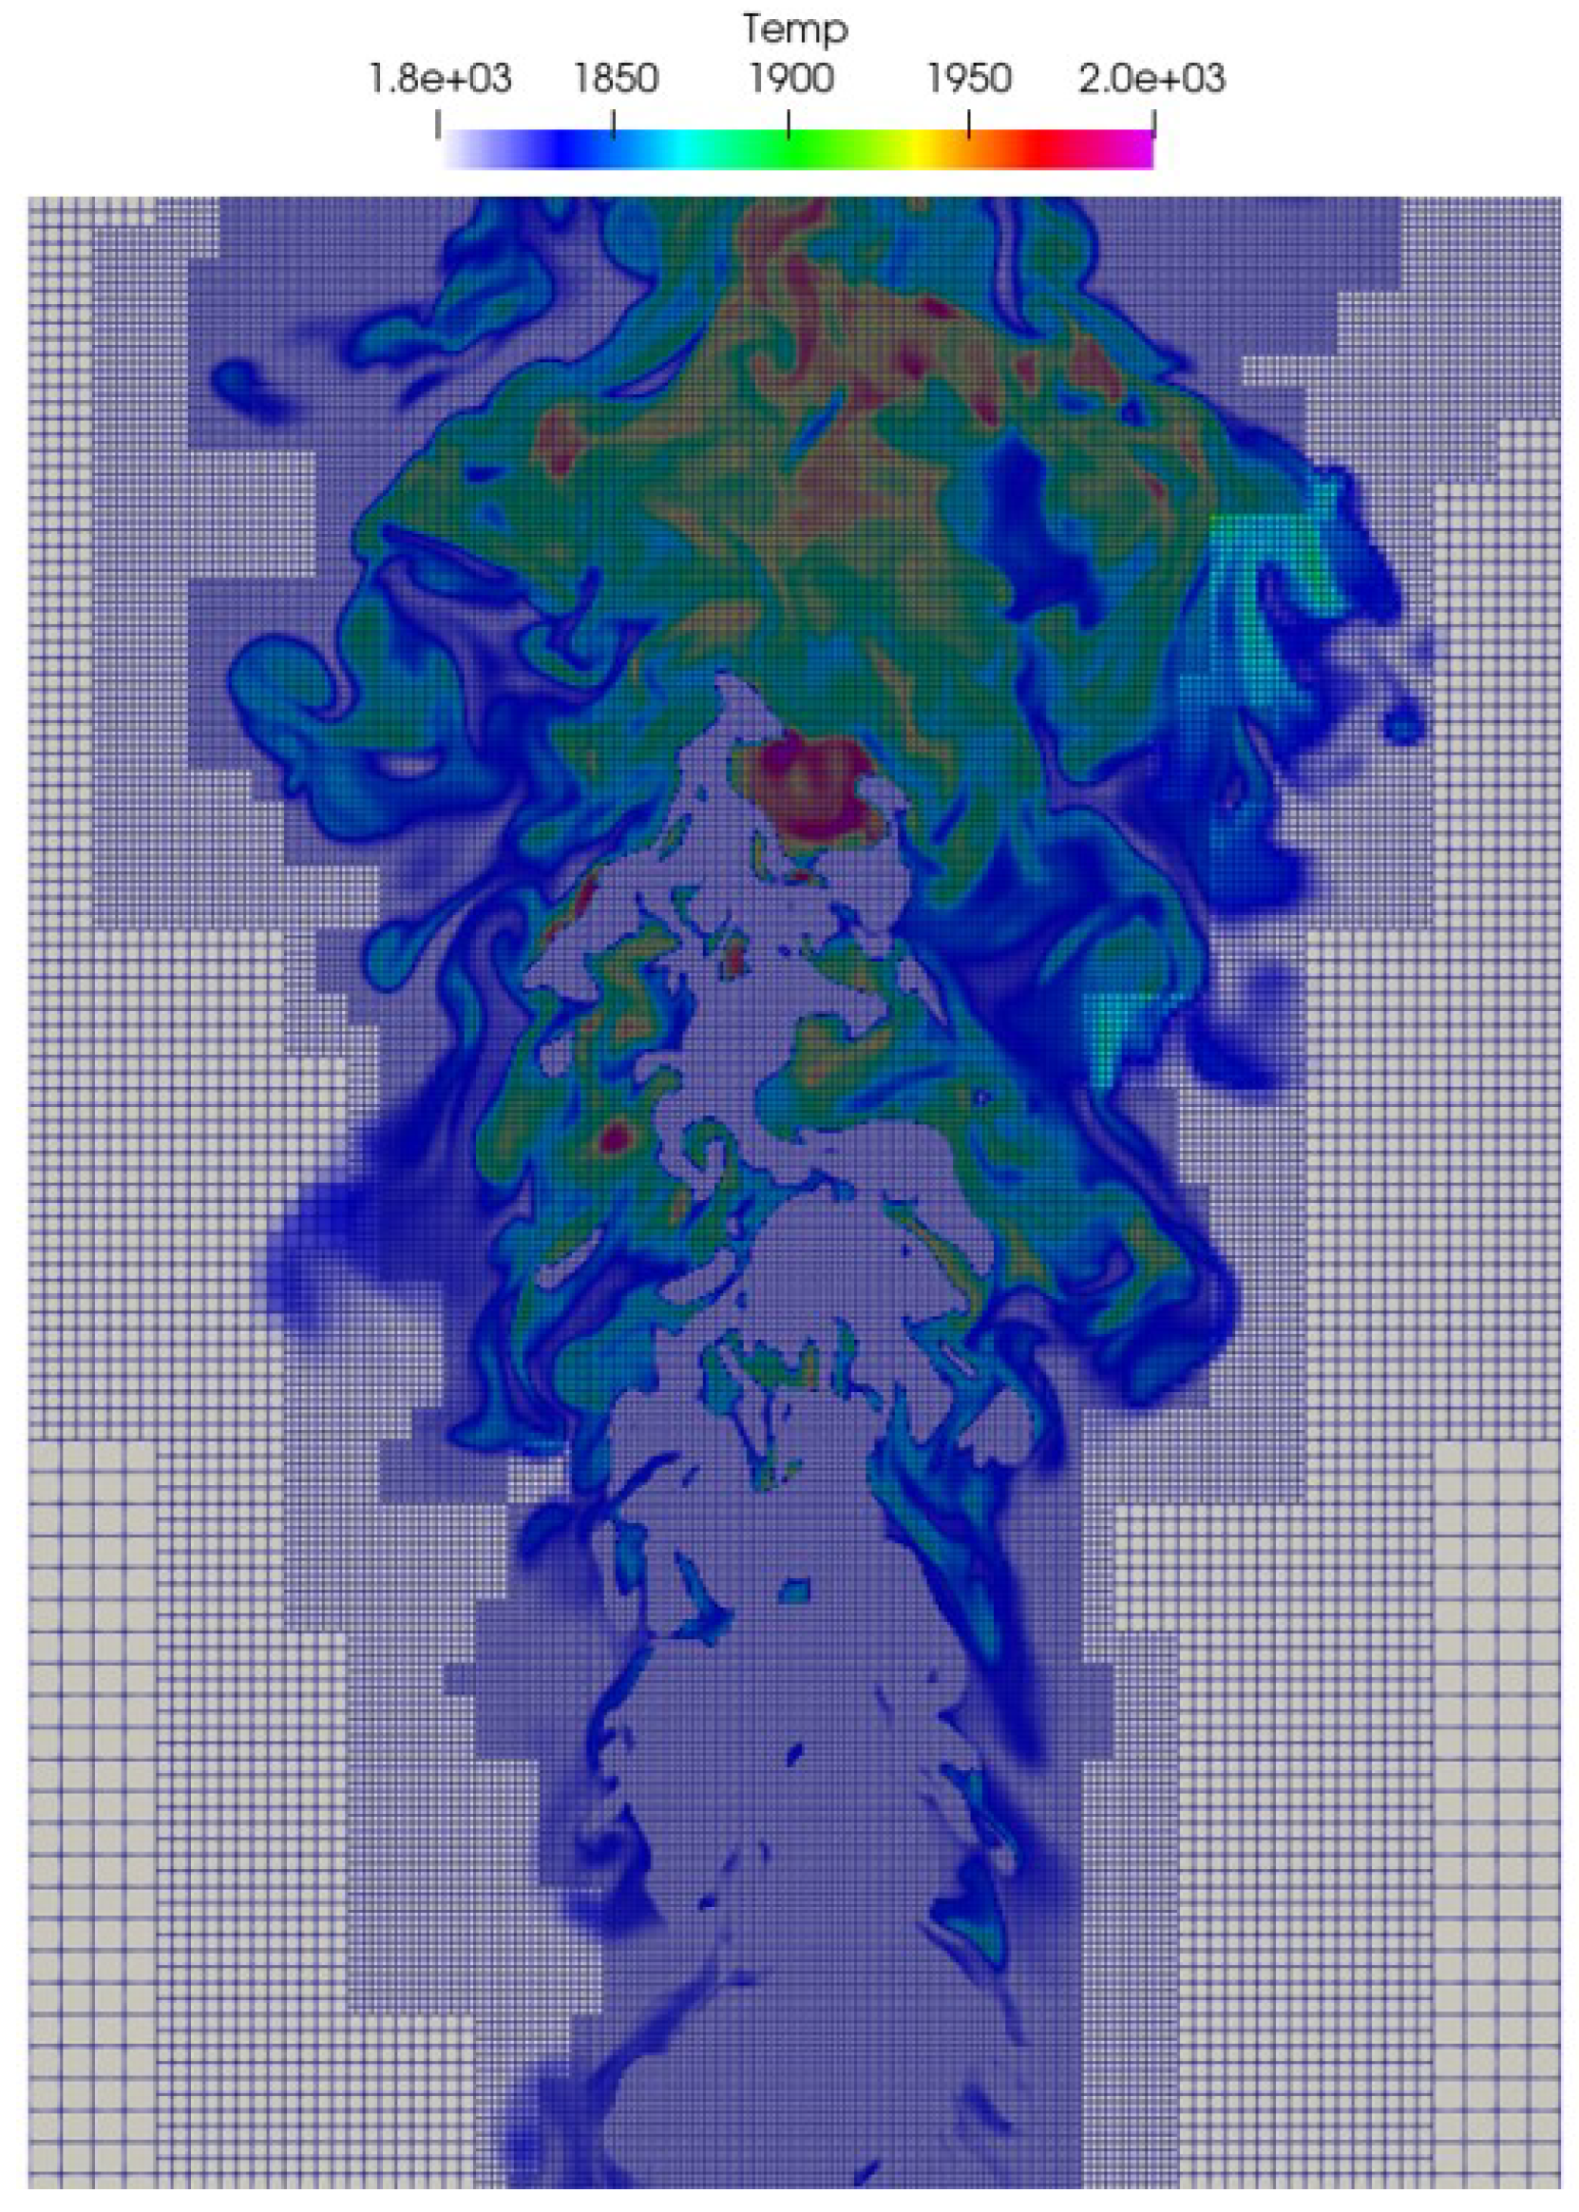
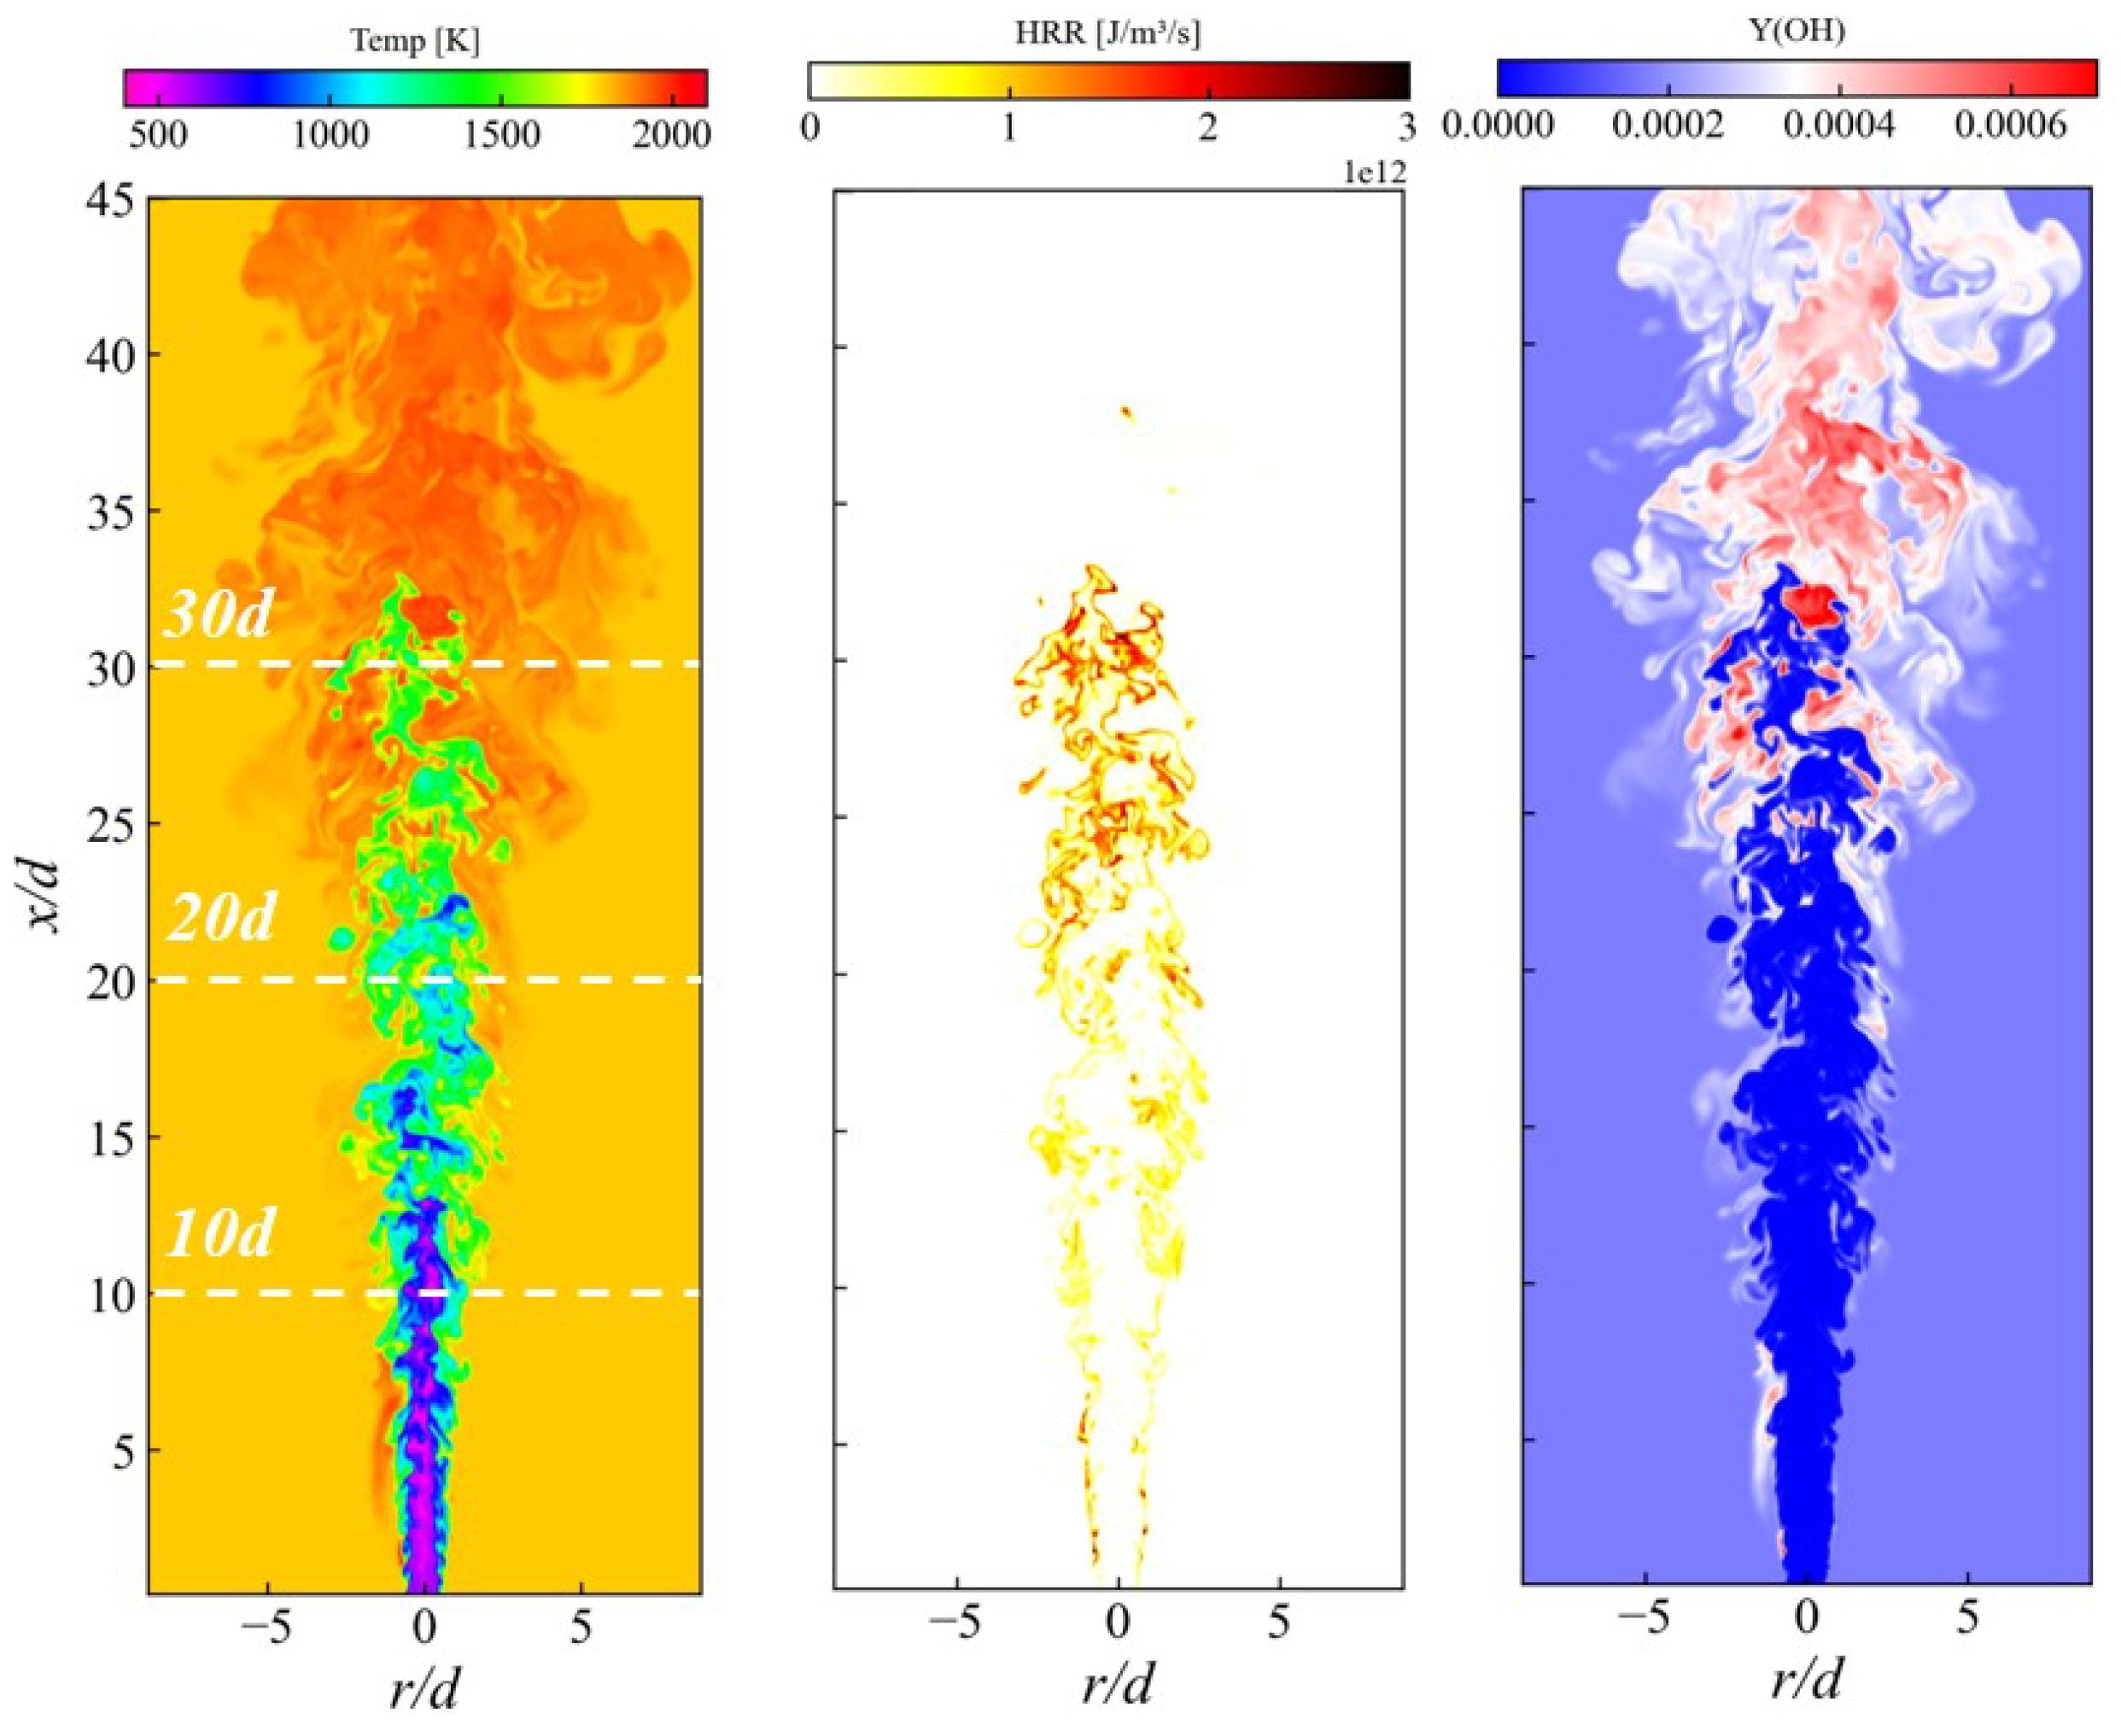
3.1. Instantaneous Characteristics of Ammonia Spray Flames

To illustrate the general characteristics of the liquid ammonia spray combustion process, Figure 3 presents the instantaneous distributions of gaseous temperature, heat release rate (HRR), and OH mass fraction in a typical  x r  plane. HRR is calculated as follows:
H R R = i = 1 N ω ˙ i h i 0
where  h i 0  represents the enthalpy of formation per unit mass of the ith species and  ω ˙ i  denotes the reaction rate of the ith species. The temperature distribution shows that the liquid ammonia spray jet is featured by a relatively low temperature in the upstream region, which progressively increases to form a high-temperature zone downstream. The distribution of HRR shows that the upstream region exhibits a relatively low overall HRR, while high heat release rates are mainly concentrated in the downstream region. The OH mass fraction distribution reveals the flame structure, with OH initially forming at the jet edge in the upstream region. The OH concentration increases gradually and becomes more widely distributed as the flame develops. The current computational domain length could capture the main reaction zones, as can be seen from the distribution of heat release rate. The distributions of various radicals are also examined, which are well captured within the computational domain.
Investigating the characteristics of NO/N2O/NH distribution in liquid ammonia spray flames is of particular interest. Figure 4 displays the instantaneous distributions of mass fractions of NO, N2O, and NH in a typical  x r  plane. The results indicate that NO mainly was distributed in the downstream region, where the gaseous temperature was high. Note that the reactions related to NO formation are completed in the computational domain, so the domain size is sufficiently large to provide meaningful results. The formation of N2O is dominated by the reactions that occur in the intermediate temperature range. NH is commonly used to delineate the reaction zone for ammonia flames, given that NH formation is strongly linked to ammonia consumption [3]. It can be observed that the distribution of NH is similar to that of HRR.
The statistical behavior of the flames is quantified next. Figure 5 shows scatter plots of gaseous temperature, HRR, and mass fraction of OH versus mixture fraction at various locations at 6 τ j . In this study, the mixture fraction (Z) is defined according to Bilger’s formulation [32]. This definition allows the mixture fraction to range from zero at the oxidizer side to unity at the fuel side, which includes the effects of various elements and is written as
Z = 0.5 ( Y H Y H , o ) / W H ( Y O Y O , o ) / W O 0.5 ( Y H , f Y H , o ) / W H ( Y O , f Y O , o ) / W O
where  Y H  and  Y O  represent the mass fractions of the elements H and O, respectively.  W H  and  W O  denote the relative atomic weights of the elements H and O, respectively. The subscripts f and o represent the fuel stream and oxidizer streams, respectively.
It can be observed that only a small number of the points exceed the ambient temperature (1800 K) at  x / d  = 10, which are located in regions featured by relatively lean combustion. As the axial distance increases, the number of samples exceeding the initial ambient temperature increases. The variation in heat release rate also corroborates this observation. The peak value of the conditional mean of  Y O H  is located near Z = 0 at  x / d  = 10. Note that the ambient is featured by Z = 0 according to the definition of Z. As chemical reactions proceed, a certain amount of OH is formed in the ambient, which could be observed from the instantaneous distribution of the OH mass fraction. We note that the peak of the instantaneous OH mass fraction is located near Z corresponding to the maximum HRR. The peak of the OH mass fraction in the upstream region is located within the lean mixture, where more oxygen was available. The peak of the OH mass fraction shifts to a richer mixture with increasing axial distance, where more fuel is available. Overall, the peak of gaseous temperature, HRR, and mass fraction of OH increases with increasing axial distance, and the peak shifts to the fuel-rich side.
Figure 6 shows scatter plots of NO, N2O, and NH in the mixture fraction space at various locations. It can be found that the mixture fraction corresponding to the peak value of the NO mass fraction is smaller than that of HRR. As can be seen, the NO mass fraction corresponds to high-temperature regions. The fuel is consumed within high-temperature regions, with relatively low mixture fractions and high levels of NO. The formation of N2O in the combustion process mainly relies on reactions occurring in the intermediate temperature range. Given that these regions have relatively rich fuel, the peak of N2O is located in a richer mixture compared to the peak of NO. In ammonia/air flames, the NH layer is utilized to characterize the reaction zone. The scatter plots of NH are very similar to the results of the HRR, and the peak values of NH and HRR corresponds to almost the same Z values. In general, the mass fractions of NO, N2O, and NH increases due to the enhanced chemical reactions as the axial distance increases, with peak shifts to richer mixtures, where more fuel is available.
The scalar dissipation rate  χ  is a very important quantity in turbulence diffusion combustion. In the present work,  χ  is defined as  2 D Z 2 , where D denotes the thermal diffusivity. Figure 7 (left) shows the instantaneous distribution of  χ  in a typical  x r  plane, revealing that high  χ  values are concentrated in the upstream regions, while relatively lower values are observed downstream. To quantify the results, Figure 7 (right) presents the probability density functions (PDFs) of the logarithm of  χ  at various locations. The results indicate that the probability associated with the highest  χ  values decreases as the axial distance increases. This trend is attributed to the substantial turbulence intensity in the near field of the jet flame, which enhances the mixing between fuel and oxidizer and leads to a significant gradient of Z. Consequently,  χ  is higher in the upstream region compared to the downstream region. The distribution of vorticity can serve as a manifestation of turbulence intensity. Figure 8 (left) shows the instantaneous distribution of the magnitude of vorticity in a typical  x r  plane. The evolution of conditional mean magnitude of vorticity conditionally along the axial direction is shown in Figure 8 (right). It can be seen that the magnitude of vorticity is higher in the upstream region and gradually decreases with increasing axial distance. This implies the evolution of turbulence intensity along the axial direction.
Figure 9 presents scatter plots of HRR versus  χ  at different locations. It can be seen that the samples tend to concentrate in regions featured by low  χ , where the conditional mean of HRR is higher. Previous studies [33] have shown that high  χ  results in a strong heat loss. Conversely, low  χ  is conducive to autoignition.
As depicted in Figure 10, the PDFs of the logarithm of  χ , normalized by its mean  μ  and root mean square  σ , are compared with Gaussian distributions. The results indicate that the distribution of  χ  at various locations is nearly log-normal. The PDFs exhibit minor deviations from a Gaussian distribution and are characterized by a negative skewness.

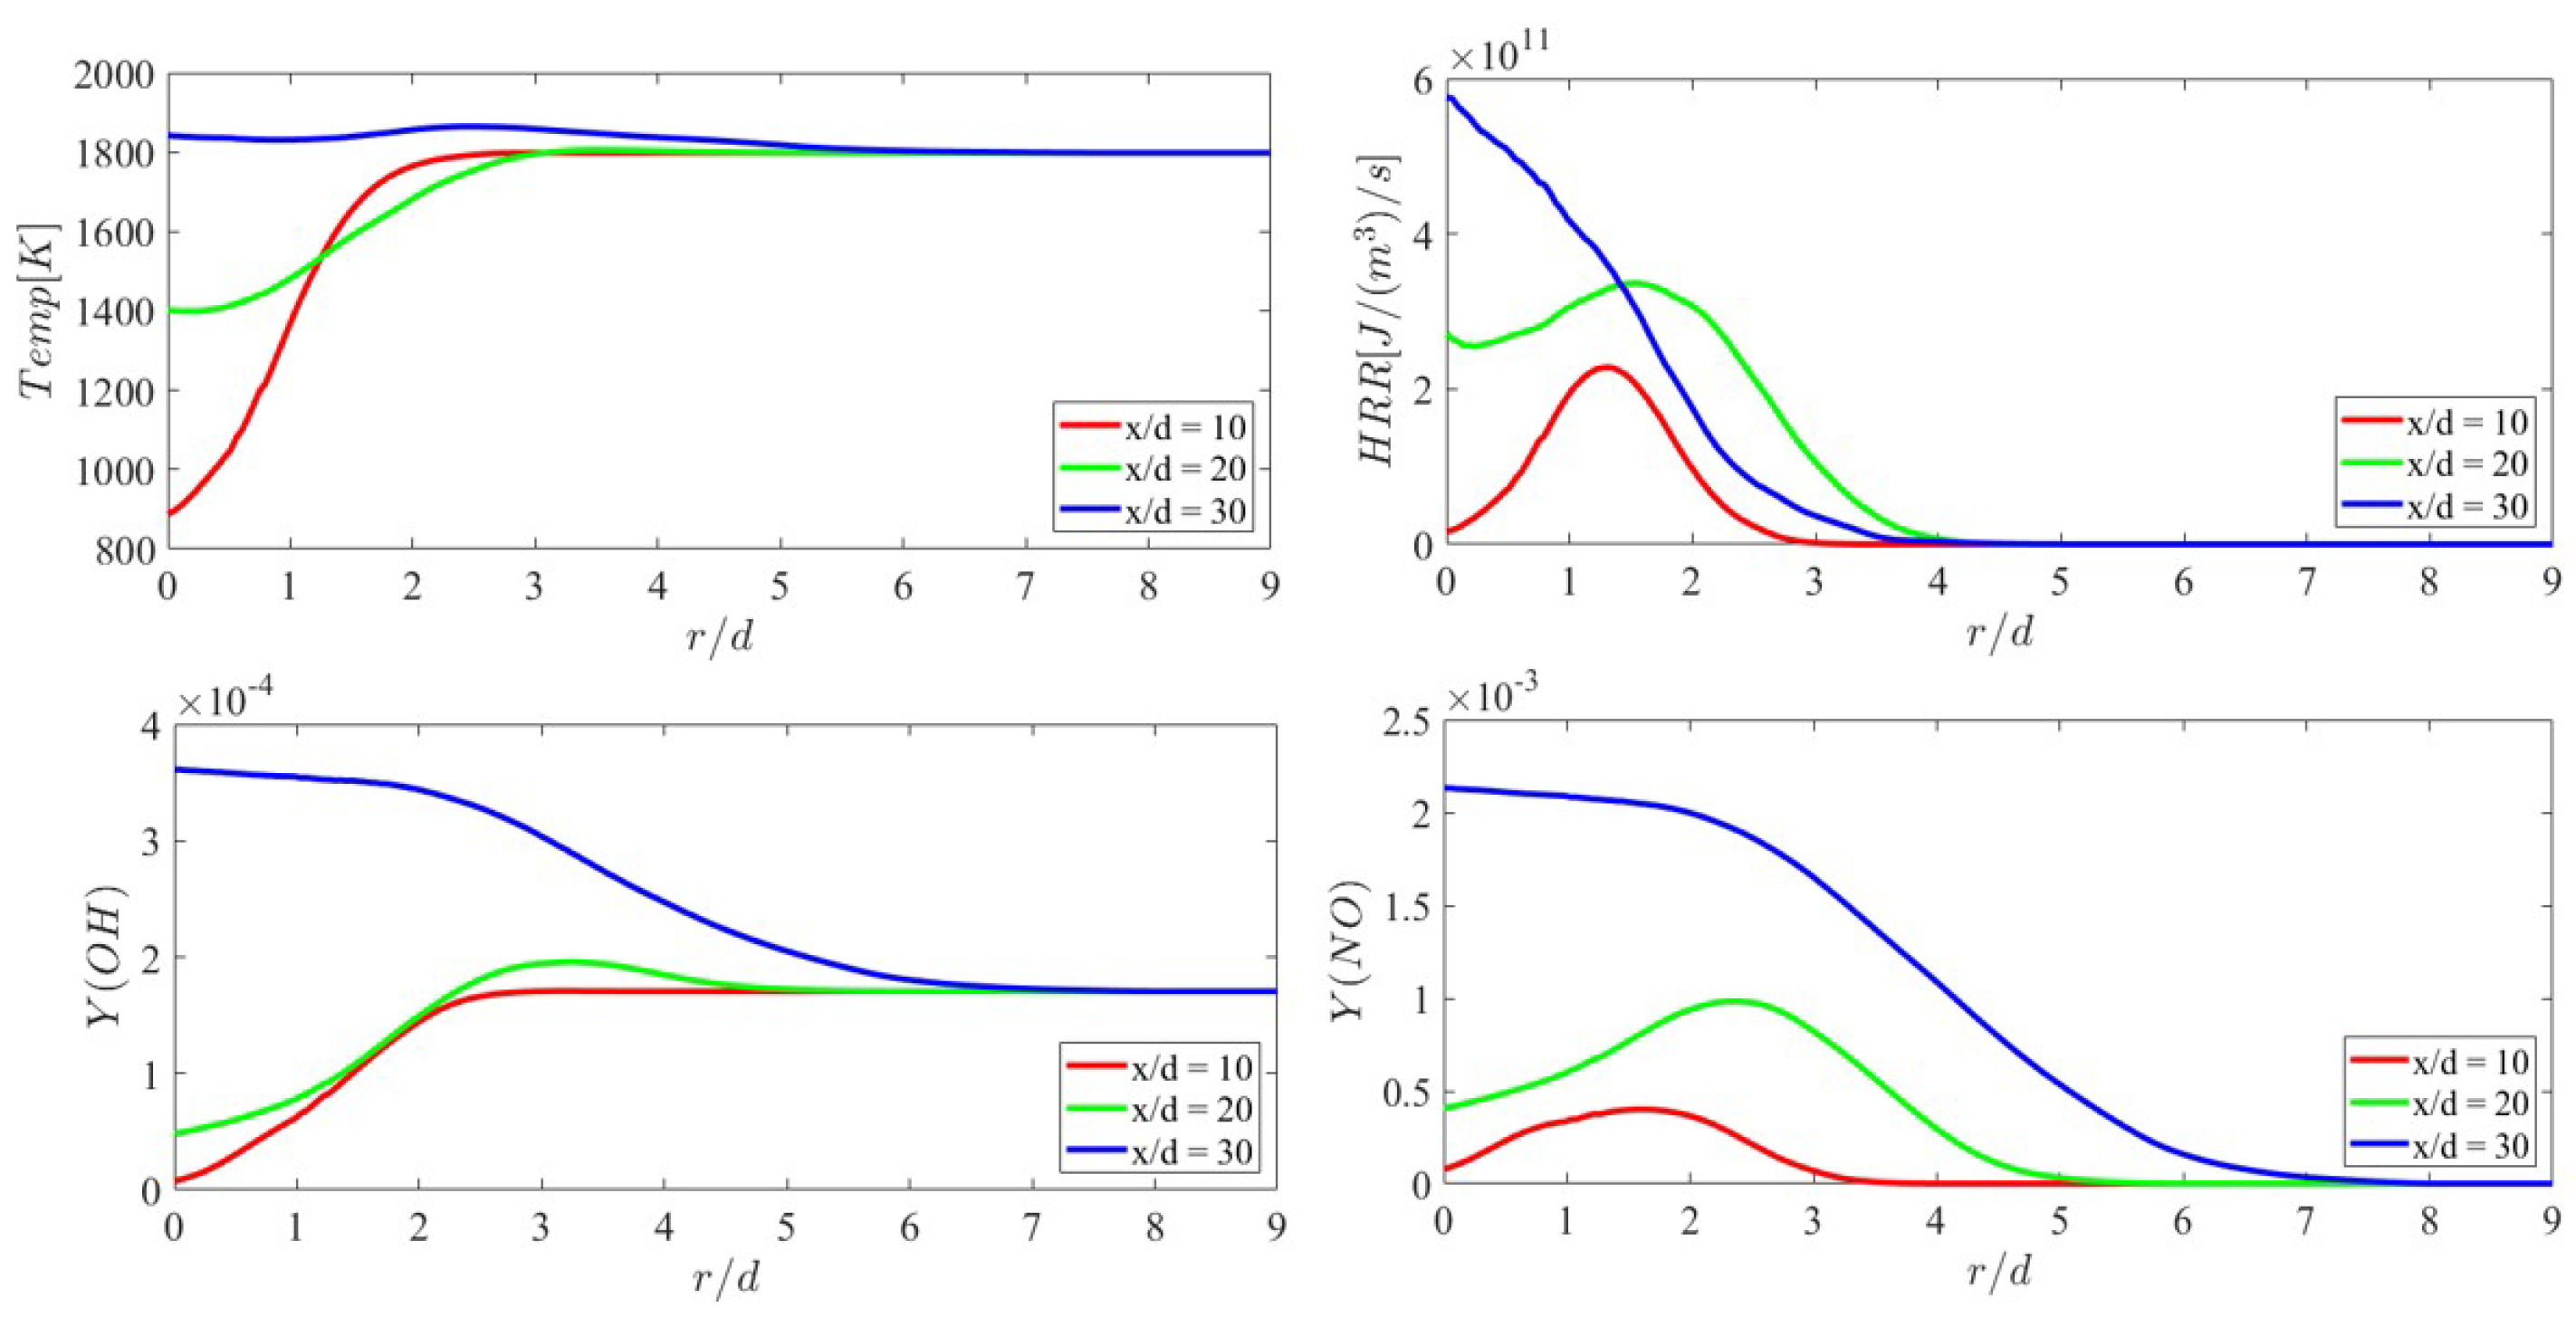
3.2. Mean Flame Structure

The mean flame structure is also studied. Figure 11 shows the mean fields of gaseous temperature, HRR, and mass fractions of OH, NO, and N2O. The mean fields are obtained through temporal and spatial averaging. It is clear that high temperatures predominantly occur in the downstream region. The reactions initially occur at the edge of the jet and, subsequently, the reaction zones converge downstream, characterized by high HRR. The distribution of OH and NO mass fractions is similar, with both mainly concentrated in the high-temperature region. It can be observed that N2O is primarily generated in the downstream region ranging from  x / d  = 28 to  x / d  = 32. For quantitative analysis, the mean profiles of gaseous temperature, HRR, and mass fractions of OH and NO at various locations are presented in Figure 12. It is found that the values of various quantities at the central axis of the jet increase with increasing axial distance. At  x / d  = 30, the temperature at the jet axis exceeds the ambient temperature, and the peaks of HRR and mass fractions of OH and NO are located on the jet axis. The peaks of OH and NO mass fractions and HRR at  x / d  = 10 and 20 are away from the jet axis. In general, the radial profile width of HRR is narrower than those of the mass fractions of OH and NO.

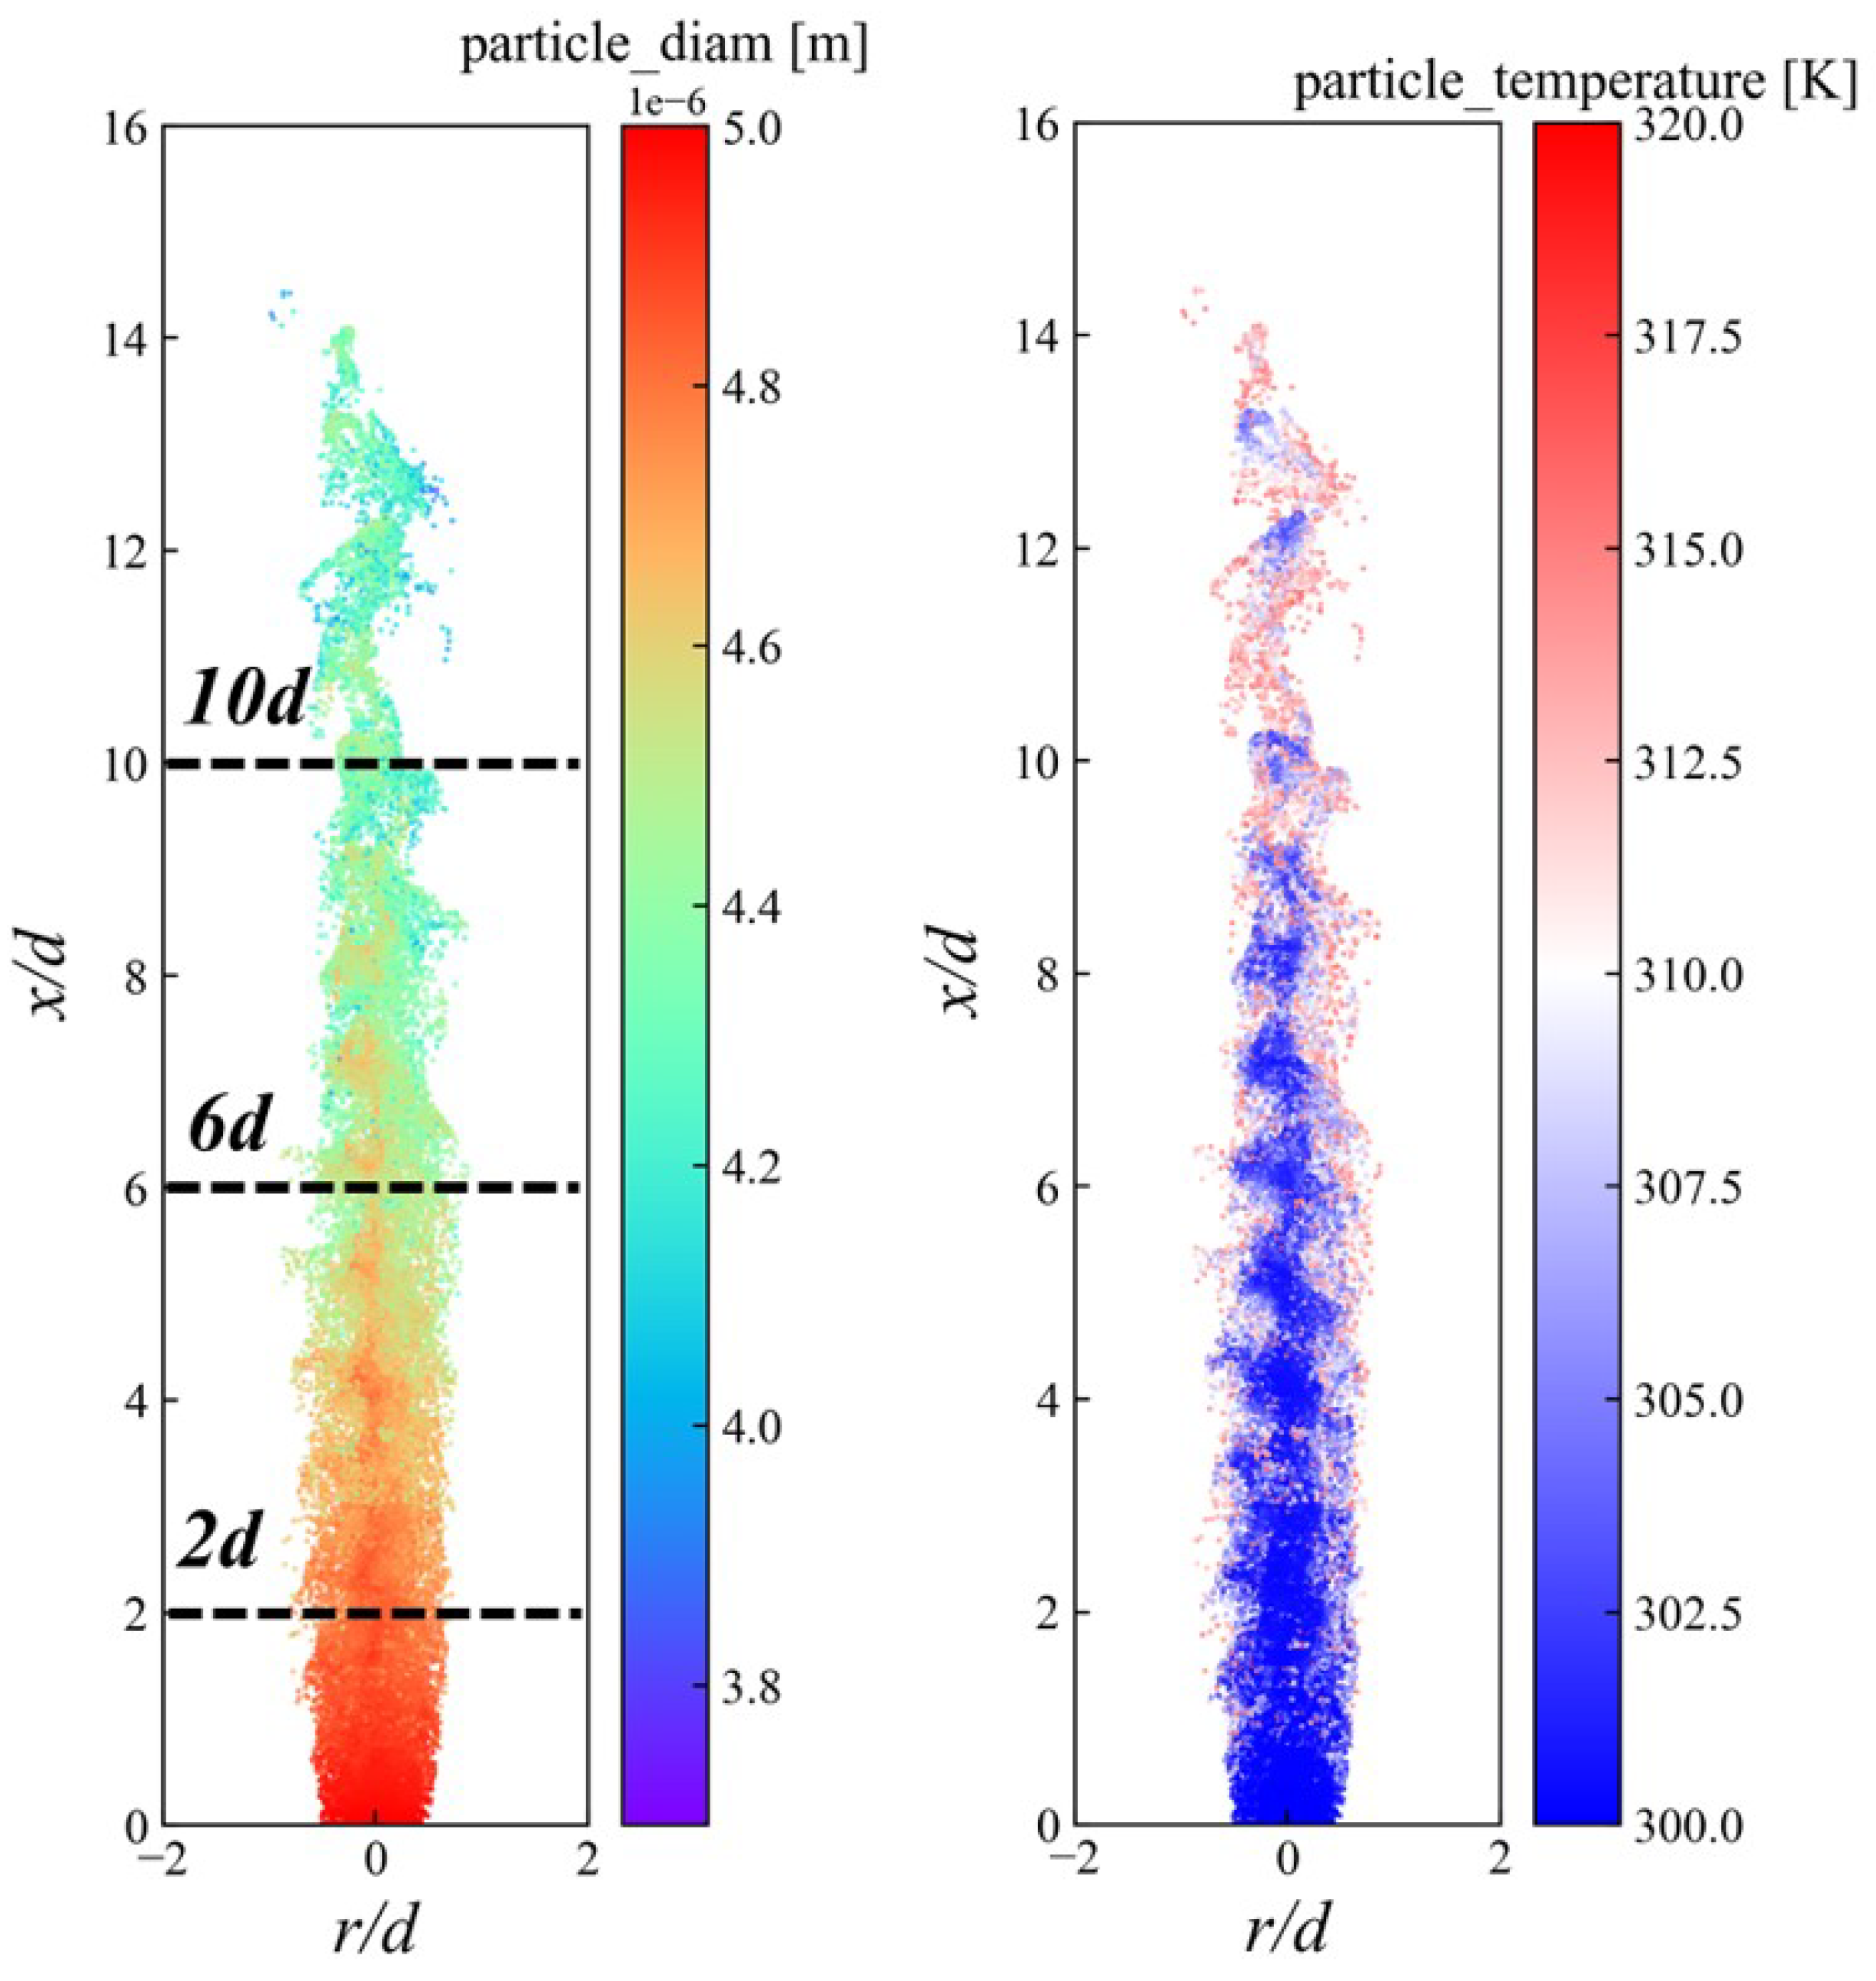
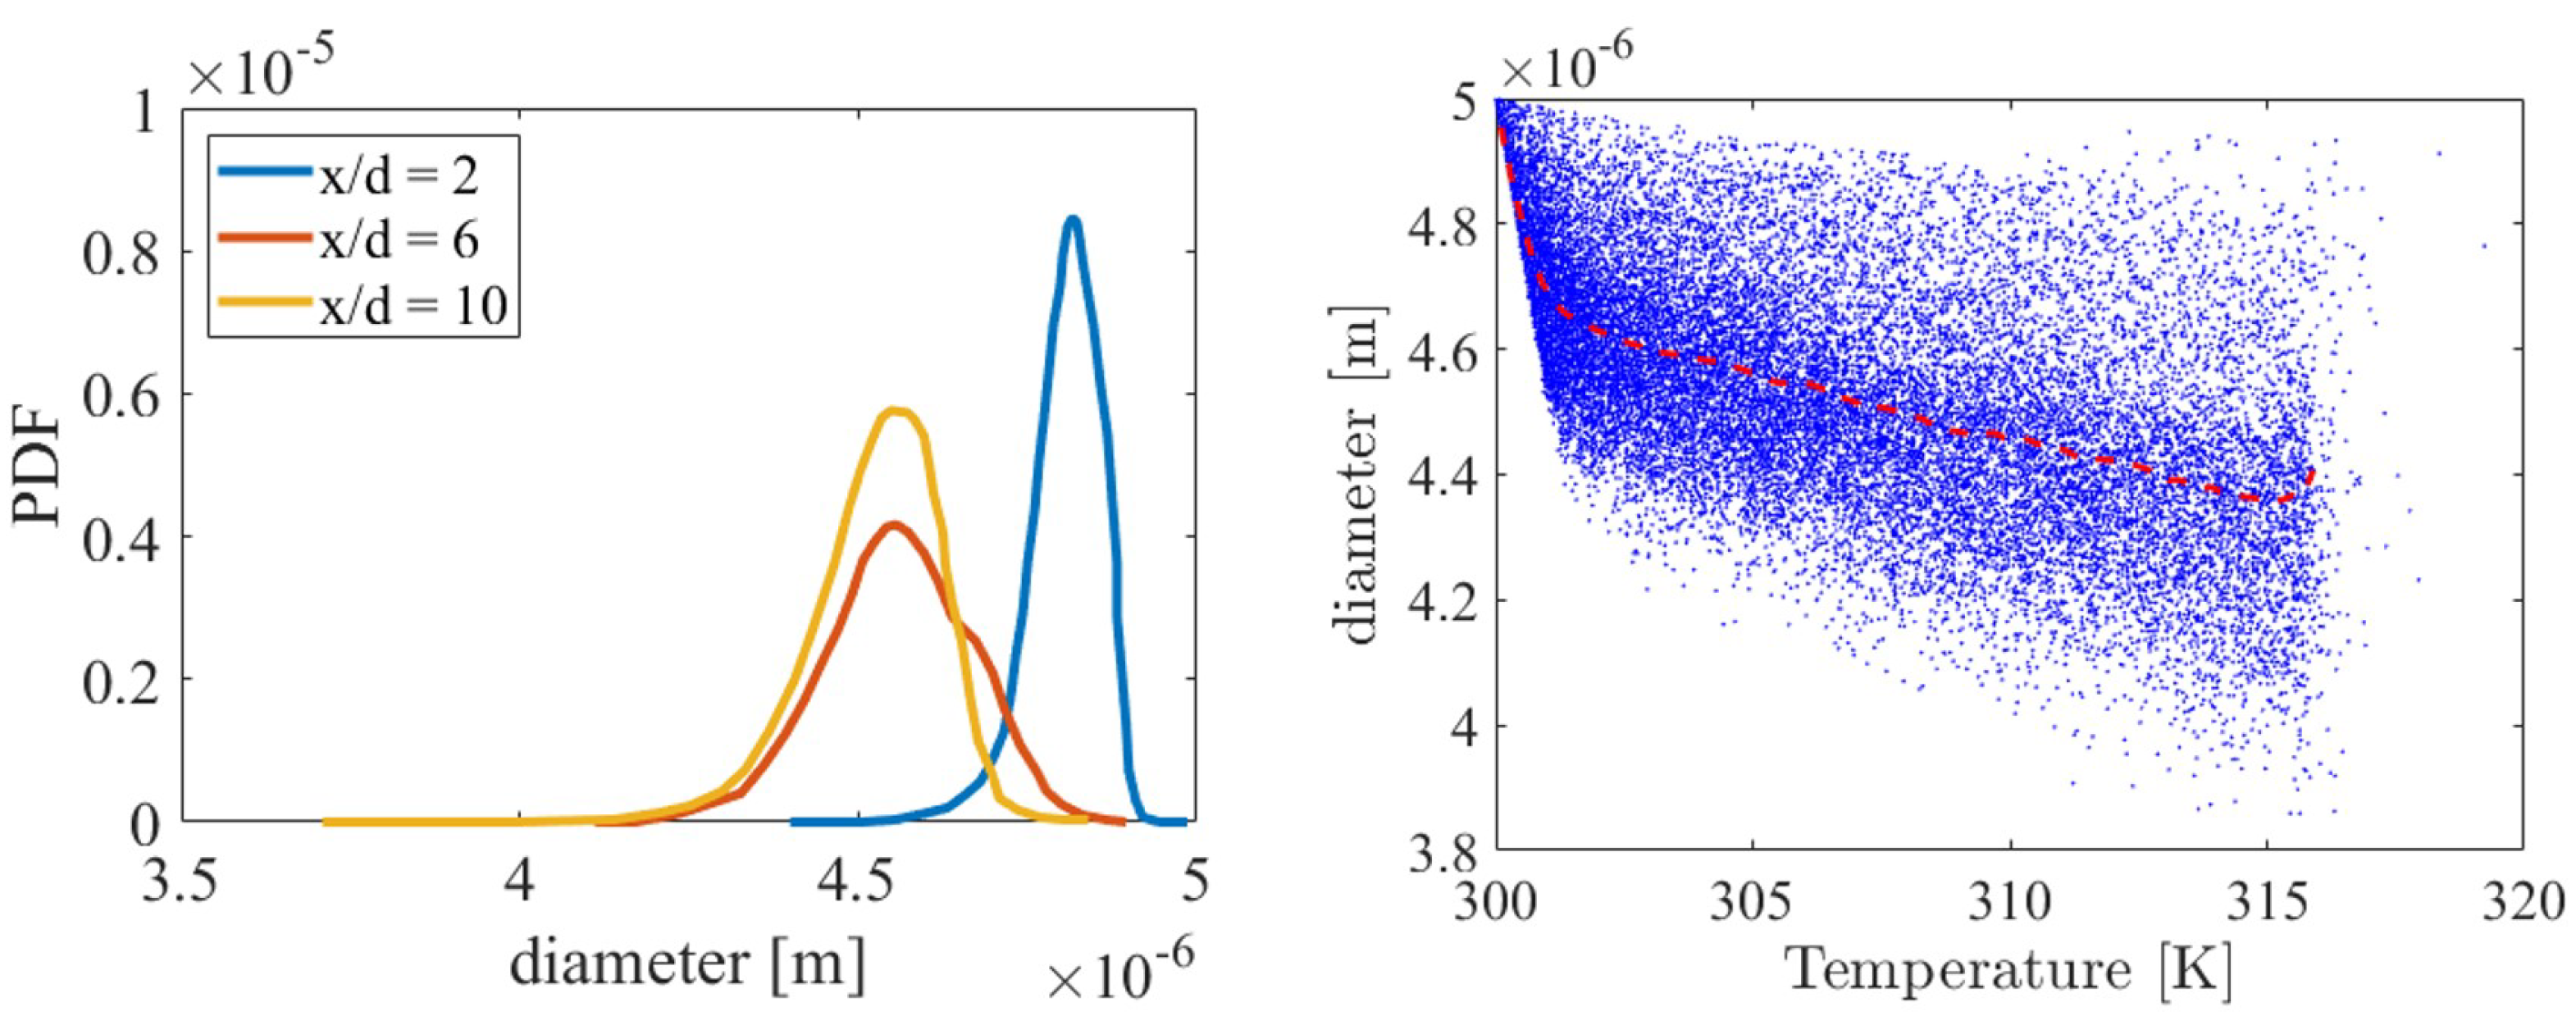
3.3. Distribution of Ammonia Particles

The evolution of ammonia spray is a critical fundamental aspect of ammonia spray combustion. Understanding the distribution characteristics of ammonia particles in present ammonia spray combustion is of significant interest. Figure 13 illustrates the distribution of ammonia particles, superimposed with particle diameter and temperature. It is found that the diameter of ammonia particles decreases with increasing axial distance due to evaporation. The radial width of the downstream ammonia particles gradually narrows due to the enhancement of the reaction. The ammonia particles are heated by the hot ambient, so the temperature of particles on both sides increases significantly.
Figure 14 (left) shows the PDFs of the ammonia particle diameters at different downstream locations. The results confirm that the diameter decreases as the axial distance increases. Figure 14 (right) shows the scatter plots of particle diameter versus particle temperature. The red dashed line denotes the mean quantity conditioned on particle temperature. The relationship between particle diameter and temperature reveals that particle diameter typically decreases as particle temperature increases, indicating a negative correlation.

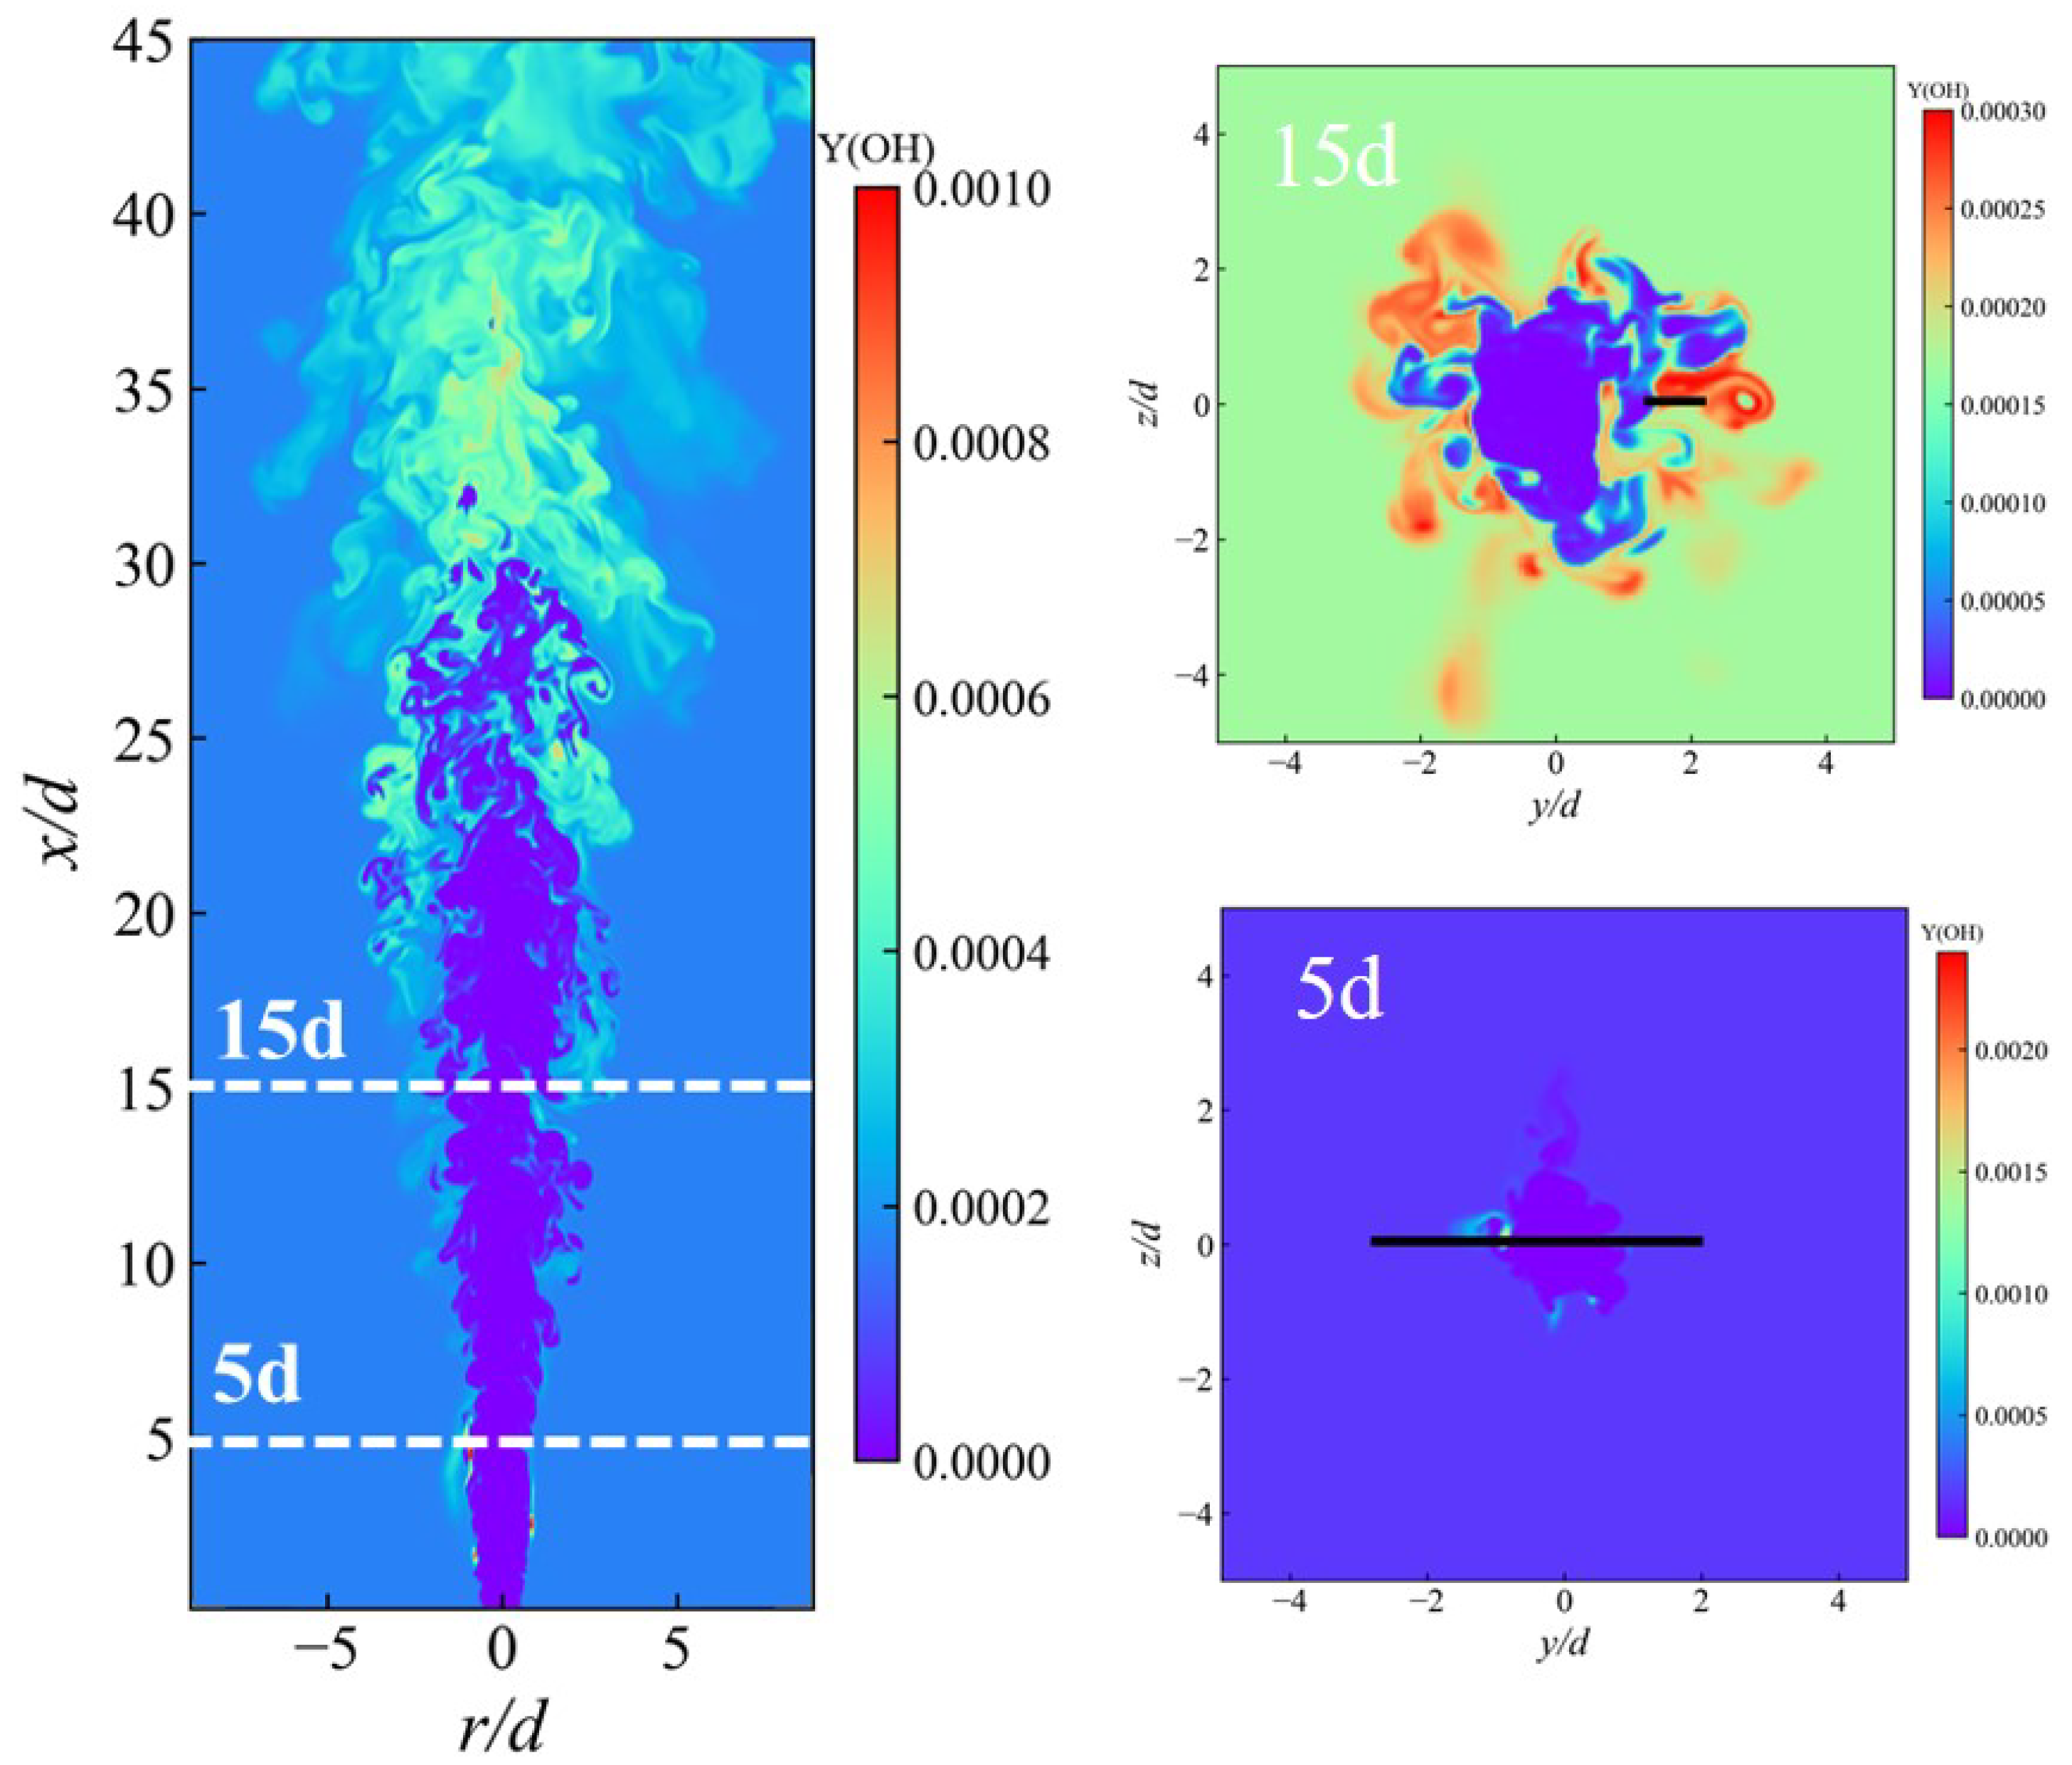
3.4. Flame Stabilization Mechanism

Flame stabilization typically relies on auto-ignition or flame propagation. Analyzing the budgets of species transport equations allows for differentiation between auto-ignition and flame propagation modes. This approach has been employed in prior studies on turbulent combustion [34,35] to elucidate flame stabilization mechanisms. Generally, when the reaction term is much larger than the diffusion term, flame stabilization primarily relies on auto-ignition; when these two terms are of similar magnitude, the flame propagation mode plays a crucial role in flame stabilization. OH is a key species and was chosen for budget analysis in this study. The budget of the transport equation for OH can be expressed as follows:
ρ Y OH t + ρ u i Y OH x i = x i ρ D k Y OH x i + ω ˙ OH
where  Y OH  represents the mass fraction of OH and  ω ˙ OH  denotes the reaction rate of OH. The first term on the right-hand side of the equation is the diffusion term D(OH) and the second is the reaction term R(OH).
Figure 15 (left) illustrates the instantaneous distribution of the OH mass fraction in a typical  x r  plane, with specific axial locations at  x / d  = 5 and 15 chosen for detailed analysis. The corresponding instantaneous distributions of the OH mass fraction across these planes are shown in Figure 15 (right). Figure 16 shows the species budget terms along typical lines in the planes. The results demonstrate that the reaction term R(OH) is markedly greater than the diffusion term D(OH) at  x / d  = 5 and 15, suggesting that the auto-ignition mode plays a predominant role in turbulent ammonia spray flame stabilization.

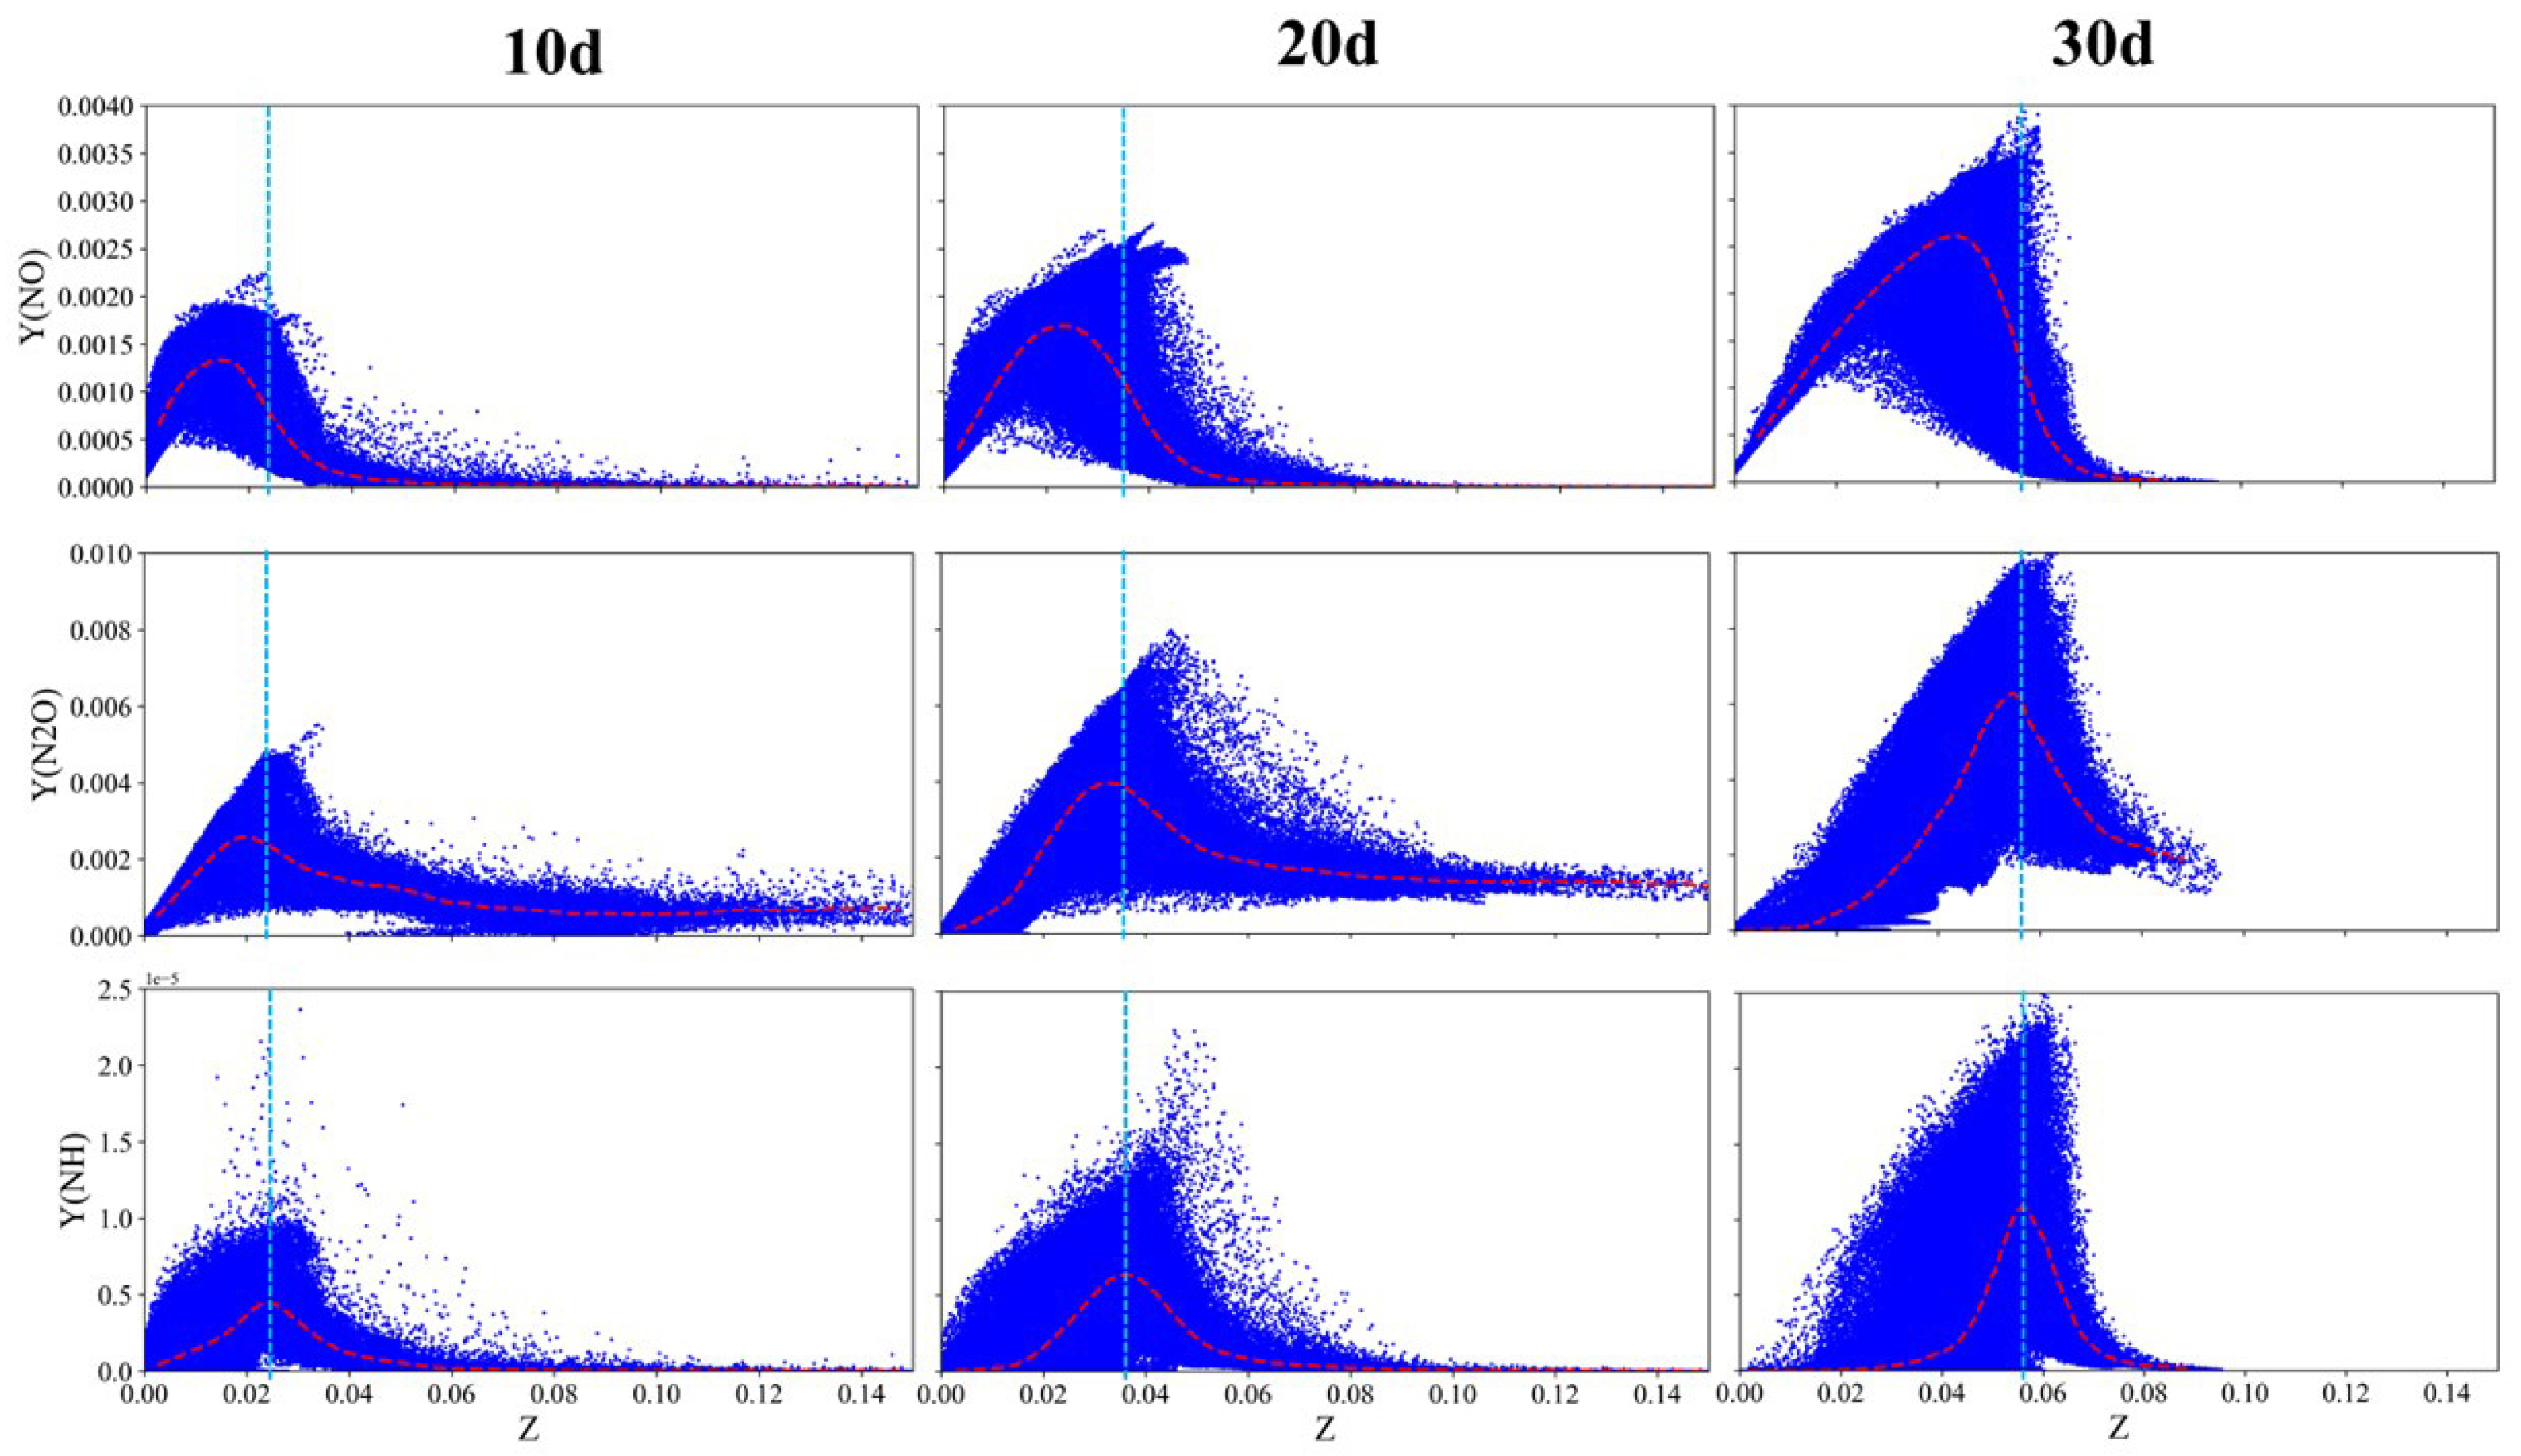
3.5. Combustion Modes of Ammonia Spray Flames

Spray combustion is characterized by complex combustion modes that encompass both premixed and non-premixed regimes [36,37]. The normalized flame index (N.F.I.) developed by Yamashita et al. [38] is a valuable parameter to elucidate the combustion modes of present flames. The form of this parameter is shown as follows:
N . F . I . = n Y F · n Y O 2 = Y F · Y O 2 Y F Y O 2
Here,  Y F  and  Y O 2  are the fuel and oxidizer mass fractions, respectively. In particular,  Y F  =  Y N H 3 . It is worth noting that the N.F.I. is positive in premixed combustion and negative in non-premixed combustion.
Figure 17 presents the instantaneous distribution of HRR in a typical  x r  plane (left) and three  y z  planes (right). The coexistence of premixed and non-premixed combustion modes is evident in the ammonia spray jet flame. This is because the fuel evaporation and mixing processes could lead to the formation of regions where the fuel and oxidizer are well-mixed, resulting in premixed combustion. Previous studies on spray combustion involving particle injection into a hot ambient have also observed the coexistence of premixed and non-premixed combustion [37,39]. In the upstream regions, both combustion modes were present at the jet edges, characterized by relatively low HRR. As the axial distance increases, premixed combustion becomes increasingly dominant, marked by higher HRR.
To quantify the contributions of different combustion modes along the axial direction, a parameter  W p  is introduced to represent the fraction of total heat release attributed to premixed combustion. This parameter is calculated as follows [40]:
W p ( x ) = E p E t = HRR ( x , y , z ) N . F . I > 0 d y d z HRR ( x , y , z ) d y d z
where  E p  is integrated heat release of premixed combustion and Et represents integrated heat release from gaseous combustion. Figure 18 illustrates the variation of Wp with axial distance. It is observed that non-premixed combustion prevails in the upstream region, whereas the contribution of premixed combustion grows with increasing axial distance.

4. Conclusions

In this study, DNS of liquid ammonia spray combustion under high-pressure conditions was performed to examine the flame characteristics. The instantaneous distributions of scalar fields indicate that ammonia particles, carried by air, are injected into the combustion chamber and undergo auto-ignition under high-temperature and high-pressure conditions, resulting in complex turbulent combustion. The peaks of gaseous temperature, HRR, and important species mass fractions in mixture fraction spaces increase with increasing axial distance, and the peaks shift to richer mixtures. The distribution of the scalar dissipation rate at various locations is nearly log-normal. The normalized PDFs exhibit minor deviations from a Gaussian distribution and are characterized by a negative skewness.
At  x / d  = 30, the temperature at the jet axis exceeds the ambient temperature, and the peaks of HRR and mass fractions of OH and NO are located on the central axis. The peaks of HRR and mean OH and NO mass fractions at  x / d  = 10 and 20 are away from the jet axis. It is observed that the radial width of ammonia particles gradually narrows due to the enhancement of the reaction. The ammonia particles are heated by the hot ambient, so particle temperature on both sides increases significantly. It is found that the particle diameter is generally negatively correlated with particle temperature.
Flame stabilization mechanisms are also explored for liquid ammonia spray combustion. The budget analysis demonstrates that the reaction term R(OH) is markedly greater than the diffusion term D(OH) at various locations, suggesting that flame stabilization is primarily governed by auto-ignition. The complex combustion modes are also studied. It is found that the coexistence of premixed and non-premixed combustion modes is evident in the spray jet flame, whereas the contribution of premixed combustion grows with increasing axial distance.

Author Contributions

Conceptualization, Z.H. and H.W.; methodology, Z.H. and Q.M.; software, Z.H. and Q.M.; validation, Z.H. and H.W.; formal analysis, Z.H.; investigation, Z.H. and Q.M.; resources, Z.H.; data curation, Z.H. and H.W.; writing—original draft preparation, Z.H. and H.W.; writing—review and editing, Z.H., H.W., K.L. and J.F.; visualization, Z.H.; supervision, H.W.; project administration, H.W., K.L. and J.F.; funding acquisition, H.W., K.L. and J.F. All authors have read and agreed to the published version of the manuscript.

Funding

This research was funded by the Natural Science Foundation of China (grant no. U2441282).

Data Availability Statement

The data that support the findings of this study are available from the corresponding author upon reasonable request.

Conflicts of Interest

The authors declare no conflict of interest.

References

  1. Valera-Medina, A.; Xiao, H.; Owen-Jones, M.; David, W.; Bowen, P. Ammonia for power. Prog. Energy Combust. Sci. 2018, 69, 63–102. [Google Scholar] [CrossRef]
  2. Cai, T.; Zhao, D. Overview of Autoignition and Flame Propagation Properties for Ammonia Combustion. AIAA J. 2023, 61, 1–25. [Google Scholar] [CrossRef]
  3. Fan, Q.; Liu, X.; Cai, X.; Brackmann, C.; Aldén, M.; Bai, X.S.; Li, Z. Structure and scalar correlation of ammonia/air turbulent premixed flames in the distributed reaction zone regime. Combust. Flame 2022, 241, 112090. [Google Scholar] [CrossRef]
  4. Zhang, M.; Wei, X.; Wang, J.; Huang, Z.; Tan, H. The blow-off and transient characteristics of co-firing ammonia/methane fuels in a swirl combustor. Proc. Combust. Inst. 2021, 38, 5181–5190. [Google Scholar] [CrossRef]
  5. Rieth, M.; Gruber, A.; Chen, J. A direct numerical simulation study on NO and N2O formation in turbulent premixed ammonia/hydrogen/nitrogen-air flames. Proc. Combust. Inst. 2023, 39, 2279–2288. [Google Scholar] [CrossRef]
  6. Tian, T.; Wang, H.; Chen, J.H.; Li, Z.; Aldén, M.; Luo, K.; Fan, J. Direct numerical simulations of laboratory-scale NH3/air jet flames: Analysis of flame structure, flame stabilization and NO emission characteristics. Combust. Flame 2025, 274, 114007. [Google Scholar] [CrossRef]
  7. Okafor, E.C.; Yamashita, H.; Hayakawa, A.; Somarathne, K.K.A.; Kudo, T.; Tsujimura, T.; Uchida, M.; Ito, S.; Kobayashi, H. Flame stability and emissions characteristics of liquid ammonia spray co-fired with methane in a single stage swirl combustor. Fuel 2021, 287, 119433. [Google Scholar] [CrossRef]
  8. Uchida, M.; Ito, S.; Suda, T. Development of Liquid Ammonia Direct Spray Combustion Gas Turbine. IHI Eng. Rev. 2022, 55. [Google Scholar]
  9. Wang, R.; Zhang, M.; An, Z.; Cai, X.; Liu, J.; Wang, J.; Huang, Z. Topology characteristics of liquid ammonia swirl spray flame. Proc. Combust. Inst. 2024, 40, 105740. [Google Scholar] [CrossRef]
  10. Scharl, V.; Sattelmayer, T. Ignition and combustion characteristics of diesel piloted ammonia injections. Fuel Commun. 2022, 11, 100068. [Google Scholar] [CrossRef]
  11. Scharl, V.; Lackovic, T.; Sattelmayer, T. Characterization of ammonia spray combustion and mixture formation under high-pressure, direct injection conditions. Fuel 2023, 333, 126454. [Google Scholar] [CrossRef]
  12. Zhang, Z.; Long, W.; Cui, Z.; Dong, P.; Tian, J.; Tian, H.; Meng, X. Visualization study on the ignition and diffusion combustion process of liquid phase ammonia spray ignited by diesel jet in a constant volume vessel. Energy Convers. Manag. 2023, 299, 117889. [Google Scholar] [CrossRef]
  13. Wang, N.; Li, T.; Zhou, X.; Li, S.; Chen, R. Characteristics of high-pressure ammonia spray combustion under diesel-like conditions. Appl. Therm. Eng. 2024, 257, 124335. [Google Scholar] [CrossRef]
  14. Krisman, A.; Hawkes, E.R.; Talei, M.; Bhagatwala, A.; Chen, J.H. Characterisation of two-stage ignition in diesel engine-relevant thermochemical conditions using direct numerical simulation. Combust. Flame 2016, 172, 326–341. [Google Scholar] [CrossRef]
  15. Demosthenous, E.; Borghesi, G.; Mastorakos, E.; Cant, R.S. Direct numerical simulations of premixed methane flame initiation by pilot n-heptane spray autoignition. Combust. Flame 2016, 163, 122–137. [Google Scholar] [CrossRef]
  16. Pope, S.B. Turbulent Flows; Cambridge University Press: Cambridge, UK, 2000. [Google Scholar]
  17. Squires, K. Point-particle methods for disperse flows. In Computational Methods for Multiphase Flow; Cambridge University Press: Cambridge, UK, 2007; pp. 282–319. [Google Scholar]
  18. Tian, T.; Song, C.; Wang, H.; Xu, C.; Luo, K.; Fan, J. The effects of turbulence on the flame structure and NO formation of ammonia turbulent premixed combustion at various equivalence ratios. Fuel 2023, 332, 126127. [Google Scholar] [CrossRef]
  19. Chai, W.S.; Bao, Y.; Jin, P.; Tang, G.; Zhou, L. A review on ammonia, ammonia-hydrogen and ammonia-methane fuels. Renew. Sustain. Energy Rev. 2021, 147, 111254. [Google Scholar] [CrossRef]
  20. Henry de Frahan, M.T.; Rood, J.S.; Day, M.S.; Sitaraman, H.; Yellapantula, S.; Perry, B.A.; Grout, R.W.; Almgren, A.; Zhang, W.; Bell, J.B.; et al. PeleC: An adaptive mesh refinement solver for compressible reacting flows. Int. J. High Perform. Comput. Appl. 2022, 37, 115–131. [Google Scholar] [CrossRef]
  21. Henry de Frahan, M.T.; Esclapez, L.; Rood, J.; Wimer, N.T.; Mullowney, P.; Perry, B.A.; Owen, L.; Sitaraman, H.; Yellapantula, S.; Hassanaly, M.; et al. The Pele Simulation Suite for Reacting Flows at Exascale. In Proceedings of the 2024 SIAM Conference on Parallel Processing for Scientific Computing (PP), Baltimore, MD, USA, 5–8 March 2024; pp. 13–25. [Google Scholar]
  22. Sitaraman, H.; Yellapantula, S.; Henry de Frahan, M.T.; Perry, B.; Rood, J.; Grout, R.; Day, M. Adaptive mesh based combustion simulations of direct fuel injection effects in a supersonic cavity flame-holder. Combust. Flame 2021, 232, 111531. [Google Scholar] [CrossRef]
  23. Owen, L.D.; Ge, W.; Rieth, M.; Arienti, M.; Esclapez, L.; S Soriano, B.; Mueller, M.E.; Day, M.; Sankaran, R.; Chen, J.H. PeleMP: The Multiphysics Solver for the Combustion Pele Adaptive Mesh Refinement Code Suite. J. Fluids Eng. 2023, 146, 041103. [Google Scholar] [CrossRef]
  24. Howarth, T.; Picciani, M.; Richardson, E.; Day, M.; Aspden, A. Direct numerical simulation of a high-pressure hydrogen micromix combustor: Flame structure and stabilisation mechanism. Combust. Flame 2024, 265, 113504. [Google Scholar] [CrossRef]
  25. Ramachandran, S.; Srinivasan, N.; Taneja, T.S.; Zhang, H.; Yang, S. Numerical study of turbulent non-premixed cool flames at high and supercritical pressures: Real gas effects and dual peak structure. Combust. Flame 2023, 249, 112626. [Google Scholar] [CrossRef]
  26. Faeth, G. Current status of droplet and liquid combustion. Prog. Energy Combust. Sci. 1977, 3, 191–224. [Google Scholar] [CrossRef]
  27. Schiller, L. A drag coefficient correlation. Zeit. Ver. Deutsch. Ing. 1933, 77, 318–320. [Google Scholar]
  28. Abramzon, B.; Sirignano, W. Droplet vaporization model for spray combustion calculations. Int. J. Heat Mass Transfer 1989, 32, 1605–1618. [Google Scholar] [CrossRef]
  29. Wang, H.; Luo, K.; Fan, J. Effects of turbulent intensity and droplet diameter on spray combustion using direct numerical simulation. Fuel 2014, 121, 311–318. [Google Scholar] [CrossRef]
  30. Tang, J.C.K.; Wang, H.; Bolla, M.; Wehrfritz, A.; Hawkes, R.E. A DNS evaluation of mixing and evaporation models for TPDF modelling of nonpremixed spray flames. Proc. Combust. Inst. 2019, 37, 3363–3372. [Google Scholar] [CrossRef]
  31. Ge, W.; Sankaran, R.; Chen, J.H. Development of a CPU/GPU portable software library for Lagrangian–Eulerian simulations of liquid sprays. Int. J. Multiphase Flow 2020, 128, 103293. [Google Scholar] [CrossRef]
  32. Bilger, R. The structure of turbulent nonpremixed flames. In Proceedings of the Symposium (International) on Combustion; Elsevier: Amsterdam, The Netherlands, 1989; Volume 22, pp. 475–488. [Google Scholar]
  33. Wang, H.; Luo, K.; Hawkes, E.R.; Chen, J.H.; Fan, J. Turbulence, evaporation and combustion interactions in n-heptane droplets under high pressure conditions using DNS. Combust. Flame 2021, 225, 417–427. [Google Scholar] [CrossRef]
  34. Jung, K.S.; Kim, S.O.; Lu, T.; Chung, S.H.; Lee, B.J.; Yoo, C.S. Differential diffusion effect on the stabilization characteristics of autoignited laminar lifted methane/hydrogen jet flames in heated coflow air. Combust. Flame 2018, 198, 305–319. [Google Scholar] [CrossRef]
  35. Pei, Y.; Hawkes, E.R.; Bolla, M.; Kook, S.; Goldin, G.M.; Yang, Y.; Pope, S.B.; Som, S. An analysis of the structure of an n-dodecane spray flame using TPDF modelling. Combust. Flame 2016, 168, 420–435. [Google Scholar] [CrossRef]
  36. Luo, K.; Pitsch, H.; Pai, M.; Desjardins, O. Direct numerical simulations and analysis of three-dimensional n-heptane spray flames in a model swirl combustor. Proc. Combust. Inst. 2011, 33, 2143–2152. [Google Scholar] [CrossRef]
  37. Zhang, J.; Chen, D.; Li, X.; Li, J.; Huang, H.; Kobayashi, N. Large eddy simulation of ammonia-diesel dual fuel spray combustion: Effects of ambient condition on ignition characteristics. Chem. Eng. J. 2024, 501, 157698. [Google Scholar] [CrossRef]
  38. Yamashita, H.; Shimada, M.; Takeno, T. A numerical study on flame stability at the transition point of jet diffusion flames. In Proceedings of the Symposium (International) on Combustion; Elsevier: Amsterdam, The Netherlands, 1996; Volume 26, pp. 27–34. [Google Scholar]
  39. Meng, Q.; Wang, H.; Chang, Z.; Cheng, M.; Huang, Z.; Luo, K.; Fan, J. Direct numerical simulation studies of spray jet flames in hot vitiated crossflow. Fuel 2025, 389, 134543. [Google Scholar] [CrossRef]
  40. Chen, G.; Wang, H.; Luo, K.; Fan, J. A DNS study of pulverized coal combustion in a hot turbulent environment: Effects of particle size, mass loading and preferential concentration. Combust. Flame 2023, 254, 112839. [Google Scholar] [CrossRef]
Figure 1. Schematic of computational domain.
Energies 18 02228 g001
Figure 2. Schematic of adaptive mesh refinement.
Energies 18 02228 g002
Figure 3. Instantaneous distributions of gaseous temperature, HRR, and OH mass fraction in a typical  x r  plane.
Energies 18 02228 g003
Figure 4. Instantaneous distributions of mass fractions of NO, N2O, and NH in a typical  x r  plane.
Energies 18 02228 g004
Figure 5. Scatter plots of gaseous temperature, HRR, and mass fraction of OH versus mixture fraction at various downstream locations. The red dashed line denotes the conditional mean. The blue dashed line represents the Z corresponding to the maximum HRR.
Energies 18 02228 g005
Figure 6. Scatter plots of mass fractions of NO, N2O, and NH versus Z at various locations. The red dashed line denotes the conditional mean. The blue dashed line represents the Z corresponding to the maximum HRR.
Energies 18 02228 g006
Figure 7. Instantaneous distribution of  χ  in a typical  x r  plane (left). The PDFs of the logarithm of  χ  at various locations (right).
Energies 18 02228 g007
Figure 8. Instantaneous distribution of the magnitude of vorticity in a typical  x r  plane. The evolution of conditional mean magnitude of vorticity conditionally along the axial direction.
Energies 18 02228 g008
Figure 9. Scatter plots of HRR versus  χ  at different downstream locations. The red dashed line is the mean quantity conditional on  χ .
Energies 18 02228 g009
Figure 10. The PDFs of the normalized logarithm of  χ  at various locations were compared with a Gaussian distribution.
Energies 18 02228 g010
Figure 11. Mean fields of gaseous temperature, HRR, and mass fractions of OH, NO, and N2O.
Energies 18 02228 g011
Figure 12. The quantitative mean results of gaseous temperature, HRR, and mass fractions, of OH and NO at various locations.
Energies 18 02228 g012
Figure 13. Distribution of ammonia particle diameter and temperature.
Energies 18 02228 g013
Figure 14. PDFs of the ammonia particle diameters at different downstream locations (left). Scatter plots of particle diameter versus particle temperature (right).
Energies 18 02228 g014
Figure 15. Instantaneous distribution of OH mass fraction within an  x r  plane (left). Instantaneous distributions of OH mass fraction at  x = 5 d  and  15 d  (right).
Energies 18 02228 g015
Figure 16. Species budget terms along typical lines.
Energies 18 02228 g016
Figure 17. Instantaneous distributions of HRR in a typical  x r  plane (left) and three  y z  planes (right). HRR for premixed combustion is indicated in red, while that for non-premixed combustion is shown in blue.
Energies 18 02228 g017
Figure 18. The ratio of the integrated heat release from premixed combustion to the total heat release.
Energies 18 02228 g018
Disclaimer/Publisher’s Note: The statements, opinions and data contained in all publications are solely those of the individual author(s) and contributor(s) and not of MDPI and/or the editor(s). MDPI and/or the editor(s) disclaim responsibility for any injury to people or property resulting from any ideas, methods, instructions or products referred to in the content.

