Article

Estimating the CO2 Impacts of Wind Energy in the Transition Towards Carbon-Neutral Energy Systems

1
Department of Energy and Mechanical Engineering, School of Engineering, Aalto University, P.O. Box 14400, 00076 AALTO Espoo, Finland
2
VTT Technical Research Centre of Finland Ltd., P.O. Box 1000, 02044 VTT Espoo, Finland
3
Department of Electric Energy, Norwegian University of Science and Technology (NTNU), 7491 Trondheim, Norway
*
Author to whom correspondence should be addressed.
Energies 2025, 18(6), 1548; https://doi.org/10.3390/en18061548
Submission received: 10 December 2024 / Revised: 14 February 2025 / Accepted: 25 February 2025 / Published: 20 March 2025
(This article belongs to the Special Issue Energy and Environmental Economics for a Sustainable Future)

Abstract

:
In this study, the CO2 reduction benefits of wind energy in the transition towards a carbon-neutral energy system are explored. The marginal benefits of wind energy in replacing CO2 emissions in electricity generation are gradually declining as carbon-emission-reduction targets are fulfilled. However, there is still the potential to reduce emissions by replacing fossil fuels in other energy sectors via electrification. Using the Finnish TIMES-VTT energy system model, this study simulates the impacts of different wind energy scenarios between 2030 and 2050, analyzing the effects of adding or removing 5 TWh of wind energy on power generation. Our findings indicate that the reduction benefits of wind energy vary over time, stemming initially from the generation of electricity but they are increasingly being driven by electrification through lowered electricity prices, and fuel switching, like the replacement of bioenergy in heating and fuel production. Between the years 2030 and 2050, an average marginal emission reduction of 180–270 gCO2eq/kWh was seen, rising to 250–320 gCO2eq/kWh if the impact on reduced carbon sinks through wood chip use was taken into account. Issues using marginal, substitution impacts from simulations are discussed; however, no straightforward methods for capturing the cumulative benefits of assets over their lifetime exist. In transitioning towards a net-zero-carbon energy system, other issues like costs, land use, and social aspects will become more relevant than emission substitution.

1. Introduction

Wind power, as other renewable energy generation, is built to provide emission-free electricity and to decrease dependence on fossil fuels. The greenhouse gas (GHG) impact of wind power depends, on one hand, on the emissions caused by building new wind power plants and on the avoided emissions achieved when operating the wind power plants, on the other.
The emissions caused by building new wind power plants can be estimated through life-cycle analysis. Life-cycle GHG emissions from recent wind power technology have shown low impacts of 5–7 gCO2eq/kWh [1,2]; for offshore wind in Germany, the range was 7–18 g CO2eq per kWh produced in 2030 and 5–17 g CO2eq per kWh in 2050 [3]. These emissions are small compared to the estimated substitution impact. Another approach that leads to a similar conclusion is the life-cycle efficiency with energy return(ed) on investment (EROI). Estimates on this basis have been on the order of 25, showing that the amount of electricity wind power produces over its lifetime is high compared to the energy required to build and use wind power [4].
The main source of avoided emissions through the use of wind power is based on replacing other fuels in electricity generation. The substitution impact of produced electricity is a complex topic. Previous studies have quantified the substitution benefits of wind power by assessing the electricity generation that has been replaced by wind energy. For power systems using several fuels and different unit types, this requires capturing low and high wind events, usually for at least one year’s worth of data.
There are several assessments made for different countries in the literature, with varying methods applied. Simple methods use a single emission coefficient for how much CO2 emissions wind electricity would save. More elaborate methods try to model how the emission impacts evolve over time. Holttinen et al. compared several assessments, showing impacts that varied from 489 to 847 gCO2/kWh for coal-dominated systems [5]. Aliprandi et al. estimated the impact of wind and solar energy in Italy to be 800 gCO2/kWh [6]. Anke et al. compared estimates for Germany in 2016–2017 with results that varied between 500 and 900 gCO2/kWh [7]. Yousefi et al. used a global average value of 640 gCO2/kWh for estimates up to the year 2030 [8]. In Finland, simplified methods for the year 2020 provided a replacement factor of 200–300 gCO2/kWh [9]. More elaborate methods have resulted in estimates of 620–700 gCO2/kWh for the year 2010, when there was still coal in the wider system of the Nordics and Germany [10], and 100–350 gCO2/kWh for the years 2010 and 2020, when gas and other lower emission technologies were replaced [9,10].
Simulations of power system operation including unit commitment and dispatch are concluded as giving the best estimates [5,7]. All methods are theoretical in that avoided emissions cannot be directly measured.
No studies so far have included a long-term perspective where climate policies would reduce the amount of fossil fuel usage and significantly reduce the estimated factors from electricity sector substitution effects. With decreasing power sector emissions, the marginal emission-based benefit of wind energy is also decreasing [11]. When a net-zero energy system has been reached, this means that power sector emissions will be close to zero, if not negative [12]. However, a transition to clean energy also entails decarbonization through the electrification of energy demand sectors, like transport, heating, and industry. It will become important to assess the level of increased demand, and the emissions reduced by electrification, instead of only power generation emissions. For example, wind power can replace imports or the domestic refining of gasoline and diesel through the increased electrification of the transport sector.
Quantifying the impact of wind power on future emission reductions requires moving from power sector to energy system level assessments. Including these other sectors also requires the inclusion of non-CO2 emissions that are a significant emission source, e.g., that which could be replaced through the electrification of transportation in the oil refining sector. The results are converted to CO2 equivalents for better comparisons: gCO2eq/kWh.
Another challenge that has already been pointed out for power sector-based analyses remains: how to take the exchange of electricity between neighboring countries and regions into account [5,13]. The trading of electricity disperses the impact of wind power over a larger market area. When new wind power is built in one country, emissions will often be reduced in several neighboring countries also, due to increased exports from the country that invested in wind power. Thus, it is a prerequisite to model impacts over the whole of the electricity market area [5].
According to the Paris Agreement, global emissions and carbon sinks should be in balance by the second half of the current century. The land use, land use change, and forestry (LULUCF) sector is an important carbon sink in many countries and should be enhanced. Wind power, although requiring quite large areas of land, directly impacts only a small part of an area with the installation of turbines and construction of access roads. Moreover, wind power can impact carbon sinks through either increasing or decreasing the energy use of biomass [14]. The overall impact depends on the quality and origin of the biomass, transport distances, and other changes in the biomass supply chain.
In practice, an emission impact assessment requires a large energy system model that can include all GHG emissions and capture the effects on electricity supply, other energy sectors, and neighboring countries due to the trade of electricity and other energy carriers. Comparing scenarios with varying amounts of wind power enables emission-reduction impacts to be assessed. This has been carried out previously for Finland [9,10], up until the year 2020 and for small amounts of wind energy in the system. This study conducted an analysis for the years 2030 to 2050, which is when the Finnish energy system is expected to reach close to net-zero emissions and is within the lifetime of wind power plants built in the 2020s.
For a future power and energy system, it is easier to estimate the impact of marginal change in wind power on emission reduction than the impact of the entire wind energy fleet [5]. Marginal change can be estimated from any existing scenario, but the impacts of the entire fleet need to be estimated by comparing it with a counterfactual scenario where the portfolio is optimized without wind power. This method is regularly applied; for example, using bioenergy with carbon capture and storage (BECCS) [15]. However, portfolios will differ not just in terms of CO2 emissions but also cost, making such a comparison challenging. Consequently, studies comparing whole future scenarios have mainly published estimates for the cost of CO2 emissions in future portfolios [16].
In this analysis, we concentrate on GHG abatement using wind power within the energy system. However, we do not cover emissions related to manufacturing, construction, and land use, as these emission categories seem to be significantly smaller, based on our literature review.
The methodology to estimate avoided GHG emissions in the energy system can be applied to other generation technologies such as solar PV and, in principle, could also be used for demand (e.g., electricity consumption in buildings) [17,18].
This study starts by describing the energy system simulation method used to estimate the impacts of wind power on emission reductions for a case study of Finland. The results for the years 2030–2050 are presented. The conclusions include a discussion on the possible ways of assessing the benefits of carbon reductions for the transition towards net-zero-carbon systems. The Finnish energy system is quickly decarbonizing and is highly connected to neighboring countries. The Finnish case study reviewed in this study provides new insights into the issues regarding the challenges of the presented emission-reduction methods.

2. Method Used for Assessing Emission-Reduction Impact

2.1. Requirements for the Modeling Framework

Simulating power systems with detailed information to establish a representation of how the electricity system operates will provide the most accurate information on the emission impacts of wind power [5,19]. With simulations, the impact of wind power can be isolated from all other changes in the system. Emission reduction is observed when comparing the system with added wind energy to the situation that would have prevailed in its absence.
Electrification is one of the main measures in carbon-neutral scenarios to reduce the emissions of demand sectors [20]. As sectoral integration increases the complexity of the system, a tool capable of modeling the cross-sectoral impacts of wind power is required. For a region that is part of a larger market area, emission reductions can also occur in the neighboring region where electricity is exported. This means that a larger area needs to be included in the simulations. This study makes an effort to assess the impacts of wind power on emission reductions using an energy system model that covers all energy sectors and Kyoto greenhouse gases for a Europe-wide area.
To assess the long-term impacts—including changes caused by wind power to other power system assets during the lifetime of wind power plants—the model simulates a pathway from 2020 to 2050 where investments are optimized in power and other sectors, respecting added national policy constraints. Simulation of the energy system is run for three cases: a reference scenario, with additional wind power, and with less wind power. Otherwise, the scenarios have consistent input data assumptions. However, in pathway modeling, the model can choose to invest in different technologies, given the forced change in the amount of wind power. After the investments, the energy system is operated with the least-cost principle for each year. For example, in power generation, the generating capacity is arranged into a merit order, from the lowest-cost generator to the highest-cost, and the least-cost arrangement of generators required to meet demand are dispatched, subject to a range of constraints such as system operation requirements, network constraints, and generator capabilities.

2.2. TIMES-VTT Energy System Model

The analysis covers the Finnish and European energy systems using the TIMES-VTT model. The model is developed on the foundation of the TIMES modeling framework and the ETSAP-TIAM global energy system model.
TIMES models operate based on a set of energy service demands across various sectors, including agriculture, residential, commercial, industry, and transport. These exogenous energy service demands can be constructed using outputs from general equilibrium models, which offer consistent drivers for each region and the global context, such as population, household numbers, GDP, and sector-specific outputs. The decoupling factors linking these drivers to useful energy-service demands reflect phenomena such as market saturation and suppression and are partially derived from empirical data. Economic growth is the primary driver for most of these final demands. Conversely, the demands for other commodities in the system—such as electricity, heat, various fuels, emission allowances, and CO2 geological storage services—are determined endogenously by the model, ensuring that supply–demand equilibrium adheres to resource and sustainability constraints.
The TIMES modeling framework is widely used for modeling various energy systems and its equations are extensively documented [20]. The ETSAP-TIAM global energy system model is an IEA-ETSAP modeling dataset for the TIMES modeling framework. The ETSAP-TIAM global model has been jointly developed by the ETSAP community. It models 15 regions, all energy use, and all GHG emissions up to 2100. Its documentation is available at https://iea-etsap.org/index.php/applications/global (accessed on 20 February 2025).
TIMES-VTT is developed from the ETSAP-TIAM model by adding each Nordic country individually to the global model and removing them from the aggregated European region. In addition, the Finnish capital region is modeled separately for improved details of district heating and urban modeling.
Similarly to the global model, TIMES-VTT includes all energy production and use and all GHG emissions. TIMES-VTT minimizes the total systems costs by optimizing the investments (2025–2050) and operations of the energy systems and trade (2020–2050) in each model region. When the user changes input data between modeled scenarios, the model solves a new optimum with new model results. Figure 1 summarizes the input data, modeled sectors, and main results.
The model and its assumptions have been documented in multiple studies [12,21,22,23,24].

2.3. Reference Scenario

The latest reference scenario for a national climate and energy strategy was used [24] as a starting point for our scenarios. The publication in [24] documents the reference scenario assumptions in more than 60 pages, and the section below provides a summary.
Finland has set a target of becoming carbon neutral by 2035 and carbon negative after that [25]. This requires significant investments in all of the energy end-use sectors, such as industry, heating, and transport. Electrification is one of the main measures to decarbonize these sectors. Finland will see a much higher share of electric vehicles, electric heating, and electrification of industrial processes in the 2030s compared with the current situation [24]. In addition to direct electrification, the amount of e-fuels, including hydrogen and its derivatives, is expected to increase slightly after 2030 and more after 2040, which will be facilitated by the targets of the transport sector, which could be fossil-free by 2045, according to a strategy by the Finnish Ministry of Transport [26]. The electricity demand increases due to the electrification of end-use sectors, such as the increasing number of EVs, heat pumps, and hydrogen for industry and e-fuels. The amount of available sustainable biomass will limit the technologies and solutions available for the transition [27].
The Finnish power system is quickly decarbonizing and is highly connected to neighboring countries. The fossil fuel power generation capacity has been replaced with domestic fossil-free generation, and partly also with electricity imports. The 3-year sliding average emission factor of electricity generation was only 70 gCO2/kWh in 2020–2022, which is a significant reduction from 222 gCO2/kWh in 2010 [28]. In 2022, Finnish companies started a new nuclear power plant, Olkiluoto 3, in full commercial capacity and have built a large amount of new wind power and fossil-free district heating capacity, significantly decreasing the CO2 factor based on 2020–2022 values [12]. The phase-out of coal in the power and heat generation system in 2029 is already stated in law and, in addition, the Government of Finland has set a target to halve the use of peat by 2030. The overall development greatly reduces the CO2 emissions of the direct domestic electricity sector and also reduces the direct emission-reduction impact of new wind power in Finland.
An important part of Finland’s carbon neutrality is the use of natural forest carbon sinks to compensate for the GHG emissions that are difficult and/or very expensive to abate. On the other hand, the largest renewable energy source is biomass due to forest industries, which produce bioenergy from side streams and forest residues. Recently, Finnish forests have turned from a net carbon sink to an emission source [29]. This indicates that utilizing domestic wood resources should be constrained in order to secure large forest carbon sinks for the future and increases, even more, the pressure to move from combustible fuels to electricity. Therefore, increased wind power investments can also have an indirect impact on the LULUCF sector and, thus, forest carbon sinks.
Other Nordic countries and Baltic countries are going through a similar transition, affecting electricity and energy trade between the countries. National grid operators are investing heavily in grid expansion and reinforcements within and between these countries. Fingrid has investment plans of up to EUR 3 billion from 2022 to 2031 [30].
For this study, we removed targets for carbon neutrality or a cap for emission levels from the existing reference scenario. However, the price of the carbon emission allowances is increasing to reach 80 EUR/tCO2 in 2050, resulting in considerable emission reductions due to technology development, existing legislation, and the decreasing competitiveness of fossil fuels in energy production.

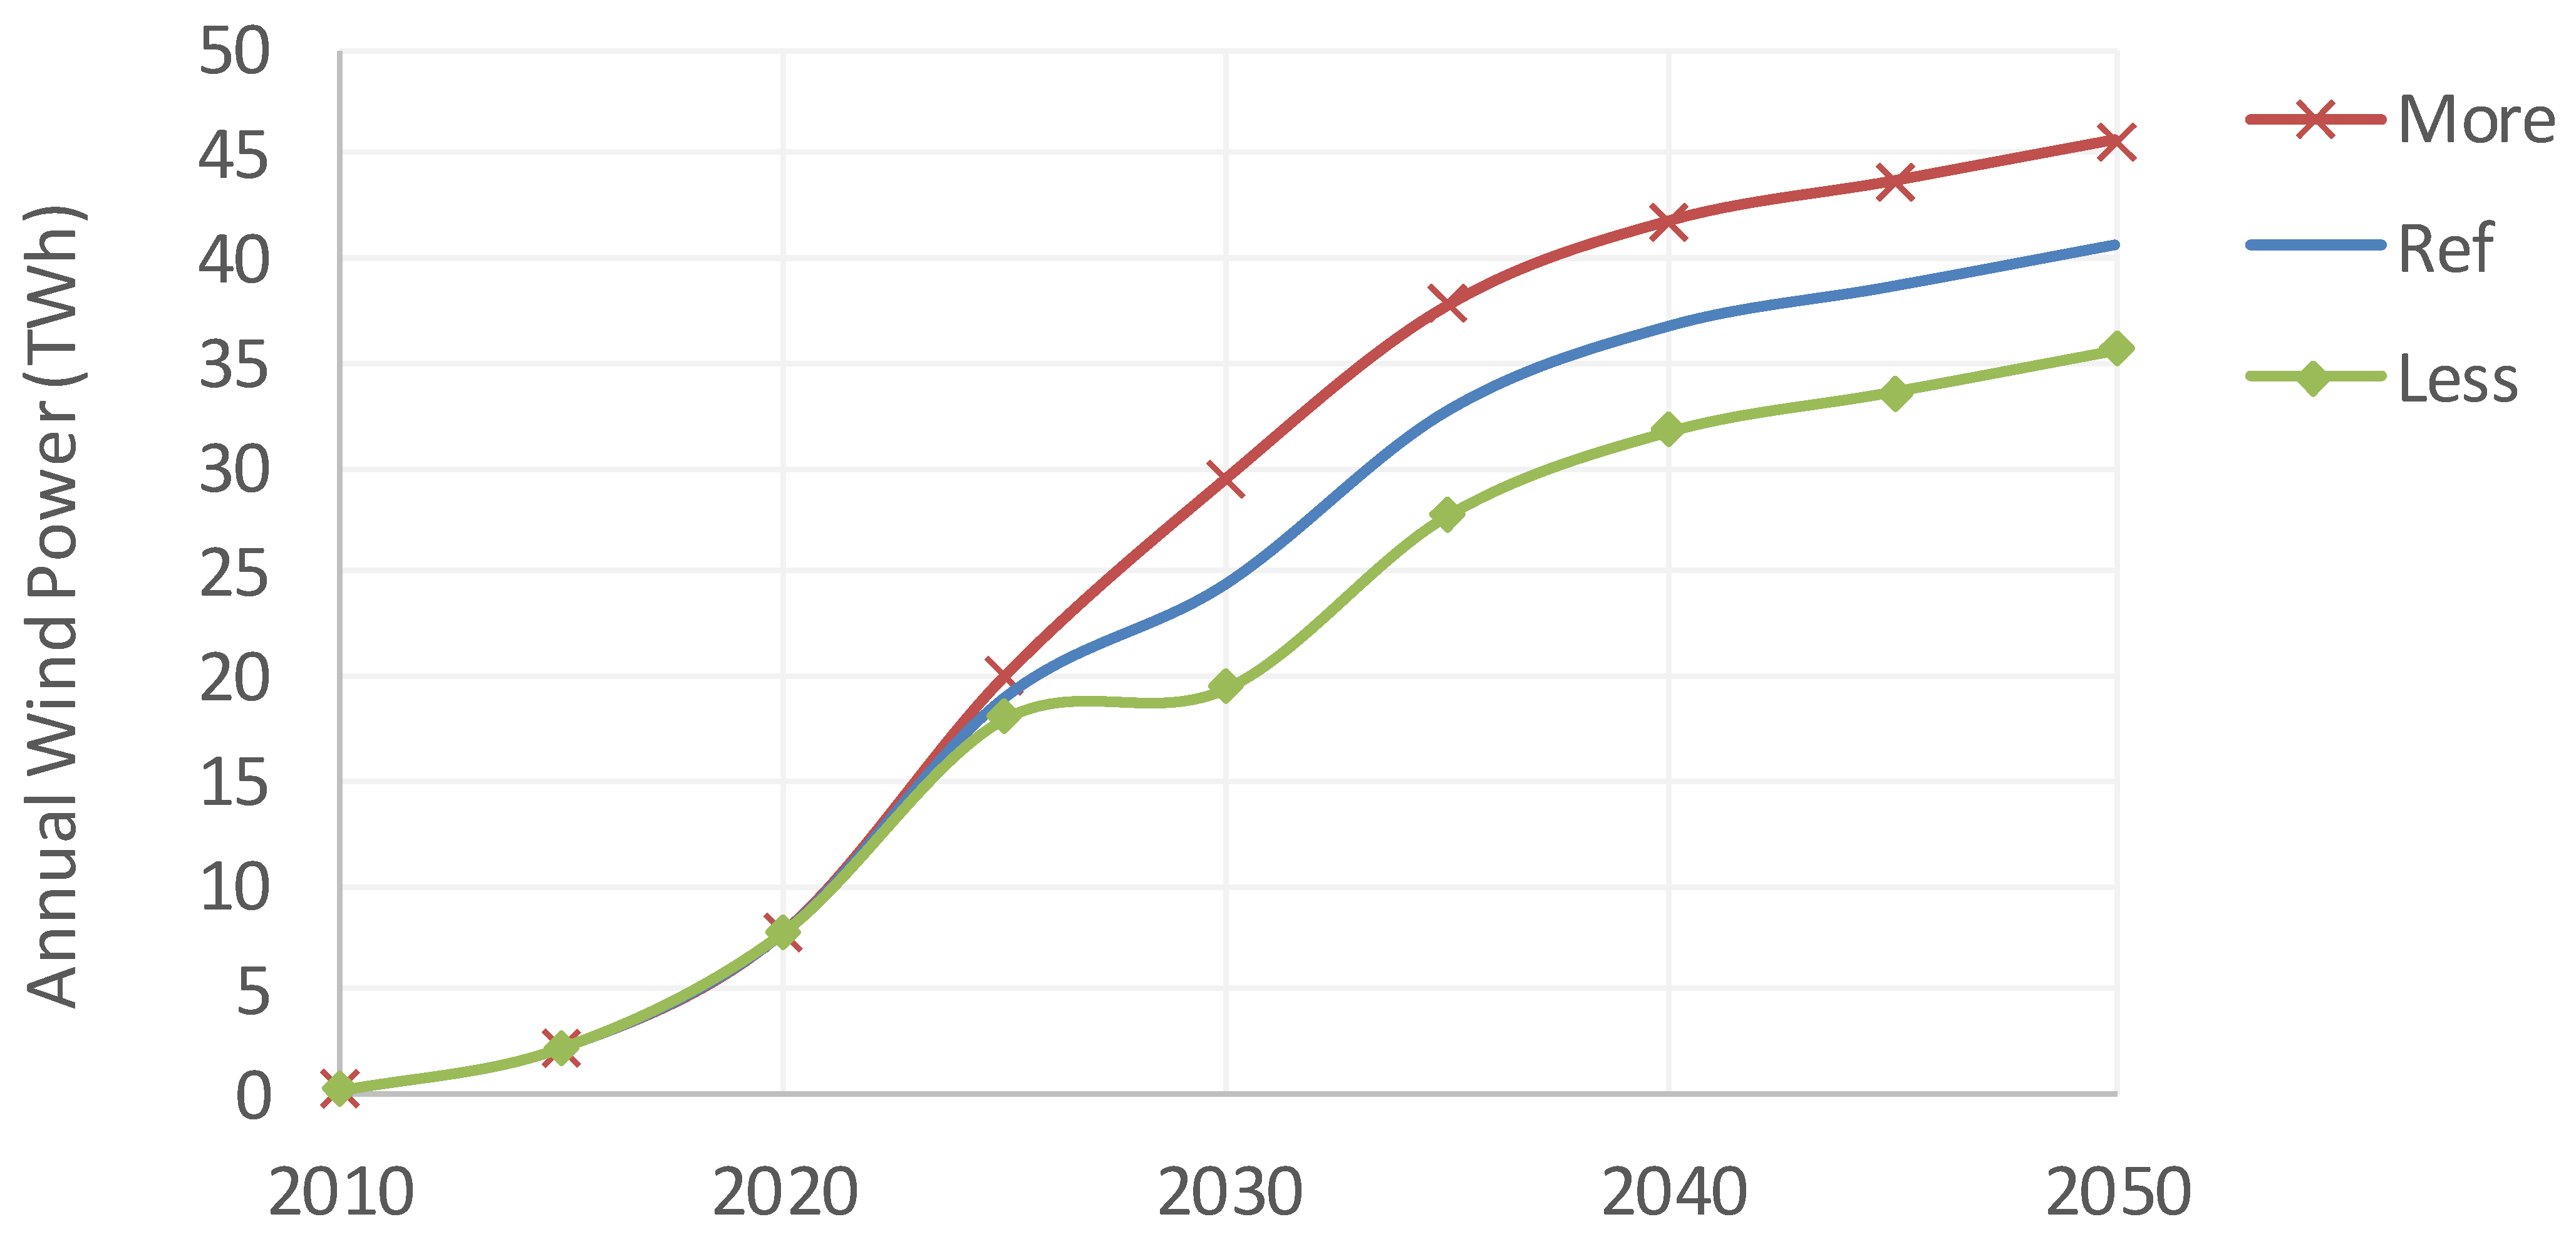
2.4. Wind Power Scenarios

We assessed the impacts of wind power by adding or removing 5 TWh/a wind from the reference scenario. The ‘More’ scenario that increases 5 TWh/a wind energy generation was modeled for 2030–2050 and the ‘Less’ scenario decreases the wind power generation by the same amount (Figure 2). In both cases, the model is fully rerun to reoptimize all investments and operations to a new optimum based on the forced addition of, or reduction in, wind power in Finland. The study setup is arranged symmetrically around the reference scenario to study the impact of faster and slower development compared with the baseline assumption. For sensitivity, the imports and exports were allowed to change when reducing wind energy in the ‘Less1’ scenario. This approach allows more detailed research on the significance of the modeled electricity trade. In the ‘More’ and ‘Less2’ scenarios, the annual electricity exchange was fixed to the reference scenario, forcing the impact of wind energy to be observed mostly in Finland.
Increasing wind energy would decrease the electricity price and reduce emissions compared with the reference scenario by replacing other generation. Decreasing wind power should reverse the impacts. In addition, the system is expected to also reveal indirect changes due to varying prices of electricity by impacting the investment pathways of different sectors. The change in all GHG emissions due to added or reduced 5 TWh/a wind energy can be translated to gCO2/kWh.

3. Results from the Case Study: Finland, Years 2030–2050

3.1. Wind Power’s Impacts on the Energy System

The results for the electricity sector in Finland are shown in Figure 3 for the reference scenario and the ‘More’ (+5 TWh/a) and ‘Less’ (−5 TWh/a) wind scenarios. The studied change corresponds to approximately 5% of the Finnish electricity demand and, thus, has a relatively small impact when considering the overall electricity supply. A marginal addition of wind power leads to marginal changes in the overall investments. The impacts of modeled wind power scenarios can be observed more clearly when only the changes are drawn (Figure 4).
There is inertia in how fast new technologies can be deployed due to the assumed lifetime of existing infrastructures; moreover, the model discussed in this study is subject to existing policy until 2030. Many energy sector investments have long lead times, and development up to 2025 is largely based on current projections. For example, the increase in electric cars follows projected development for 2025 in the scenario assumptions and the amount of new power production is well known for the next few years. For these reasons, we focus on impacts from 2030 onwards, even if some small changes are visible in 2025 already.
Even if the net exchange of electricity is fixed at a yearly level for the ‘More’ and ‘Less2’ scenarios, there are still some changes compared with the reference scenario in the rest of Europe since the electricity trade is allowed to change as long as the annual balance equals the reference scenario.
Before 2040, the model partly electrifies end-use sectors and partly replaces other generation with wind energy. The increase and decrease in wind energy will decrease and increase electricity prices, respectively. The changes in electricity price impact the cost efficiency of direct electricity use in dual-fuel systems, such as heating, as well as electrification technologies, such as EVs and heat pumps, thus increasing or decreasing the electricity demand. Table 1 summarizes the analyzed impacts of wind energy.
In general, the final use of energy remains close to the reference level in the ‘More’ scenario, while it slightly decreases in the ‘Less’ scenarios. Table 2 summarizes the modeled changes in electricity use.
The modeled results are not symmetrical for an increase and decrease of 5 TWh of wind (‘More’ and ‘Less2’ scenarios). The most significant cause of asymmetrical results is that the reference scenario has relatively mild electrification, as can be observed from the small increase in demand over the years. Adding wind power enables more electrification; however, there is not much room to decrease electrification when decreasing wind. In addition, the reference scenario included a defined minimum market share of electric vehicles, which limited how much the model could reduce electrification.
For the ‘Less’ scenarios, it was easier to replace the missing wind generation in the first years by increasing gas and bioenergy use in energy production; this is why we see a more common electricity replacement effect for wind energy in the ‘Less’ scenarios. As gas was not used much in the reference scenarios, the addition of wind energy could not replace it. The amount of 5 TWh/a, about 5% of the total electricity demand, seems to be significant enough to cause asymmetrical changes in the model runs.

3.2. Emission Impacts of Wind Energy

For the modeled scenarios, additional wind power had three main impacts: replacing thermal fuels in power generation in Finland and the rest of Europe, increasing the rate of electrification through marginally lowered electricity prices, and replacing bioenergy in Finland in heating and fuel production.
Figure 5 separately shows the GHG impact for Finland (Fin-Direct) and the rest of Europe (RoEur). On top of these model results, we added an estimate of the impact of wood chips on the carbon sinks. This is a rough estimate calculating a ‘penalty’ for comparing two situations: either wood chips are burned and release their carbon content directly or the source wood is left in forests, where small-diameter stem wood continues to grow and branches and stumps decay. Liski et al. estimated a range of 20–109 gCO2eq/MJ for this emission impact in Finland [31]. The range was due to differences in forest chip source wood, geographical location, and the studied emissions’ time frame. We used an average factor of 55 gCO2eq/MJ as the TIMES model results do not provide sufficient detail in terms of different types of forest chips or the location of the source wood within the country.
The ‘More’ scenario shows declining GHG emission reductions until 2040 (Figure 6), but after 2040 there is a clear increase in the benefits of wind power in terms of reducing emissions. This is the impact of additional wind power enabling more and earlier electrification of end-use sectors than the reference scenario (Table 2). In the short term (up to 2030), about 25% of the direct impact on emissions in Finland is attributable to the energy sector (power and district heat), about 45% to the industry sector, about 28% to the transport sector, and only a few percent to the residential and commercial sectors. In the long term, by 2050, the impact on the Finnish power and heat sector emissions gradually decrease to zero as there are no fossil fuels remaining in the power and heat generation system. In the long term, direct emission reductions in Finland are split between industry (56%), transport (42%), and other sectors. Towards 2050, the emission impact of increasing wind power is more notable in the rest of Europe (−0.8 MtCO2eq) than in Finland (−0.4 MtCO2eq). Despite the equal annual electricity trading volumes, the model can reduce emissions in other countries by exporting more when fossil fuel-based generation would have been used in the rest of Europe and importing when those regions have excess renewables. Increasing wind power also reduces the use of wood biomass, resulting in an estimated increase in carbon sinks by 0.6–0.88 MtCO2eq/a during the period 2030–2050.
In the ‘Less2’ scenario, a reduction of 5 TWh/a wind power in Finland provides an expected result of a declining impact for both Finnish emissions and the rest of Europe (RoEur) emissions from 2030 to 2050. However, in the ‘Less2’ scenario, the direct impacts are distributed quite differently than in the ‘More’ scenario. In the ‘Less2’ scenario, direct emissions in Finland present a higher share of the impact throughout the horizon, due to the need for compensating the reduced wind power domestically by additional power generation from bioenergy, PV, and fossil fuels.
The replacement impact of fossil fuels in power generation decreased when moving towards 2050 as the power system was decarbonized already in the reference scenario. After 2030, the main impact was due to the electrification of end-use sectors and replacing liquid biofuels with hydrogen. The emission reduction for different years for the marginal increase of 5 TWh/a wind energy (in parenthesis is the impact of saving wood chips on carbon sinks) is presented in Table 3. The impact on carbon sinks can be observed in the figure, especially for the ‘Less2’ scenario in 2030–2035 when wind power replaces wood chips in power and heat generation, as well as for all ‘More’ scenario results where electricity replaces biomass in fuel conversion (from bioliquids to e-fuels) and the transport sector (from biofuel to EVs), as explained in Table 2.
As the marginal impact of wind power is quite different for the years in the scenarios—first mainly from replacing other generations and then moving to increased electrification—the average marginal impact values were also calculated (Table 4). By simply summing up the avoided emissions for all years modeled and dividing the result by the wind energy, we obtain a theoretical number considering how the marginal benefit changes during the years when the wind power plant is operational.
The results presented in this article provide the following average impact for the years 2030–2050: 180–270 gCO2eq/kWh. This range rises to 250–320 gCO2eq/kWh if the estimated impact of wood chips on carbon sinks is considered.

4. Discussion

Wind and solar energy have historically replaced fossil fuel generation on a nearly one-to-one basis, leading to high emission reductions per kWh [5]. Using a substitution effect—that is, capturing the decrease in emissions resulting from wind energy replacing other means of generation—has been the only method in use so far. This situation will change towards 2050 as the share of fossil fuels in power systems decreases and sectoral integration advances. The electrification of demand from other energy sectors will continue to allow a substitution effect for wind power to be assessed, but finally, in a net-zero-carbon energy system, there are no emissions to replace. Once we only have clean fuels and generation options to choose from, we cannot use the ‘replacement impact’ anymore. Some value could still be credited for non-emission technologies, but other criteria for comparison would need to be considered, such as costs, land use, other environmental impacts, and social acceptance.
Modeling the impact of 5 TWh/a wind generation on the Finnish energy system on a pathway to net-zero emissions provides varied results. A discussion on which approach to use (marginal or cumulative impact), as well as impacts from the modeling setup and assumptions, are provided in the following section.

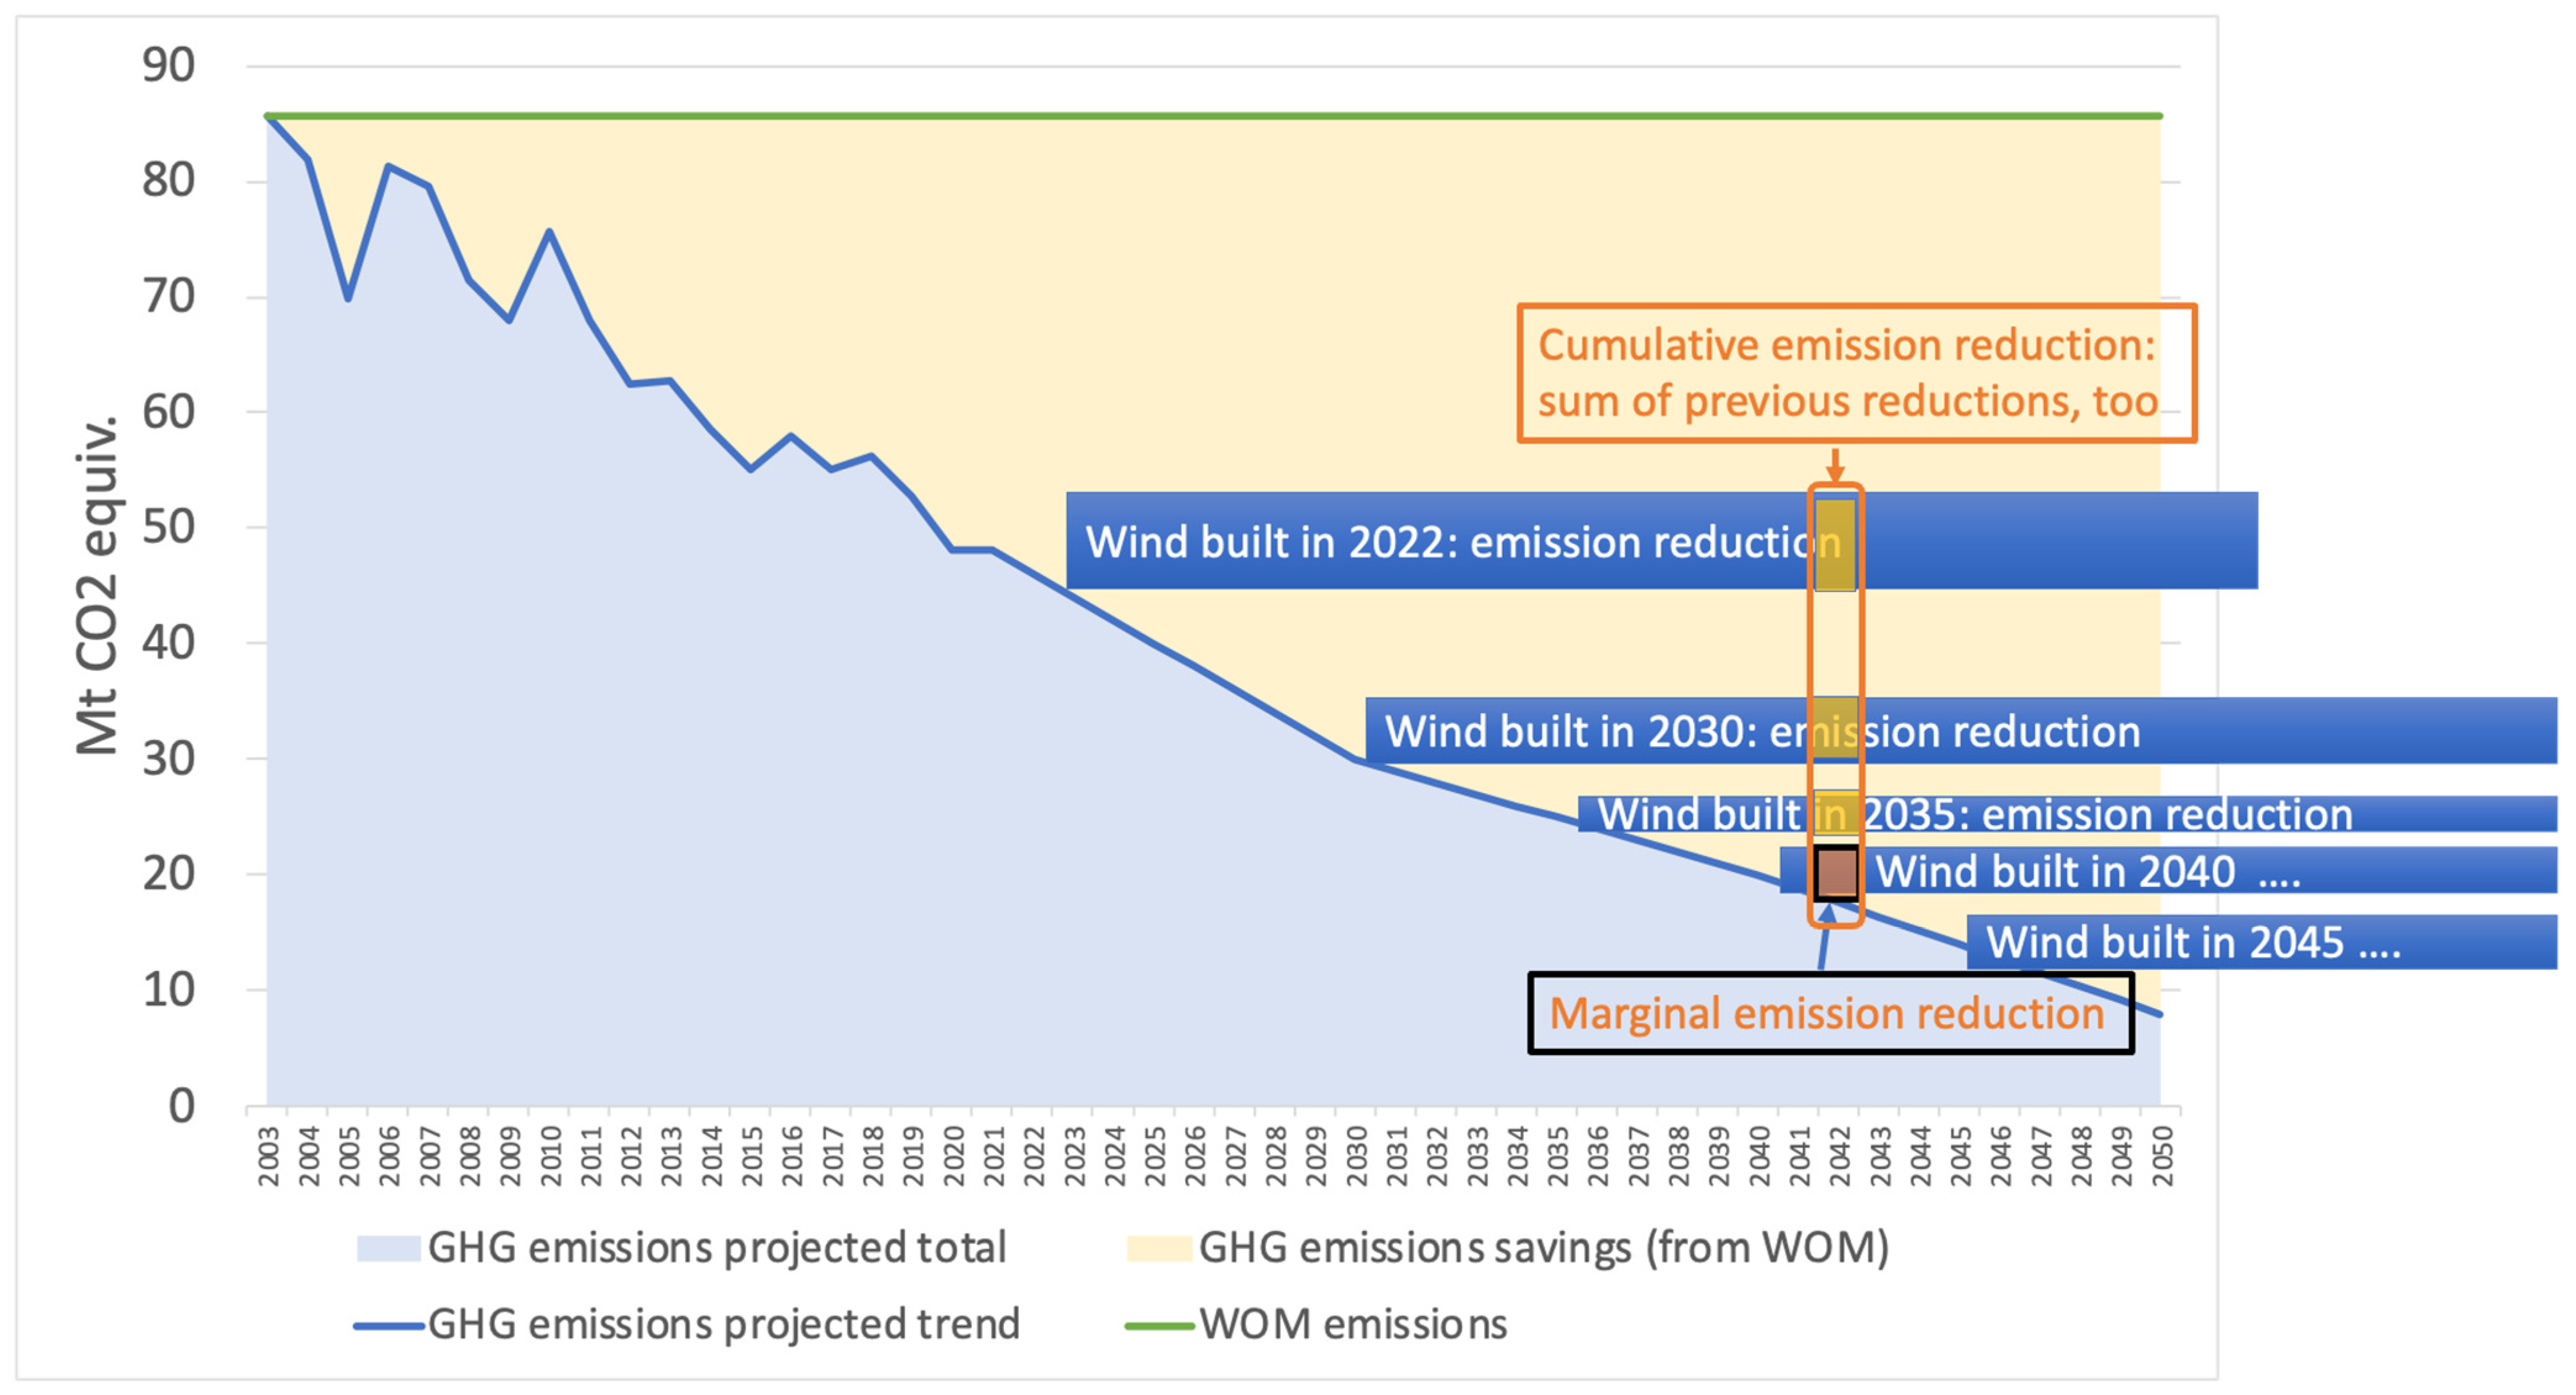
4.1. Marginal or Cumulative Benefit of Wind Energy?

Using the marginal CO2 impact for wind power that is deployed in this and other studies will not capture the whole benefit of the built wind power fleet. All added wind power will provide benefits throughout the lifetime of the assets, and even longer including repowering. Some previous results studying the marginal benefits of wind energy for a 0–10% share of wind energy in the power system demand can also be considered as a cumulative impact for the first amounts of wind power.
In this study, the reference of comparison for each year includes considerable ‘base case’ wind energy (Figure 2). Using a more modest reference scenario would allow more marginal increases, and a more ambitious reference regarding wind power deployment would have a very small impact on the marginal increase in wind energy.
One way of estimating the benefits for the whole lifetime of assets is to use the marginal benefit for the year when the wind power is built, for example, 300 gCO2eq/kWh, and assume that benefit will continue for the lifetime of the plant (Figure 7). However, as determined from the results of the simulations in this study, this could be quite different for future years, from 20 to 500 gCO2/kWh, depending on the year. Moreover, it is not simply a decreasing figure as years pass since electrification of other demand sectors may start at a later stage leading to higher emission impacts for later years.
Estimating a cumulative impact for both the whole lifetime and the entire wind power fleet would be another, rather different approach. This would capture how wind power is working on the cumulative or integral of the emission-reduction line, not marginal. The results would be different, especially in cases where the CO2 impact changes over the years. This approach would mean using a so-called without measures (WOM) scenario [32] as a theoretical reference, where emission-reduction impact could still be achieved in the future, generally for non-emitting sources. However, constructing meaningful scenarios to compare with a WOM scenario—in which many changes in the energy sector, including electrification, occur over decades—makes a transparent comparison challenging and allocation of benefits to one technology very difficult. Wind power is a central technology in most low-emission scenarios and alternative scenarios without wind power are difficult to find or become purely theoretical.
Figure 7. Conceptual graphic on the cumulative benefit of wind power generation over its lifetime to emission reductions, taking a without measures (WOM) scenario as a comparison. Finland’s total CO2 emissions realized up until 2021 from statistics in [33] and estimated via policy in [12] from 2022 to 2050 are shown in the blue curve (greenhouse gas emissions projected trend; this is without carbon sinks). Emission reduction from the peak year 2003 is shaded in orange. Wind power plant (lifetime about 30 years) emission-reduction impact when starting operation is depicted in blue boxes; this impact depends on the marginal reductions in the energy system of that year (these are not in scale, but show that there will be differences for different years for the same amount of wind energy). Marginal impact for the year 2024 is in black rectangles and cumulative sum of previous years’ rectangles is in orange.
Energies 18 01548 g007
The question of emission impacts becomes even more complicated after reaching close to zero emissions in the power system from the year 2050 onwards. Clean generation is required even when we have reached the net-zero carbon-emission targets and the energy system no longer has any emissions to be replaced. It can be observed in Figure 7 that all clean generation will build up to achieve and maintain emissions at a low level. However, when the plant is dismantled and a new plant is put up, would the benefit continue to be at, for example, 300 gCO2eq/kWh, or at a marginal impact close to zero in 2050–2060?
Using marginal impact figures also puts wind power plants built in different years at a different benefit level (Figure 7). It could be argued that an average benefit would be a better approach. Capturing cumulative benefits over the lifetime of assets would be the best approach; however, there are no straightforward methods to achieve this. Marginal change can be estimated from any existing scenario, but the impacts of the entire fleet would have to be estimated compared with a completely different counterfactual scenario without wind power. Using a without measures (WOM) scenario that would include fossil fuel use in future energy systems becomes completely theoretical.
There is also value in timing as emission reductions before the year 2030 have a cumulative impact on CO2 in the atmosphere. Due to the urgency in mitigating measures, initiating the transition phase towards net zero now versus later also has benefits. Models can calculate a discount for emissions reached at a later stage; however, how large this factor should be and how it impacts the results requires more research.

4.2. Impact of Modeling Approach

Estimates based on power and energy system modeling have fewer pitfalls in methodology than estimates based on historical data for systems undergoing large transitions. With simulations, future scenarios can be assessed while keeping all other changes in the power system constant and only observing impacts due to wind energy. However, there are still many assumptions in the modeling that impact the results. Generally, the complexity of electricity systems poses allocation challenges [5]. More complex energy system models include a large range of additional constraints affecting the results [14] as sector integration opens the solution space and adds boundaries and constraints for the simulations. End-use sectors might have user-given constraints on capacities, maximum or minimum shares of certain energies, or other assumed policies such as subsidies that are typical in the energy sector in many countries. These should be aligned between scenarios as much as possible.
Allocating benefits to a single technology in a large energy system where all measures are jointly used is challenging. This can be observed when changing the order of measures reducing emissions: whether wind power is the first or the last modeled measure will impact the results. The marginal impact method used here will tackle this challenge at least to some extent; estimating a cumulative impact with all changes in the energy system would demonstrate even further challenges in allocation.
The impact of timing is also important in the energy system transition: in the urgency of tackling climate change, not building wind power now can make reaching the targets more costly, more difficult, and slower. However, the value of adding renewables and electrifying as quickly as possible cannot be observed in the simulation results.
The selected model tool is effective in representing all energy sectors, providing long-term estimates that allow investments to occur due to increased build-out of wind energy, and taking into account all GHG emissions as CO2 equivalents. However, details of the electricity system for potential impacts of variability in wind are not included—this might result in somewhat overestimating the benefits of wind energy. On the other hand, the selection of reference cases with already considerable wind power will reduce the marginal benefits of wind energy. In our scenario for enabling the exchange of electricity, we show that limiting the geographic scope to Finland will also reduce wind energy benefits.
The results are also impacted by the assumptions on technology development, electricity, and CO2 prices. The impacts of these assumptions are more difficult to quantify; however, we assume they are limited. A more detailed discussion is provided below for each of these assumptions.
Impact of chosen reference scenario: The choice of benchmark as a comparison has a significant impact on results. This is the main reason for divergent methodologies and results concerning CO2 reductions due to any power source [5], which has been noted as a general issue for all power system impacts of wind energy [34]. There is no fully objective way to establish the comparative scenarios; therefore, at least the assumptions need to be clearly laid out [5].
The reference scenario used in this study already has a considerable amount of wind power, and the impacts are studied for a marginal change to this scenario. Marginal impacts are decreasing faster than cumulative impacts.
Moreover, the assumptions on the technology development of generation and electrification technologies will impact the results. For example, a more optimistic assumption on cost reductions for technologies would impact how fast emissions decrease in the reference scenario and have an impact on the estimated emission-reduction factor of wind power.
A modeling technical viewpoint of the reference scenario is the amount of measures the modeler chooses to keep fixed as in the reference scenario and how much the model is allowed to reoptimize the system when adding wind power.
Impact of electricity price sensitivity: Price sensitivity assumptions make a difference, as wind power will impact the use of energy through electricity market prices. When the user changes input data, the model is rerun and it reoptimizes all capacities and how those are used. Thus, forcing wind power above the previous cost-optimal solutions leads to decreasing annual electricity prices that can lead to increased use of electricity in dual-fuel systems (e.g., in heating, hybrid vehicles, and industry). Lower prices can also change the amounts of invested capacities, further impacting the rate of electrification.
As Finland is part of the Nordic markets with strong connections to central Europe, the price impact of ±5 TWh/a (~5% of annual demand in Finland) is much smaller than in countries with weaker interconnectors. These smaller changes are large enough to change operations in heating, transport, and industry; however, some electrification measures, such as EVs or H2 in the steel industry, would require much higher changes in prices as the main barrier is the investment cost instead of the operation cost.
Some sectors, such as the residential sector, could be thought to have a low-price elasticity in real life, but heat pump sales have more than doubled in Finland during high prices in 2021 and 2022 [35,36]. Longer periods of high prices would have a significant impact on the future pathway of heating technologies in the Finnish residential sector.
Impact of modeled policy measures: Modeling certain policy measures can have a significant impact on results, as shown in this study with the modeled minimum share of electric vehicles. This assumption turned the results of the ‘More’ and ‘Less’ scenarios asymmetrical as the model was not allowed to reduce the number of EVs beyond this policy limit.
It is important to note that the chosen reference scenario was established without emission caps but allowed wind energy to replace other generations based on merit order as in the power markets. If the reference scenario was defined with emission cap constraints, adding wind power would not have any impact on emissions because the model would be forced to follow the emission cap constraint (under the condition that the cost-optimal solution meets the emission constraint). Reaching a state where no increase in clean generation will impact the amount of total emissions (set as a cap in constraints during the simulation) also implies that all clean options are in use and competing against each other through costs; moreover, if wind energy was not built in the studied country, it would be built somewhere else globally, or some other low carbon technologies would be built.
Impact of CO2 price: At first, the price of CO2 will impact what fossil-fired generation is on the margin (gas CCGT, coal, or OCGT). With higher rates of decarbonization, fossil units might be running only for certain hours, but the CO2 price impact can still be shown through the storage value of hydropower. However, the impact does reduce over time when the emission factor of electricity (gCO2eq/kWh) and overall energy use (gCO2eq/kWh) decreases.
The impact of CO2 emission prices is shown by the authors of [14]: the highest value for emission reduction by wind power was found at 25 EUR/tCO2. Increasing the emission price to 40 EUR/tCO2 reduced the emission benefits from wind power, both in Finland and the Nordic countries.
In the scenarios presented in this study, the CO2 price was set to 80 EUR/tCO2 for the year 2050, which is sufficient to make fossil fuel use very small and the model has 30 years to adapt to higher CO2 prices. The impact of additional wind power on top of the low fossil fuel reference scenarios was small. However, the set CO2 price was not sufficient to make more dramatic electrification of industrial processes occur, for example, steel mills converted to hydrogen, electric heated rotary kilns, and the breakthrough of high-temperature heat pumps.
Impact of geographical scope: The limited geographical coverage of Finland leads to scenarios that overlook the real characteristics of power markets as emission reductions also occur in the neighboring region where electricity is exported. The results show a difference in the scenarios where electricity exchange with neighboring areas was allowed. In Finland, fossil generation was only replaced in 2030, after which there is a very small amount of fossil generation left to be replaced in electricity generation. Other Nordic countries also have very low CO2 factors in electricity generation, but the rest of Europe has more fossil fuels in the power generation mix. Moreover, wind power investments in Finland can replace generation with higher CO2 factors from 2030 to 2040, taking into account the European power markets.
The modeled scenarios did not include the recent developments between Russia and EU countries in cross-border trade of electricity and gas. Thus, the prices follow a historical development and do not reflect the situation in 2022. This highlights one challenge particularly related to large and complex models: updates and adjustments to sudden changes are very laborious. However, the modeled scenarios still show the challenges in the methodology and present pathways where the situation would mostly normalize before 2030.
Impacts on investments: Quantifying the long-term impacts of wind energy on emissions means capturing the changes caused by wind power to other power system assets during the lifetime of wind power plants. Wind power, as with any generation, will influence the profitability of other forms of generation and demand. Comparing results for one year will usually only capture the operational impacts of wind energy. Using a model tool, such as TIMES, to show a pathway towards the year 2050, will also include long-term impacts on power and other sectors.
In a continuous linear model, such as TIMES, a marginal change in input will lead to changes in both operations and investments. Some other models do include mixed-integer variables (e.g., to force unit investments to be multiples of certain specific sizes—lump investments). A mixed-integer approach can lead to a situation where a marginal change in wind power generation would mostly impact the operation but have an even smaller impact on investments.
Impact of inertia in energy system transition: The energy sector changes slowly because of the lifetime of existing capacity. Many energy sector investments have typically long planning, permitting, and building phases. Policies and taxation also change slowly. Typically, energy system models have many existing policies modeled, posing constraints on capacity change rates in the short term, and fewer technology options in the first model years. For example, the shift to electric cars will take time, and for the year 2025, sales have increased but the cumulative vehicle stock requires more time to electrify. In addition, models with perfect foresight can delay action as the model is able to promptly carry out the necessary actions when required. We started our analyses of wind power scenarios from the year 2030 because it is a target year for many existing policies and developments; the model has a larger degree of freedom after that year.
Also, modeled impacts, such as high prices, can only last a few years in real life. This time period might be short enough that only some investors have time to make the investment decision, whereas the model would fully consider the change based on the cost-optimal solution.
Impact of modeled emissions: In addition to direct CO2 emissions from the burning of fuels to generate power and heat, larger system analysis should consider many other emission categories, especially non-CO2 emissions from fuel upstream and fuel use, the CO2 emission impact of biomass consumption in the land use sector, and GHG emissions of end-use sectors. Including or not including some of these emissions can have a significant impact on results and should be considered when modeling the entire energy system. The TIMES model takes into account all GHG emissions, and they are included in the results of this article as CO2 equivalents (showing results as gCO2eq/kWh).
Impact of modeled sectors: The detailed level in the modeling of end-use sectors is a critical model feature in long-term analysis because, after the electricity sector, additional wind power can reduce emissions in the other sectors through electrification. The more technologies and abatement options the model has, the larger the number of possible interactions included in the modeling. However, typically, additional details in end-use sectors may force the modeler to include fewer details in the power sector due to computational limitations. Thus, dispatch models provide more detailed results in the short term, as most of the impacts are in the electricity sector, but a larger energy system model can better cover the electrification and sectoral integration.
Impact of model time resolution: In the modeled scenarios, there was no chronological order in the modeled time steps for each year, which means that the impact of variability and uncertainty of wind energy was captured in much less detail than when using chronological modeling. Another question is how much the aggregation of time steps influences CO2 emissions. While no direct literature on the impact of temporal simplifications on CO2 emissions was found, they can be expected to correlate with the change in the mix of generated electricity. In a study by Poncelet et al., TIMES model results had an error of 3–10% for the mix of generated electricity compared with a dispatch model run with the same portfolio and full chronology with hourly resolution [37]. The error increased as the share of variable renewables increased. The result was produced for systems with 25–45% variable renewables. In this article, wind and solar energy shares are higher and the results could deviate further.
Impact of power system modeling detail: Simulation results are sensitive to assumptions on generator performance and demand flexibility. A detailed model would be required to capture additional efficiency losses in electricity generation due to ramping and start-ups, which means incorporating the impact of forecasting uncertainty and variability in wind energy. Wind power suppresses prices during many hours of the year and decreases the profitability of baseload power plants; however, it can improve the profitability of more flexible assets [38,39].
The TIMES model neglects emissions from fossil-fueled power plant ramping and low-load operation. However, the authors of [40,41,42] show that the cycling of thermal generators to provide more balancing due to added wind energy has a very small impact on emissions.

5. Conclusions

Estimating CO2 emission reductions generated through the use of wind energy is usually conducted by assessing the substitution impact on electricity generation. Previously used simple methods and dispatch simulations have yielded values such as 550–700 gCO2eq/kWh for the years 2000–2009 and 100–300 gCO2eq/kWh for the year 2020 in Finland. The benefits of wind energy in replacing CO2 emissions in electricity generation are declining as countries strive to fulfill their carbon emission-reduction targets towards net-zero emissions. However, to transform energy systems to carbon neutral—including the electrification of industrial, residential, and transport sectors—there is still high emission-reduction potential in replacing fossil fuels in these end-use sectors and fuel processing. To assess the impacts for the years 2030–2050, and larger shares of wind energy in electricity generation, large energy system models (integrated assessment models) need to be used to better implement the coupling of energy sectors with the electricity system.
Based on modeled scenarios using the TIMES-VTT model, marginal changes in CO2 emissions with wind power were observed through three main routes: replacing thermal fuels in power generation in Finland and the rest of Europe; increasing the rate of electrification through lower electricity prices; and replacing bioenergy in Finland in heating and fuel production. After 2030, wind power enabled more end-use energy to be electrified and, thus, the replacement of bioenergy (wood chips) and fossil fuels in electricity generation, fuel processing, and heating. There are also significant emission-reduction benefits through exports as most European countries have their net-zero targets set later than Finland, aiming for 2035.
For the modeled scenarios for the years 2030–2050, an average marginal impact of 180–270 gCO2eq/kWh was shown, rising to 250–320 gCO2eq/kWh if the impact of wood chips on carbon sinks was taken into account. The reference scenario already included considerable wind energy (35–40 TWh/a), and these results are for a marginal change of 5 TWh/a wind energy (about 5% of electricity demand).
The results are from a marginal impact for each of the years studied: 2030, 2035, 2040, 2045, and 2050. Comparing these results with previously published results, they provide a smaller benefit to wind energy generation in Finland: In 2004, the values for the CO2 impacts studied for the year 2010 were 620–700 gCO2/kWh (Nordic countries and Germany with simulation tool EMPS replacing mainly coal) and 300 gCO2/kWh (Finland with TIMES, replacing gas, not coal) [10]. These were also calculated as marginal impacts, from a starting point and reference of no wind energy, so they can also represent the cumulative impact for the first TWhs in the Nordic countries.
The marginal impact of adding or reducing an amount of 5 TWh/a wind energy was not symmetrical, which was mostly due to somewhat modest electrification in the reference scenario. Adding wind energy increased demand through electrification, whereas demand would not reduce when reducing wind energy as there was no extra electrification demand in the reference scenario. Similarly, reducing wind energy resulted in replacements in the electricity generation side, even increasing gas for the first years; however, adding wind power could not replace any fossil fuels as they were not used in the reference scenario.
Based on the studied pathway designed for Finland, the following general trends and conclusions were identified:
Wind-induced CO2 reductions in electricity generation provide a higher impact for 2030–2040 but reduce towards 0 for the period of 2040–2050 (for Finland, this was observed especially when including export possibilities for the rest of Europe, but also for the first years, 2030 and 2035, when limiting exports in the ‘Less’ scenarios).
Including options for the electrification of all of the energy end-use sectors increases the impact of the emissions reduction achieved using wind energy (for Finland, this was observed when adding wind energy for the years 2045–2050 in the ‘More’ scenario).
We observed the impact of natural carbon sinks when wind energy replaces wood chips, with the estimated penalty used in the calculations (this was observed mainly for Finland, limiting exports, as shown in parenthesis in Table 3 and Table 4).
There is no clear answer to the question of which emission benefits should be employed for wind energy in cases where the emissions of electricity generation are low. The calculated replacement factor highly depends on the methods used, selected reference scenarios, and included energy and emission sectors. Some of our scenarios could argue for a higher level, such as 400–500 gCO2eq/kWh, when fossil fuels are still used in either generation or in end-use sectors to be replaced. Some scenarios could argue for a marginal impact of 200–300 gCO2eq/kWh. However, as our simulations show, the marginal emission impacts of wind power will differ for different years, and the reference case for comparison as well as assumptions on the rate (and cost) of electrification and amount of wind power in the reference scenario will affect the results.
When reaching net-zero targets (typically, by 2050 in Europe), there are no or very small amounts of emissions to replace, depending on whether or not there is bioenergy with carbon capture and storage in the system. Then, other criteria such as costs, land use, other environmental impacts, and social acceptance become more relevant.
The entire wind power fleet will provide benefits throughout its lifetime, and even longer when including repowering. Capturing these benefits would mean estimating a cumulative impact, instead of marginal impacts, for certain years. However, many other changes in the power and energy system take place in the model simulations, making it a difficult task to allocate the share of total emission reductions to wind energy. Finally, any emission impacts estimating the substitution effect will become irrelevant in a net-zero-carbon future. Even in the transition period, emission reduction for a specific technology does not have high relevance, as it is more important to understand how to achieve the desired carbon budgets in a cost-effective and robust manner while respecting other societal goals, such as fairness, and other environmental and land use impacts. In moving towards a net-zero or even carbon-negative future in 2050, it will become more relevant to consider a wider range of economic, environmental, and social impacts in model calculations, rather than only emission reductions. Therefore, considering biodiversity or social aspects is a topic for future research.

Author Contributions

Conceptualization, H.H. and T.J.L.; methodology, H.H., T.J.L. and J.K.; software A.L.; validation, A.L. and T.J.L.; formal analysis, A.L.; investigation, T.J.L. and H.H.; data curation, A.L.; writing—original draft preparation, H.H., T.J.L., T.K. and A.L.; writing—review and editing, J.K. and M.K.; visualization, A.L., T.J.L. and H.H. All authors have read and agreed to the published version of the manuscript.

Funding

This work is part of Finnish-funded public research via the LandUseZero project, 4400T-2110. This study was funded by the Ministry of Agriculture and Forestry in Finland. M.K. also supported this study with Norwegian research funding from NTNU.

Data Availability Statement

The datasets presented in this article are not readily available because the model and database used is not open source (TIMES-VTT part of IEA ETSAP).

Conflicts of Interest

Authors Tomi J. Lindroos, Antti Lehtilä, Tiina Koljonen, and Juha Kiviluoma were employed by the VTT Technical Research Centre of Finland Ltd. The remaining authors declare that the research was conducted in the absence of any commercial or financial relationships that could be construed as a potential conflict of interest.

References

  1. Chipindula, J.; Botlaguduru, V.S.; Du, H.; Kommalapati, R.R.; Huque, Z. Life Cycle Environmental Impact of Onshore and Offshore Wind Farms in Texas. Sustainability 2018, 10, 2022. [Google Scholar] [CrossRef]
  2. Vestas. Life Cycle Assessment of Electricity Production from an Onshore V136-4.2 MW Wind. Plant. Vestas Wind Systems A/S, Denmark. 22 March 2022. 133p. Available online: https://www.vestas.com/content/dam/vestas-com/global/en/sustainability/reports-and-ratings/lcas/LCA%20of%20Electricity%20Production%20from%20an%20onshore%20V136-4.2MW%20Wind%20Plant_Final.pdf.coredownload.inline.pdf (accessed on 20 February 2025).
  3. Benitez, A.; Wulf, C.; Steubing, B.; Geldermann, J. Scenario-based LCA for assessing the future environmental impacts of wind offshore energy: An exemplary analysis for a 9.5-MW wind turbine in Germany. Energy Sustain. Soc. 2024, 14, 49. [Google Scholar] [CrossRef]
  4. Kubiszewski, I.; Cleveland, C.J.; Endres, P.K. Meta-analysis of net energy return for wind power systems. Renew. Energy 2010, 35, 218–225. [Google Scholar] [CrossRef]
  5. Holttinen, H.; Kiviluoma, J.; McCann, J.; Clancy, M.; Milligan, M.; Pineda, I.; Eriksen, P.B.; Orths, A.; Wolfgang, O. Reduction of CO2 emissions due to wind energy—Methods and issues in estimating operational emission reductions. In Proceedings of the 2015 IEEE Power & Energy Society General Meeting, Denver, CO, USA, 26–30 July 2015; pp. 1–5, ISBN 978-1-4673-8040-9. [Google Scholar] [CrossRef]
  6. Aliprandi, F.; Stoppato, A.; Mirandola, A. Estimating CO2 emissions reduction from renewable energy use in Italy. Renew. Energy 2016, 96, 220–232. [Google Scholar] [CrossRef]
  7. Anke, C.-P.; Schönheit, D.; Möst, D. Measuring the Impact of Renewable Energy Sources on Power Sector Carbon Emissions in Germany—A Methodological Inquiry. Z. Energiewirtsch. 2021, 45, 1–23. [Google Scholar] [CrossRef]
  8. Yousefi, H.; Abbaspour, A.; Seraj, H.R. Worldwide Development of Wind Energy and CO2 Emission Reduction. Environ. Energy Econ. Res. 2019, 3, 1–9. [Google Scholar] [CrossRef]
  9. Lindroos, T.J.; Monni, S.; Honkatukia, J.; Soimakallio, S.; Savolainen, I. Estimations of Greenhouse Reductions and Economical Effects of Renewable Energy in Finland; VTT Technology 11; VTT Technical Research Centre of Finland: Espoo, Finland, 2012; 121p. + app. 6p. [Google Scholar]
  10. Holttinen, H.; Tuhkanen, S. The effect of wind power on CO2 abatement in the Nordic Countries. Energy Policy 2004, 32, 1639–1652. [Google Scholar] [CrossRef]
  11. SysFlex D2.5. 2020. Financial Implications of High Levels of Renewables on the European Power System. EU-SysFlex H2020 Project. Available online: https://eu-sysflex.com/documents/ (accessed on 21 February 2025).
  12. Koljonen, T.; Lehtilä, A.; Honkatukia, J.; Markkanen, J. Pääministeri Sanna Marinin Hallituksen Ilmasto-ja Energiapoliittisten Toimien Vaikutusarviot: Hiilineutraali Suomi 2035 (HIISI)-Jatkoselvitys; VTT Technology No. 402; VTT Technical Research Centre of Finland: Espoo, Finland, 2022. [Google Scholar] [CrossRef]
  13. Bahramian, P.; Jenkins, G.P.; Milne, F. The Displacement Impacts of Wind Power Electricity Generation: Costly Lessons from Ontario. Energy Policy 2021, 152, 112211. [Google Scholar] [CrossRef]
  14. Lindroos, T.J.; Mäki, E.; Koponen, K.; Hannula, I.; Kiviluoma, J.; Raitila, J. Replacing fossil fuels with bioenergy in district heating—Comparison of technology options. Energy 2021, 231, 120799. [Google Scholar] [CrossRef]
  15. Tatarewicz, I.; Lewarski, M.; Skwierz, S.; Krupin, V.; Jeszke, R.; Pyrka, M.; Szczepański, K.; Sekuła, M. The Role of BECCS in Achieving Climate Neutrality in the European Union. Energies 2021, 14, 7842. [Google Scholar] [CrossRef]
  16. AIGS. All Island Grid Study, Eirgrid and SONI. 2008. Available online: https://cms.eirgrid.ie/sites/default/files/publications/11-AllIslandGridStudyStudyOverviewJan08.pdf (accessed on 20 February 2025).
  17. Backe, S.; Korpås, M.; Tomasgard, A. Heat and electric vehicle flexibility in the European power system: A case study of Norwegian energy communities. Int. J. Electr. Power Energy Syst. 2021, 125, 106479. [Google Scholar] [CrossRef]
  18. Haaland, P.K.N.H. Impact of CO2 Compensation Methods on the Sizing of PV Panels in Zero Emission Neighbourhoods. Master’s Thesis, Norwegian University of Science and Technology, Trondheim, Norway, 2022. [Google Scholar]
  19. Kartha, S.; Lazarus, M.; Bosi, M. Baseline recommendations for greenhouse gas mitigation projects in the electric power sector. Energy Policy 2004, 32, 545–566. [Google Scholar] [CrossRef]
  20. Loulou, R.; Goldstein, G.; Kanudia, A.; Lehtilä, A.; Remme, U. Documentation for the TIMES Model. 2016. Available online: https://iea-etsap.org/docs/Documentation_for_the_TIMES_Model-Part-I_July-2016.pdf (accessed on 21 February 2025).
  21. Pursiheimo, E.; Holttinen, H.; Koljonen, T. Path towards 100% renewable energy future and feasibility of power-to-gas technology in Nordic Countries. IET Renew. Power Gener. 2017, 11, 1695–1706. [Google Scholar] [CrossRef]
  22. Lehtilä, A.; Koljonen, T. Pathways to Post-fossil Economy in a Well Below 2 °C World. In Limiting Global Warming to Well Below 2 °C: Energy System Modelling and Policy Development; Lecture Notes in Energy; Springer: Cham, Switzerland, 2018; pp. 33–49. [Google Scholar] [CrossRef]
  23. Koljonen, T.; Aakkula, J.; Honkatukia, J.; Soimakallio, S.; Haakana, M.; Hirvelä, H.; Kilpeläinen, H.; Kärkkäinen, L.; Laitila, J.; Lehtilä, A.; et al. Hiilineutraali Suomi 2035: Skenaariot ja Vaikutusarviot; VTT Technology No. 366; VTT Technical Research Centre of Finland: Espoo, Finland, 2020. [Google Scholar] [CrossRef]
  24. Koljonen, T.; Silfver, T.; Soimakallio, S.; Koreneff, G.; Lehtilä, A.; Markkanen, J.; Vainio, T.; Aakkula, J.; Haakana, M.; Hirvelä, H.; et al. Baseline Scenarios for Energy and Climate Policy Package Towards Zero Emissions; Publications of the Government´s Analysis, Assessment and Research Activities 2024:26; Publisher Prime Minister’s Office: Helsinki, Finland, 2024. Available online: http://urn.fi/URN:ISBN:978-952-383-219-0 (accessed on 20 February 2025).
  25. Finlex. Finnish Climate Law. 2022. Available online: https://www.finlex.fi/fi/laki/alkup/2022/20220423 (accessed on 21 February 2025). (In Finnish and Swedish only).
  26. LVM Ministry of Transport and Communications (2022) Fossiilittoman Liikenteen Tiekartta—Valtioneuvoston Periaatepäätös Kotimaan Liikenteen Kasvihuonekaasujen Vähentämisestä. Available online: https://api.hankeikkuna.fi/asiakirjat/d99a3ae3-b7f9-49df-afd2-c8f2efd3dc1d/e4e97efb-1f23-4c22-bdf1-f1fc27809030/LAUSUNTOPYYNTO_20210115060016.PDF (accessed on 21 February 2025).
  27. Anttila, P.; Nivala, V.; Salminen, O.; Hurskainen, M.; Kärki, J.; Lindroos, T.J.; Asikainen, A. Regional balance of forest chip supply and demand in Finland in 2030. Silva Fennica 2018, 52, 9902. [Google Scholar] [CrossRef]
  28. Statistics Finland. 14qt—Emission Coefficients for Electricity Generation and Share of Renewable Electricity Generation, 2000–2023. 2024. Available online: https://pxweb2.stat.fi/PxWeb/pxweb/en/StatFin/StatFin__ehk/statfin_ehk_pxt_14qt.px/ (accessed on 21 February 2025).
  29. Statistics Finland. Emissions in the Energy Sector Continued to Decrease in 2023—The Land Use Sector Was a Significant Source of Emissions. 2025. Available online: https://stat.fi/en/publication/clmpwhj34iw9n0cuntl6ngb08 (accessed on 21 February 2025).
  30. Fingrid. Investments in the Main Grid Rise to EUR 3 Billion. Available online: https://www.fingrid.fi/en/news/news/2022/investments-in-the-main-grid-rise-to-eur-3-billion/ (accessed on 21 February 2025).
  31. Liski, J.; Repo, A.; Känkänen, R.; Vanhala, P.; Seppälä, J.; Antikainen, R.; Grönroos, J.; Karvosenoja, N.; Lähtinen, K.; Leskinen, P.; et al. Metsäbiomassan Energiakäytön Ilmastovaikutukset Suomessa. Suomen Ympäristö 5/2011. Available online: http://hdl.handle.net/10138/37051 (accessed on 20 February 2025).
  32. European Environment Agency. Guidelines for Reporting on Policies and Measures by Member States under Regulation (EU) No 525/2013 (EU Monitoring Mechanism Regulation). 2019. Available online: https://cdr.eionet.europa.eu/help/mmr/MMR%20Article%2013%20Reporting%20Manual%20PaMs%20(2018).pdf (accessed on 21 February 2025).
  33. Statistics Finland. Energy Supply and Consumption. 2025. Available online: https://www.stat.fi/tilasto/ehk (accessed on 21 February 2025).
  34. Müller, S.; Holttinen, H.; Taibi, E.; Smith, J.C.; Fraile, D.; Vrana, T.-K. System Integration Costs—A Useful Concept That Is COMPLICATED to Quantify? In Proceedings of the 17th International Workshop on Large-Scale Integration of Wind Power into Power Systems as well as on Transmission Networks for Offshore Wind Power Plants, WIW 2018, Stockholm, Sweden, 17–19 October 2018; Available online: https://iea-wind.org/task25/t25-publications/ (accessed on 20 February 2025).
  35. SULPU. Suomen Lämpöpumppuyhdistys. 2022. Finnish Heat Pump Statistics 2021. Available online: https://www.sulpu.fi/wp-content/uploads/2022/01/SULPU-lampopumpputilasto-2021-kuvaajat.pdf (accessed on 21 February 2025).
  36. SULPU. Suomen Lämpöpumppuyhdistys. 2022. Lämpöpumppumyynnissä Hurja 80% Kasvu. Available online: https://www.sulpu.fi/lampopumppumyynnissa-hurja-80-kasvu/ (accessed on 21 February 2025).
  37. Poncelet, K.; Delarue, E.; Six, D.; Duerinck, J.; D’haeseleer, W. Impact of the level of temporal and operational detail in energy-system planning models. Appl. Energy 2016, 162, 631–643. [Google Scholar] [CrossRef]
  38. Hirth, L. The market value of variable renewables: The effect of solar wind power variability on their relative price. Energy Econ. 2013, 38, 218–236. [Google Scholar] [CrossRef]
  39. Waite, M.; Modi, V. Impact of deep wind power penetration on variability at load centers. Appl. Energy 2019, 235, 1048–1060. [Google Scholar] [CrossRef]
  40. Denny, E.; O’Malley, M. Wind generation, power system operation, and emissions reduction. IEEE Trans. Power Syst. 2006, 21, 341–347. [Google Scholar] [CrossRef]
  41. Lew, D.; Brinkman, G.; Ibanez, E.; Florita, A.; Heaney, M.; Hodge, B.M.; Hummon, M.; Stark, G.; King, J.; Lefton, S.A.; et al. The Western Wind and Solar Integration Study Phase 2, NREL Tech. Report NREL/TP-5500-55588. 2013. Available online: https://www.nrel.gov/docs/fy13osti/55588.pdf (accessed on 21 February 2025).
  42. Kaffine, D.T.; McBee, B.J.; Ericson, S.J. Intermittency and CO2 Reductions from Wind Energy. Energy J. 2020, 41, 23–54. [Google Scholar] [CrossRef]
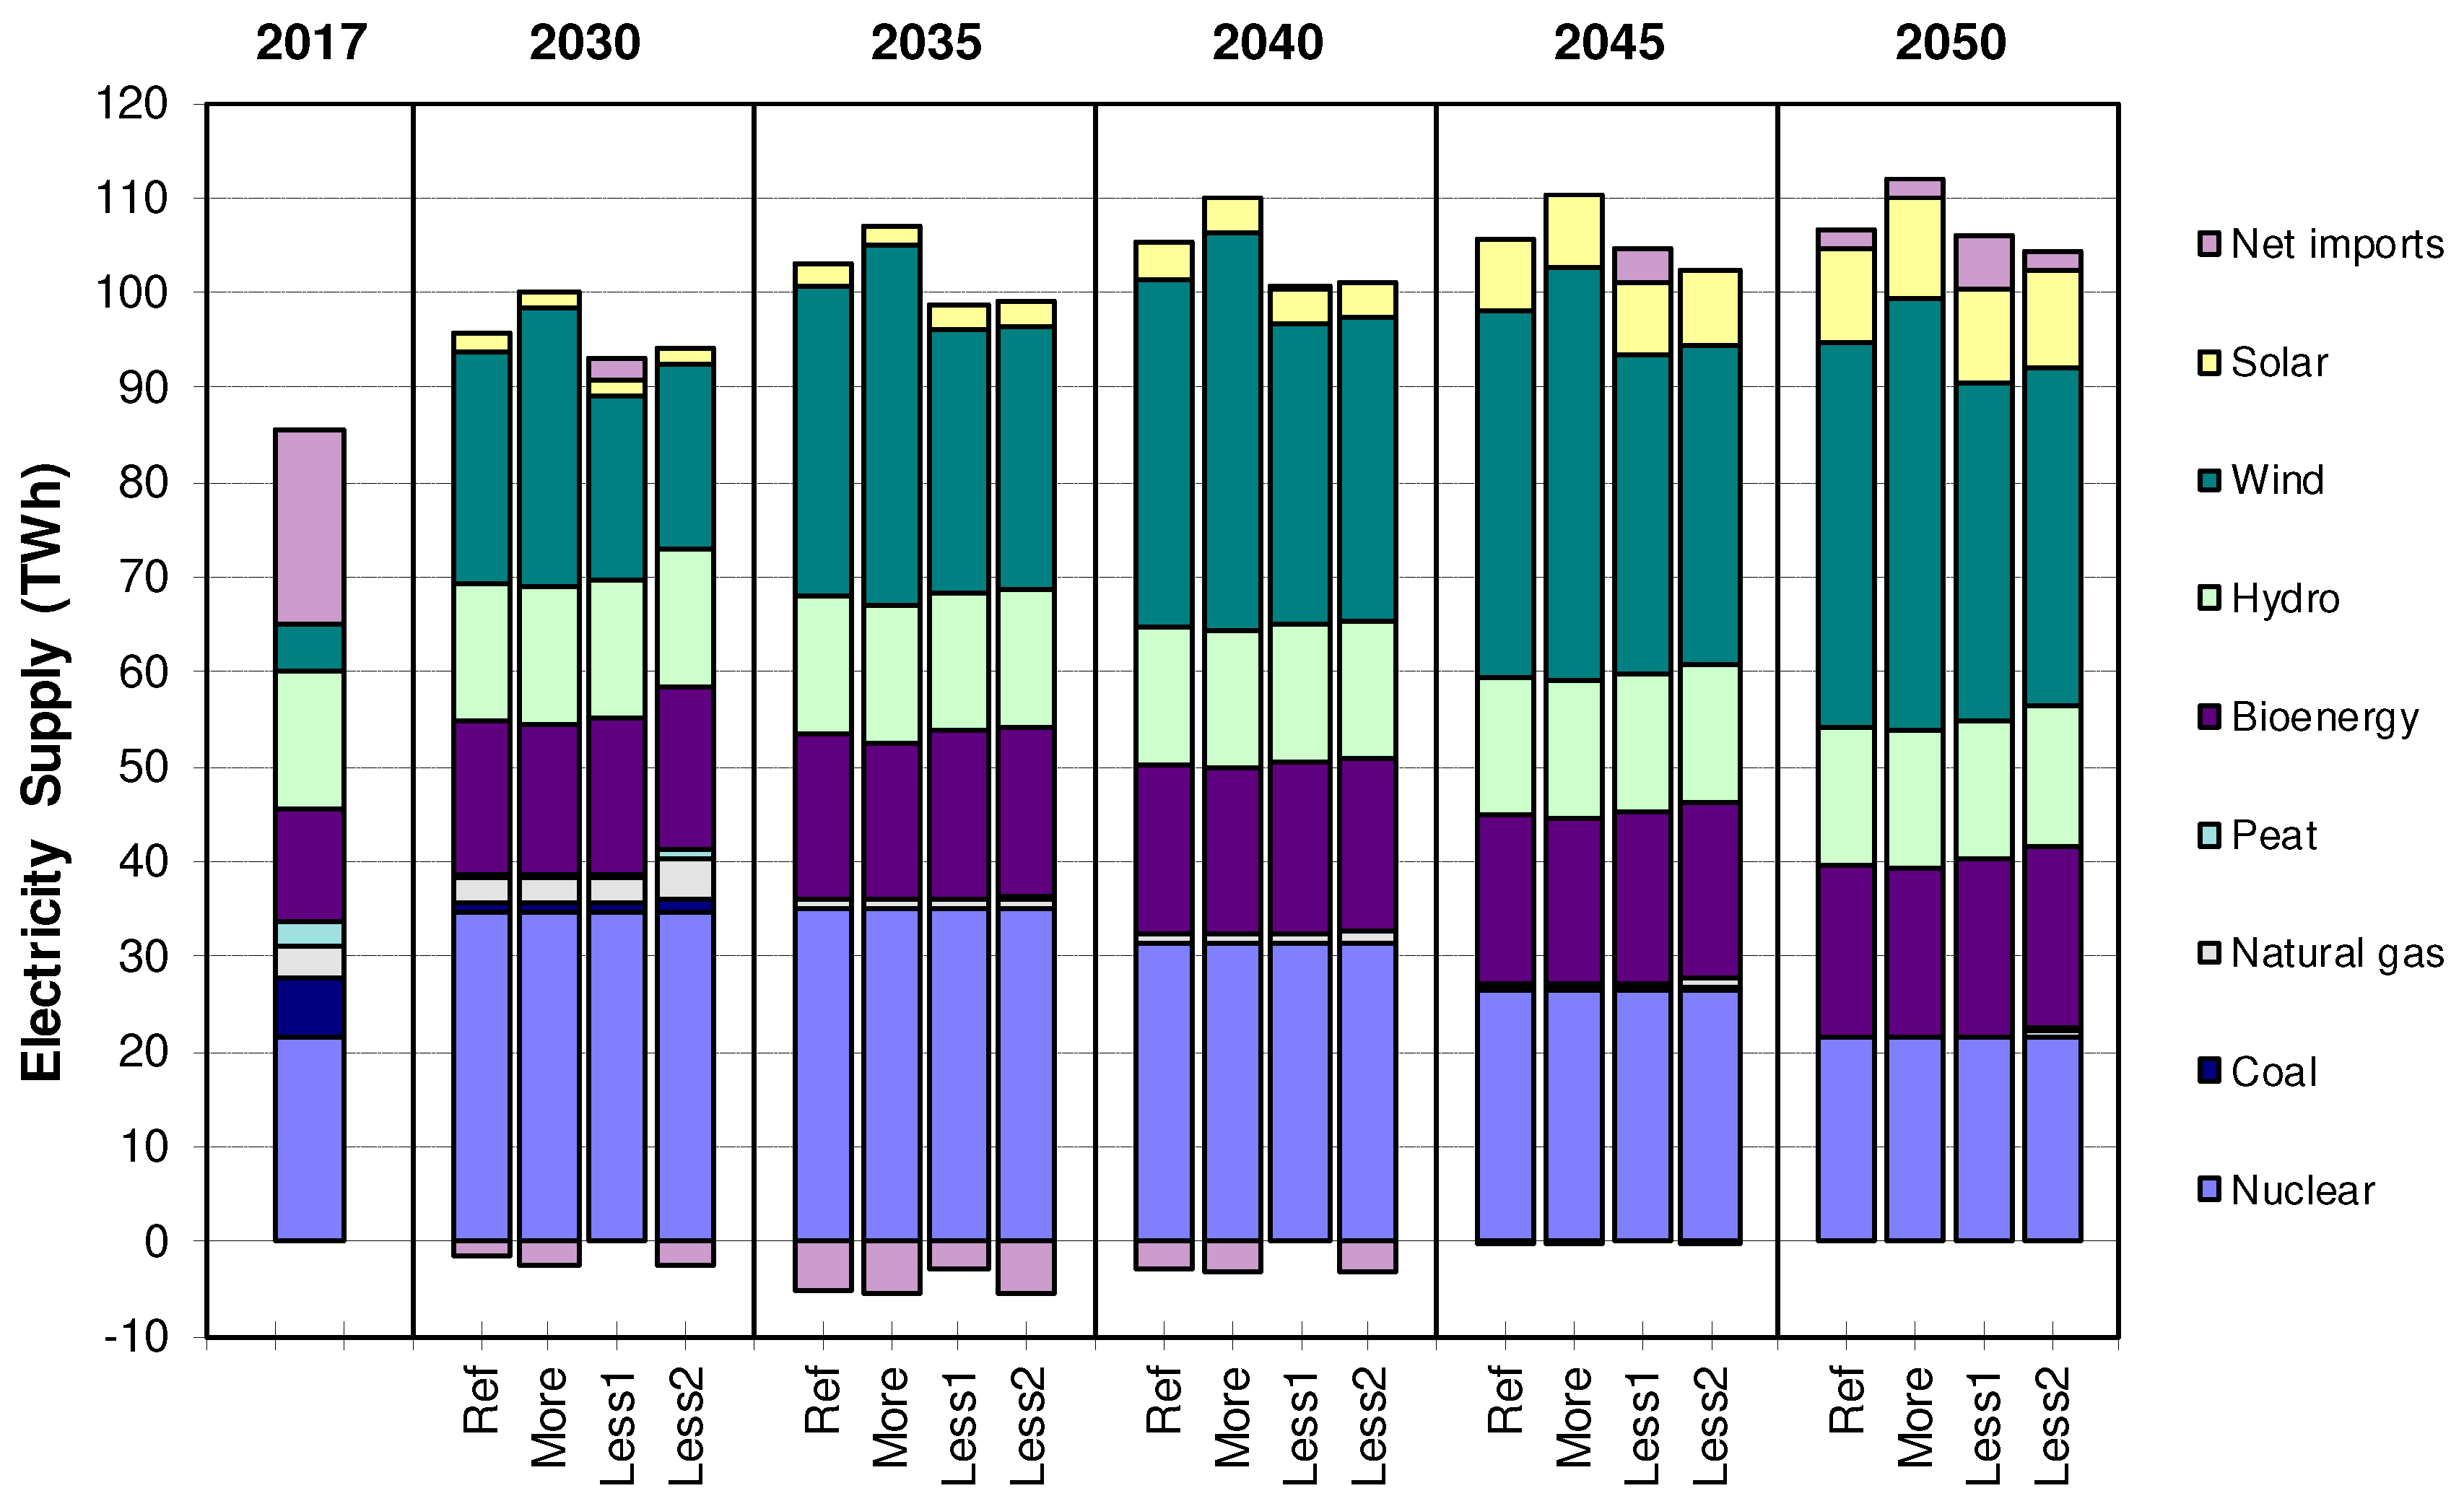
Figure 1. TIMES-VTT model structure showing main inputs, modeled sectors, and model outputs.
Energies 18 01548 g001
Figure 2. Finnish wind energy in the modeled scenarios. The difference between the lines is the modeled marginal change in the wind power scenarios. The marginal impact on emissions is a result of this marginal change in generation between the scenarios.
Energies 18 01548 g002
Figure 3. Electricity generation and exchange in Finland for the reference scenario as well as for the added 5 TWh/a wind (‘More’), and subtracted 5 TWh/a wind scenarios (‘Less1’ allowing changes in exchange and ‘Less2’ keeping same electricity net trade with neighboring areas as in reference).
Energies 18 01548 g003
Figure 4. The impact of adding or subtracting 5 TWh/a wind energy on generation, demand, and exchange of electricity. The results show the differences between the ‘More’ and ‘Less’ scenarios compared with the reference scenario. The green demand in the upper graph is further detailed with demand sectors in the lower figure. Note: Industry includes fuel refining and other upstream processes.
Energies 18 01548 g004
Figure 5. The marginal impact on emissions due to adding or reducing 5 TWh/a wind energy is shown for modeled emissions in Finland at the sectoral level, the rest of Europe as a sum through energy trade, and the estimated impact of wood chips on carbon sinks in Finland. Impact from electricity and district heating (ELC+DH), transport and industry are shown separately for Finland.
Energies 18 01548 g005
Figure 6. The marginal impact of 5 TWh/a of wind on emissions: reduction in emissions due to adding 5 TWh (upper graph, from the results of the ‘More’ scenario) and increase in emissions due to reducing 5 TWh (lower graph, from the results of the ‘Less2’ scenario). Direct impact in Finland in green; combined impact in Finland and from the rest of Europe (+RoEur) in blue; and the addition of an estimate for the impact of wood chips on carbon sinks (+Fin-LULUCF) in red.
Energies 18 01548 g006
Table 1. Main impacts of adding and reducing the wind power in Finland compared with the reference scenario.
Electricity generation in FinlandIn 2030, the decrease of 5 TWh/a of wind energy affects mainly gas power (+1.5 TWh/a). For the power and district heat sectors in the ‘More’ scenario, the reduction in bioenergy consumption is highest during 2030–2035 (about 2.5 TWh/a in 2030 and 1.5 TWh/a in 2035), with the reduction decreasing to below 1 TWh/a in the later years of 2040–2050. In the ‘Less’ cases, bioenergy use conversely increases in power and district heat generation, the increase being modest in the ‘Less1’ case but more pronounced in the ‘Less2’ case, where the impact is notable (about 2.8 TWh/a) already in 2030. Moreover, while being smaller in 2040–2045, it returns to above 2.8 TWh/a by 2050.
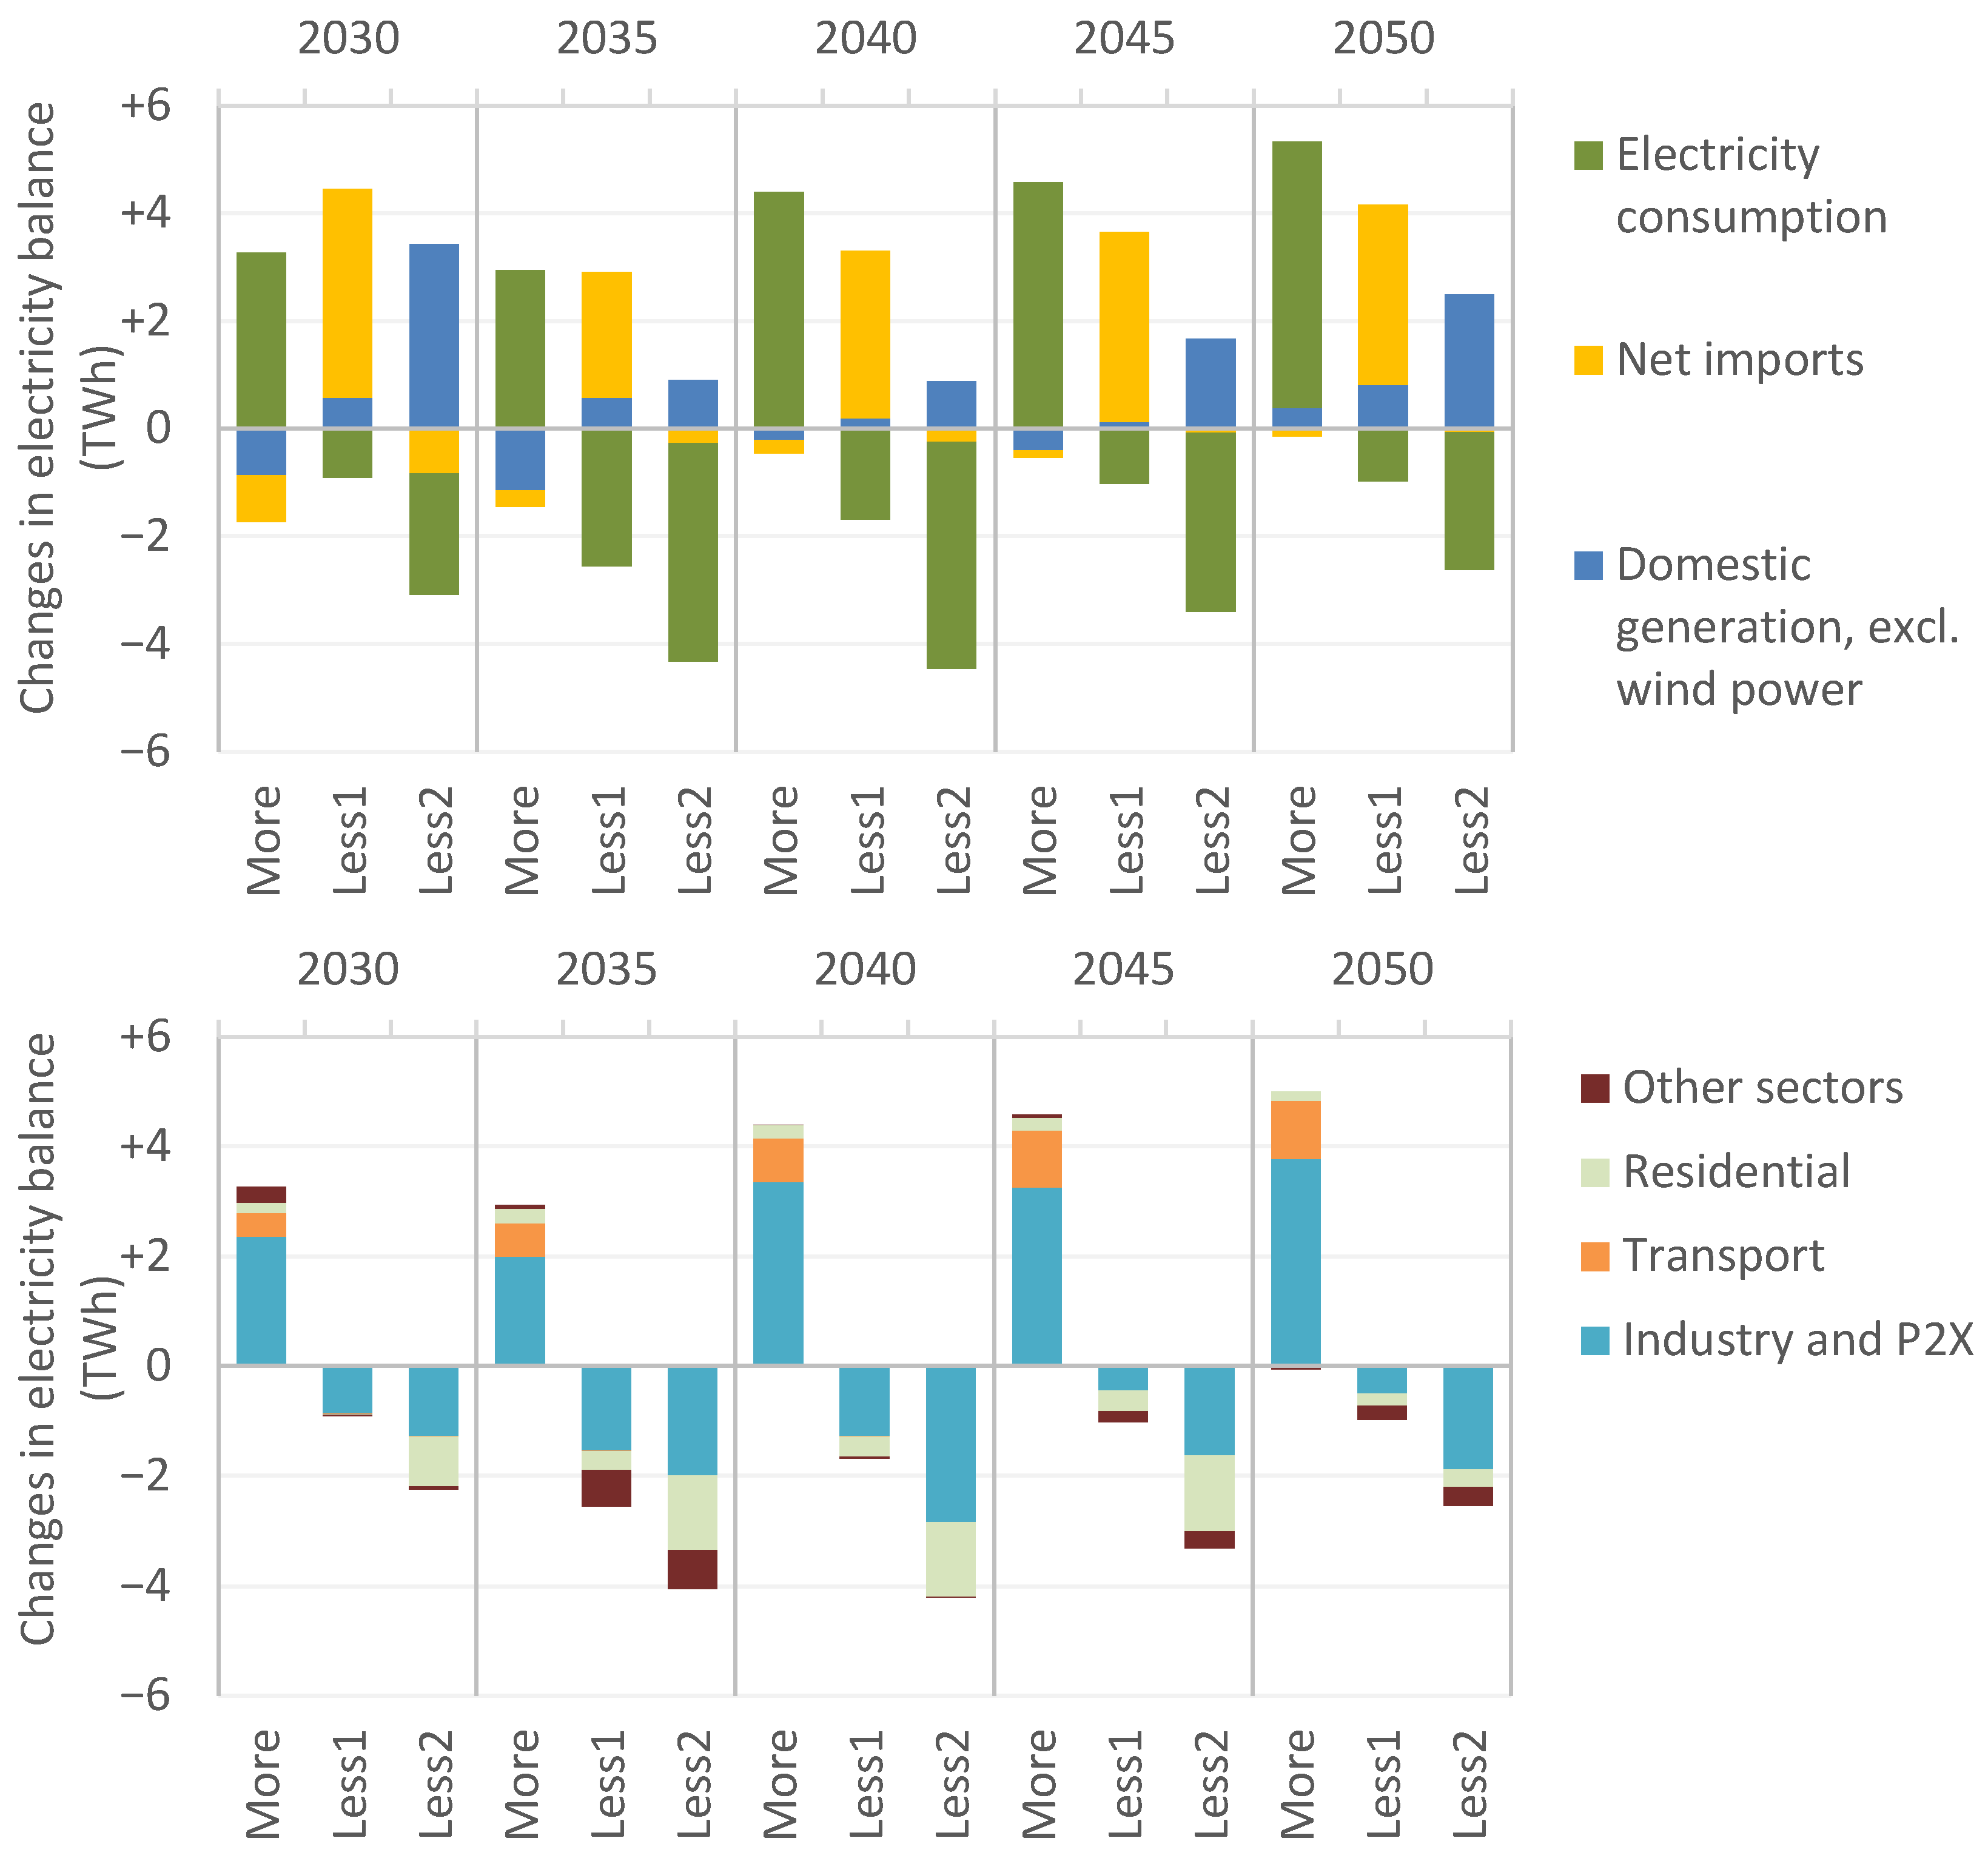
Electricity consumption in FinlandThe consumption grows in all scenarios by about 10 TWh/a from 2030 to 2050. All years see a considerable impact from wind power for electricity consumption in the end-use sectors and energy transformation (e.g., fuel production). The ‘More’ scenario sees an increase of 3 TWh/a in consumption and an increase of 4.5 TWh/a from 2040 onwards. The ‘Less2’ scenario sees a consumption reduction of 4 TWh/a from 2035 onwards compared with the reference scenario.
Impacts through tradeAs a sensitivity, the ‘Less1’ scenario allows the model to reoptimize import/export from the reference scenario, and also for yearly amounts of exchange. As expected, reducing wind power by 5 TWh/a required more electricity from neighboring regions. Annual net imports increased by 3.5 TWh/a in the ‘Less1’ scenario, meaning that the generation and consumption of energy outside of Finland was impacted by reduced clean generation in Finland.
Table 2. Impacts in electricity consumption due to added or reduced wind power in Finland compared with the reference scenario.
Fuel production In the ‘More’ scenario, the model replaces part of the produced bioliquids with e-fuels (hydrogen production) that increase the electricity consumption (+3 TWh/a in 2040) and the electrification of heavy transport. The changes in the e-fuel amounts occurred mostly from 2040 to 2050. The decrease in wood-based bioenergy use was 3–4 TWh/a between 2040 and 2050. The supply of carbon-neutral fuels was thereby electrified more rapidly due to the additional wind power production in the ‘More’ scenario. In the ‘Less’ cases, the impacts on fuel production were not significant compared with the reference, as the lower number of EVs was fixed.
Transport sectorIn the ‘More’ scenario, plug-in-hybrid vehicles become more competitive when additional wind power reduces prices, and thereby accelerates the electrification of road transport (+0.4 TWh/a in 2030, +0.8 TWh/a in 2040). This will replace fossil fuels, but also biofuels in the later years. However, no converse effect was observed in the ‘Less2’ scenario, which indicates that the elasticity in the penetration of electric vehicles is asymmetrical in this scenario due to user-given constraints on the minimum share of EVs following the projections of current development and likely near-term policies.
Industrial final energyIn the ‘More’ scenario, electricity use in industry was mainly observed in industry heat demand, even if it was somewhat affected in many subsectors due to additional electrification of the process of heat production, but also to some extent through decreased investments into more efficient new end-use technologies, due to the price effect. These industry sector impacts appear more or less symmetrical in the ‘Less2’ scenario as well. The direct use of wood fuels for industrial processes remains almost unchanged.
Residential sectorIn the ‘More’ scenario, electricity demand increases in the residential sector (+0.2 TWh/a in 2030 and 2040), replacing bio-pellets for in-house heating systems. The impact is relatively small as building sector development is driven mainly by other factors than variable energy price, for example, the lifetime of heating equipment and pipes in buildings. The building-sector modeling was found to be somewhat inflexible from the perspective of this kind of study; how quickly changes could be implemented, for example, during the current high prices, should be investigated further. In the ‘Less’ scenarios, there is a converse impact in the residential sector, more notably in the ‘Less2’ case (−1 TWh/a in 2030) in terms of decreased penetration of in-house heat pumps.
Table 3. The results for CO2 emission reduction for wind power in Finland are presented as gCO2eq/kWh wind generated (in parenthesis is the impact of saving wood chips on carbon sinks).
gCO2eq/kWh20302035204020452050Average 2030–2050
More = addition of 5 TWh/a120
(+120 = 240)
90
(+130 = 220)
80
(+170 = 260)
320
(+130 = 450)
270
(+160 = 430)
180
(+140 = 320)
Less 2 = reduction of
5 TWh/a
400
(+140 = 540)
280
(+70 = 350)
150
(+0 = 150)
140
(+0 = 140)
30
(+50 = 80)
230
(+20 = 250)
Less 1 = reduction of 5 TWh/a, but allowing increased electricity trade560
(+50 = 610)
380
(+40 = 420)
190
(+0 = 190)
50
(+0 = 50)
20
(+0 = 20)
240
(+20 = 260)
Table 4. Impact of wind energy on emissions for the years 2030–2050 in Finland.
gCO2eq/kWhMoreLess1Less2
Average marginal impact 2030–2050, Fin-Direct + RoEur−177+268+232
Average marginal impact 2030–2050, Fin-Direct + RoEur + Fin-LULUCF−319+259+254
Disclaimer/Publisher’s Note: The statements, opinions and data contained in all publications are solely those of the individual author(s) and contributor(s) and not of MDPI and/or the editor(s). MDPI and/or the editor(s) disclaim responsibility for any injury to people or property resulting from any ideas, methods, instructions or products referred to in the content.

