Article

A Novel FDIA Model for Virtual Power Plant Cyber–Physical Systems Based on Network Topology and DG Outputs

1
College of Electrical Engineering, Shanghai University of Electric Power, Shanghai 200090, China
2
School of Mechatronic Engineering and Automation, Shanghai University, Shanghai 200072, China
3
College of Science and Engineering, James Cook University, Townsville 4811, Australia
4
Offshore Wind Power Research Institute, Shanghai University of Electric Power, Shanghai 200090, China
*
Authors to whom correspondence should be addressed.
Energies 2025, 18(7), 1597; https://doi.org/10.3390/en18071597
Submission received: 21 February 2025 / Revised: 17 March 2025 / Accepted: 20 March 2025 / Published: 23 March 2025

Abstract

:
Virtual power plant (VPP) is a critical platform for modern distribution systems with distributed generators (DGs). However, its cybersecurity is susceptible to cyber-attacks such as false data injection attacks (FDIAs). The impacts of FDIAs on VPP-distribution cyber–physical power systems have not been thoroughly investigated in the literature. This study concentrates on the distribution–VPP joint system and designs a new FDIA framework, topology-distributed-generator attack (TDA), that manipulates power network topology and DG outputs. An attack vector is designed carrying incorrect topology, falsified DG outputs, and tampered power flow information that can bypass the existing bad data detection and topology error identification, misleading the decision-making in the control center. Additionally, TDA models are formulated to optimize attack vectors based on objectives of attack investment, VPP economic loss, and operational security. A hybrid solution framework is then proposed for the optimization problem above, where the corresponding submodules realize the bad data detection, topology error identification, and optimal dispatching in the optimal attack vector. The effectiveness and superiority of the proposal are numerically verified on a 62-node cyber–physical system. Key findings highlight that VPP-integrated distribution systems are more vulnerable under low-level renewable energy penetration and the urgent need for enhancing backup power supplies to mitigate such threats.

1. Introduction

1.1. Motivation

The modern distribution power system is a typical cyber–physical power system (CPPS) equipped with advanced measurement sensors and computing resources. In a CPPS, the cyber network of information transmission cooperates in real-time with the physical power systems, providing infrastructures for new power businesses, such as virtual power plants (VPPs), that are emerging in distribution systems [1,2,3]. While facilitating interactions among energy entities, the cyberspace of power systems is exposed to the huge threats of cyber-attacks. Branch overload, power imbalances, and even cascading failures can be triggered by cyber-attacks, resulting in considerable economic losses and social instability, such as what happened in the 2015 Ukraine blackout [4]. Therefore, it is necessary to enhance the cyber-security of modern distribution power systems with VPPs.
To support the target of “carbon peaking and carbon neutrality” in China, the cyber-security of power systems is the basis of power industry reform and development [5]. The State Grid has detailed cyber-security from three perspectives: (1) system security, which ensures the accessibility of communication systems; (2) information security, which involves the integrity, availability, and confidentiality of data; (3) transaction security, which cares about the reliability of power businesses [6]. Cyber-attacks, in various forms such as false data injection attacks (FDIAs), man-in-the-middle (MITM) attacks, etc., always target the supervisory control and data acquisition (SCADA) system and disturb the data transmission or even falsify the data. Thus, modeling cyber-attacks is a key tool for analyzing attackers’ intent, simulating potential damage, and guiding protection measures.
Distributed generators (DGs) are geographically separated in a modern distribution power system. To aggregate and manage these distributed resources, VPPs are introduced with more efficient, economic, and intelligent operations to integrate DGs while also gradually opening the originally private cyberspace of power systems to the public [7], forming a public–private (i.e., heterogeneous communication) power network (PPPN). Since public networks that execute communications between DGs and VPP aggregators do not have as solid firewalls and detection mechanisms as private power networks do [8,9,10], attackers can inject attack vectors into the VPP-DG metering devices and transmission channels. Correspondingly, the distribution power system will suffer from incorrect data flow from coordinated cyber-attacks via communication links with VPPs. To mitigate operation risks, it is of great importance to model the cyber-attack on the PPPN and analyze its impacts on distribution power systems.
In summary, the primary research questions addressed in this work are as follows.
  • How to develop a cyber-attack model that considers the emerging background of PPPNs? How to implement such an attack that considers the coordination between VPPs and the distribution system operator (DSO)?
  • How to design the cyber-attack process without being detected by the control center? What are the economic and security impacts of this attack on the joint operation of VPP aggregators and the distribution power system?

1.2. Literature Review

1.2.1. Attack Targets

As one of the most popular cyber-attacks on power systems, FDIAs on power flows/loads [11,12,13,14,15], network topology [16,17,18], and DGs [19] can lead to serious damage to the physical power system. Extensive research has been conducted on the modeling of FDIAs. In [12,15], multi-stage attack models are formulated where the stealthy intrusion is guaranteed by simulating the bad data detection (BDD) process. Then, the contaminated measurements of power flows are optimized to maximize the attack impacts. Reference [16] has proposed a topology cyber-attack to mislead the control center with incorrect network information. The topology attack is then enhanced in [17,18] as a line-switch topology attack (LTA) with detailed assumptions and specific processes. The fundamental of launching a successful topology attack is to bypass the topology error identification (TEI). On the demand side, there are more kinds of information that can be manipulated, such as DG output data [20], node load data [11,19], and price signals [21]. The above studies have investigated attacks on the conventional power system with simplified system frameworks, while emerging businesses such as VPPs have attracted researchers to design new attack models. Reference [22] has modeled a simplified FDIA on VPP as a state variable of each DG where the detection means of power systems are ignored, which is unpersuasive in practice. Reference [23] focuses on power grids that have experienced major blackouts as the target, indicating that attackers may launch FDIAs during the most vulnerable moments. Commonly, the implementation of launching attacks on modern distribution systems remains in the traditional way that attacks take place in homogeneous communication networks, resulting in incorrect impact analysis and conclusions. Moreover, existing studies mainly focused on launching single-type cyber-attacks while neglecting coordinated attacks could cause more severe damage.

1.2.2. Solving Strategy of Cyber-Attack Models

Currently, optimization problems of cyber-attack models are addressed in three major ways, including (1) mathematical methods, (2) analytical methods, and (3) heuristic methods. In [11], a load-altering attack (LAA) has been modeled as a mixed integer non-linear problem (MINLP), which is directly solved by the Generalized Bender Decomposition algorithm, with local optima obtained. References [20,24] have formulated their cyber-attacks as a bi-level optimization model which is transformed into single-level by the Karush–Kuhn–Tucker condition. Even though their method has found global optima, the attack model made unreasonable assumptions by neglecting critical functions of power systems such as state estimation and BDD. The analytical method [25] analyzes the impacts of attacks based on a large number of simulations, thus easily falling into the “curse of dimensionality”. Malware-induced cyber-attacks are simulated in [14], and the vulnerability risk of devices from both cyber and physical sides is revealed based on graph theory in [26]. By contrast, heuristic optimization algorithms are widely used in solving attack complex models. In [12], a multi-objective attack model is solved using a non-dominated sorting genetic algorithm. Differential Evolutionary methods are applied in [13,15] to optimize multi-step attack strategies. The Natural Aggregation algorithm is applied in [17] to optimize the LTA model which is formulated as a MINLP. The solution quality of heuristic algorithms is guaranteed based on the large number of populations, thus causing poor computation efficiency.

1.2.3. Attack Scenarios of PPPNs

A VPP is designed for the third party to operate on a public communication network, where cyber security risks may arise while interacting with the private power network. Some scholars have noticed that this evolution may bring new risks to the reliable operation of power systems. In [27], a complex network analysis on the structure characteristics of VPPs shows that the VPP control is highly dependent on the aggregators’ control center, which has poor flexibility against cyber-attacks. Reference [28] firstly demonstrates that, in a PPPN, the private network has higher authority than the public network in monitoring and controlling, and the transmitted information through the edge of private and public networks should be restrained as electricity bills and DG outputs for the sake of system security. Substantial concerns for PPPNs have arisen for the half-open space essence which enforces deformity [29]. In general, as DSOs delegate the DG management to VPP aggregators [30,31], cyber attackers can easily sneak into PPPNs and launch FDIAs to bring more serious impacts on the distribution systems. Reference [32] has investigated the injection and propagation routes of denial-of-service attacks on a VPP.
In summary, current FDIA models typically follow a “one-shot” attack strategy, expecting that a single FDIA can disrupt the operation of the distribution system. However, attackers in practice often have multiple opportunities to launch attacks, which may shift their objectives from optimal attacks to more rational ones. With long-term goals, attackers can manipulate with suboptimal FDIAs in the short term but optimal FDIAs in the long run. Moreover, current FDIAs are formulated based on existing power network environments, with insufficient consideration for new distribution network operation scenarios such as PPPNs and VPP integration. There is also a lack of anticipation for new FDIAs in these emerging scenarios, making it hard for distribution systems to respond effectively to real-time cyber-attacks. Regarding the model and optimization framework of cyber-attacks, the following deficiencies can be outlined based on the literature survey above.
  • The communication heterogeneity between private power and public VPP networks is always ignored, and the impact analysis is unreasonable and even incorrect when cyberattacks take place on PPPNs.
  • Network topology and DG outputs are critical data for VPPs, but existing FDIA models only consider launching cyber-attacks from a single aspect.
  • To the best of the authors’ knowledge, there exists no effective optimization framework of FDIA designed for balancing computation accuracy and efficiency.

1.3. Contributions

Considering the above challenges, this paper proposes a novel FDIA model considering both network topology and DG outputs to disturb the operation of distribution systems and VPP aggregators in the background of PPPNs. Firstly, the concept of the PPPN is introduced, where the vulnerabilities of this novel distribution network are analyzed. This paper designed a novel FDIA model to address the gap between traditional distribution networks and PPPNs. Within the attack model, the false data of network topology, DG outputs, and power flow are injected into the control center, where BDD and TEI are deceived. The paper then develops a hybrid optimization framework for solving the proposed attack model, where the heuristic optimization process is guided by a mathematical method. Numerical studies are conducted on a 62-node CPPS test system at different renewable energy sources (RES) penetration levels. Through numerical results, the effectiveness of the proposed attack model is demonstrated, and cyber-attacks on PPPNs can cause worse situations with lower costs than normal FDIAs.
The key contributions of this study to the research field can be summarized as follows:
  • Developing a new cyberattack framework considering the scenario of PPPN operations and analyzing the cyber vulnerability of the DSO and VPP aggregators.
  • Proposing a topology–DG joint attack model where an attacker compromises the data of DG outputs and network topology information by, respectively, injecting the bad data into the PPPNs.
  • Proposing a hybrid optimization framework that realizes the critical solution functions by inner-layer second-order cone programming (SOCP) and outer-layer particle swarm optimizer (PSO).

1.4. Paper Organization

The remainder of this paper is organized as follows. The preliminaries of the PPPNs are introduced in Section 2. The proposed topology–DG joint attack model is presented in Section 3. In Section 4, the hybrid optimization method is constructed. In Section 5, the mechanism and the impact of the attack model are validated using a state-of-the-art CPS test case. Finally, conclusions are presented in Section 6.

2. Communication, State Estimation, and NTP Assumptions

This section introduces the communication architecture of DSO and VPP based on the PPPN, as shown in Figure 1, while the active state estimation and network topology processing (NTP) are reviewed in the subsequent parts.

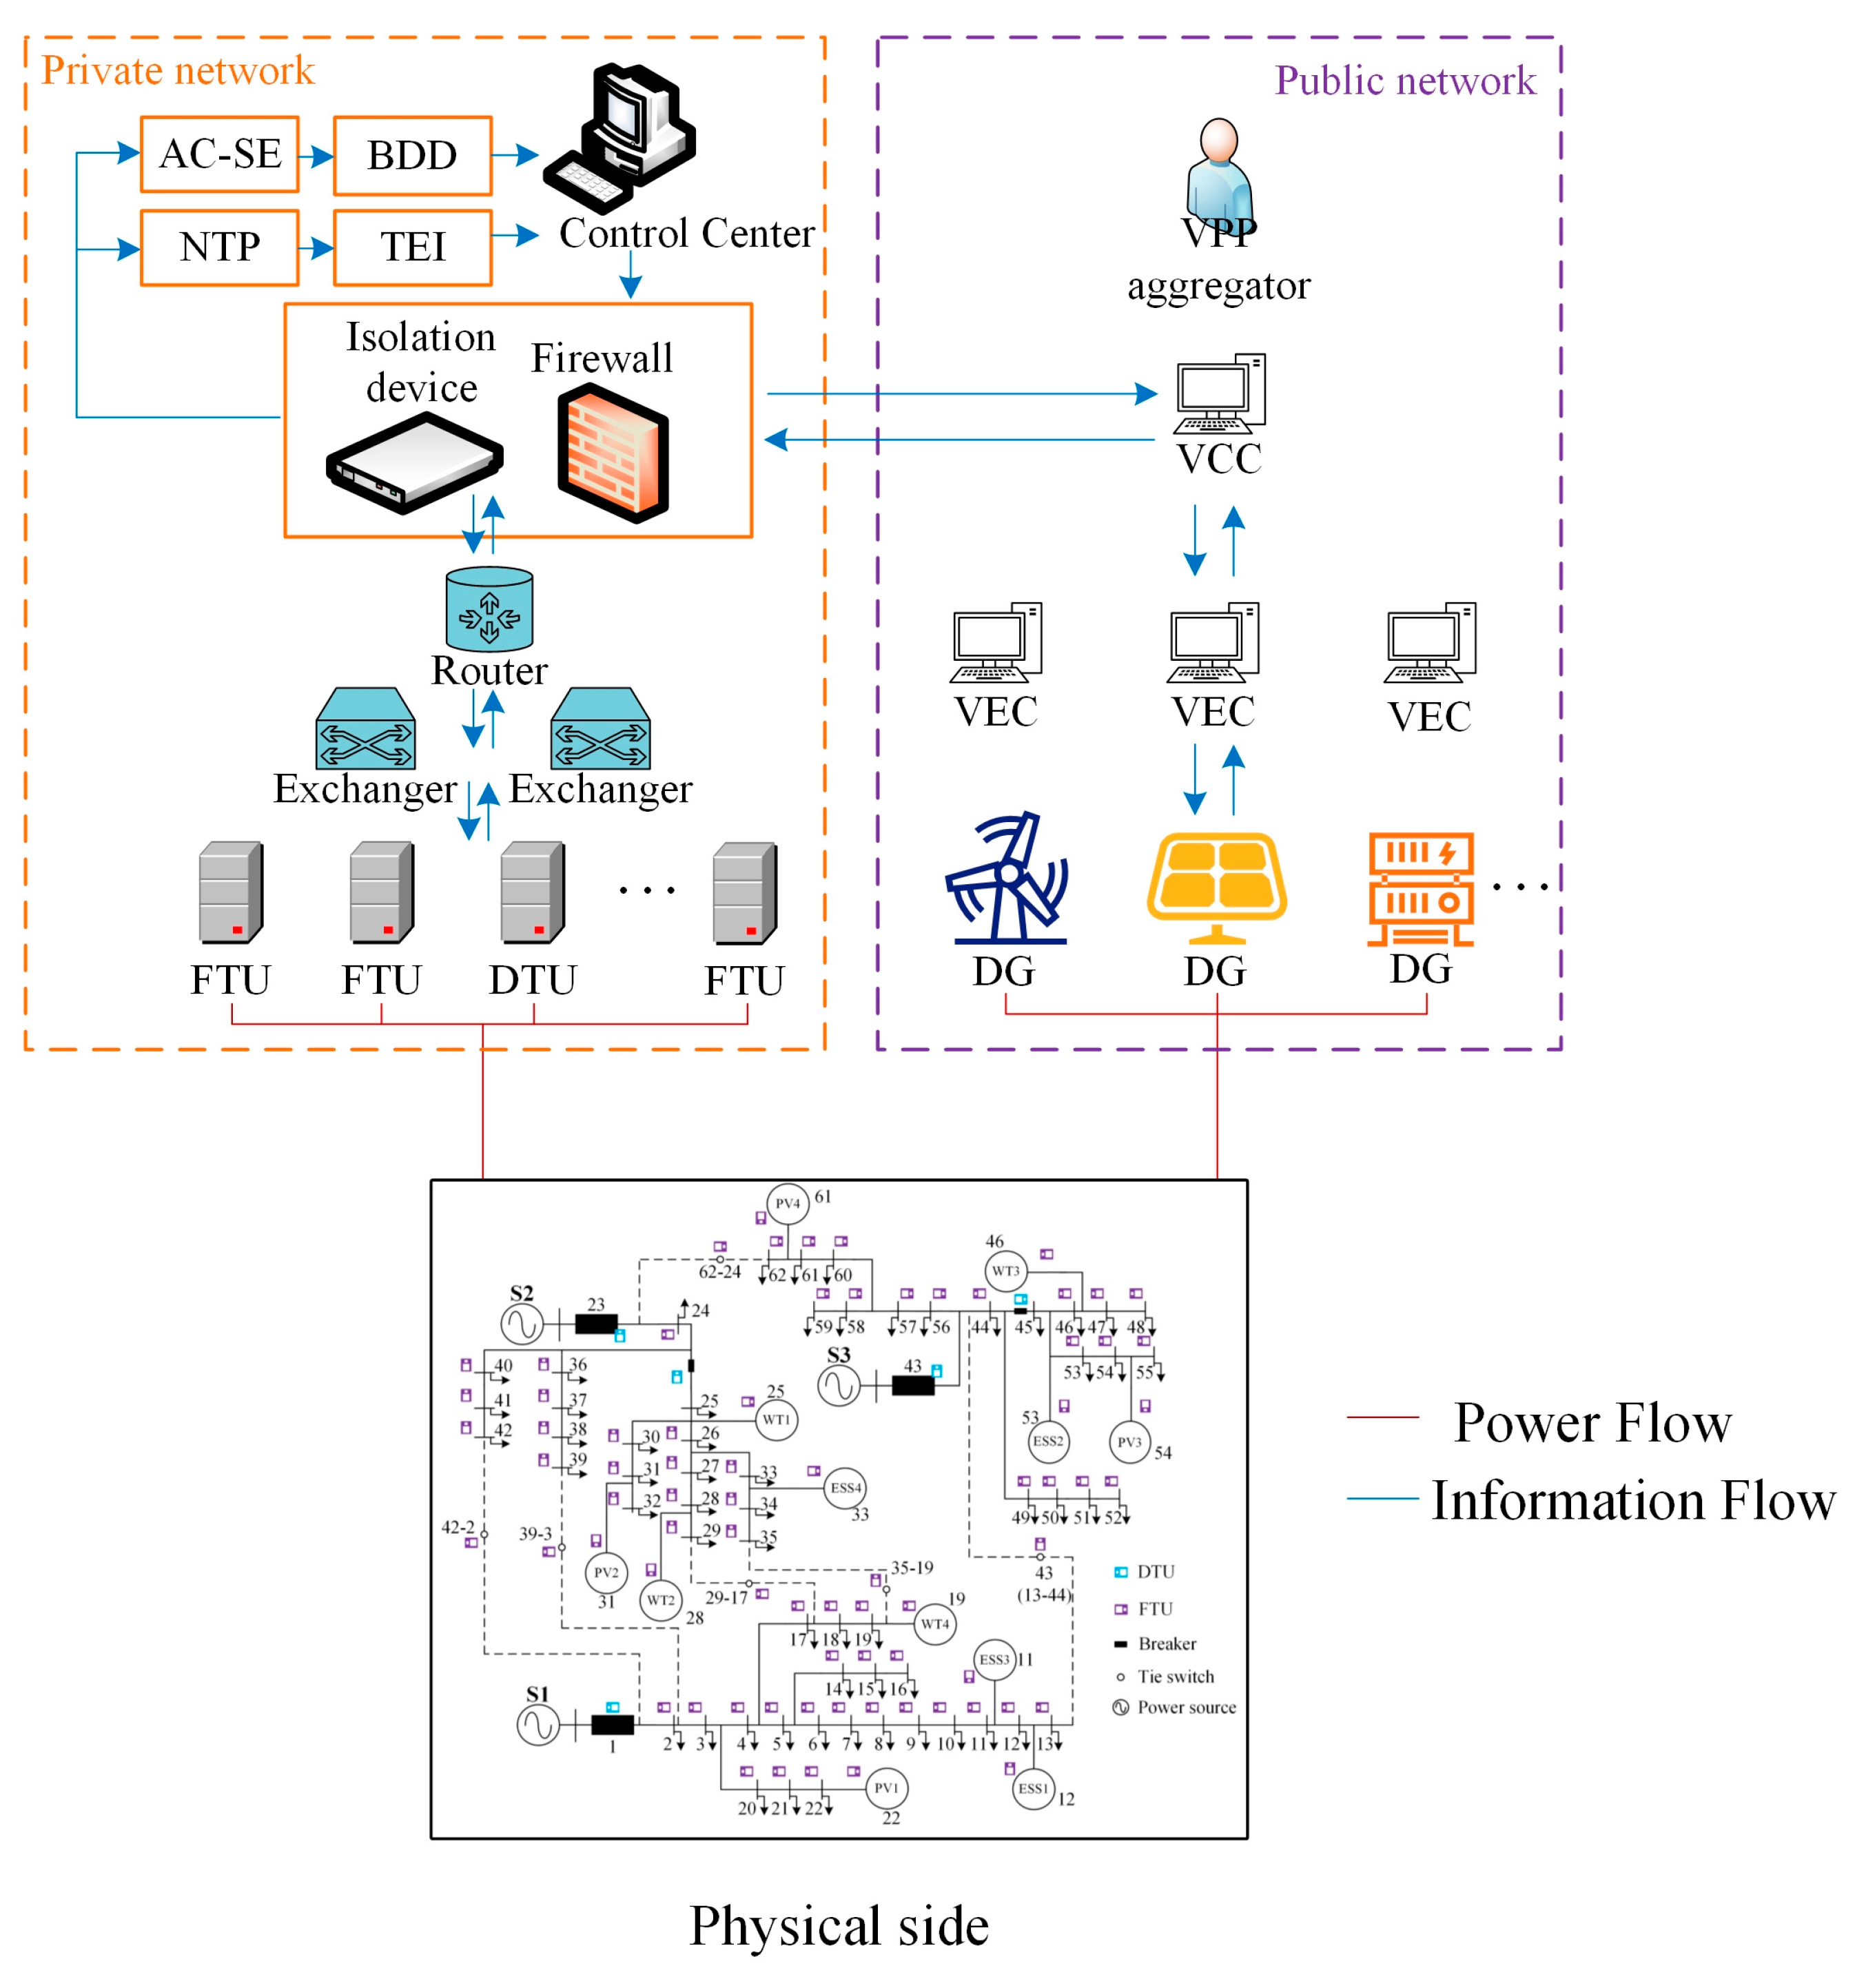
2.1. Communication Architecture

A VPP consolidates geographically separated DGs, such as RESs and energy storage systems (ESSs), with the help of advanced measurement and communication technologies. To benefit from the energy market, VPP aggregators participate in the optimal control of the energy management system (EMS). The communication framework for the proposed attack model is constructed based on the international standard of power system automation IEC-61850. Figure 1 shows a PPPN based on the VPP framework along with its power and information flows [32]. A VPP aggregator possesses and controls a VPP cloud service center (VCC) that receives the generation commands from the DSO via a public–private interactive channel and sends the corresponding control instructions to the submissive DGs via public channels. Each DG is also equipped with a VPP edge service center (VEC) to execute information interactions with the VCC. Assuming K DGs within the VPP, the output data of the kth DG is represented by (pk, qk) where k ∈ [1, K]. In addition, various meters and sensors, such as feeder terminal units (FTUs) and distribution terminal units (DTUs), within the physical system measure and transmit the data to the superior devices via the channels in the private network. After receiving the data from the two networks, the DSO calculates the optimal dispatch strategy for the next period.
Two assumptions are made in the proposed cyber-attack model:
  • The attacker masters the principle of operating the power system and has knowledge of the target power grid. Furthermore, the attacker has access to the public–private power network and can manipulate any meter measurement in the target power grid. This assumption is consistent with other studies on FDIAs.
  • For the simplicity and clarity of this work, a powerful DSO is created to handle the dispatching of both the power grid and VPP’s submissive DGs. Despite a DSO having no authority to directly give instructions to the DGs within a VPP in practice, both the DSO and the VPP aggregator have the same interests in facing cyber-attacks.

2.2. State Estimation Model and BDD Principle

State estimation is an approach to calculate the power system’s state variables (i.e., voltages, magnitudes, and angles across the network nodes) based on the measurement data, which are collected by meters as analog data, including nodal active and reactive power and branch power flow. The obtained state variables are used as elements in the EMS calculations, such as optimal power flow [2], voltage control [3], and forecasting tasks [7].
Here, the distribution system’s network is represented by a graph G = (N, ϑ), where N is the node set of the distribution system, and ϑ is the branch set. The supervisory control and data acquisition (SCADA) system of the control center collects measurements as
z = h ( x , ϑ ) + e
where z is the measurement vector from the meters. Assuming M meters in the distribution system, the measurement vector of each meter is denoted by zmz, m ∈ [1, M]. In (1), h() represents a non-linear function [16] related to the system state x and the topology ϑ, while e is the measurement error, which is assumed to be a Gaussian noise.
The state variables are estimated using the WLS method from
x ^ = arg min y ( z h ( y , ϑ ) ) T R 1 ( z h ( y , ϑ ) )
where R is the error covariance matrix.
The control center often implements BDD based on the residual error of the system states [33,34]. The residual error is calculated from
r e s = ( z h ( x ^ , ϑ ) ) T R 1 ( z h ( x ^ , ϑ ) )
Whenever the residual value exceeds the threshold value of τ, the new measurement vector of z will not pass the BDD. Thus, the BDD is realized by
r e s τ
Therefore, the measurements z and topology ϑ are considered valid only if the residue is less than τ.

2.3. NTP and TEI

The NTP constructs the distribution system’s topology from the received breakers/switches status data [16] and other modules in EMS, such as state estimation, observability analysis, power network modeling, etc. [17]. Telemeter devices collect the digital signals of the topology of the physical distribution system. Then exchangers and routers in the private network compile the digital data and send them to the NTP in EMS to construct the network topology information as an incidence matrix of A R N × ϑ with its elements demonstrated by
a i l = 1 , i l   is   the   parent   node 1 ,   i l   is   the   child   node 0 , i l , l ϑ , a i l A
Then, the TEI module in the NTP evaluates the connectivity and the radiality of the constructed virtual topology for the distribution system. To keep the nomenclature consistent, we apply the incidence matrix in (5) to represent the radial constraints instead of using the adjacency matrix. Given the incidence matrix A, the a l is denoted as the lth column vector of A, and then the connectivity and radiality are verified by (5) and
i n a i l = 0 ,   a i l a l , l ϑ , a l A
i n a i l = 2 ,   a i l 0 0 ,   a i l = 0 , a i l a l , l ϑ , a l A
card a i l a i l = 1 , a i l A = n node n slack
where card{} counts the number of elements in the set. Equation (5) bounds all a i l A to be 0 or ± 1. Equations (6) and (7) indicate that each branch either has only one start and one end or all the elements are equal to 0, while (8) restricts the total number of connected branches.

3. Topology–DG Joint Attack Model of Distribution-VPP CPPS

In this section, the vulnerability of the PPPN against cyber-attacks is first analyzed; then, the formulated attack vector as the false data injected into the PPPN is presented. Finally, to optimize the attack vector, the designed optimization model is introduced.

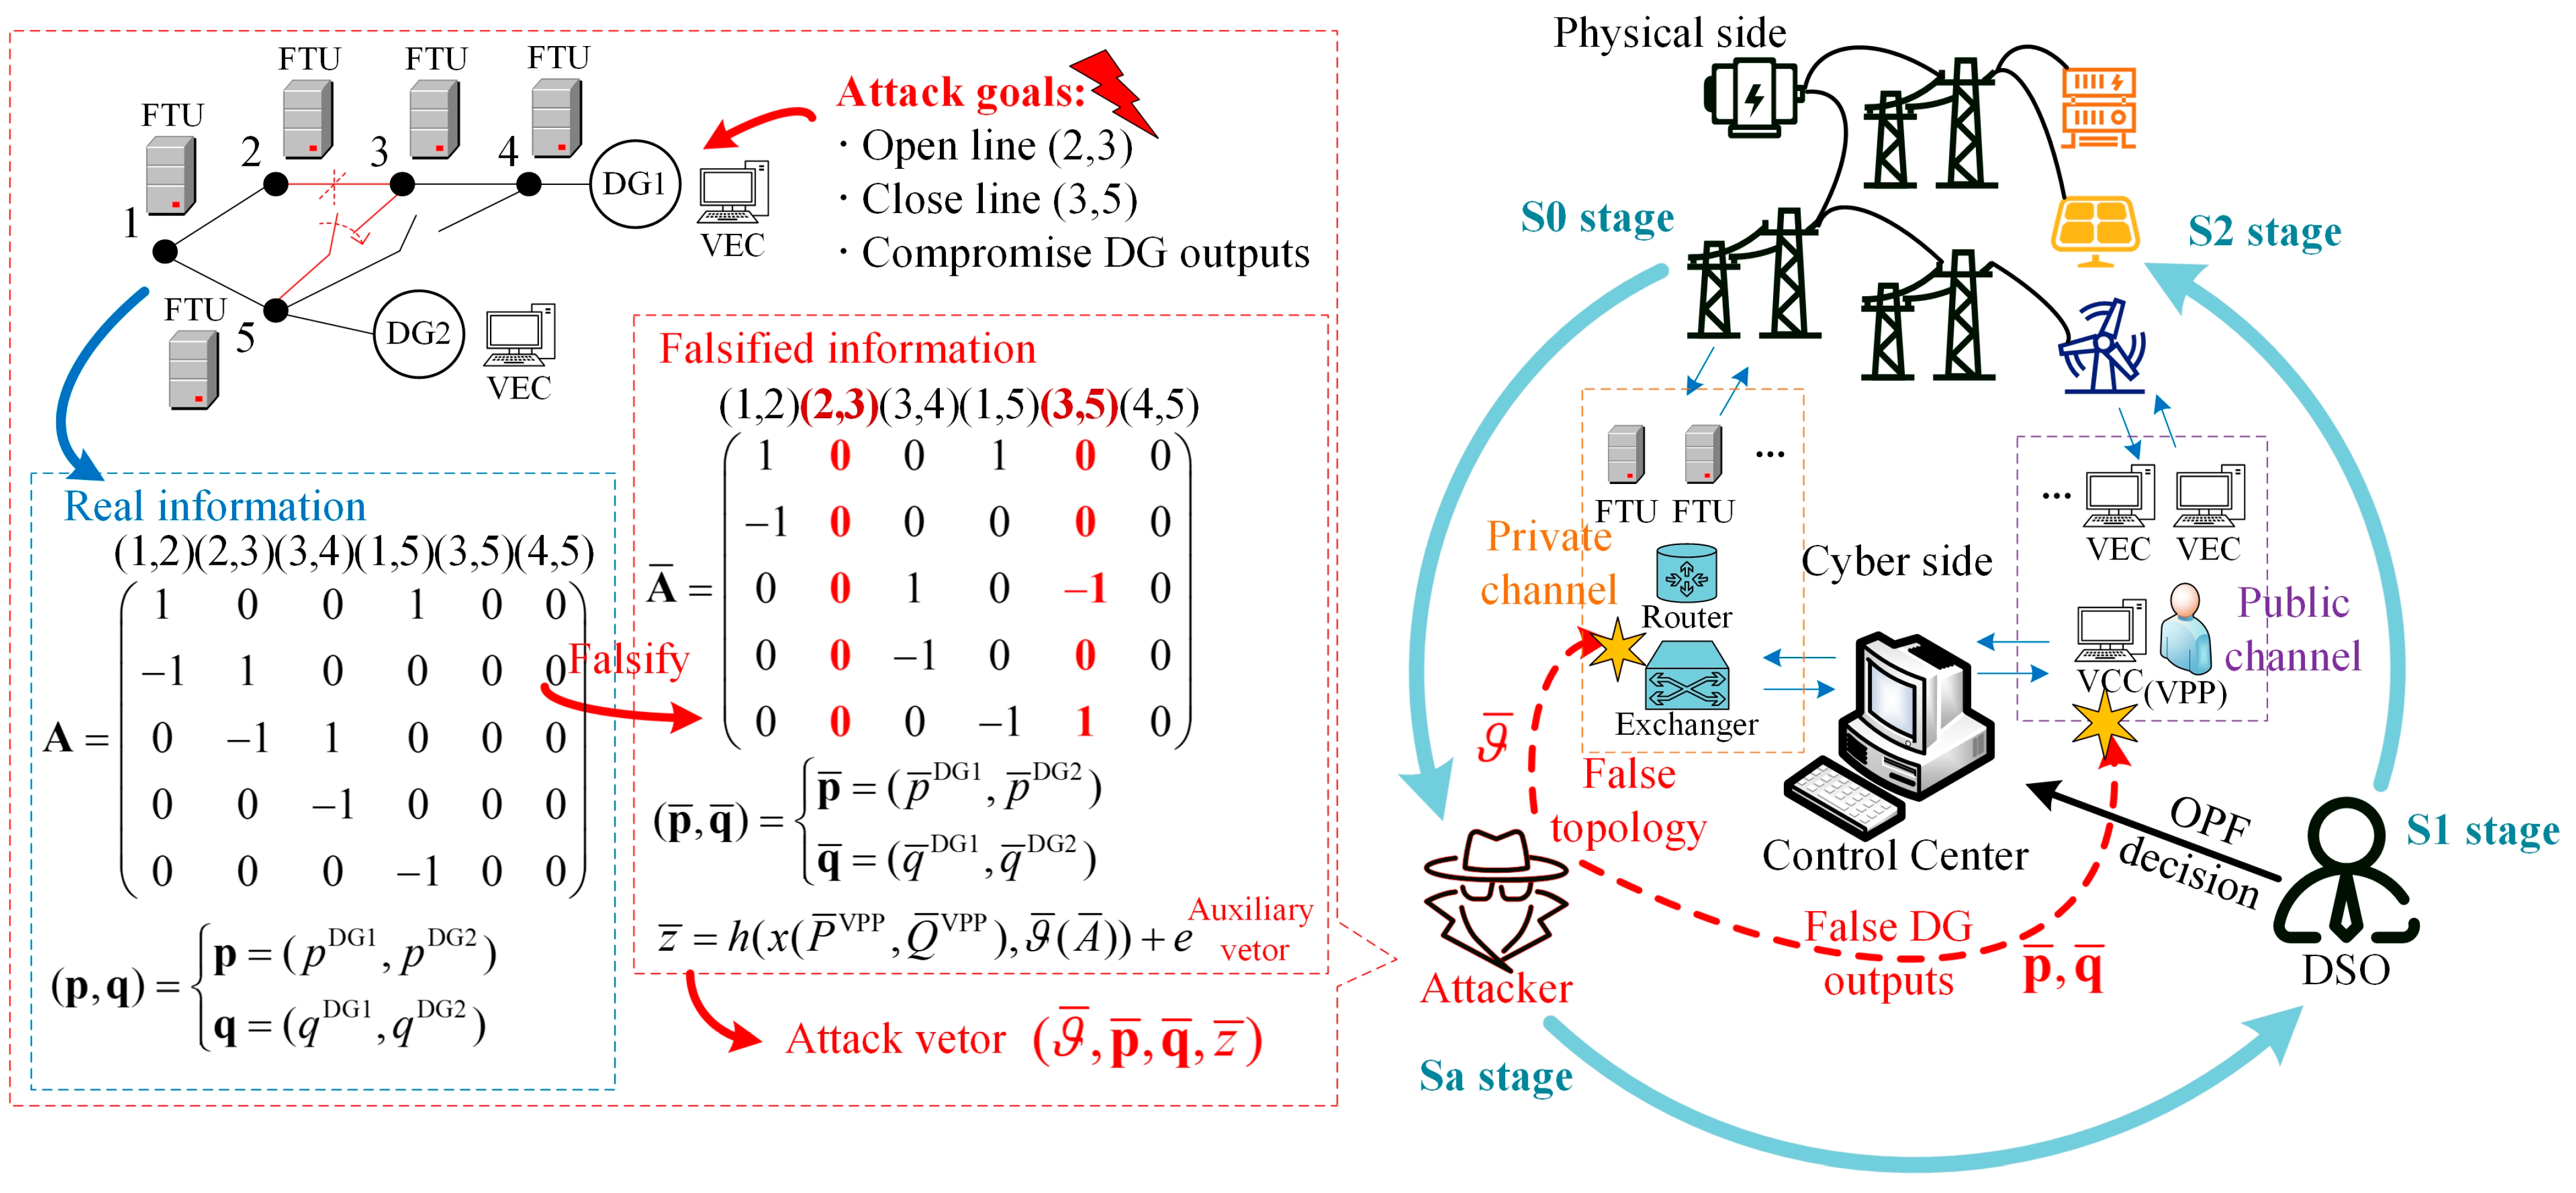
3.1. Launching a Topology–DG Attack

The PPPN supports the VPP aggregator’s businesses with the DSO using advanced communication technologies. On the public side, the VPP aggregator controls the submissive DGs using its VCC to send dispatching orders to the VECs. Moreover, the VCC also gathers the output data from the DGs and sends them to the control center via the private network. These transmitted data on the public network (internet) are of poor confidentiality and easy to access, thus making them vulnerable to cyber-attacks such as FDIAs [31]. On the private side, terminal devices such as FTU/DTU on breakers/switches are also vulnerable to cyber-attacks [10]. Suffering attacks from both sides, the control center receives falsified data regarding three perspectives: topology, power flow, and the VPP (i.e., clustered DGs) outputs. In this case, the consistency of the power system information security is impaired, and the security and stability of the physical system operation are threatened. Figure 2 schematically illustrates the process of launching a topology–DG attack.
The proposed topology–DG attack is composed of four stages, as introduced below:
  • S0, Pre-attack stage: The distribution system is in the normal operation state following the optimal dispatching order, and only tolerable measurement errors exist between the physical state and the estimated state in cyberspace.
  • Sa, Attack stage: The attacker intrudes into VECs with falsified DG output data via the channel in the public network while the connection information and the power flow data from terminal devices are also altered.
  • S1, Decision stage: The tampered data bypasses the BDD and TEI, and the incorrect data enter the control center. DSO recalculates the optimal power flow based on the data and sends new instructions to the VPP aggregator.
  • S2, Damage stage: the VPP aggregator readjusts the outputs of the submissive DGs according to the new commands, and the distribution system reaches a new operation state after the attack.

3.2. Constructing Attack Vector

The topology–DG attack is considerably different from other FDIAs. Studies like [11,17,18] have focused on the internal cyberspace of power systems, also known as the power private internet. This paper extends the background and involves the VPP in the operation of distribution systems, where the cyberspace of the power system is half-opening to the external internet. Thus, constructing the injected attack vector should be characterized by the interactions within the PPPN. The attack vector consists of (1) the attack variables on the network topology and DG outputs and (2) the auxiliary data (e.g., power flow) for covering up the impacts of attack variables.
An example of launching a topology–DG attack is depicted in Figure 2. An attacker alters the incidence matrix A by cutting branches (2,3) and connecting branches (3,5). Different from altering the topology in the transmission network [18,32,33], the attack vector injected into the distribution network not only ensures the connectivity of the falsified topology but also guarantees its radiality, as suggested in (5)–(8). The topology attack vector ϑ ¯ is composed of binary variables where ϑl = 1 and 0 indicate, respectively, the closed and open status of the lth branch (lϑ). On the other hand, the attacker tampers with the DG outputs as an attack vector denoted by ( p ¯ , q ¯ ) which is composed of ( p ¯ k , q ¯ k ) where k ∈ [1, K]. To avoid alerts in the VCC, the tampered DG output vector should be bounded by the output constraints in the form of
p k min p ¯ k p k max
q k min q ¯ k q k max
where p k min and p k max are, respectively, the minimum and maximum active power limits of the kth DG, while q k min and q k max are its minimum and maximum reactive power limits, respectively.
When an attacker plans to change branch l’s status from ‘close’ to ‘open’, the power flow data on that branch needs to be wiped out, and a group of falsified power flow data will be injected. This falsified data will alter the power flow on the entire distribution system. Thus, even the power flow data on non-targeted branches will also suffer from the false data injection. Given the attack variables ϑ ¯ and ( p ¯ , q ¯ ) , the attacker simulates a power flow calculation and obtains an auxiliary vector z ¯ that consists of falsified power data z ¯ l = ( p ¯ l , q ¯ l ) in each branch p ¯ and q ¯ are constrained by
ϑ l p l max p ¯ l ϑ l p l max
ϑ l q l max q ¯ l ϑ l q l max
where p l max and q l max are the maximum active and reactive power of branch l, respectively. Equations (11) and (12) correspond the attack vector ( ϑ ¯ , p ¯ , q ¯ ) with the falsified measurements of power flow z ¯ , which helps evade the BDD in (1)–(3) and the consistency checking [16].
So far, a complete attack vector is composed of topology and DG outputs attack vectors ( ϑ ¯ , p ¯ , q ¯ ) which are the optimization variables, as well as an auxiliary vector z ¯ to avoid the detections.

3.3. Topology–DG Attack Model

3.3.1. Attack Objectives

To investigate the influence of topology–DG attack on the DSO and the VPP aggregator, three objectives are designed where objective 1 is to launch a low-cost cyber-attack, objective 2 impairs the operational benefits of the VPP aggregator, and objective 3 introduces service disturbance on the physical system. Each objective is shown as follows:
Objective-1 is given by
o b j = min ϑ ϑ ¯ 0 + z z ¯ 0 + ( p , q ) ( p ¯ , q ¯ ) 0
and aims to disturb the physical system with the least investment in manipulating measurement meters. Thus, it minimizes the number of manipulated meters while causing at least one branch to overload in the physical system, which is indicated as an extra constraint in the form of
p l s 2 p l max , l
Objective-2 is expressed by
o b j = min k N VPP ( π D 2 V π k V 2 DG ) p k s 2
and aims at adversely affecting the VPP’s economic operation and minimizing the revenue of the VPP aggregator. In (14), πD2V is the tariff when the DSO purchases power from the VPP aggregator; πV2DG is the tariff when the VPP aggregator purchases power from the submissive DGs; and p k s 2 is the actual active output of the kth at stage S2.
Objective-3 is introduced by
o b j = max p l s 2 , l
and maximizes the overloading of a branch in the network to introduce the worst disturbance.

3.3.2. Attack Constraints

The constraints of the topology–DG attack model are formulated according to the four-stage attack process as follows. The initial power flow information at stage S0 is calculated from (17) and based on an optimal power flow (OPF) function, as discussed and formulated in the following subsection. Equations (9)–(12) show the restrictions of tampering with data in stage Sa as well as the detections of BDD and TEI, given by (4)–(8). Equation (18) presents the newly calculated optimal dispatching at stage S1. Finally, a new power flow distribution is formed at stage S2 based on the new dispatch orders. Following the new instructions from the control center, the VPP aggregator in stage S2 readjusts the outputs of submissive DGs constrained by (19) and (20) that cover the situations in which the control center overestimates or underestimates the response capabilities of DGs after receiving the falsified data. The power flow of the physical system in stage S2 is constrained by (21)–(24).
{ p k s 0 , q k s 0 , P i j s 0 , Q i j s 0 } = f opf ( ϑ , p , q )
{ p k s 1 , q k s 1 , P i j s 1 , Q i j s 1 } = f opf ( ϑ ¯ , p ¯ , q ¯ )
p k s 2 = p k s 1 ,   p k cap , min p k s 1 p k cap , max p k cap , max ,   p k s 1 > p k cap , max p k cap , min ,   p k s 1 < p k cap , min
q k s 2 = q k s 1 ,   q k cap , min q k s 1 q k cap , max q k cap , max ,   q k s 1 > q k cap , max q k cap , min ,   q k s 1 < q k cap , min
p i s 2 = p k s 2 + p i load + V i s 2 j i V j s 2 ( g i j cos θ i j s 2 + b i j sin θ i j s 2 ) , i j l
q i s 2 = q k s 2 + q i load + V i s 2 j i V j s 2 ( g i j sin θ i j s 2 b i j cos θ i j s 2 ) , i j l
p i j s 2 = V i s 2 V j s 2 ( g i j cos θ i j s 2 + b i j sin θ i j s 2 ) + g i j ( V i s 2 ) 2 , i j l
q i j s 2 = V i s 2 V j s 2 ( g i j sin θ i j s 2 b i j cos θ i j s 2 ) + b i j ( V i s 2 ) 2 , i j l
In the above equations, fopf (‧) represents the optimal power flow function; superscript s0, s1, and s2 denote, respectively, stage S0, S1, and S2 of the attack; subscript i denotes node-i; p k s 2 and q k s 2 are the active and reactive power outputs of the kth DG; superscripts max and min denote, respectively, the actual maximum and minimum capacities; pi and qi are the active and reactive power injections into node i; p i load and q i load are the active and reactive demand at node i; Vi is the voltage magnitude at node i; gij and bij are the conductance and susceptance of branch ij, respectively; and θij is the angle difference between nodes i and j.

3.3.3. Optimal Dispatching Model

The optimal power flow model used in stages S0 and S1 generates stable and accurate simulations of DSO’s dispatch instruction, which ensures the success of the topology–DG attack. The optimal power flow model used in (16) and (17) is formulated based on a SOCP relaxed branch flow model, as shown in (25), where variables I′ = I2 and V′ = V2 are introduced. We assume a strong control center to handle dispatching all energy sources, i.e., substations and the DGs of VPP, and its objective is to minimize the power purchasing costs from the main grid and the VPP aggregator, as shown in (25a). The power flow constraints are modeled in (25b)–(25g). Equations (25h)–(25i) and (25j)–(25l), respectively, show the operational constraints of the RESs (e.g., wind and solar) and ESSs. Equation (25m) is the constraint of supply–demand between the VPP aggregator and the DSO.
min { p sub , p VPP } i N sub π main p i sub + k N VPP π VPP p k
s.t.
p f i I f i r f i j N i p i j p i load + p k = 0 , i N f
q f i I f i x f i j N i q i j q i load + q k = 0 , i N f
V j = V i 2 ( P i j r i j + x i j Q i j ) + ( r i j 2 + x i j 2 ) I i j
2 P i j 2 Q i j I i j V i 2 I i j + V
( V i min ) 2 V i ( V i max ) 2
( I i min ) 2 I i ( I i max ) 2
p k min p k p ¯ k , k Ω RES
q k min q k q ¯ k , k Ω RES
0 p k ch / η ch p ¯ k ch , k Ω BAT
0 p k dch η dch p ¯ k dch , k Ω BAT
S O C k min S O C k + P k ch P k dch E k S O C k max
k N VPP p k = P AS
where f is the parent node of node i; PAS is the total power demand the control center requested; and ΩRES and ΩESS are the DG sets of RES and ESS, respectively. Equation (25e) is the second-order cone form and equivalent to I i j P i j 2 + Q i j 2 V i .

4. Hybrid Solution Method

To solve the topology–DG attack model, a hybrid optimization framework is designed and presented here which contains 4 submodules according to the main functions. Figure 3 shows the flowchart of this optimizing solution.
The proposed model is a multi-nested mixed integer non-linear problem (MINLP) where the decision variables on the topology attack and DG outputs are, respectively, binary and continuous variables. The active state estimation calculation is based on the WLS, which is inapplicable for mathematical optimization methods; thus, the PSO is adopted for merging the submodules and searching for an optimal attack strategy. Each particle of the PSO (i.e., an individual set of responses generated by the PSO) enters each submodule sequentially to analyze its impact. Then, these outputs are gathered to calculate the fitness values of each individual set of responses. The core of the optimization is to find a robust and feasible strategy for the attacker, who often does not require an absolute optimal attack vector at all times. To launch a successful cyber-attack, an attacker only has to carry out an accurate simulation on the optimal dispatch of DSO at stage S1 because the re-dispatch instruction will directly cause damage to the physical system. The optimal dispatch submodule is presented below. Solving the problem consists of the following five steps:
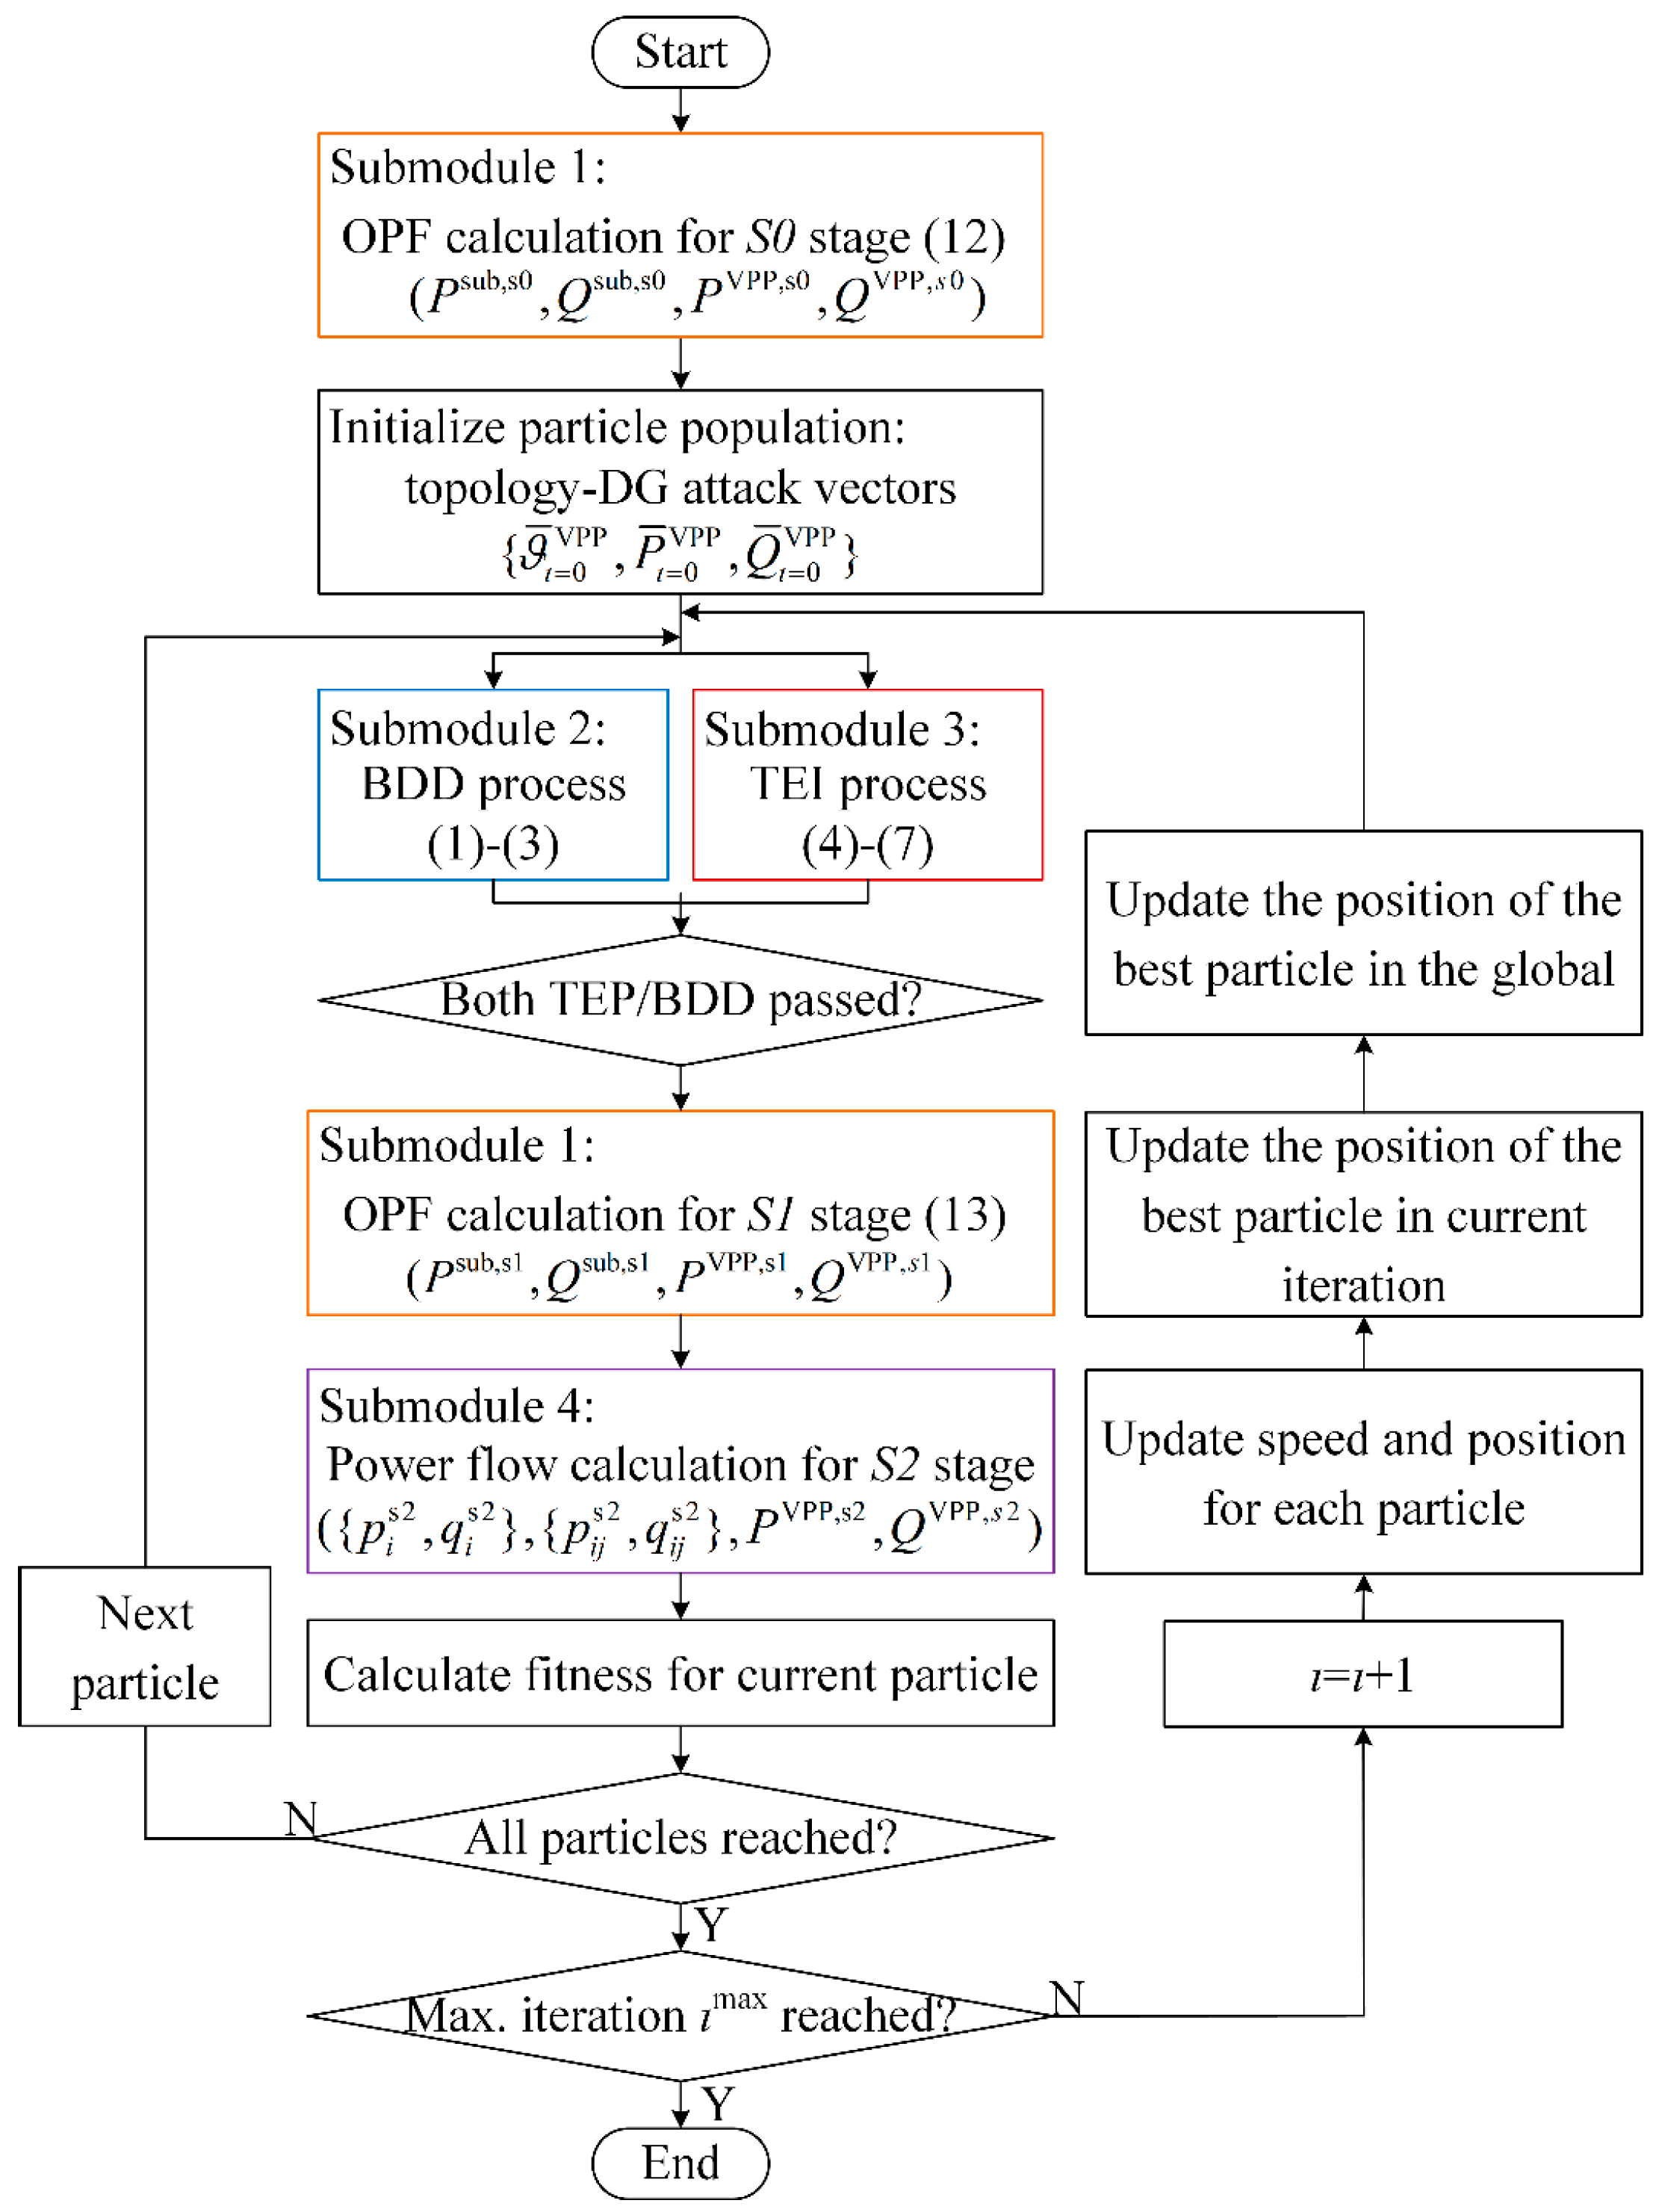
  • Initializing population: Preparing the operation data for stage S0 and initializing the population in the form of an individual set of responses composed of a group of attack variables.
  • Bypassing BDD and TEI: Generating noised attack vectors based on each particle’s information. The BDD and the TEI submodules are simulated to decide whether the attack vector of each particle is allowed to enter the control center. If the attack vector passes both detections, then it enters the control center; otherwise, the particle is eliminated.
  • Calculating new dispatch instructions: Simulating the dispatch decision for the misguided DSO at stage S1.
  • Defining damages on the physical system: Calculating the new power flow for the physical distribution system with the misguided instructions and the fitness of each individual is calculated.
  • Updating populations: Updating the position and velocity for each PSO particle and updating the information of the best particle and starting the solving process of the next iteration until the optimization process reaches the maximum iterating number.
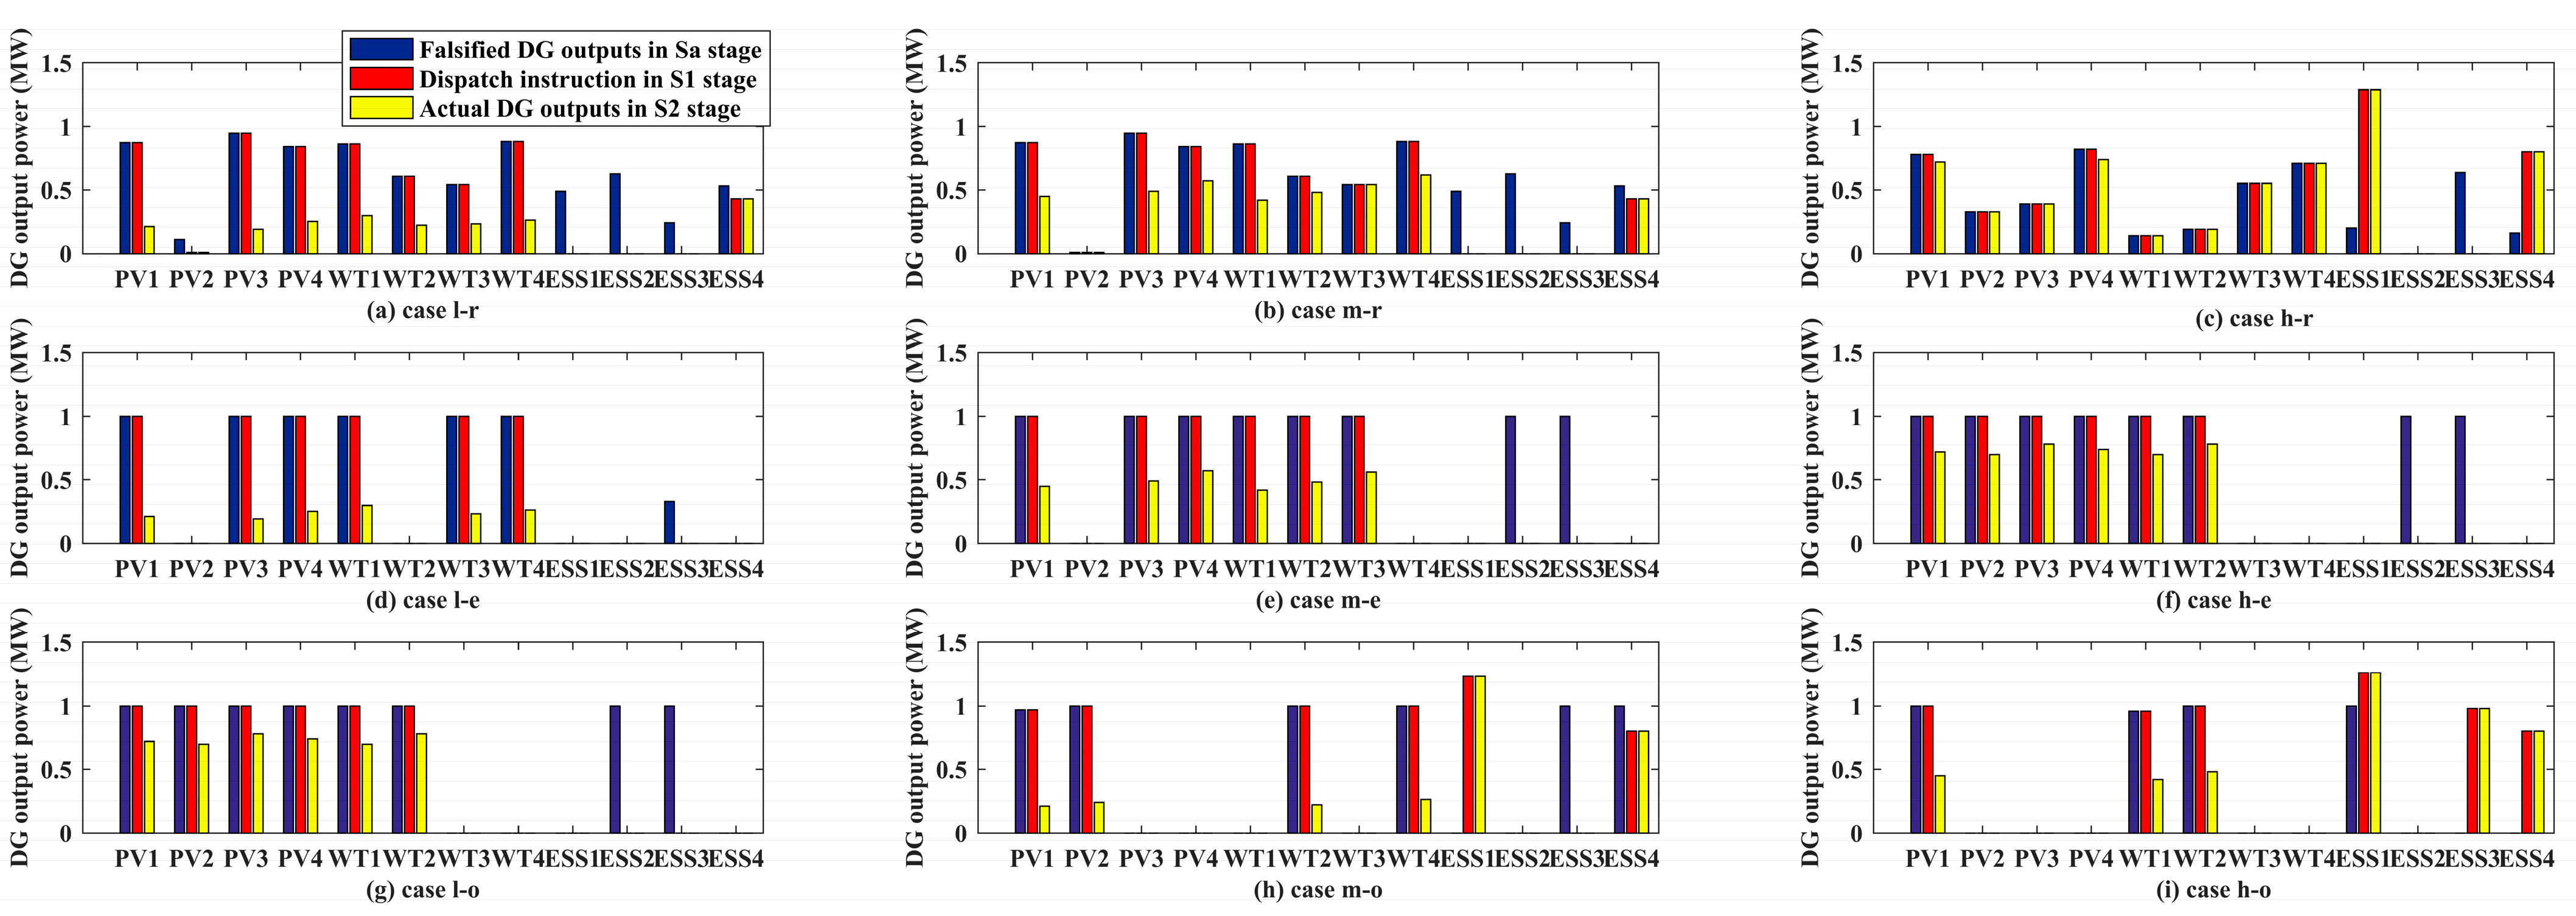
5. Case Study

To evaluate the performance, effectiveness, and superiorities of the proposed attack model with different attack objectives and RES penetration levels, a numerical study has been conducted and discussed here. A modified version of the 62-node CPPS of [35] is used here as the study case. As shown in Figure 4, on the physical side, the distribution network consists of 12 DGs and 65 lines (including 5 contact lines), with the DG parameters listed in Table 1. On the cyber side, each sectional switch is equipped with an FTU, each breaker is equipped with a DTU, and each DG is equipped with a meter and a VEC. Thus, the CPPS has a total of 142 m/sensors, including 65 × 2 m, respectively, for digital and analog measurements of branches and 12 m for the DGs. A VPP aggregator is deployed to manage DGs in this system and their communications are realized based on the public internet. The power output commands assigned by the control center PAS are fixed at 6 MW. To demonstrate the effectiveness of the proposal, 9 cases combined with three objectives and three RES levels are assumed, as listed in Table 2. Furthermore, other state-of-the-art FDIA methods are compared to show the superiority of the proposal model, including:
  • Line-switch topology attack on the measurements of topology and power flow [17];
  • Load-altering attack (LAA) on traditional electrical loads [11].
The studies are conducted in MATLAB 2020a on a PC (Intel i7-12700Kf, 32GB RAM). The SOCP optimal power flow calculations in stages S0 and S1 are built by Yalmip and solved by GUROBI, while the active state estimation is based on the WLS method, and the power flow calculations are conducted with the help of MATPOWER.

5.1. Performance Evaluation

5.1.1. Objective-1: Minimizing the Attack Resource

Objective-1 is designed for an attacker with limited attack resources that aims to disturb the operation of the distribution system. This objective minimizes the number of manipulated meters while causing at least one feeder to overload at stage S2, as suggested by (13)–(14). The topology attack vector and the number of manipulated meters under different RES levels are listed in Table 3, and the DG attack vector, along with the misguided dispatch instructions at stage S1 and the actual DG outputs at stage S2, are depicted in Figure 5.
From the perspective of a cyber-attacker, the attack target will bring disturbance to the physical system. As seen from Table 3, the overloaded feeders appear in stage S2 in all cases, while no feeder is overloaded at stage S1. The most serious situation is in the case l-r, with a 107.06% load rate on a branch 43-44. On the attack investment side, the number of manipulated meters shows an increase with the RES level. The total number of manipulated meters increases from 51 (out of 142) at the low RES level to 58 at the high RES level, where this change is mainly due to more power flow measurements being falsified, from 35 (out of 65) at the low RES level to 45 at the high RES level. Respectively, 12, 12, and 11 DGs are manipulated in these three cases, and their power outputs are characterized by RES levels, as detailed in Figure 5.
It can be seen from Figure 5a–c that the output power of RES at stage Sa (blue bars) is consistent with that in stage S1 (red bars) because the operator needs to consume renewable energy as much as possible. However, the VPP operator does not realize that they are receiving the manipulated DG output information, misleading the operator to make wrong decisions for the next dispatch period (i.e., stage S1). Upon receiving the misguided dispatch order, the VPP aggregator must check the power response ability of each DG. As demonstrated in Figure 5, the actual output power of each DG (yellow bars) is less than or equal to the related blue bars, and the power response ability increases with the increase in RES level. Meanwhile, the ESSs affected by the cyber-attack cannot fill the VPP’s output gap but comply with the misguided instructions and are on standby. The VPP power gaps in the cases l-r, m-r, and h-r are, respectively, 3.90, 1.99, and 0.14 MW. In terms of bus voltage, the attack at a mid-level of RES resulted in a minimum voltage magnitude of 0.8258. Thus, the study demonstrates that the increasing RES penetration level may mitigate the impact of cyber-attacks on the VPP.

5.1.2. Objective-2: Minimizing the Revenue of VPP Aggregator

Objective-2 minimizes the net revenue of the VPP aggregator and is designed for an attacker that aims to hinder the financial profit of the VPP aggregator, as shown in (14). The topology attack vector and the number of manipulated meters of this objective under different RES levels are listed in Table 4, while Figure 6 shows the DG output information, including the attack vectors, the misguided orders, and the actual power outputs of cases l-e, m-e, and h-e.
After receiving falsified system information, the VPP’s decision-maker calculates the power flow and comes out with an expected state of operation, including an expected VPP benefit of JPY 17,190 and an expected power supply of 6 MW among the three cases, as seen in Table 4. However, the misguided instructions lead to the aggregator’s economic losses in actual operation (i.e., stage S2), as well as the response power. After being attacked and receiving wrong instructions, the net revenues of the VPP aggregator in the three cases are, respectively, JPY 4127, 8508, and 12,641, while the total power outputs of VPP are, respectively, 1.44, 2.97, and 4.42 MW. Like Objective-1, the values of Objective-2 also show a correlation with the RES level, and the profit loss and the output power in stage S2 decrease with the increase in the RES level.
More information about DG output power is demonstrated in Figure 5d–f, which shows that the RES outputs in all the attack vectors are either 0 or 1 MW, and their sum is 6 MW. Meanwhile, all the ESSs are inactive at stage S1 because, according to the manipulated information received by the VPP’s decision-maker, the outputs of RESs meet the requirement of the distribution system. In terms of bus voltage, the attack at a low level of RES resulted in a minimum voltage magnitude of 0.8851. These results show that the attacker tries to enlarge the gap between the actual power response ability and the falsified outputs of RESs. Accordingly, the gap between the expected revenue and the actual revenue is dilated. Nonetheless, the output gap will shrink as the RES level increases. Therefore, the study illustrates that the VPP aggregators operating at low RES levels are more vulnerable to economic-oriented cyber-attacks.

5.1.3. Objective-3: Maximizing the Overload Rate of One Feeder

Objective-3 represents an aggressive attacker that aims at bringing the most serious physical impact, represented by the maximum overload power of a feeder, as shown by (15). Table 5 shows this attack’s information and situations of the actual physical system after the cyber-attack in cases l-o, m-o, and h-o. The DG output results in these cases are also given in Figure 5g–i.
It can be seen from Table 5 that the different attack vectors are injected into the CPPS while they have the same objective value, i.e., branches 43-44 with a demand of 11.386 MW and a loading of 113.86%. This is the highest overloading of a branch in the considered test system when the DGs downstream of branches 43-44, including PV2, PV3, WT3, and ESS2, upload zero power, which is the common characteristic between cases l-o, m-o, and h-o, as shown in Figure 7. Following misguided dispatch orders and shutting down the DGs, the VPP aggregators cannot aggregate enough power supply to the distribution system and leave behind power gaps of 3.04, 1.59, and 0.78 MW, respectively, in cases l-o, m-o, and h-o. In terms of bus voltage, the attack at a low level of RES resulted in a minimum voltage magnitude of 0.8721. Because of the lack of power supply from the VPP resulting from this kind of cyber-attack, the distribution network may apply unrequired load-shedding.

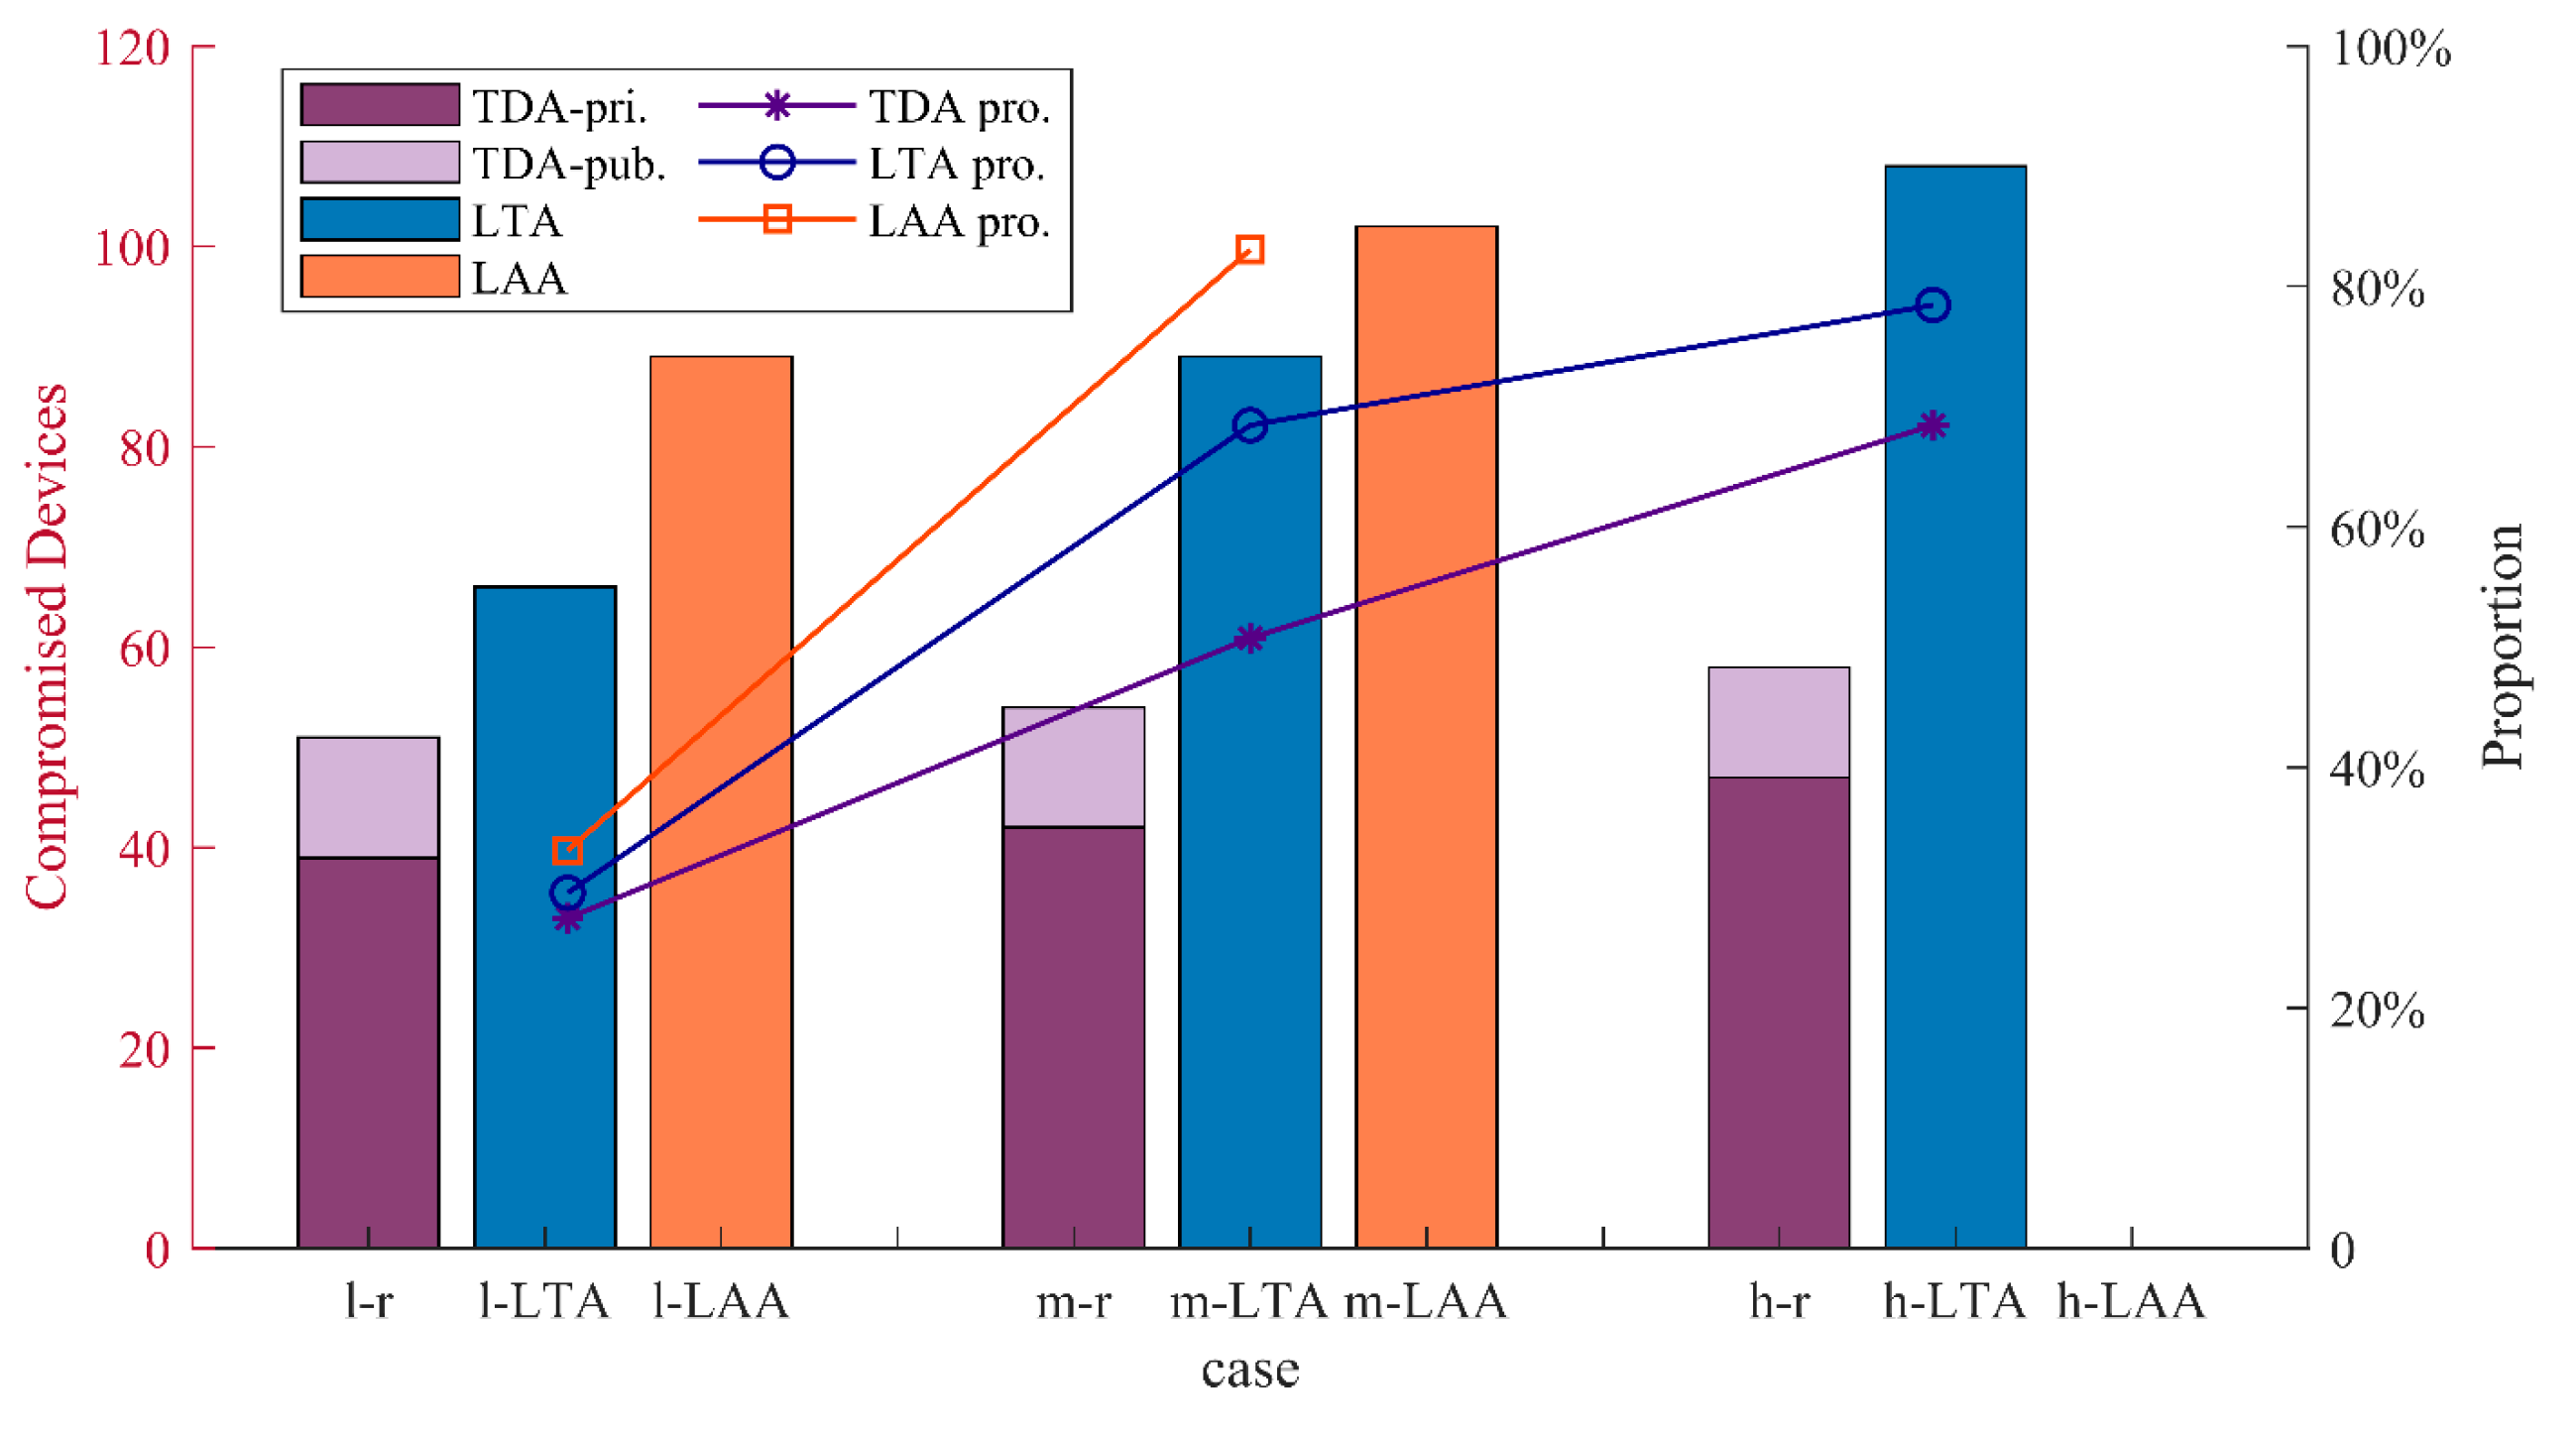
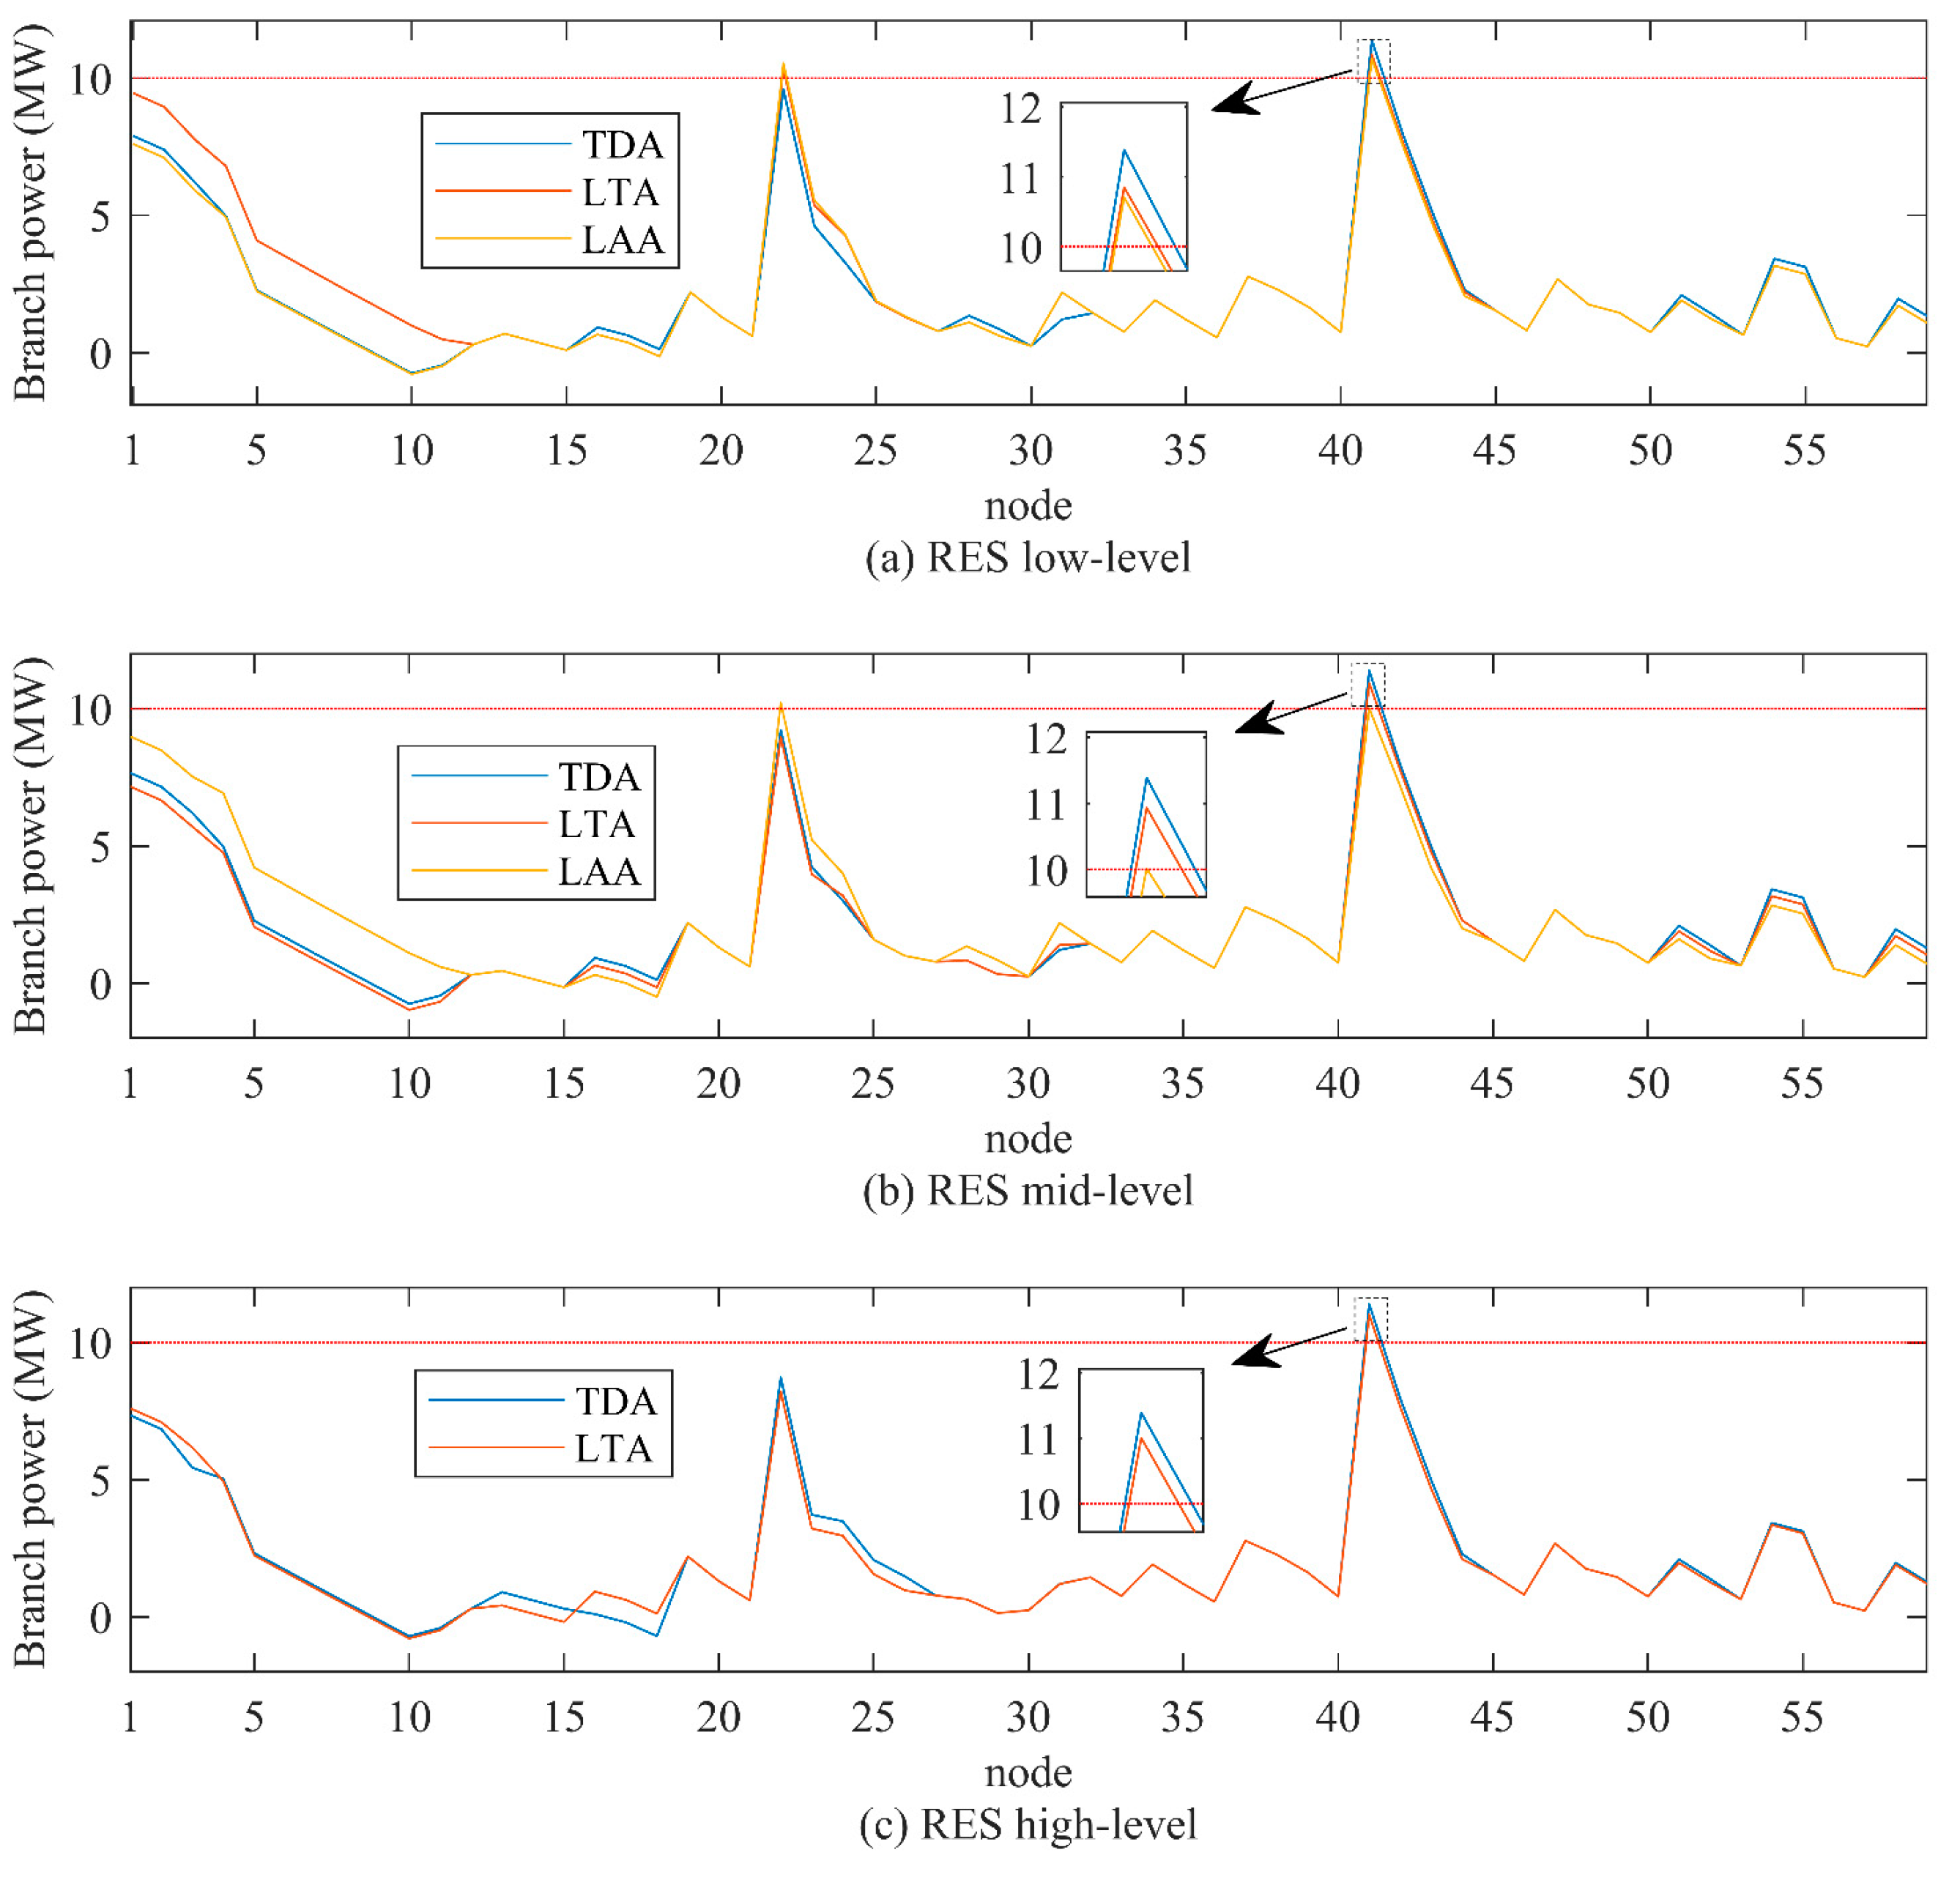
5.2. Comparative Analysis

Objectives 1 and 3 aim to impair the power system, an issue that has been widely investigated as the target of cyber-attacks in literature. As such, two existing FDIA models of line-switch topology attack (LTA) [17] and LAA [11] are selected here to compare the performance of the proposed topology–DG attack against them within the study case of Figure 4. The LTA manipulates the network topology information and the relevant power flow measurements, while the LAA alters the load information of the power system.
Objective-1 endangers system operation while seeking a low-budget attack strategy. Figure 6 depicts the number and the proportion of compromised devices in three cyber-attacks under different RES levels. LTA, respectively, manipulates 66, 89, and 108 devices under the low-, mid-, and high-RES levels, and the proportions of manipulated devices are, respectively, 50.77, 68.45, and 83.08%. On the other hand, the LAA manipulates 96 and 102 devices, respectively, in the low- and mid-RES levels (i.e., 73.86 and 78.46%), and no feasible solution is found at the high-RES level. With the proposed topology–DG attack, fewer devices are manipulated compared to the LTA and LAA cases (i.e., 39, 42, and 47 devices in the private network, and 12, 12, and 11 devices in the public network, under the three RES levels). By manipulating VECs in the VPP from the public side, cyber-attackers can put fewer resources into attacking the devices of the private network. Since the public network is completely open to outsiders, tampering with VEC information is easier than tampering with the devices of the private network. Therefore, the emergence of VPP along with the forming of the PPPN, allows cyber-attackers to introduce disturbance at lower costs and leads to a more vulnerable power system from the DSO perspective.
More aggressive cyber-attacks to maximize the loading of a branch are studied, and the power flow results of the distribution system under different cyber-attack strategies are shown in Figure 7. The target branches of the LTA are branches 43-44 as well, and the objective values are 10.85, 10.93, and 11 MW, respectively, under low-, mid-, and high-RES levels. The LAA attacks branches 23-24 and 43-44 with a loading of, respectively, 10.71 and 10.22 MW under low- and mid-RES levels and no overloaded under the high-RES level. The proposal outperforms the LTA and LAA and reaches the highest loading of 11.386 MW on branches 43-44 under each RES level. This is because the proposed method simultaneously coordinates the attack resources on topology information and DG output information, while the existing methods are limited to one of those. Hence, the cyber-attacks on manipulating topology and DG output can cause a more serious situation for the power system.
The proposed TDA model is designed to address the unique vulnerabilities and operational characteristics of VPP-integrated PPPN environments, which are not fully captured by traditional models. In scenarios involving PPPN, the TDA model shows better capabilities in launching long-term and multi-stage FDIAs that introduce more severe consequences. As shown in Table 3, Table 4 and Table 5, the proposed TDA exerts significant impacts on the PPPN when VPP power outputs are their lowest. Compared to the LTA and LAA models, the TDA model highlights that an insufficient energy storage system or emergency power supply will significantly increase the vulnerability of the distribution network, especially under the high-level RES penetration circumstance. Attackers can disrupt the actual operation of the power grid by falsifying data transmitted between the VPP and the DSO, potentially causing line overloads, RES shutdowns, or even widespread power outages. This points out the critical need for robust defensive measures, such as enhanced data integrity verification and resilient energy storage systems, to mitigate the risks posed by such FDIAs in PPPNs. However, the assumption of a strong DSO here results in the neglect of interactions among DGs, which may lead to severe consequences in scenario evaluations. The autonomous control of DGs enables partial deviation from compromised power dispatch commands caused by cyber-attacks, allowing prioritization of local operational status monitoring, thus effectively mitigating operational stress on the power grid.

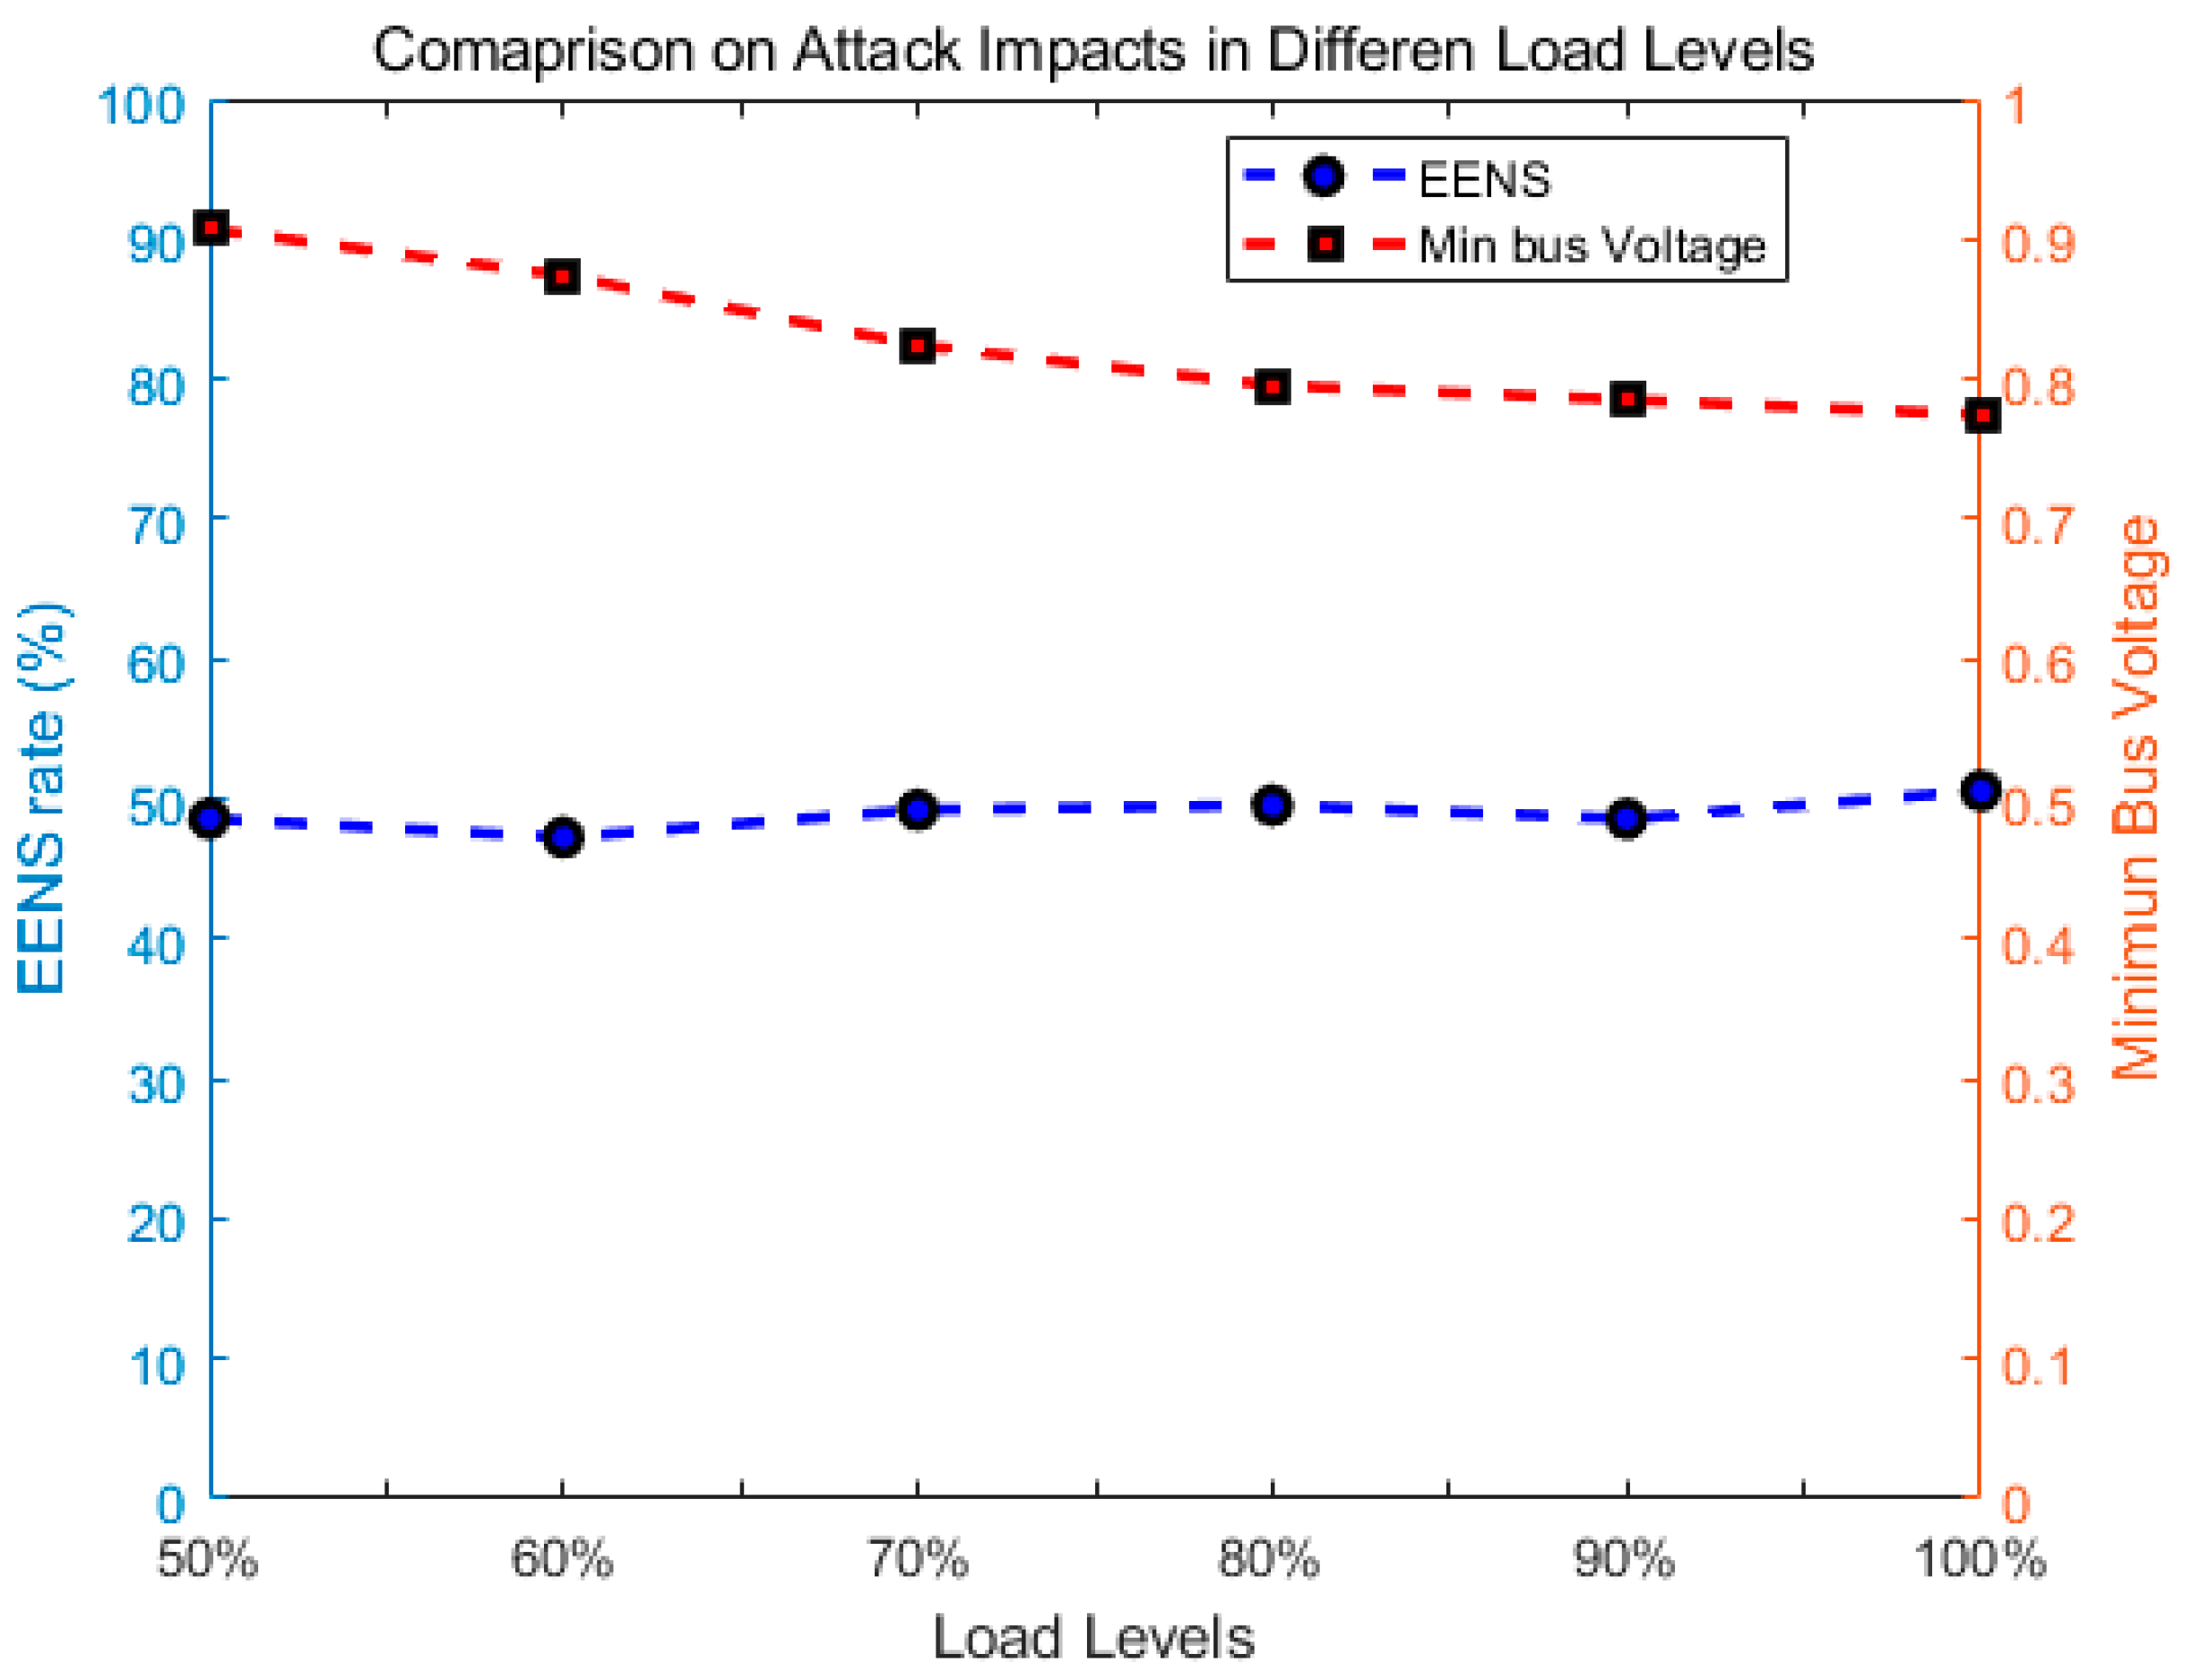
5.3. Robustness Analysis

In this part, a comparative experiment is designed to evaluate the effects of attacks at different load levels, aiming to verify the robustness of the proposed TDA under load uncertainty. As shown in Figure 8, six load levels are designed, Objective-1 is selected as the attack strategy, and RES output is fixed at the mid-level. The indices of the analysis focus on the expected energy not supplied (EENS) and the minimum value of bus voltage magnitude.
It can be observed that at the levels of 50% to 100% of the maximum load, the power supply shortfall resulting from the attack on the grid is approximately 50%. Among these cases, the 60% load level case shows the lowest EENS, with a loss of 47.25%, and the maximum load level case has the highest EENS, with a loss of 51.57%. This indicates that the proposed model can exert a similar impact on the grid across different load levels, demonstrating good robustness. Regarding the bus voltage magnitude, as the load level increases, the impact of the proposed TDA on the voltage magnitude becomes more pronounced. At a load level of 50%, the minimum bus voltage magnitude is 0.9071, while at a load level of 100%, it decreases to 0.7745. As the load increases, the voltage drop effect caused by the attack becomes increasingly pronounced. This change indicates that the voltage stability of the grid under attack deteriorates, resulting in a significant reduction in voltage magnitude. This phenomenon reflects the grid’s sensitivity to external disturbances under high load conditions. It is noteworthy that one of the assumptions in this paper is that attackers possess complete grid information to launch FDIAs. In power grid cybersecurity practices, this challenge can be addressed by developing encryption and authentication mechanisms for topology and DG data, thereby limiting attackers’ access to partial information and increasing the difficulty of intrusions. Furthermore, machine learning-based detection strategies enable the identification of anomalies in transmitted data.

6. Conclusions

The growing interest in the VPP business is resulting in a transition from the private power network to PPPNs, bringing new vulnerabilities to the cyberspace of the power system. This paper presents a new FDIA model that considers both the topology and DG output power information in the attack model, misleading the decision of the DSO with falsified information. The proposed model was formulated as a MINLP and solved by a hybrid optimization framework. Multiple objectives were designed considering the different goals of the attacker. Simulation results demonstrate that the proposed attack model can bring more severe damage to the distribution system with lower costs for the attacker. Tampering with tenuous devices in the public network, the attacker can manipulate fewer meters on the private side. The results also show that for distribution networks with high RES penetration, the impact of attack during low DG output periods is three times greater than during high output periods.
In this paper, notable limitations that warrant further exploration, such as the focus on specific attack paths, may ignore the complexity of multi-faceted threats such as cyber-attacks on multi-energy integrated systems [36]. These could exploit various vulnerabilities within the modern distribution system. Future research should aim to develop more comprehensive attack detection and prevention models, which improve the resilience of system operation.

Author Contributions

Conceptualization, X.S.; Methodology, S.X., J.Y. and X.S.; Software, J.G.; Formal analysis, S.W.; Investigation, S.W., J.G. and S.X.; Data curation, S.X.; Writing—original draft, S.W. and J.G.; Visualization, J.G. and J.Y.; Supervision, J.Y. and X.S. All authors have read and agreed to the published version of the manuscript.

Funding

This research received no external funding.

Data Availability Statement

The original contributions presented in the study are included in the article, further inquiries can be directed to the corresponding author.

Conflicts of Interest

The authors declare no conflict of interest.

Abbreviations

BDDBad Data Detection
CPPSCyber–Physical Power System
DGDistributed Generator
DSODistribution System Operator
DTUDistribution Terminal Unit
EMSEnergy Management System
ESSEnergy Storage System
FDIAFalse Data Injection Attack
FTUFeeder Terminal Unit
TDATopology-Distributed-Generator Attack
LAALoad-Altering Attack
LTALine-Switch Topology Attack
MINLPMixed Integer Non-Linear Problem
MITMMan-in-the-Middle
NTPNetwork Topology Processing
PPPNPublic–Private Power Network
PSOParticle Swarm Optimizer
RESRenewable Energy Sources
SCADASupervisory Control and Data Acquisition
SOCPSecond-Order Cone Programming
TEITopology Error Identification
VCCVPP Cloud Service Center
VECVPP Edge Service Center
VPPVirtual Power Plant

References

  1. Wang, Q.; Tai, W.; Tang, Y.; Ni, M. Review of the false data injection attack against the cyber-physical power system. IET Cyber-Phys. Syst. Theory Appl. 2019, 4, 101–107. [Google Scholar]
  2. Amin, M.; El-Sousy, F.F.M.; Aziz, G.A.A.; Gaber, K.; Mohammed, A. CPS Attacks Mitigation Approaches on Power Electronic Systems with Security Challenges for Smart Grid Applications: A Review. IEEE Access 2021, 9, 38571–38601. [Google Scholar]
  3. Hasan, M.K.; Habib, A.K.M.A.; Shukur, Z.; Ibrahim, F.; Islam, S.; Razzaque, M.A. Review on cyber-physical and cyber-security system in smart grid: Standards, protocols, constraints, and recommendations. J. Netw. Comput. Appl. 2023, 209, 103540. [Google Scholar]
  4. Liang, G.; Weller, S.R.; Zhao, J.; Luo, F.; Dong, Z.Y. The 2015 Ukraine Blackout: Implications for False Data Injection Attacks. IEEE Trans. Power Syst. 2017, 32, 3317–3318. [Google Scholar]
  5. Xin, B.; Li, M.; He, J.; He, J.; Sun, W. Research on Security Defense System of New Power System. Proc. CSEE 2023, 43, 5723–5731. [Google Scholar]
  6. Chen, J.; Lu, B.; Feng, Y.; Li, X. Value Co-production Model and Mechanism of Regional Energy Internet Ecosystem Under the Concept of Sharing. Proc. CSEE 2022, 42, 8103–8116. [Google Scholar]
  7. Tuyen, N.D.; Quan, N.S.; Linh, V.B.; Tuyen, V.; Fujita, G. A Comprehensive Review of Cybersecurity in Inverter-Based Smart Power System Amid the Boom of Renewable Energy. IEEE Access 2022, 10, 35846–35875. [Google Scholar]
  8. Song, Y.; Liu, X.; Li, Z.; Shanhidehpour, M.; Li, Z. Intelligent data attacks against power systems using incomplete network information: A review. J. Mod. Power Syst. Clean Energy 2018, 6, 630–641. [Google Scholar]
  9. Yang, H.; He, X.; Wang, Z.; Qiu, R.C.; Ai, Q. Blind False Data Injection Attacks Against State Estimation Based on Matrix Reconstruction. IEEE Trans. Smart Grid 2022, 13, 3174–3187. [Google Scholar]
  10. Reda, H.T.; Anwar, A.; Mahmood, A. Comprehensive survey and taxonomies of false data injection attacks in smart grids: Attack models, targets, and impacts. Renew. Sustain. Energy Rev. 2022, 163, 112423. [Google Scholar] [CrossRef]
  11. Khan, O.G.M.; El-Saadany, E.F.; Youssef, A.; Shaaban, M.F. Cyber Security of Market-Based Congestion Management Methods in Power Distribution Systems. IEEE Trans. Ind. Inform. 2021, 17, 8142–8153. [Google Scholar] [CrossRef]
  12. Lu, K.D.; Wu, Z.G. Multi-Objective False Data Injection Attacks of Cyber–Physical Power Systems. IEEE Trans. Circuits Syst. II Express Briefs 2022, 69, 3924–3928. [Google Scholar]
  13. Tu, H.; Xia, Y.; Chi, K.T.; Chen, X. A Hybrid Cyber Attack Model for Cyber-Physical Power Systems. IEEE Access 2020, 8, 114876–114883. [Google Scholar] [CrossRef]
  14. Xu, S.; Xia, Y.; Liang, H. Analysis of Malware-Induced Cyber Attacks in Cyber-Physical Power Systems. IEEE Trans. Circuits Syst. II Express Briefs 2020, 67, 3482–3486. [Google Scholar]
  15. Lu, K.; Wu, Z.; Huang, T. Differential Evolution-Based Three Stage Dynamic Cyber-Attack of Cyber-Physical Power Systems. IEEE/ASME Trans. Mechatron. 2023, 28, 1137–1148. [Google Scholar]
  16. Kim, J.; Tong, L. On Topology Attack of a Smart Grid: Undetectable Attacks and Countermeasures. IEEE J. Sel. Areas Commun. 2013, 31, 1294–1305. [Google Scholar]
  17. Liang, G.; Weller, S.R.; Zhao, J.; Luo, F.; Dong, Z.Y. A Framework for Cyber-Topology Attacks: Line-Switching and New Attack Scenarios. IEEE Trans. Smart Grid 2019, 10, 1704–1712. [Google Scholar]
  18. Liu, C.; He, W.; Deng, R.; Tian, Y.; Du, W. False-Data-Injection-Enabled Network Parameter Modifications in Power Systems: Attack and Detection. IEEE Trans. Ind. Inform. 2023, 19, 177–188. [Google Scholar]
  19. Ismail, M.; Shaaban, M.F.; Naidu, M.; Serpedin, E. Deep Learning Detection of Electricity Theft Cyber-Attacks in Renewable Distributed Generation. IEEE Trans. Smart Grid 2020, 11, 3428–3437. [Google Scholar] [CrossRef]
  20. Gu, W.; Ding, S.; Lu, S.; Zhao, P.; Zou, D.; Qiu, Y.; Yu, R.; Sheng, L. Coordinated Heat and Power Cyber-attacks With Time Window Matching Strategy. IEEE Trans. Smart Grid 2023, 14, 2747–2761. [Google Scholar]
  21. Jhala, K.; Natarajan, B.; Pahwa, A.; Wu, H. Stability of Transactive Energy Market-Based Power Distribution System Under Data Integrity Attack. IEEE Trans. Ind. Inform. 2019, 15, 5541–5550. [Google Scholar] [CrossRef]
  22. Li, P.; Liu, Y.; Xin, H.; Jiang, X. A Robust Distributed Economic Dispatch Strategy of Virtual Power Plant Under Cyber-Attacks. IEEE Trans. Ind. Inform. 2018, 14, 4343–4352. [Google Scholar]
  23. Fotis, G.; Vita, V.; Maris, T.I. Risks in the European Transmission System and a Novel Restoration Strategy for a Power System after a Major Blackout. Appl. Sci. 2023, 13, 83. [Google Scholar]
  24. Hou, J.; Wang, J.; Song, Y.; Sun, W.; Hou, Y. Small-Signal Angle Stability-Oriented False Data Injection Cyber-Attacks on Power Systems. IEEE Trans. Smart Grid 2023, 14, 635–648. [Google Scholar]
  25. Zhang, H.; Li, Z.; Xue, Y.; Chang, X.; Su, J.; Wang, P.; Guo, Q.; Sun, H. A Stochastic Bi-Level Optimal Allocation Approach of Intelligent Buildings Considering Energy Storage Sharing Services. IEEE Trans. Consum. Electron. 2024, 70, 5142–5153. [Google Scholar]
  26. Palomino, A.; Giraldo, J.; Parvania, M. Graph-Based Interdependent Cyber-Physical Risk Analysis of Power Distribution Networks. IEEE Trans. Power Deliv. 2023, 38, 1510–1520. [Google Scholar]
  27. Meng, Y.; Zhang, H.; Fan, W. Analysis of the Network Structure Characteristics of Virtual Power Plants Based on a Complex Network. Electr. Power Syst. Res. 2022, 204, 107717. [Google Scholar] [CrossRef]
  28. Hui, H.; Ding, Y.; Shi, Q.; Li, F.; Yan, J. 5G Network-Based Internet of Things for Demand Response in Smart Grid: A Survey on Application Potential. Appl. Energy 2020, 257, 113972. [Google Scholar] [CrossRef]
  29. Rahim, S.; Wang, Z.; Ju, P. Overview and Applications of Robust Optimization in the Avant-Garde Energy Grid Infrastructure: A Systematic Review. Applied Energy 2022, 319, 119140. [Google Scholar]
  30. Li, Q.; Zhang, J.; Zhao, J.; Ye, J.; Song, W.; Li, F. Adaptive Hierarchical Cyber Attack Detection and Localization in Active Distribution Systems. IEEE Trans. Smart Grid 2022, 13, 2369–2380. [Google Scholar] [CrossRef]
  31. Ye, J.; Giani, A.; Elasser, A.; Mazumder, S.K.; Farnell, C.; Mantooth, H.A.; Kim, T.; Liu, J.; Chen, B.; Seo, G.; et al. A Review of Cyber–Physical Security for Photovoltaic Systems. IEEE J. Emerg. Sel. Top. Power Electron. 2022, 10, 4879–4901. [Google Scholar] [CrossRef]
  32. Yin, H.; Liu, D.; Chen, G. Coordinated Cyber-attack Model and Cross-space Fault Propagation Mechanism for Virtual Power Plant. Autom. Electr. Power Syst. 2023, 47, 34–43. [Google Scholar]
  33. Jena, P.K.; Ghosh, S.; Koley, E. Design of a coordinated cyber-physical attack in IoT based smart grid under limited intruder accessibility. Int. J. Crit. Infrastruct. Prot. 2021, 35, 100484. [Google Scholar] [CrossRef]
  34. Jena, P.K.; Ghosh, S.; Koley, E.; Mohanta, D.K.; Kamwa, I. Design of AC state estimation based cyber-physical attack for disrupting electricity market operation under limited sensor information. Electr. Power Syst. Res. 2022, 205, 107732. [Google Scholar] [CrossRef]
  35. Liang, Y.; Bai, M.; Liu, K.; Liu, D.; Qi, D.; Guo, Q. Cyber-physical Test Case for Distribution Grid Operation and Control. CSEE J. Power Energy Syst. 2023, 9, 707–721. [Google Scholar]
  36. Zhai, X.; Li, Z.; Li, Z.; Xue, Y.; Chang, X.; Su, J.; Jin, X.; Wang, P.; Sun, H. Risk-averse energy management for integrated electricity and heat systems considering building heating vertical imbalance: An asynchronous decentralized approach. Appl. Energy 2025, 383, 125271. [Google Scholar] [CrossRef]
Figure 1. The PPPN framework illustrating the power and data flow.
Energies 18 01597 g001
Figure 2. Schematic illustration of a topology–DG attack procedure.
Energies 18 01597 g002
Figure 3. Proposed flowchart for solving the topology–DG attack model.
Energies 18 01597 g003
Figure 4. Considered 62-node CPPS illustrating the assumed 12 DGs and 142 m/sensors.
Energies 18 01597 g004
Figure 5. Results of three objectives under different RES levels.
Energies 18 01597 g005
Figure 6. Comparison of the performance of Objective-1 using the proposed technique with the LTA and LAA under different RES levels.
Energies 18 01597 g006
Figure 7. Performance comparison of Objective-3 using the proposed technique against the LTA and LAA.
Energies 18 01597 g007
Figure 8. Performance Comparison of the Proposed TDA Model on Different Load Levels.
Energies 18 01597 g008
Table 1. Assumed parameter of DGs in Figure 4.
DGsBusRated Power (MW) π k V 2 DG (¥/MW)RES Level p k act , max (MW)
LowMidHigh
PV12211500.210.450.72
PV23111500.240.510.70
PV35411500.190.490.78
PV46111500.250.570.74
WT12511200.300.420.70
WT22811200.220.480.78
WT34611200.230.560.76
WT41911200.260.620.82
ESS1121.5180\\\
ESS2531.5180\\\
ESS3110.8110\\\
ESS4331100\\\
Table 2. Cases with different RES levels.
Attack ObjectiveMin Attack Resources (r)Min VPP Revenue (e)Max Overload Power (o)
RES Level
Low (l)Case l-rCase l-eCase l-o
Mid (m)Case m-rCase m-eCase m-o
High (h)Case h-rCase h-eCase h-o
Table 3. Analysis results of Objective-1.
Casel-rm-rh-r
Sa StageTopology attack11-12(−), 18-19(−), 13-44(+), 19-35(+)11-12(−), 18-19(−), 13-44(+), 19-35(+)18-19(−), 19-35(+)
Falsified DGs12/1212/1211/12
Falsified branch meters35/6538/6545/65
Total falsified devices51/14254/14258/142
S2 StageOverloaded feeder (rate)23-24 (105.89%), 43-44 (107.06%)23-24 (102.07%)23-24 (101.30%)
Minimum bus voltage magnitude0.85250.82580.8974
Table 4. Analysis results of Objective-2.
Casel-em-eh-e
Sa stageTopology attack10-11(−), 18–19(−), 28-29(−), 13–44(+), 17-29(+), 19–35(+)9-10(−), 26–27(−), 57-60(−), 13–44(+), 17-29(+), 24–62(+)12-13(−), 18-19(−), 26-27(−), 13-44(+), 17-29(+), 19-35(+)
Falsified DGs12/1212/1212/12
Falsified branch meters44/6545/6548/65
S1 stageExpected VPP benefit¥17,190¥17,190¥17,190
Expected VPP outputs6 MW6 MW6 MW
S2 stageVPP actual benefit¥4127¥8508¥12,641
VPP actual outputs1.44 MW2.97 MW4.42 MW
Minimum bus voltage magnitude0.88510.90150.9045
Table 5. Analysis results of Objective-3.
Casel-om-oh-o
Sa stageTopology attack34-35(−), 36-37(−), 57-60(−), 3-39(+), 19-35(+), 24-62(+)12-13(−), 27-28(−), 36-37(−), 57-60(−), 3-39(+), 13-44(+), 17-29(+), 24-62(+)12-13(−), 17-18(−), 37-38(−), 57-60(−), 3-39(+), 13-44(+), 19-35(+), 24-62(+)
Falsified DGs10/1211/1212/12
Falsified branch meters42/6546/6553/65
S2 stageVPP actual outputs2.96 MW4.39 WM5.22 WM
Overloaded feeder (rate)43-44 (113.86%), 23-24 (106.59%)43-44 (113.86%)43-44 (113.86%)
Minimum bus voltage magnitude0.87120.89640.9125
Disclaimer/Publisher’s Note: The statements, opinions and data contained in all publications are solely those of the individual author(s) and contributor(s) and not of MDPI and/or the editor(s). MDPI and/or the editor(s) disclaim responsibility for any injury to people or property resulting from any ideas, methods, instructions or products referred to in the content.

