Article

Strategic Demand Response for Economic Dispatch in Wind-Integrated Multi-Area Energy Systems

1
Henan Xuji Instrument Co., Ltd., Xuchang 461000, China
2
College of Electrical Engineering, Henan University of Technology, Zhengzhou 450001, China
*
Author to whom correspondence should be addressed.
Energies 2025, 18(9), 2188; https://doi.org/10.3390/en18092188
Submission received: 16 January 2025 / Revised: 12 March 2025 / Accepted: 13 March 2025 / Published: 25 April 2025

Abstract

:
The rapid integration of renewable energy sources and the increasing complexity of energy demands necessitate advanced strategies for optimizing multi-region energy systems. This study investigates the coordinated energy management of interconnected parks by incorporating wind power, demand response (DR) mechanisms, and energy storage systems. A comprehensive optimization framework is developed to enhance energy sharing among parks, leveraging demand-side flexibility and renewable energy integration. Simulation results demonstrate that the proposed approach significantly improves system efficiency by balancing supply-demand mismatches and reducing reliance on external power sources. Compared to conventional methods, the DR capabilities of industrial and commercial loads have increased by 8.08% and 6.69%, respectively, which is primarily due to enhanced utilization of wind power and optimized storage deployment. The inclusion of DR contributed to improved system flexibility, enabling a more resilient energy exchange framework. This study highlights the potential of collaborative energy management in multi-area systems and provides a pathway for future research to explore advanced control algorithms and the integration of additional renewable energy sources.

1. Introduction

The global energy landscape is undergoing a significant transformation driven by the need to mitigate climate change, improve energy efficiency, and achieve carbon neutrality [1]. The rapid depletion of fossil fuel resources, coupled with the escalating global concern over climate change, has accelerated the transition toward sustainable and efficient energy systems [2]. Integrated multi-energy systems, particularly those encompassing multi-area electricity, heating, and cooling networks, have emerged as a pivotal solution to industrial and commercial transformation [3]. Notably, grid-connected hybrid energy systems, through their energy interchange with the main grid, significantly enhance the reliability of power supply [4]. These systems are recognized for their potential to enhance energy supply security, improve system resilience, and meet dual-carbon goals of carbon peaking and neutrality [5]. Multi-area integrated energy systems (MAIESs) [6,7,8,9], which coordinate electricity, heating, and cooling networks across different regions, have emerged as a key solution for enhancing energy supply security, resilience, and sustainability [10]. These systems are pivotal for addressing spatial and temporal mismatches in energy demand and supply, particularly as renewable integration grows, with wind and solar power enhancing grid resilience by adapting to energy fluctuations and demand peaks, thereby ensuring stable and reliable operation [11]. The incorporation of a demand response (DR) program [12,13,14,15], along with volt/var optimization techniques [16], can further enhance the adaptability and flexibility of MAIESs, enabling real-time load adjustments to optimize energy usage. The collaborative optimization of MAIESs with DR and renewable energy represents a promising approach to achieving economic and environmental objectives [17]. Despite significant progress, challenges remain in integrating multi-energy flows across zones, addressing uncertainties in renewable energy generation, and incorporating user-centric demand flexibility [18]. Advanced optimization strategies, including decentralized and distributed approaches [19], are crucial for overcoming these barriers. It is urgent to develop a comprehensive framework for the collaborative optimization of MAIESs, leveraging wind energy and DR mechanisms to meet operational, economic, and environmental goals [20].
Research has extensively explored multi-area energy system optimization, focusing on robustness and efficiency improvements in interconnected power networks. Wu et al. [21] developed a decentralized day-ahead scheduling model for electricity and natural gas systems that integrates reserve optimization to address uncertainties, utilizing chance-constrained programming and the alternating direction method of multipliers (ADMM). Gan et al. [22] proposed a decentralized computation method for the operation of multi-area systems with uncertain wind power, enhancing operational flexibility through collaborative exchanges. He et al. [23] examined economic dispatch issues within MAIES, addressing tie-line congestion and emission constraints via mixed-integer linear programming (MILP). Ahmed et al. [24] explored multi-area economic emission dispatch with an emphasis on large-scale multi-fueled plants. Kunya et al. [25] provided an overview of economic dispatch strategies in multi-area power systems, covering both centralized and decentralized approaches. Chen and Tang [26] presented a CSO algorithm to solve static and dynamic dispatch problems while incorporating practical constraints. Zhang et al. [27] highlighted the potential of hybrid renewable systems in buildings for heating, cooling, and electricity. Sharifian and Abdi [28] categorized approaches to the MAIES problem, emphasizing the benefits of decentralized systems. However, despite these advancements, existing studies often lack comprehensive frameworks that consider the simultaneous integration of various energy forms within MAIES, especially regarding the coordination of renewable energies like wind.
DR has emerged as a critical tool for optimizing system operations, as evidenced by numerous studies. Xie et al. [29] demonstrated DR’s role in reducing costs and enhancing renewable energy utilization when combined with dynamic pricing. Wang et al. [30] emphasized joint DR’s importance in reducing peak loads and emissions in multi-energy stations. Hua et al. [31] investigated aggregated DR (ADR) mechanisms, showing how ADR can optimize complex energy systems while preserving data privacy. Jiao et al. [32] proposed a strategy for flexibility provision in energy and heating systems, leveraging DR to mitigate uncertainty from renewables. Guo et al. [33] analyzed DR impact on cost reduction and load balance in regional systems. Bai et al. [34] showed that distributed optimization methods can enhance user engagement and operational independence. Ding et al. [35] achieved real-time optimization using deep reinforcement learning. Mokarram et al. [36] focused on maintaining operational independence while optimizing costs and voltage stability. Wang et al. [37] introduced Shapley value-based DR to ensure profitability. Yet, many studies do not fully integrate DR into a unified optimization framework or adequately explore its potential to enhance system resilience and flexibility.
Research combining MAIES with DR reveals the synergistic effects of integrating these two elements. Yang et al. [38] conducted a study on coordinated optimization scheduling with DR and carbon trading mechanisms, demonstrating significant reductions in emissions and costs. The work also underlined the need for flexible coupling of multi-energy flows. Walker et al. [39] proposed a scheduling model that integrates joint DR and shared storage, impacting system costs and environmental performance. Wang et al. [40] applied a comprehensive learning differential evolution (CLDE) algorithm to solve dispatch problems, addressing non-linear constraints effectively. While these contributions provide valuable insights, they generally do not fully explore the complexities of integrating DR into MAIES or consider advanced carbon trading schemes. Moreover, there is limited exploration of the dynamic interactions between different types of energy resources and the impacts on overall system stability and efficiency. The structure of multi-area integrated energy systems is shown in Figure 1.
The present study makes three significant contributions to the field:
(1)
A collaborative optimization framework for MAIESs that integrates wind energy and DR to enhance operational efficiency and system economic efficiency is developed.
(2)
Comprehensive analysis of the impact of DR on system sustainability, offering insights into the synergistic effects of DR with other flexibility resources in a multi-area context.
(3)
Advanced two-level optimization strategies that address uncertainties in renewable energy generation and dynamic demand patterns are implemented.
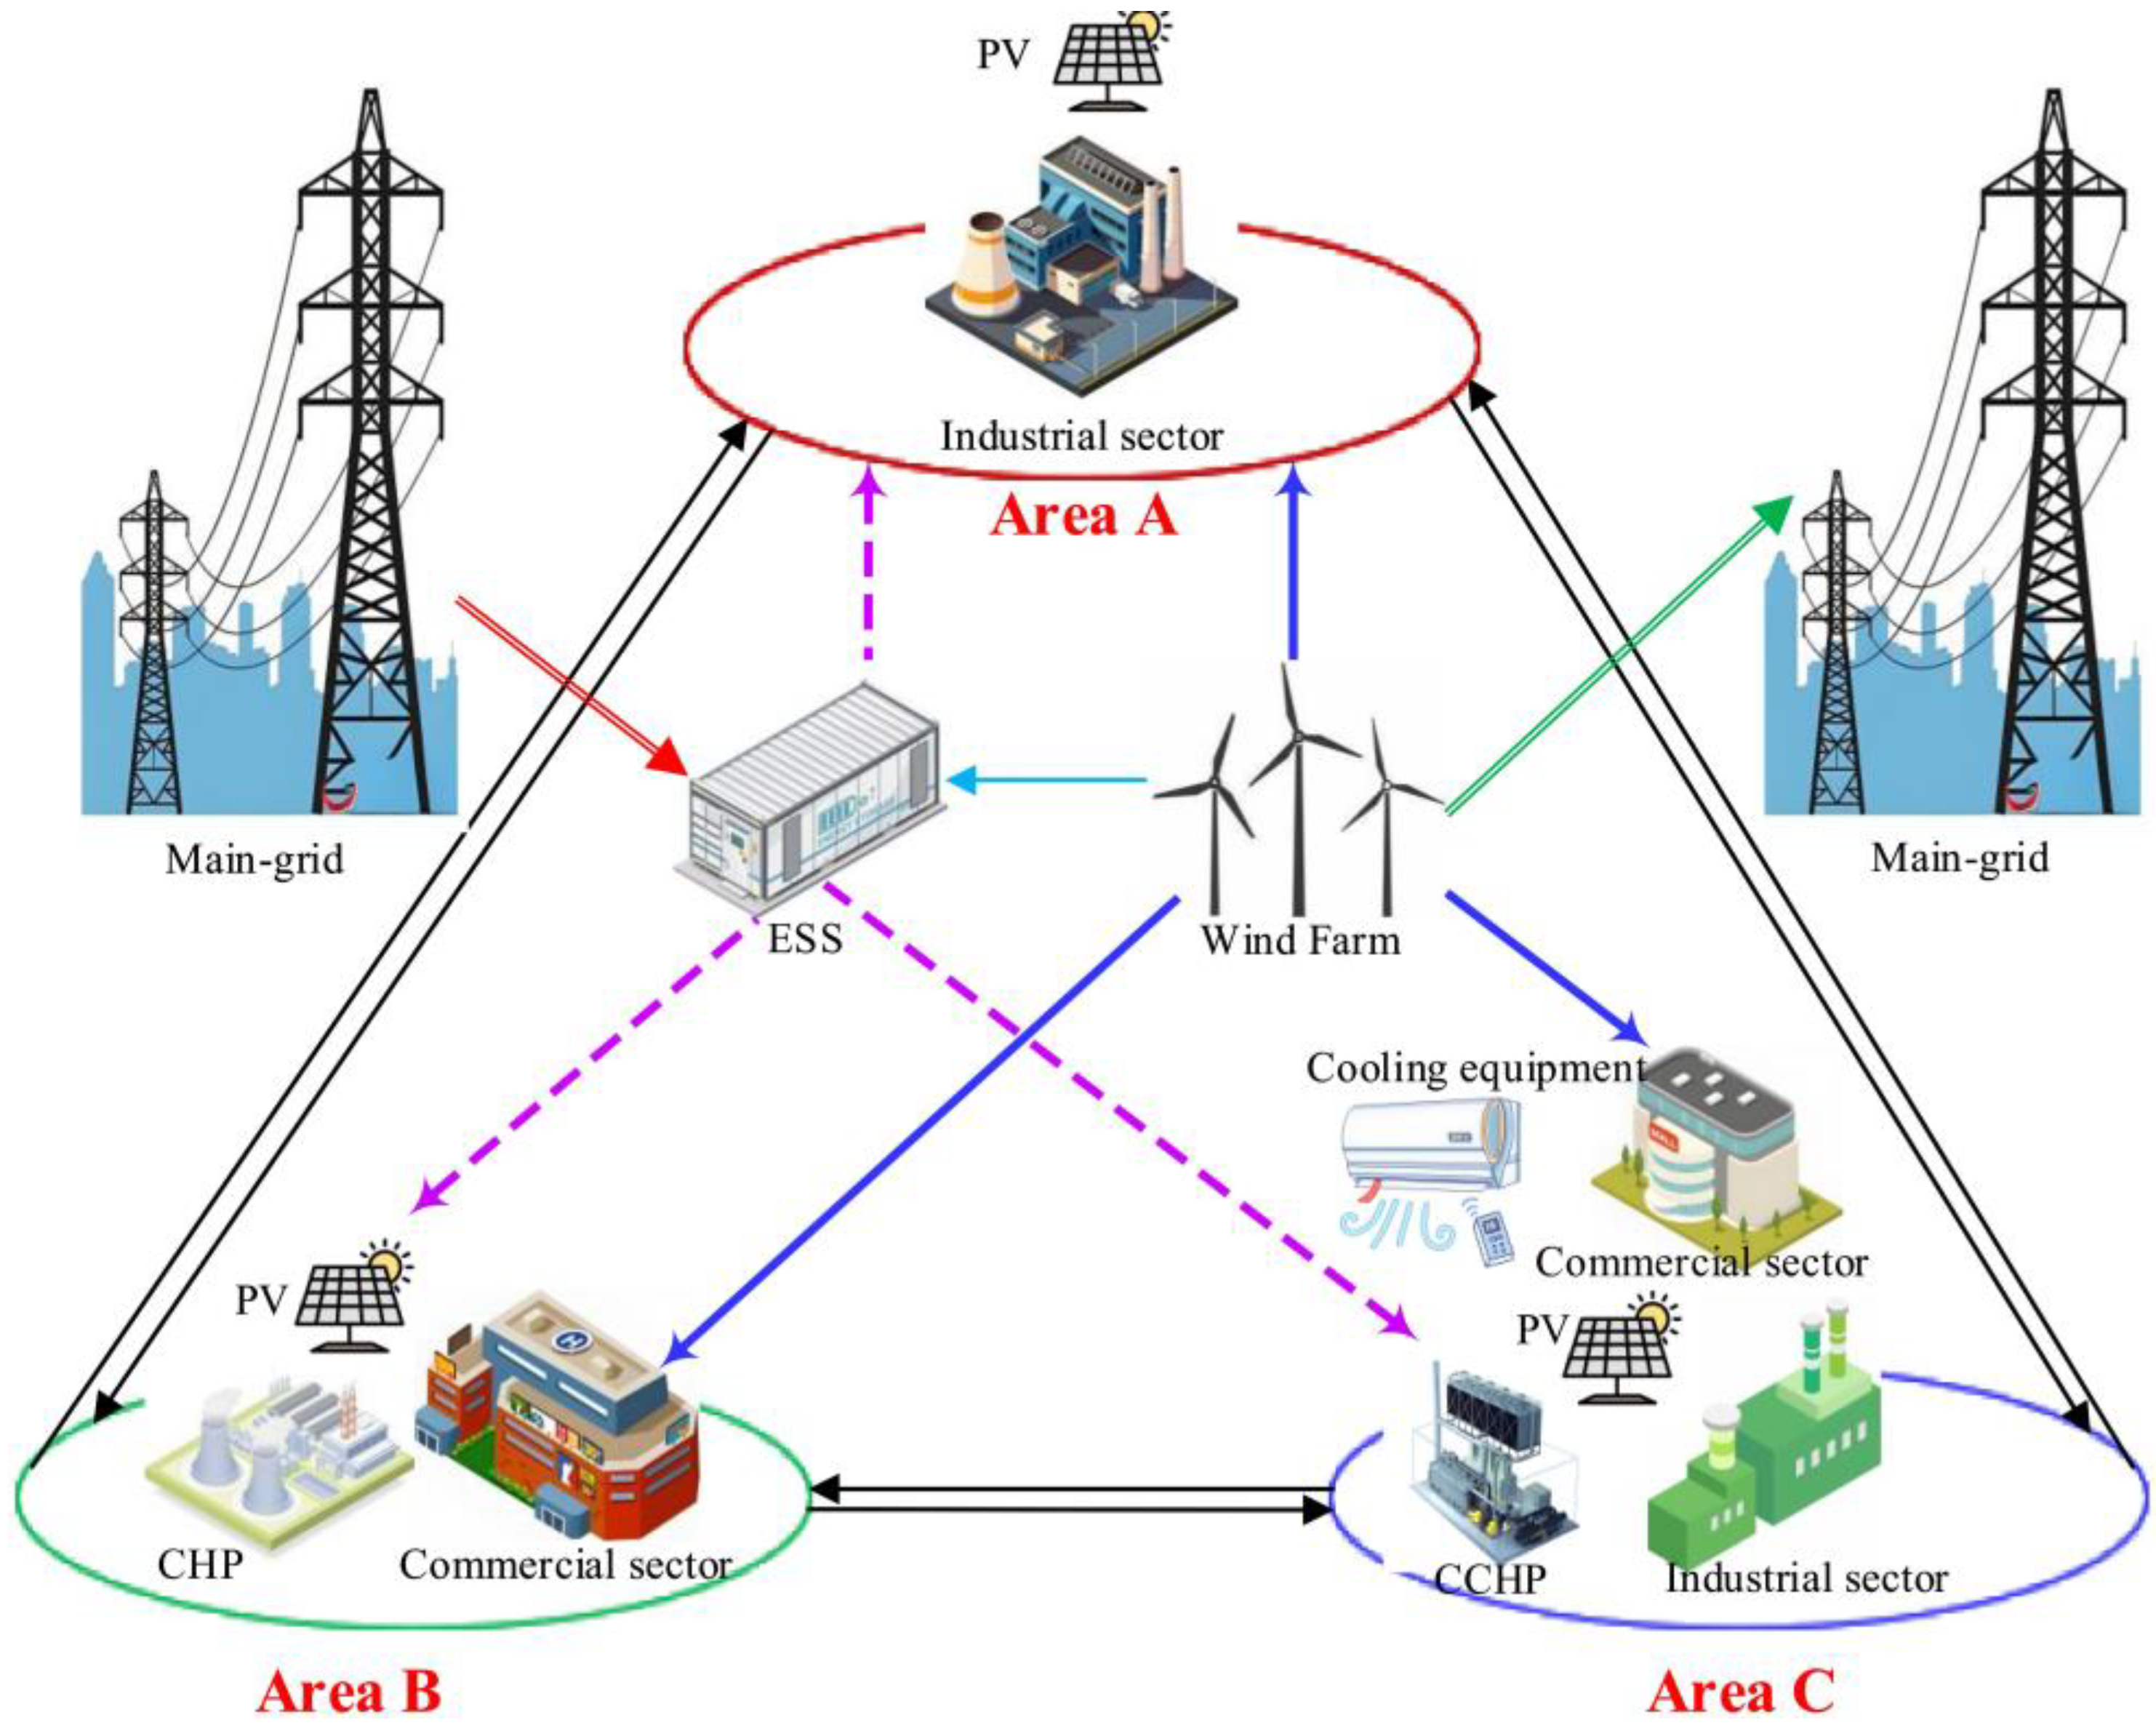
In the subsequent sections, Section 2 details the system modeling for different areas and components. Section 3 gives a comparative analysis of energy transactions among each area and related components. Section 4 concludes this research and introduces potential future work.

2. System Modeling

The system modeling aims to establish a comprehensive framework for analyzing and optimizing multi-area energy networks that integrate wind energy and DR mechanisms. The model encompasses key components, including electricity, heating, and cooling networks, to reflect the multi-energy nature of the system. Wind turbines are incorporated to simulate renewable energy generation, while energy storage systems (ESS) facilitate balancing supply-demand dynamics. DR programs are modeled to account for flexibility in consumer behavior and their impact on load management. Additionally, tie-line constraints and multi-energy conversion units are considered to achieve coordinated energy dispatch. This comprehensive system modeling provides a robust foundation for optimizing energy utilization and ensuring economic efficiency in multi-area energy networks.

2.1. Energy Trading with Main Grid

Energy trading with the main grid facilitates efficient energy exchange, enhances system stability, and addresses supply-demand imbalances across interconnected multi-area networks. The bought and sold power with the main grid is denoted as:
j = 1 N t = 1 T p j , t p j = 1 N t = 1 T p j , t s = 0
0 p j , t p p ¯ j p φ j , t p
0 p j , t s p ¯ j s φ j , t s
φ j , t p + φ j , t s 1
where p j , t p is the power purchased from the main grid by area j at time t . p j , t s is the power sold to the main grid by area j at time t . p ¯ j p is the maximum power that can be bought by area j . p ¯ j s is the maximum power that can be sold by area j . φ j , t p , φ j , t s are the binary variables indicating whether power is bought from or sold to the main grid by area j at time t .

2.2. Wind Farm Power Transactions

Wind farm power transactions enable efficient integration of renewable energy, optimize energy distribution among ESS, and enhance grid stability while addressing variability in wind energy generation. The wind power interaction between different areas and components is given as follows:
j = 1 N p t WF , Area j + p t WF , ESS + p t WF , MG = p t WF
0 p t WF , Area j p ¯ WF , Area j ϕ t WF , Area j
0 p t WF , MG p ¯ WF , MG ϕ t WF , MG
0 p t WF , ESS p ¯ WF , ESS ϕ t WF , ESS
ϕ t WF , Area j + ϕ t WF , MG + ϕ t WF , ESS = 1
where p t WF , Area j is the wind power transfer to area j at time t . p t WF , ESS is the wind power transfer to ESS at time t . p t WF , MG is the wind power transfer to the main grid at time t . p t WF is the power generated by the wind farm at time t . p ¯ WF , Area j , p ¯ WF , MG , and p ¯ WF , ESS are the maximum wind power transferred to j th area, main grid, ESS, respectively. ϕ t WF , Area j , ϕ t WF , MG , and ϕ t WF , ESS are binary variables indicating power transaction status between the wind farm and the j th area, main grid, and ESS, respectively.

2.3. Energy Storage Modeling

Energy storage modeling ensures efficient energy balancing, enhances system flexibility, and mitigates supply-demand mismatches by storing excess energy for future utilization. The dynamic power and state-of-charge (SoC) variations of ESS are described as:
e t = e t 1 + p t cha η cha p t dis / η dis
0 p t cha p ¯ ESS ω t cha
0 p t dis p ¯ ESS ω t dis
ω t cha + ω t dis = 1
e e t e ¯
e 1 = e 24
where p t cha is the charging power of the ESS in area j at time t . p t dis is the discharging power of the ESS in area j at time t . e t , e t 1 are the SoC at time t and t 1 , respectively. η cha , η dis are charging and discharging efficiency, respectively. ω t cha , ω t dis are binary variables indicating ESS charging and discharging status, respectively. p ¯ ESS is the maximum power of ESS. e , e ¯ are lower and upper SoC limits of ESS, respectively. e 1 , e 24 are the initial and final SoC of ESS, respectively.
The power of the ES at any given time is influenced by the charging and discharging processes as follows:
p t ESS = p t cha η cha p t dis / η dis

2.4. Demand Response Program

A demand response program (DRP) enhances operational flexibility, optimizes resource allocation, and supports load balancing in multi-area integrated energy systems by dynamically adjusting consumer energy demand. Generally, there are two types of DRP: price-based DR programs [41] and replaceable DR programs [42]. The DRP mechanism is depicted as follows:

2.4.1. Price-Based Demand Response

ε t = Δ p t / p t ini Δ λ t / λ t ini
Δ p t CL = p t CL , ini t = 1 24 A t CL λ t λ t ini λ t ini
Δ p t TL = p t TL , ini t = 1 24 A t TL λ t - λ t ini λ t ini
where ε t is the elasticity ratio. Δ p t is the load adjustment quantity in the pre-DR phase at time t . p t ini is the initial load power at time t . Δ λ t is the electricity price adjustment quantity in the pre-DR phase at time t . λ t ini is the initial electricity price at time t . Δ p t CL , Δ p t TL represent the amount of curtailed load, and transferred load at time t in the post-DR phase, respectively. p t CL , ini , p t TL , ini are the initial amount of curtailed load, and transferred load at time t in the pre-DR phase, respectively. A t CL and A t TL are the price elasticity matrix for curtailed load and transfer load, respectively.

2.4.2. Replaceable Demand Response

Δ p t RL , e = H e α e H h α h Δ p t RL , h
where Δ p t RL , e , Δ p t RL , h are the amount of replaceable electric load, and heat load, respectively. H e , H h are the unit heating values of electric and heat power, respectively. α e , α h are the utilization efficiency of electric and heat power, respectively.

2.5. Power Balance Modeling

Power balance modeling ensures equilibrium between received and transmitted electricity, as well as heating and cooling power within each zone, optimizing energy distribution and maintaining system stability.
(1)
Electric power balance
The electric power balance in Area A is denoted as:
p t Buy , A p t Sell , A p t AB + p t BA p t AC + p t CA + p t dis , A p t cha , A + p t WF , A + p t PV , A = P t DRP , A
where p t Buy , A is the power purchased from the main grid for Area A at time t . p t Sell , A is the power sold to main grid from Area A at time t . p t AB is the power transferred to Area B from Area A at time t . p t BA is the power injected to Area A from Area B at time t . p t AC is the power transferred to Area C from Area A at time t . p t CA is the power injected to Area A from Area C at time t . p t dis , A is the power discharged to Area A by ESS at time t . p t cha , A is the charging power from ESS to Area A at time t . p t WF , A is the wind power delivered to Area A at time t . p t PV , A is the PV power generated in Area A at time t . P t DRP , A is the load demand in post-DR phase in Area A at time t .
The electric power balance in Area B is denoted as:
p t Buy , B p t Sell , B + p t AB p t BA p t BC + p t CB + p t dis , B p t cha , B + p t WF , B + p t PV , B + p t CHP , B = p t DRP , B
where p t Buy , B is the power purchased from the main grid for Area B at time t . p t Sell , B is the power sold to main grid from Area B at time t . p t BC is the power transferred to Area C from Area B at time t . p t CB is the power injected to Area B from Area C at time t . p t dis , B is the power discharged to Area B by ESS at time t . p t cha , B is the charging power from ESS to Area B at time t . p t WF , B is the wind power delivered to Area B at time t . p t PV , B is the PV power generated in Area B at time t . p t CHP , B is the CHP power generated in Area B at time t . p t DRP , B is the load demand in post-DR phase in Area B at time t .
The electric power balance in Area C is denoted as:
p t Buy , C p t Sell , C + p t AC p t CA + p t BC p t CB + p t dis , C p t cha , C + p t WF , C + p t CHP , C p t Cooling , C = p t DRP , C
where p t Buy , C is the power purchased from the main grid for Area C at time t . p t Sell , C is the power sold to the main grid from Area C at time t . p t dis , C is the power discharged to Area C by ESS at time t . p t cha , C is the charging power from ESS to Area C at time t . p t WF , C is the wind power delivered to Area C at time t . p t CHP , C is the CHP power generated in Area C at time t . p t Cooling , C is the cooling power consumed in Area C at time t . p t DRP , C is the load demand in post-DR phase in Area C at time t .
(2)
Heat power balance
p t DRP , h = p t ini , h + p t TL , h p t CL , h
where p t DRP , h is the heat demand in the post-DR phase at time t . p t ini , h is the initial heat demand at time t . p t TL , h is the transferred heat demand at time t . p t CL , h is the reducible load at time t .
(3)
Cooling power balance
p t Eq , c + p t CHP , c = p t ini , c
where p t Eq , c is the cooling power generated by cooling equipment at time t . p t CHP , c is the cooling power generated by CHP at time t . p t ini , c is the cooling load at time t .

2.6. Objective Function

The objective function maximizes multi-zone revenues, wind farm profits, and storage benefits while minimizing overall system costs, ensuring economic efficiency and balanced resource utilization. The objective function is described as:
max Re v = k = 1 K R k Area + R ESS + R WF C Total
R k Area = t = 1 T ( p t CL , e + p t TL , e ) μ e + t = 1 T ( p t CL , h + p t TL , h ) · μ h   t = 1 T p t Buy , e c e t = 1 T p t Buy , g c g t = 1 T ( p t dis + p t cha ) c ESS   t = 1 T p t WF c WF t = 1 T ( ξ WF p t WF + ξ PV p t PV + ξ CHP p t CHP + ξ Cooling p t Cooling )
R WF = t = 1 T p t WF , ESS + p t WF , MG + k K p t WF , Area k ω t WF , Sell ω t WF , OM
R ESS = t = 1 T k = 1 K ω t ESS , Sell + ξ WF + σ p t cha , k t = 1 T k = 1 K ω t ESS , Sell + ξ WF + σ p t dis , k   + t = 1 T ω t ESS , Sell + ξ WF + σ p t cha , MG + p t cha , WF
C Total = t = 1 T k = 1 N p t Buy , k c t Area p j , t MG , sell c e + p t ESS , MG c ESS p t WF , MG c WF
where R k Area is the revenue of the k th integrated energy area. R ESS is the revenue of ESS. R WF is the revenue of wind farms. C Total is the total cost of the entire system. μ e is the electrical DR price. μ h is the heat DR price. c e is the electricity sales price for purchasing power from the main grid. c g is the gas sales price for purchasing gas from the main grid. c ESS is the ESS power sales price. c WF is the wind power sales price. ξ WF , ξ PV , ξ CHP , ξ Cooling are wind farm, PV, CHP, and cooling equipment operation and maintenance coefficients, respectively. ω t WF , Sell is the wind power selling revenue at time t . ω t WF , OM is the wind farm operation coefficient at time t . σ is the ancillary services unit price.

3. Numerical Analysis
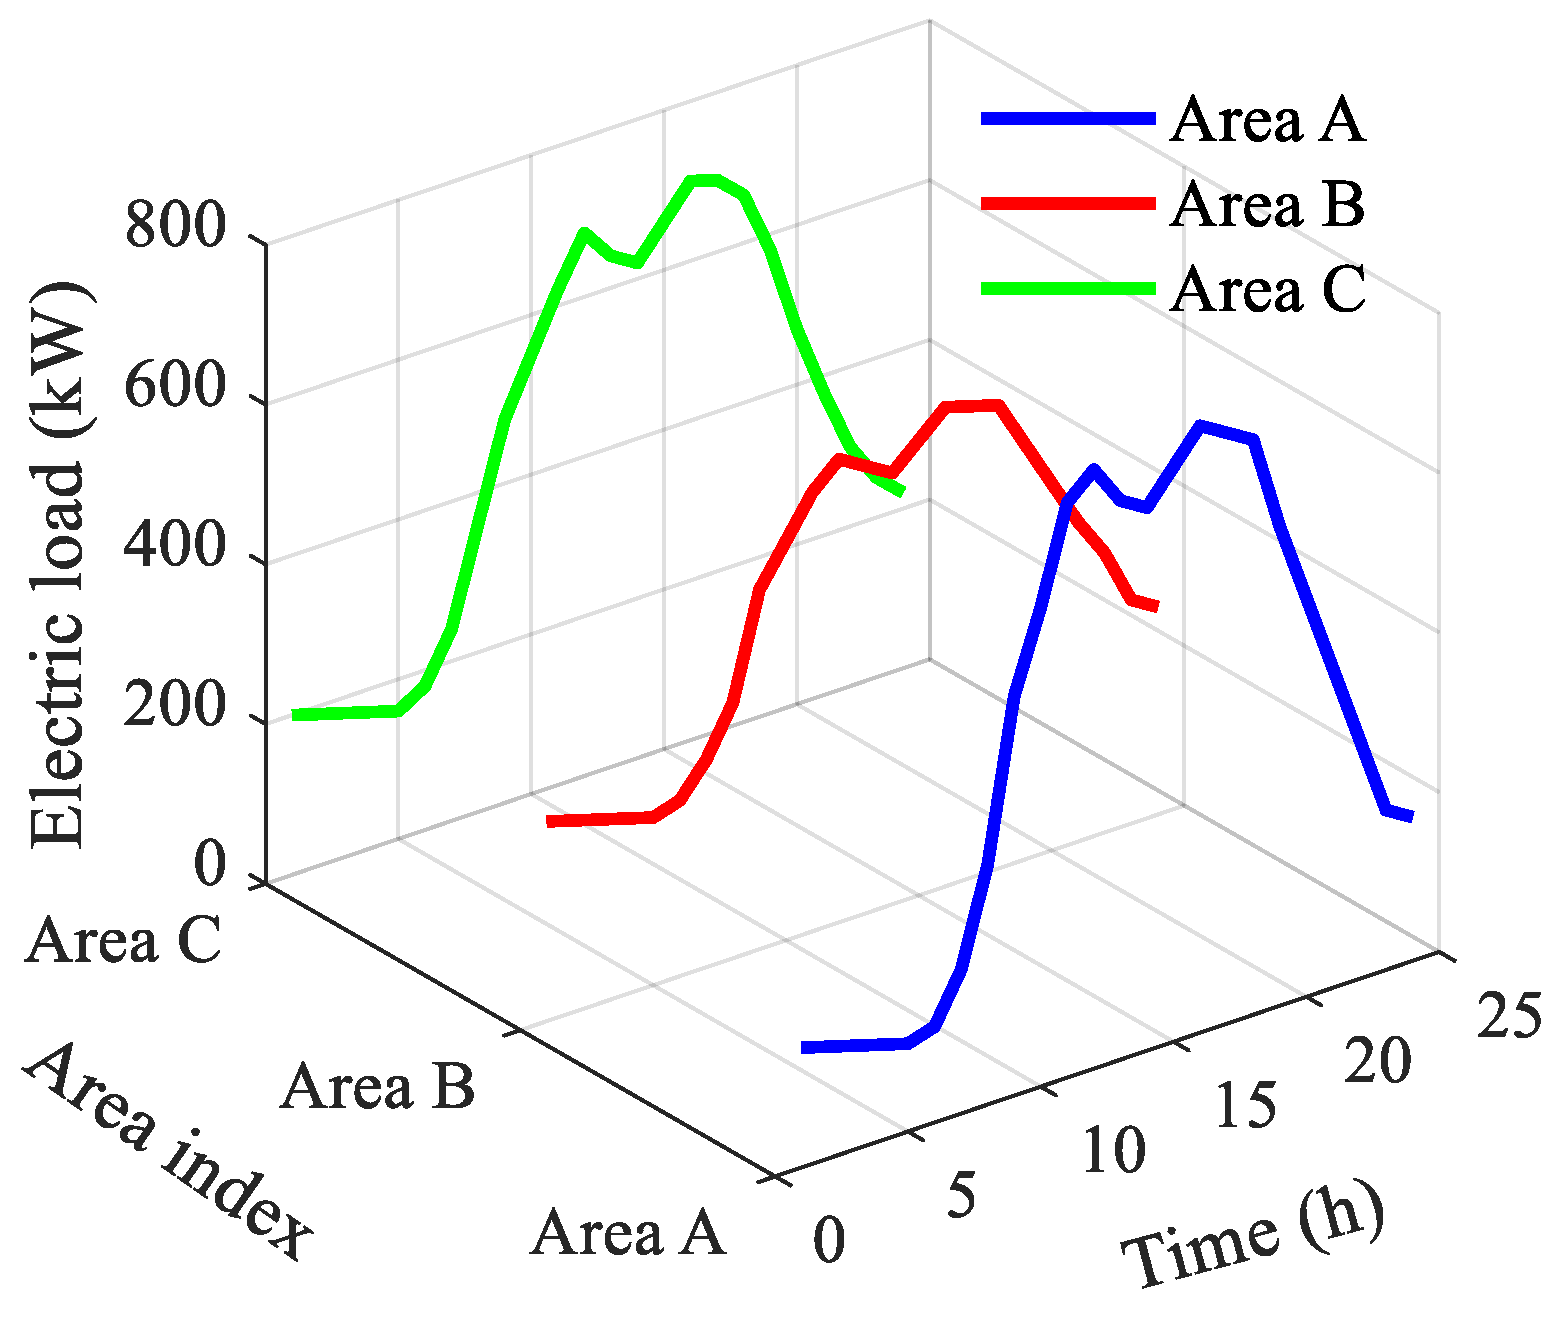
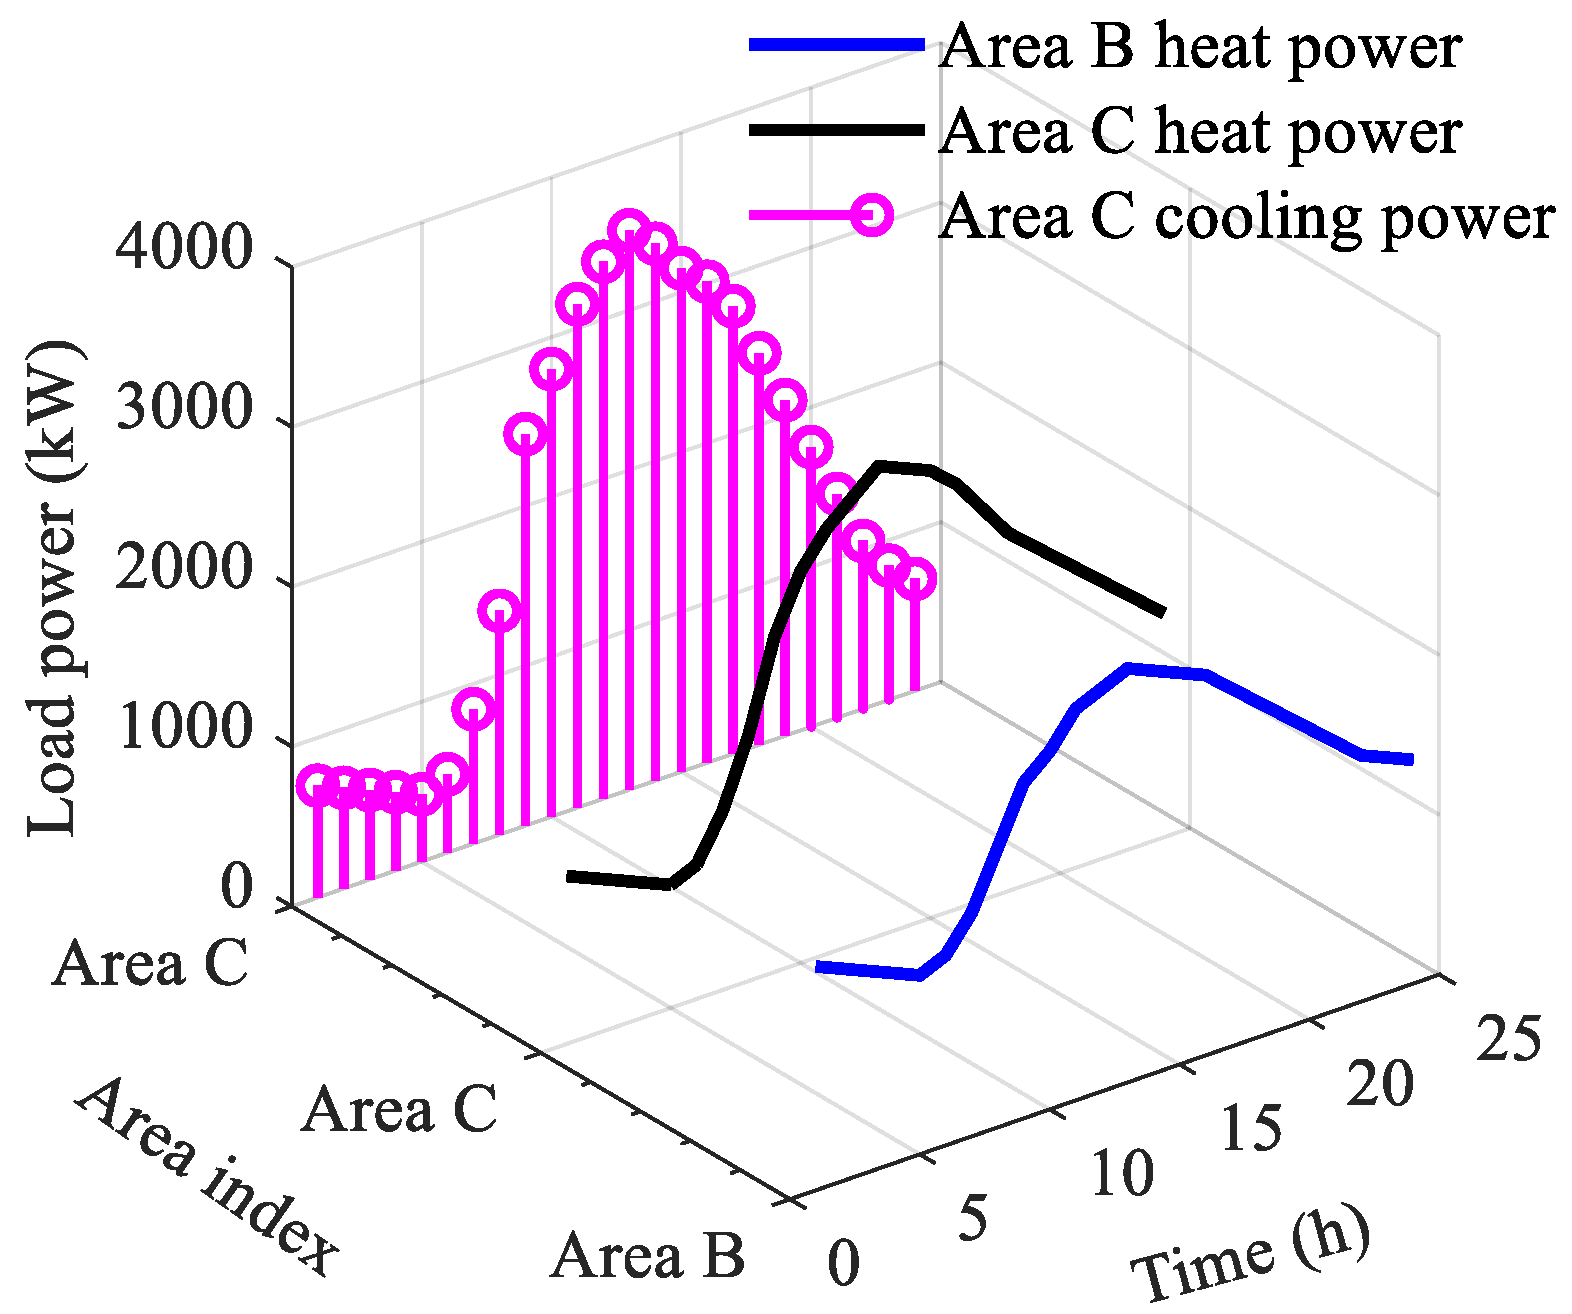
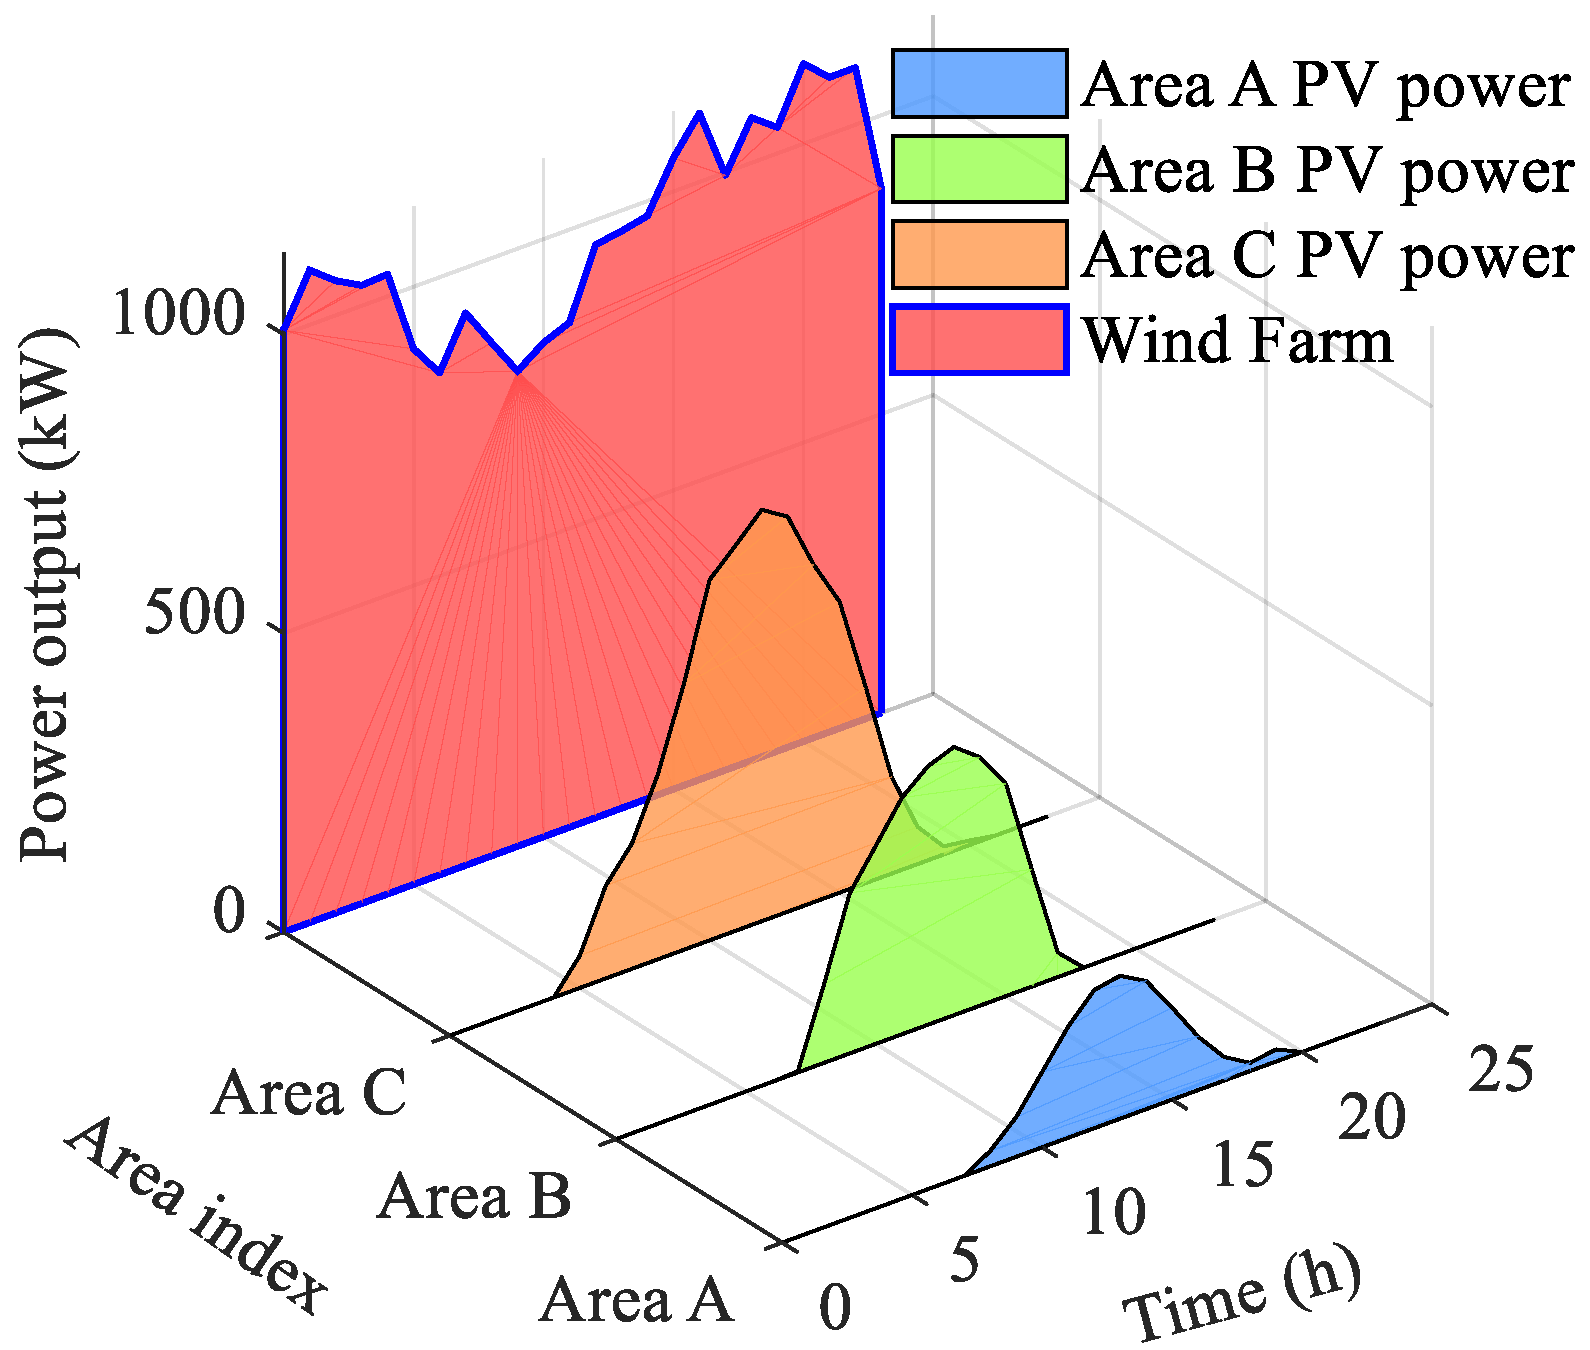
3.1. Data Input

To verify the effectiveness of the method proposed in this paper on the energy saving and consumption reduction of the integrated energy system of multiple parks, the electricity-heat-cooling energy flows are optimized for each park separately. The electric load profiles of three different areas are displayed in Figure 2. Area A is predominantly characterized by industrial enterprise. The peak load occurs at 16:00, reaching 760 kW. This area exhibits a steep increase in power demand during morning hours, followed by a sustained high load in the afternoon, indicative of industrial activity. The power demand decreases sharply after 20:00, suggesting limited nighttime operations. The peak load in Area B is recorded at 16:00, with a value of 600 kW, which is approximately 2.4 times greater than the minimum load during nighttime, indicating relatively balanced operations compared to Area A. This pattern is consistent with commercial energy usage, which operates during business hours with reduced activity at night. Area C exhibits a rapid increase in energy consumption during the morning hours, with a pronounced peak in the afternoon. The subsequent decline during the evening and night suggests a mix of industrial and commercial activities.
In addition to feeding the electrical loads, the heating and cooling requirements of each area are given in Figure 3. In Area A, the heating demand steadily rises from early morning, reaching its apex in the afternoon, and then gradually declines in the evening. This pattern indicates a predominant usage during daylight hours, which is associated with daytime industrial heating requirements. The maximum load (370 kW) is 2.3 times higher than the minimum nighttime load (160 kW at 05:00). This highlights the significant fluctuation in heating demand between day and night. Similar to Area B, the sustained high demand in Area C between 09:00 and 15:00 indicates a consistent reliance on heating during working hours. Cooling demand follows a distinct diurnal pattern, which begins to decrease after 15:00, coinciding with reduced outdoor temperatures and operational shifts.
The PV output and external wind farm output in each area are shown in Figure 4. It is generally consistent that the PV output power reaches its peak at noon. This pattern aligns with typical solar irradiance profiles, with peak output occurring during hours of maximum solar intensity. The higher peak compared to other areas suggests larger PV installations in Area C. The wind power output peaks at 21:00, with a value of 1134.25 kW. Unlike PV power, wind power generation exhibits a more consistent pattern throughout the day, with minimal fluctuations. The spatiotemporal power generations achieve a balanced and sustainable renewable energy supply.

3.2. Results Analysis

By incorporating DR technology, the loads in each area are adjusted according to the characteristics of energy use and electricity prices. Area A electric load profiles in pre-DR and post-DR are depicted in Figure 5. Before the implementation of DR, the electricity load in Area A reached its maximum value of 760 kW at 16:00, while the minimum load was 110 kW at 5:00. The load increased significantly during the daytime, which reflects energy consumption dominated by industrial operations, whereas nighttime loads were significantly reduced due to limited activity. After the implementation of the DR, the maximum load increased to 900 kW at 19:00, representing an 18.4% increase compared to the pre-DR condition. Conversely, the minimum load decreased slightly to 100 kW at 21:00, showing a 9% reduction compared to the pre-DR condition. The peak load shifted from 16:00 to 19:00, while the earlier peak hours (14:00–16:00) experienced a load reduction of 24%, which contributed to improving grid stability. This shift reflects the delayed energy use of industrial activities, smoothing the load curve during the daytime and redistributing energy consumption to the evening. Following the deployment of DR strategies, industrial loads in Area A was reduced by 8.08%, ascribing to the WF and ESS integration.
In Area B, the electricity load before DR showed a maximum value of 600 kW at 16:00 and a minimum value of 220 kW at 5:00, as displayed in Figure 6. The load profile indicated a balanced energy use pattern, typical of commercial operations, with moderate variations between daytime and nighttime. After DR was introduced, the peak load increased significantly to 820 kW at 19:00, representing a 36.7% increase compared to the pre-DR condition. The minimum load decreased drastically to 100 kW at 21:00, marking a 54.5% reduction from the pre-DR condition. DR shifted the peak load from the afternoon to the evening while reducing the daytime peak by 26.7%. Overall, the post-DR reduces commercial loads in Area B by 6.69%. These changes demonstrate enhanced flexibility in energy use and the successful redistribution of electricity consumption to off-peak hours.
In Figure 7, before DR, the electricity load in Area C reached its maximum value of 700 kW at 16:00 and its minimum value of 160 kW at 5:00. The load increased steeply during the morning hours, reflecting a mix of industrial and commercial energy consumption. After DR was applied, the maximum load rose to 880 kW at 19:00, representing a 25.7% increase compared to the pre-DR condition. The minimum load increased slightly to 170 kW at 21:00, showing a 6.3% rise from the pre-DR condition. The implementation of DR shifted the peak load from 16:00 to 19:00 while successfully reducing afternoon peak loads, thereby redistributing energy consumption to later hours. The load profile suggests a coordinated adjustment in energy use across both industrial and commercial sectors to align with the DR objectives.
The ESS plays a critical role in balancing energy supply and demand across wind farms, the power distribution network, and various areas. The power interaction of ESS with per components and three different areas are given in Figure 8. The ESS charges intensively from the wind farm during off-peak hours when wind power generation is high and electricity demand is low. Between 1:00 and 6:00, the ESS absorbs up to 500 kW as wind energy production exceeds immediate demand. This increases the SoC from 56.93% at 1:00 to 71.39% at 6:00. It is notable that the ESS consistently charges from the wind farm during periods of surplus renewable energy generation, ensuring maximum utilization of available resources and minimizing curtailment. Grid charging is strategically utilized to replenish ESS reserves when renewable energy is insufficient, often during periods of low electricity prices. ESS charges 1000 kW from the grid at 24:00, raising the ESS capacity to 1707.99 kWh with a corresponding SoC of 56.93%, which ensures energy availability during peak demand hours. Meanwhile, charging from local areas supports intra-regional energy balance. Significant charging is observed from Area B, with 1256.95 kW at 1:00, supplementing ESS to stabilize energy reserves. In terms of discharging to local areas to meet specific area demands, particularly during peak load periods, the ESS in Area A supplies 1381.95 kW, addressing industrial demand. Meanwhile, 1324.13 kW is provided at 19:00 for evening operations. In Area B, discharges of 1405.38 kW at 8:00 and 1358.71 kW at 19:00 cater to commercial activities. Cooling and heating loads in Area C are supported by ESS discharging power, such as 1055.19 kW at 7:00, reflecting its mixed energy demand. Simultaneously, ESS discharges to the grid occur during high-demand and high-price periods to stabilize the system and generate revenue. The interaction of ESS with other components shows that the ESS employs a high-price discharge, low-price charge strategy to optimize economic performance. By dynamically balancing supply and demand, the ESS stabilizes grid operations and alleviates grid congestion, while charging during off-peak hours minimizes stress on transmission infrastructure. The power flow among ESS and each area implies that the ESS improves system flexibility by adapting to fluctuating energy demands and supporting diverse load profiles. Its ability to simultaneously cater to industrial loads in Area A, commercial loads in Area B, and mixed loads in Area C to enhance energy versatility.
The graph details of the interactions between WF and various components are shown in Figure 9. At 16:00, a supply of 56.17 kW is observed in Area A. A significant increase occurred at 24:00, with 377.51 kW allocated to Area A. This likely corresponds to nighttime energy demand and reallocation of surplus power when grid exports are minimal. Area B consistently receives power, particularly during peak demand hours. A notable increase at 2:00, with 91.58 kW, reflects early-morning activities. Evening peaks occur at 17:00, with 115.29 kW, and 21:00, with 595.35 kW, emphasizing the high priority of Area B, which is driven by commercial loads requiring significant energy input. The 5.5 times increase in power allocation from 2:00 to 21:00 highlights the WF’s role in supporting dynamic load patterns for commercial operations. The WF rarely supplies power to Area C, which suggests that Area C relies primarily on alternative power sources or operates as a backup load. The WF priority is evident in its substantial allocation to the ESS, particularly during off-peak demand periods. This strategy supports the ESS arbitrage operations by storing excess wind power for release during peak demand periods. The WF maintains a consistent export of 500 kW to the grid during most hours, ensuring baseline support for grid operations. It is demonstrated that the WF owns the capability to optimize power allocation through dynamic interactions with areas, the ESS, and the grid. By leveraging multi-energy complementarity and arbitrage strategies, the WF maximizes renewable energy utilization, reduces costs, and supports grid stability.
The power trading activities of each area with the main grid are shown in Figure 10. Three areas only export electricity to the grid during 24:00, with a power output of 800 kW. This reflects surplus energy availability during low-demand periods at night. The coordinated selling activity at 24:00 reflects an attempt to maximize revenue by dispatching surplus power when electricity prices are potentially higher or demand in other regions increases. Area A shows significant purchasing activity, and these purchases occur during early morning hours, aligning with high demand or reduced internal generation. This purchasing behavior reflects Area A’s reliance on grid power to meet early-morning energy needs, which is influenced by industrial load profiles. Area B does not exhibit any purchasing activity throughout the day. This could indicate that Area B has a balanced energy profile, with internal generation meeting demand requirements or optimized reliance on other energy sources. Area C primarily purchases power at specific time intervals from 7:00 to 8:00. These purchases align with increased load requirements due to mixed commercial and industrial activities in Area C. It is observed that by purchasing power during off-peak periods, Areas A and C minimize operational costs while maintaining reliability. Alternatively, Coordinated power exports at 24:00 enable all three areas to capitalize on surplus generation and potentially favorable market conditions.
The Sankey diagrams illustrate the power flows into and out of different areas. In Figure 11, the power flow diagram highlights the contributions of various power sources in Area A. It is found that a significant inflow of 15,498.1 kW from the ESS is injected into Area A, indicating its reliance on stored energy during peak demand periods. A contribution of 9818.9 kW from PV highlights the role of renewable energy in the Area A energy mix. The use of PV complements ESS discharge, reducing dependence on grid power and enhancing renewable energy utilization. Power is also received from Area C, with 2465.7 kW, and Area B, with 1054.3 kW, indicating a collaborative energy-sharing mechanism between the areas. Similar findings can be derived from Figure 12 and Figure 13.
It is notable that for each area, ESS plays a pivotal role across all areas, with the largest discharge observed in Area C, with 19,442.0 kW, and the highest charging activity in Area B, which is 25,829.6 kW. This indicates coordinated energy storage strategies across the regions. PV in Area A, with 9818.9 kW, wind farms in Area B, with 1611.8 kW, and Area C, which is 877.5 kW, highlight the integration of renewable energy, reducing carbon footprints and grid dependency. Minimal grid imports, with 800.0 kW, across all areas reflect strategic reliance on internal resources and shared energy. Grid exports are maximized when surplus energy is available, indicating effective participation in electricity markets. The substantial energy exchanges between areas, particularly Area A to Area B and Area C to Area B, underline the collaborative energy-sharing mechanisms to achieve overall system optimization. The power flow dynamics in Areas A, B, and C demonstrate a highly optimized energy management system that leverages multi-energy complementarities, ESS utilization, and strategic interactions with the main grid. Each area adapts its power flows to meet local demands while maximizing economic and operational benefits.
The radar charts effectively illustrate the hourly variations in heat and cooling power output for Areas B and C in Figure 14, Figure 15 and Figure 16. In Area B, the heat power output from the CHP unit remains constant at 1290 kW throughout the 24 h. In contrast, the gas boiler exhibits a more dynamic heat power output, ranging from 409 kW at 1:00 and 24:00 to a peak of 1599 kW at 13:00. The increased reliance on gas boiler output during midday hours 11:00–15:00 corresponds to higher heat load demands in Area B. This pattern indicates that gas boilers are utilized to supplement CHP output during peak demand periods, showcasing an efficient multi-energy complementary strategy. The gas boiler’s output decreases significantly during nighttime, 549 kW at 22:00, aligning with the reduced heat load demand in Area B. This adjustment highlights the system’s responsiveness to fluctuating load requirements. Comparing peak and off-peak boiler outputs reveals a 191.6% increase, demonstrating the gas boiler’s role in flexible heat load management.
In Area C, the CHP unit provides a variable heat power output, starting at 700.65 kW at 1:00, peaking at 1000.93 kW between 8:00 and 21:00, and decreasing back to 700.65 kW by 24:00. The gas boiler output in Area C exhibits a broader range, increasing from 648.35 kW at 1:00 to a peak of 2238.07 kW at 13:00, before gradually decreasing to 978.07 kW at 22:00. The simultaneous operation of CHP units and gas boilers in Area C demonstrates an optimized heat supply strategy. The gas boiler output compensates for the CHP unit’s limitations during peak heat demand hours, ensuring an uninterrupted energy supply. The gas boiler output increases by 245.2% from its minimum value to its peak, emphasizing its critical role in meeting high demand during midday periods.
The cooling power output in Area C is provided by both CHP units and dedicated cooling equipment. The CHP unit delivers a constant cooling output of 1000 kW during peak hours from 8:00 to 21:00 and reduces to 700 kW at off-peak times. The cooling equipment output varies significantly, starting from essentially zero at 1:00, peaking at 2500 kW at 13:00, and then gradually decreasing to 50 kW by 22:00. The combined cooling strategy leverages the consistent output of CHP units and the flexibility of cooling equipment. The cooling equipment output increases by over 4500% from 400 kW at 8:00 to its peak of 2500 kW at 13:00, showcasing its responsiveness to heightened cooling demand during midday. This approach ensures optimal cooling supply while accommodating demand fluctuations.
It is observed that the CHP units in both Areas B and C are primarily used to meet baseline heat and cooling demands, with their outputs adjusted minimally. This steady operation aligns with the economic and operational advantages of CHP systems, which maximize energy efficiency by simultaneously producing heat and power. While for gas boilers and cooling equipment that are employed to address variable loads, especially during peak demand periods, the flexible operation of these systems complements the stable output of CHP units, ensuring a reliable energy supply.

4. Conclusions

This study investigated the optimization and coordination of multi-energy systems in interconnected energy microgrids, focusing on the integration of CHP units, gas boilers, cooling equipment, and ESS. A multi-energy complementary strategy was proposed and validated, enabling efficient coordination of heat, cooling, and electricity across multiple regions. The findings demonstrated the effectiveness of dynamic energy dispatch to balance supply and demand, enhance system efficiency, and ensure operational stability under varying load conditions. By leveraging the synergies between different energy sources, this study successfully addressed the challenges of energy integration, reduced dependency on the main grid, and minimized energy waste. The innovative aspects of this work lie in the coordinated control of diverse energy resources, the optimization of multi-energy flows, and the incorporation of dynamic energy pricing to improve system economics. These contributions provide a systematic approach to managing complex energy systems, ensuring reliability and sustainability. Future research should focus on integrating higher shares of renewable energy sources, such as solar and wind power, into multi-energy systems to further reduce carbon emissions and improve environmental sustainability.

Author Contributions

Conceptualization, P.L.; methodology, L.W.; software, P.Z. and P.Y.; validation, P.L., P.Z. and J.W.; formal analysis, C.L. and Z.N.; investigation, L.W.; resources, C.L. and Z.N.; data curation, P.Y.; writing—original draft preparation, P.L.; writing—review and editing, J.W.; supervision, J.W. All authors have read and agreed to the published version of the manuscript.

Funding

This work was funded in part by the Major Scientific and Technological Research Project of Xuji Electric (Grant No. 5292CJ240009), Science and Technology Tackling Project of Henan Province (Grant No. 252102240105), and Fund of the Institute of Complexity Science, Henan University of Technology (Grant No. CSKFJJ-2025-27).

Data Availability Statement

The original study’s contributions are included in this article, and any further inquiries can be directed to the corresponding authors.

Conflicts of Interest

Authors Peng Li, Li Wang, Peiqiang Zhang, Peng Yan, Chongyang Li, and Zhe Nan were employed by the Henan Xuji Instrument Co., Ltd. The remaining author declares that the research was conducted in the absence of any commercial or financial relationships that could be construed as a potential conflict of interest.

References

  1. Liu, L.; He, G.; Wu, M.; Liu, G.; Zhang, H.; Chen, Y.; Shen, J.; Li, S. Climate change impacts on planned supply–demand match in global wind and solar energy systems. Nat. Energy 2023, 8, 870–880. [Google Scholar]
  2. Hassan, Q.; Viktor, P.; Al-Musawi, T.J.; Ali, B.M.; Algburi, S.; Alzoubi, H.M.; Al-Jiboory, A.K.; Sameen, A.Z.; Salman, H.M.; Jaszczur, M. The renewable energy role in the global energy Transformations. Renew. Energy Focus 2024, 48, 100545. [Google Scholar]
  3. Liu, T.; Tian, J.; Zhu, H.; Goh, H.H.; Liu, H.; Wu, T.; Zhang, D. Key technologies and developments of multi-energy system: Three-layer framework, modelling and optimisation. Energy 2023, 277, 127697. [Google Scholar]
  4. Wang, J.; Xu, X.; Wu, L.; Huang, Q.; Chen, Z.; Hu, W. Risk-averse based optimal operational strategy of grid-connected photovoltaic/wind/battery/diesel hybrid energy system in the electricity/hydrogen markets. Int. J. Hydrogen Energy 2023, 48, 4631–4648. [Google Scholar]
  5. Al Khaffaf, I.; Tamimi, A.; Ahmed, V. Pathways to Carbon Neutrality: A Review of Strategies and Technologies Across Sectors. Energies 2024, 17, 6129. [Google Scholar] [CrossRef]
  6. Yin, L.; Zheng, D. Hybrid modeling with data enhanced driven learning algorithm for smart generation control in multi-area integrated energy systems with high proportion renewable energy. Expert Syst. Appl. 2025, 261, 125530. [Google Scholar]
  7. Hu, Z.; Zhang, K.; Su, R.; Wang, R.; Li, Y. Robust Cooperative Load Frequency Control for Enhancing Wind Energy Integration in Multi-Area Power Systems. IEEE Trans. Autom. Sci. Eng. 2024, 22, 1508–1518. [Google Scholar]
  8. Xi, L.; Shi, Y.; Quan, Y.; Liu, Z. Research on the multi-area cooperative control method for novel power systems. Energy 2024, 313, 133912. [Google Scholar]
  9. Wu, D.; Guo, F.; Yao, Z.; Zhu, D.; Zhang, Z.; Li, L.; Du, X.; Zhang, J. Enhancing Reliability and Performance of Load Frequency Control in Aging Multi-Area Power Systems under Cyber-Attacks. Appl. Sci. 2024, 14, 8631. [Google Scholar] [CrossRef]
  10. Lv, C.; Liang, R.; Jin, W.; Chai, Y.; Yang, T. Multi-stage resilience scheduling of electricity-gas integrated energy system with multi-level decentralized reserve. Appl. Energy 2022, 317, 119165. [Google Scholar]
  11. Wang, J.; Zhao, Y.; Li, H.; Xu, X. Enhanced photovoltaic-powered distribution network resilience aided by electric vehicle emergency response with willingness and reward. Appl. Energy 2025, 389, 125619. [Google Scholar]
  12. Navesi, R.B.; Naghibi, A.F.; Zafarani, H.; Tahami, H.; Pirouzi, S. Reliable operation of reconfigurable smart distribution network with real-time pricing-based demand response. Electr. Power Syst. Res. 2025, 241, 111341. [Google Scholar]
  13. Li, Y.; Ma, W.; Li, Y.; Li, S.; Chen, Z.; Shahidehpour, M. Enhancing cyber-resilience in integrated energy system scheduling with demand response using deep reinforcement learning. Appl. Energy 2025, 379, 124831. [Google Scholar]
  14. Wang, J.; Huang, Q. Minimization of network losses with financial incentives in voluntary demand response. IEEE Access 2018, 6, 16515–16522. [Google Scholar]
  15. Urrutia, L.Z.; Pascual, J.F.; Iribarren, E.P.; Garay, R.S.; Pino, I.G. Model predictive control with self-learning capability for automated demand response in buildings. Appl. Therm. Eng. 2025, 258, 124558. [Google Scholar]
  16. Wang, J.; Raza, A.; Hong, T.; Sullberg, A.C.; De Leon, F.; Huang, Q. Analysis of energy savings of CVR including refrigeration loads in distribution systems. IEEE Trans. Power Deliv. 2017, 33, 158–168. [Google Scholar]
  17. Yang, M.; Liu, Y. Research on multi-energy collaborative operation optimization of integrated energy system considering carbon trading and demand response. Energy 2023, 283, 129117. [Google Scholar]
  18. De Vizia, C.; Patti, E.; Macii, E.; Bottaccioli, L. A user-centric view of a demand side management program: From surveys to simulation and analysis. IEEE Syst. J. 2022, 16, 1885–1896. [Google Scholar]
  19. Stennikov, V.; Barakhtenko, E.; Mayorov, G.; Sokolov, D.; Zhou, B. Coordinated management of centralized and distributed generation in an integrated energy system using a multi-agent approach. Appl. Energy 2022, 309, 118487. [Google Scholar]
  20. Wu, J.; Zhang, Y.; Khan, A. Synergistic nexus among energy security, energy equity and net electricity regions: Optimizing renewable energy integration and demand response for electrical supply systems. Energy Strategy Rev. 2025, 57, 101611. [Google Scholar]
  21. Wu, G.; Xiang, Y.; Liu, J.; Gou, J.; Shen, X.; Huang, Y.; Jawad, S. Decentralized day-ahead scheduling of multi-area integrated electricity and natural gas systems considering reserve optimization. Energy 2020, 198, 117271. [Google Scholar] [CrossRef]
  22. Gan, W.; Yan, M.; Yao, W.; Guo, J.; Ai, X.; Fang, J.; Wen, J. Decentralized computation method for robust operation of multi-area joint regional-district integrated energy systems with uncertain wind power. Appl. Energy 2021, 298, 117280. [Google Scholar] [CrossRef]
  23. He, L.; Lu, Z.; Zhang, J.; Geng, L.; Cai, Y.; Li, X. Economic dispatch of multi-area integrated electricity and natural gas systems considering emission and hourly spinning reserve constraints. Int. J. Electr. Power Energy Syst. 2021, 132, 107177. [Google Scholar] [CrossRef]
  24. Ahmed, I.; Rehan, M.; Basit, A.; Malik, S.H.; Alvi, U.-E.H.; Hong, K.-S. Multi-area economic emission dispatch for large-scale multi-fueled power plants contemplating inter-connected grid tie-lines power flow limitations. Energy 2022, 261, 125178. [Google Scholar] [CrossRef]
  25. Kunya, A.B.; Abubakar, A.S.; Yusuf, S.S. Review of economic dispatch in multi-area power system: State-of-the-art and future prospective. Electr. Power Syst. Res. 2023, 217, 109089. [Google Scholar] [CrossRef]
  26. Chen, X.; Tang, G. Solving static and dynamic multi-area economic dispatch problems using an improved competitive swarm optimization algorithm. Energy 2022, 238, 122035. [Google Scholar] [CrossRef]
  27. Zhang, S.; Ocłoń, P.; Klemeš, J.J.; Michorczyk, P.; Pielichowska, K.; Pielichowski, K. Renewable energy systems for building heating, cooling and electricity production with thermal energy storage. Renew. Sustain. Energy Rev. 2022, 165, 112560. [Google Scholar] [CrossRef]
  28. Sharifian, Y.; Abdi, H. Multi-area economic dispatch problem: Methods, uncertainties, and future directions. Renew. Sustain. Energy Rev. 2024, 191, 114093. [Google Scholar] [CrossRef]
  29. Xie, T.; Ma, K.; Zhang, G.; Zhang, K.; Li, H. Optimal scheduling of multi-regional energy system considering demand response union and shared energy storage. Energy Strategy Rev. 2024, 53, 101413. [Google Scholar] [CrossRef]
  30. Wang, Y.; Dong, P.; Xu, M.; Li, Y.; Zhou, D.; Liu, X. Research on collaborative operation optimization of multi-energy stations in regional integrated energy system considering joint demand response. Int. J. Electr. Power Energy Syst. 2024, 155, 109507. [Google Scholar] [CrossRef]
  31. Hua, H.; Du, C.; Chen, X.; Kong, H.; Li, K.; Liu, Z.; Naidoo, P.; Lv, M.; Hu, N.; Fu, M.; et al. Optimal dispatch of multiple interconnected-integrated energy systems considering multi-energy interaction and aggregated demand response for multiple stakeholders. Appl. Energy 2024, 376, 124256. [Google Scholar]
  32. Jiao, M.; Li, P.; Yang, M.; Wang, Q.; Han, L. Coordinated Flexibility Provision Strategy for Multi-Area Interconnected IEHS. IEEE Trans. Ind. Appl. 2024, 61, 1675–1682. [Google Scholar]
  33. Guo, Z.; Zhang, R.; Wang, L.; Zeng, S.; Li, Y. Optimal operation of regional integrated energy system considering demand response. Appl. Therm. Eng. 2021, 191, 116860. [Google Scholar]
  34. Bai, X.; Liu, L.; Ju, J.; Zhong, X.; Zhou, Y.; Lin, J.; Huang, Y.; Wu, N.; Xie, S.; Zhao, Y. Distributed optimization method for multi-area integrated energy systems considering demand response. Front. Energy Res. 2022, 10, 975214. [Google Scholar]
  35. Ding, L.; Cui, Y.; Yan, G.; Huang, Y.; Fan, Z. Distributed energy management of multi-area integrated energy system based on multi-agent deep reinforcement learning. Int. J. Electr. Power Energy Syst. 2024, 157, 109867. [Google Scholar]
  36. Mokarram, M.J.; Gitizadeh, M.; Niknam, T.; Okedu, K.E. A decentralized granular-based method to analyze multi-area energy management systems including DGs, batteries and electric vehicle parking lots. J. Energy Storage 2021, 42, 103128. [Google Scholar] [CrossRef]
  37. Wang, J.; Huang, Q.; Hu, W.; Li, J.; Zhang, Z.; Cai, D.; Zhang, X.; Liu, N. Ensuring profitability of retailers via Shapley Value based demand response. Int. J. Electr. Power Energy Syst. 2019, 108, 72–85. [Google Scholar]
  38. Yang, P.; Jiang, H.; Liu, C.; Kang, L.; Wang, C. Coordinated optimization scheduling operation of integrated energy system considering demand response and carbon trading mechanism. Int. J. Electr. Power Energy Syst. 2023, 147, 108902. [Google Scholar] [CrossRef]
  39. Walker, A.; Kwon, S. Analysis on impact of shared energy storage in residential community: Individual versus shared energy storage. Appl. Energy 2021, 282, 116172. [Google Scholar]
  40. Wang, Y.; Xiong, G.; Xu, S.; Suganthan, P.N. Large-scale power system multi-area economic dispatch considering valve point effects with comprehensive learning differential evolution. Swarm Evol. Comput. 2024, 89, 101620. [Google Scholar]
  41. Pandey, V.C.; Rawat, T.; Ospina, J.; Dvorkin, Y.; Konstantinou, C. A tri-level distribution locational marginal price-based demand response framework. Electr. Power Syst. Res. 2025, 241, 111398. [Google Scholar]
  42. Zhang, J.; Zhang, T.; Pan, F.; Yang, Y.; Feng, L.; Huang, Y. Optimization scheduling method for multi-energy complementary based on green certificate-carbon trading mechanism and comprehensive demand response. Energy Rep. 2025, 13, 40–58. [Google Scholar] [CrossRef]
Figure 1. The structure of multi-area integrated energy systems.
Energies 18 02188 g001
Figure 2. Electric load profile for three different integrated energy system areas.
Energies 18 02188 g002
Figure 3. Heat load profile for two different integrated energy system areas.
Energies 18 02188 g003
Figure 4. PV power profiles for three different integrated energy system areas and wind farm generation profiles.
Energies 18 02188 g004
Figure 5. Area A electric load profiles in pre-DR and post-DR.
Energies 18 02188 g005
Figure 6. Area B electric load profiles in pre-DR and post-DR.
Energies 18 02188 g006
Figure 7. Area C electric load profiles in pre-DR and post-DR.
Energies 18 02188 g007
Figure 8. Power interaction of energy storage with components and three different integrated energy system areas.
Energies 18 02188 g008
Figure 9. Power interaction of wind farms with components and three different integrated energy system areas.
Energies 18 02188 g009
Figure 10. Power interaction of energy storage with components and three different integrated energy system areas.
Energies 18 02188 g010
Figure 11. Inflow power and outflow power Sankey diagram for Area A.
Energies 18 02188 g011
Figure 12. Inflow power and outflow power Sankey diagram for Area B.
Energies 18 02188 g012
Figure 13. Inflow power and outflow power Sankey diagram for Area C.
Energies 18 02188 g013
Figure 14. Area B heat sources and heat load rose diagram.
Energies 18 02188 g014
Figure 15. Area C heat sources and heat load rose diagram.
Energies 18 02188 g015
Figure 16. Area C cooling sources and cooling load rose diagram.
Energies 18 02188 g016
Disclaimer/Publisher’s Note: The statements, opinions and data contained in all publications are solely those of the individual author(s) and contributor(s) and not of MDPI and/or the editor(s). MDPI and/or the editor(s) disclaim responsibility for any injury to people or property resulting from any ideas, methods, instructions or products referred to in the content.

