Abstract
Distribution networks have faced significant efficiency and reliability challenges, balancing the recent integration of electric vehicles (EVs) and renewable distributed generators (DGs). This study proposes a reconfiguration optimization of the distribution system by adjusting the status of switches within the network. This approach aims to minimize power losses and enhance overall operational efficiency. To model the variability of wind and solar DGs, probability distribution functions (PDFs) are employed, which allow for a more accurate representation of their performance. Additionally, stochastic models and Monte Carlo Simulation (MCS) are utilized to generate various scenarios that reflect real-world conditions, including the charging and discharging behaviors of EVs. A sensitivity analysis is conducted to evaluate the effectiveness of our proposed reconfiguration strategy across different levels of EV and DG penetration.
1. Introduction
The increasing demand for electric vehicles (EVs) and renewable distributed generation (DG) sources is reshaping the landscape of modern power distribution networks. This transformation is primarily driven by a global push for sustainability, decarbonization, and energy efficiency. However, while these technologies bring significant benefits in terms of reducing carbon emissions and reliance on fossil fuels, their integration into existing power grids presents a series of new challenges. The key issues are largely due to the intermittent nature of renewable energy sources like wind and solar and the variable charging behaviors of electric vehicles, which can significantly affect the overall reliability and operational efficiency of the grid.
If the grid is not able to effectively manage the additional load from both EVs and DGs, certain sections of the network may experience overloading. This can lead to excessive wear on equipment, reduce the lifespan of infrastructure, and increase maintenance costs.
Overloading or incorrect power flow due to inconsistent generation or unpredictable demand can cause voltage deviations. These fluctuations can lead to poor power quality, affecting sensitive equipment and potentially damaging grid components.
Extended periods of overloading or poor voltage regulation can eventually result in equipment failures, requiring costly repairs or replacements and potentially leading to widespread outages.
Inefficiencies in power flow, resulting from the misalignment of supply and demand or the additional power required for EV charging and discharging, can lead to increased energy losses, thereby reducing the overall efficiency of the system.
To effectively address these challenges, the transition to an eco-friendly and sustainable energy system must integrate both transportation (EVs) and generation systems (renewable DGs) in a way that mitigates the adverse impacts on the distribution network. An innovative solution is required that can manage the uncertainties introduced by these technologies while ensuring the reliability, efficiency, and stability of the grid.
One promising approach to tackle these challenges is distribution network reconfiguration (DNR). DNR refers to the process of optimizing the topology of the distribution network by adjusting the status of switches within the grid. By strategically opening or closing certain switches, the flow of electricity can be altered to minimize losses, reduce congestion, and optimize voltage levels across the network. This approach can help mitigate the impacts of EV charging and renewable energy fluctuations by dynamically adapting the grid to changing conditions.
DNR in the presence of DGs has been investigated in several studies [1,2,3,4]. In these studies, the primary focus was on optimizing the topology of the distribution network by adjusting switch positions to enhance the network’s performance, particularly in the context of the integration of DG sources. The addition of DGs to the system typically requires changes in the topology of the distribution network to ensure that power from the DGs is optimally delivered to the loads and that the network’s performance is not negatively affected by fluctuations in power output from renewable sources.
The authors of [1] proposed an approach to optimize DNR in the presence of DG sources using a fast heuristic-based method. The practical effectiveness of the approach in achieving fast and reliable configuration was validated through case studies and simulations. However, the study did not address how the reconfiguration method adapts to dynamic changes such as varying loads, changing generation from renewable sources, and fluctuations in demand. Additionally, the impacts of DG on network losses, voltage profiles, and power quality were not explored.
The authors of [2] proposed a hybrid optimization model, termed the “hybrid Ttloa model”, for simultaneously performing DNR and optimal placement of DGs in order to reduce power losses. The key objective was to minimize active power losses while maintaining the operational reliability of the network, especially under contingencies. The proposed model was validated using multiple test systems. However, the study does not adequately discuss the computational complexity of the proposed method. Furthermore, the study did not consider uncertainties in the input parameters, such as variations in renewable generation, load fluctuations, or potential faults in the network.
The authors of [3] developed an innovative approach for optimizing the reconfiguration of distribution networks by incorporating DG systems using a parallel slime mold algorithm (PSMA). The results indicated that using PSMA significantly reduces power losses, improves the voltage profile, and enhances overall network efficiency when compared to other optimization techniques, such as genetic algorithms and particle swarm optimization.
The authors of [4] employed the Whale Optimization Algorithm (WOA) to optimize the reconfiguration of distribution networks while simultaneously determining the optimal placement of DG units. The study formulated the optimization problem as a multi-objective function that includes power loss reduction, voltage profile improvement, and cost-effectiveness in terms of both reconfiguration and DG installation. The method was tested on standard distribution network systems, including the IEEE 33-bus and IEEE 69-bus systems. The results showed that using WOA for simultaneous reconfiguration and DG allocation achieves significant reductions in power losses and improves the system’s voltage stability. The proposed method also demonstrated better convergence speed and solution quality compared to other traditional optimization algorithms.
Several studies tackled the DNR problem to support the integration of EVs [5,6,7,8,9,10,11,12]. DNR optimization studies for EVs typically aim to manage the impact of the EV charging demand on the grid by altering network configurations (e.g., switching operations) to prevent overloads, minimize losses, and maintain voltage stability.
The authors of [5] developed an optimization model that simultaneously considers the network reconfiguration and the integration of EVs. The model takes into account the charging stations’ locations, the charging and discharging patterns of EVs, and the overall energy demand. A genetic algorithm (GA) was used to explore different network configurations and determine the optimal placement of charging stations while considering the variable load introduced by EVs. The proposed strategy was tested on a test distribution system (such as the IEEE 33-bus system). By optimally placing charging stations and adjusting the network topology, the strategy effectively reduces power losses, improves voltage profiles, and enhances the system’s ability to handle EV charging demand. The results demonstrated that the integration of EVs can lead to significant improvements in the system’s performance when the network is properly reconfigured.
The authors of [6] explored an optimization approach for active distribution system planning that integrates non-utility-owned EV charging stations (i.e., privately owned or third-party charging stations) and network reconfiguration. The GA was used to determine the best locations for EV charging stations and the optimal network configuration that minimizes system losses, ensures voltage stability, and accommodates EV charging demands. The optimization approach was tested on a real distribution network. The results demonstrated that the proposed approach significantly reduces power losses and improves voltage stability compared to traditional distribution planning approaches.
The authors of [7] focused on reconfiguring the distribution network to maximize the efficiency and reliability of EV integration. The study utilized Binary Particle Swarm Optimization (BPSO) to minimize several key factors, including the cost of power exchange, active power loss, and operational costs associated with EVs. The simulation results highlighted the effectiveness of BPSO in determining the optimal status of switches within the distribution network, as well as in creating an optimal schedule for EVs. These findings underscore the potential of BPSO as a valuable tool for enhancing the integration of EVs into our distribution networks.
The authors of [8] presented an optimization framework aimed at determining the optimal locations for EV charging stations within a radial distribution network. Network reconfiguration was considered alongside the placement of EV charging stations to minimize power losses and improve voltage profiles under the additional load brought on by EV charging. The optimization method was applied to a test case of a typical radial distribution system. The results showed that the optimal placement of EV charging stations and the reconfiguration of the distribution network led to a significant reduction in power losses and an improvement in voltage profiles.
The authors of [9] focused on optimizing the reconfiguration of distribution networks that integrate EVs while also considering the environmental benefit of carbon reduction. The optimization model developed in the paper considers multiple objectives, including minimizing power losses, improving voltage stability, and maximizing carbon reduction. The optimization framework was applied to a case study of a distribution system with integrated EVs. The results demonstrated that the integration of EVs with proper planning and reconfiguration can contribute to both improved network performance and environmental sustainability.
The authors of [10] proposed a distribution system reconfiguration method that coordinates with maintenance scheduling while accounting for the uncertainty of EV charging loads. In this study, the EV charging loads were modeled stochastically using various scenarios. The distribution network configuration was then optimized to minimize both power loss and maintenance costs based on these EV charging load models. The application of this proposed method on the IEEE 33-bus network demonstrated its feasibility in optimizing network topology both before and after maintenance overhauls, adapting effectively to different EV charging scenarios.
The authors of [11] proposed an optimization-based approach to address the network reconfiguration problem, particularly in managing the unpredictability associated with EV charging patterns. A case study was presented to demonstrate the effectiveness of the proposed reconfiguration strategies conducted on the IEEE 33-bus distribution network with varying levels of EV penetration. The results showed that optimizing the network’s configuration can effectively reduce power losses, maintain voltage stability, and prevent overloading.
The authors of [12] developed a fuzzy Pareto heuristic network reconfiguration to balance multiple objectives, including performance improvement and grid-side emission reduction, while optimizing the placement and operation of EV charging stations within the distribution network. However, the study did not perform a sensitivity analysis to assess how changes in key input parameters such as EV penetration rates, grid-side emission factors, or load forecasting errors affect the optimal solutions. Additionally, the study assumed a generalized EV charging pattern, which may not reflect the diverse charging behaviors of different EV owners or geographical variations.
The integration of both renewable DGs and EVs creates new opportunities but also introduces additional complexities. Renewable DGs, with their intermittent and variable generation, combined with the dynamic and often unpredictable behavior of EVs, can result in power imbalances, voltage fluctuations, and inefficient use of available generation resources. To address this, many studies have explored how DNR strategies can be adjusted to support both renewable DGs and EV integration simultaneously [13,14,15,16,17,18]. These strategies involve a coordinated approach where the network’s topology is reconfigured to optimize the flow of energy from both renewable sources and EVs, ensuring minimal losses, stable voltage profiles, and reliable service for consumers. Moreover, advanced optimization techniques like multi-objective optimization, genetic algorithms, particle swarm optimization, and other heuristic methods are often employed to address the multiple conflicting objectives of reducing losses, improving voltage quality, and maximizing the use of renewable energy while managing the varying load from EVs. Such integrated DNR strategies often need to consider the time-varying nature of EV charging demand and the stochastic behavior of renewable generation to achieve optimal solutions.
The authors of [13] proposed a multi-objective optimization method for reconfiguring distribution networks in the presence of DG sources and EVs. The study developed a dynamic reconfiguration model aimed at minimizing active power loss, improving the load balancing index, and reducing voltage deviations within the network. To achieve this, the researchers employed the Lévy flight and chaos distributed beetle antennae search (LDBAS) algorithm. This innovative approach not only enhanced the computing speed but also improved the convergence rate of the optimization process. The proposed method was evaluated through simulations of the IEEE 33-bus and 118-bus systems. The results demonstrated the computational efficiency of the LDBAS algorithm and its effectiveness in finding global optimum solutions. Furthermore, the findings indicated that the reconfiguration method significantly enhances both the economic performance and power quality of distribution networks, particularly those with high penetrations of EVs and DGs.
The authors of [14] developed a novel hybrid optimization method that combines GA and the Shuffled Frog Leaping Algorithm (SFLA) to optimize network reconfiguration, considering the placement and displacement of DGs and EVs. The hybrid GA–SFLA algorithm demonstrated significant improvements in system performance, including reduced power losses and improved voltage profiles, when compared to conventional methods. The study also highlighted that the optimal placement and displacement of DGs and EVs effectively balance the load in the distribution system, reduce losses, and enhance voltage stability. Additionally, the hybrid GA–SFLA algorithm proved to be highly effective in solving the complex multi-objective optimization problem, yielding better results than using GA or SFLA alone.
The authors of [15] developed an optimal planning framework that simultaneously considers the placement and sizing of EV charging stations and DGs within a distribution network while also accounting for network reconfiguration and the uncertainties in renewable energy generation and EV charging behavior. The goal was to minimize the total cost of energy losses, improve the network’s efficiency, and enhance its reliability. The proposed model was applied to a case study of a smart distribution network with high levels of renewable energy integration and EV penetration. The results showed that optimal placement and sizing of EV charging stations and DGs can significantly reduce energy losses and operational costs. Additionally, network reconfiguration improved voltage stability and reduced the impact of uncertainties on the network.
The authors of [16] addressed the optimization problem of allocating controllable power factor DG in distribution networks, with a focus on networks impacted by EV charging stations. The study introduced a methodology that integrates DG placement with power factor control while considering network reconfiguration to improve power quality, reduce losses, and increase the system’s overall efficiency. However, the proposed method does not account for uncertainties in the system, particularly the variability in EV charging demand and renewable DG output.
The authors of [17] proposed a novel multi-objective optimization of DNR in the presence of DGs, EV charging stations, and demand response programs. The method was validated through case studies and simulation results. However, the study did not explicitly address the uncertainties in key parameters, such as renewable generation (e.g., solar or wind variability), EV charging demand fluctuations, or load forecasting errors. Additionally, the proposed approach assumes that EV charging is flexible and can be easily adjusted based on the demand response signal. However, real-world charging behavior may not always be as flexible or controllable due to user preferences, battery capacity constraints, and other factors. Furthermore, the study lacks an economic analysis to assess the feasibility of the method.
The authors of [18] developed an optimization method combining DNR with renewable energy integration to improve the system’s resilience under various contingencies. While the study highlighted the importance of robustness in DNR, particularly in terms of handling uncertainties (e.g., fluctuating renewable generation, load variations, and extreme weather events), the proposed approach did not clearly explain how these uncertainties are incorporated, which may limit the practical applicability of the proposed methodology.
Despite a large body of research on distribution network reconfiguration (DNR) and the integration of distributed generation (DG) sources, including renewable energy and electric vehicles (EVs), a critical gap persists in understanding the sensitivity of network performance to varying penetration levels of EVs and renewable DGs. As the penetration of EVs and renewable DGs increases, the impacts on network performance, such as system losses, voltage stability, and the risk of system overload, can vary significantly. These factors are highly dependent on the level of integration of these resources into the grid, as well as their intermittency and variability. However, most existing optimization studies fail to provide comprehensive sensitivity analyses that assess how changes in penetration levels of EVs and renewable DGs affect the optimal configuration of the distribution network.
In contrast to existing studies, which primarily focus on static or deterministic approaches to network reconfiguration, the novelty of our work lies in the sensitivity analysis conducted to evaluate the proposed optimization strategy across varying penetration levels of EVs and renewable DGs. This type of analysis is crucial for understanding the dynamic impacts on network performance, such as losses and overall system efficiency, as the penetration of EVs and DGs fluctuates. By systematically analyzing different penetration scenarios, our method provides a more comprehensive and adaptive framework for optimizing network configurations, something that is lacking in many existing investigations.
Without detailed sensitivity analysis, it is challenging to identify the most optimal configuration for a network under different scenarios of EV and DG integration. Existing methods typically focus on optimization under fixed conditions without accounting for how fluctuating penetration levels affect network performance. A static approach to network reconfiguration may not provide the flexibility needed to adapt to the dynamic nature of EV charging and renewable energy production. As penetration levels evolve, grid operators require clear guidance on how to adjust the network configuration to maintain efficiency, minimize losses, avoid overloads, and preserve system stability. Our approach, through sensitivity analysis, offers clear insights into how the network can adapt to these fluctuations, thus filling a critical gap in existing literature.
Furthermore, distribution networks with high levels of EV and renewable DG penetration are inherently intermittent due to the unpredictability of renewable energy generation (e.g., solar and wind) and the fluctuating charging and driving patterns of EVs. These uncertainties pose significant challenges to network operation and optimization. Despite this, many studies on DNR fail to account for or sufficiently model such uncertainties, which significantly limits their practical applicability in real-world settings. Our method specifically addresses this gap by incorporating techniques to handle these uncertainties, ensuring that the network can adapt in real time to dynamic changes.
This study proposes a DNR approach that specifically addresses the challenges of integrating EVs and renewable DGs into the grid. The main objective of this approach is to optimize the network’s configuration while managing the additional complexities introduced by these technologies. The key challenges that the proposed method tackles include the following:
- System uncertainties: These arise from the intermittent nature of renewable energy generation and the unpredictable charging behaviors of EVs. The optimization approach incorporates techniques to deal with these uncertainties, ensuring the network can adapt to real-time changes.
- Overloading: By dynamically adjusting the distribution network configuration, the approach aims to prevent overload situations that may arise due to the increased demand from EVs or fluctuating renewable energy outputs.
- Increased losses: The optimization process helps reduce losses by reconfiguring the network to minimize power flow inefficiencies, which can increase with the integration of variable renewable DGs and the additional load from EV charging.
One of the novel aspects of this paper is the sensitivity analysis conducted to evaluate the proposed optimization strategy across different penetration levels of EVs and renewable DGs. This analysis is crucial for understanding how system performance, such as losses and voltage stability, changes as the penetration of EVs and DGs varies. The sensitivity analysis provides a clearer picture of the network’s ability to handle different levels of technological integration, which is key for determining the most efficient and reliable configuration for each scenario. Additionally, by identifying the optimal penetration rates for EVs and DGs, the sensitivity analysis offers valuable recommendations for efficiently reconfiguring the distribution network and strategically locating DGs, potentially deferring the need for infrastructure upgrades or additional support.
By conducting this analysis, this study aims to provide more robust insights into how the network should be reconfigured under varying scenarios, ensuring that the optimization approach is adaptive and scalable. This will help grid operators plan more effectively for future scenarios, allowing for better management of grid performance as EVs and renewable DGs continue to be integrated.
This study is organized as follows:
- Section 2: Details the methodology proposed for distribution network reconfiguration, along with models for renewable DGs and EV charging/discharging.
- Section 3: Presents case studies and the test system.
- Section 4: Provides simulation results for various scenarios.
- Section 5: Performs sensitivity analysis and evaluates the distribution system reconfiguration optimization at various EV and renewable DG penetration levels.
- Section 6: Concludes with the findings of the study.
2. Methods
2.1. Distributed Generation Model
This section focuses on the mathematical modeling of variability and randomness in renewable energy sources, specifically wind and solar generation, using probability distribution functions (PDFs). By employing PDFs, we can effectively predict the likelihood of various energy outputs while accounting for the inherent uncertainties associated with solar irradiance and wind speeds.
2.1.1. Wind DG Model (Weibull PDF)
Curve fitting is conducted on historical hourly wind speed data to evaluate different PDFs and identify the most accurate model for wind speed variations. We found that the Weibull PDF most effectively captures the random behavior of wind. The Weibull distribution is governed by the following equation:
is the Weibull PDF for wind speed. and are the shape and scale parameters for the Weibull PDF. is the wind speed.
Furthermore, we modeled the power generated by the wind renewable DG using the following equation:
and are the output power and rated power of the wind DG. , , and are the cut-in, cut-out, and rated speeds of the wind turbine.
2.1.2. Solar DG Model (Beta PDF)
PDFs cannot be directly applied to solar DG due to the certainty of zero solar irradiance during night-time, which is influenced by strong diurnal patterns.
To address this, we propose an alternative approach by modeling the clearness index to characterize solar irradiance indirectly. The hourly clearness index () is calculated using the following formula:
is the hourly clearness index. is the irradiance on a horizontal plane, and is the extraterrestrial solar irradiance.
We performed curve fitting on our historical hourly clearness index data to evaluate different PDFs and found that the Beta PDF most accurately models our clearness index. The Beta distribution is defined by the following equation:
is the Beta PDF for clearness index. is the gamma function. and are the shape parameters of the Beta distribution.
Upon calculating the hourly clearness index, the irradiance on a surface with inclination to the horizontal plane is calculated using the following formula:
Here, T and are parameters influenced by various factors, such as inclination, declination, sunset hour angle, and latitude.
The power generated by the solar renewable DG can be expressed as
is the output power of the PV DG. and are the area and efficiency of the solar PV array.
2.2. EV Charging/Discharging Model
This section focuses on modeling of EV driving patterns and charging behaviors. Probabilistic methods based on historical driving data are utilized to derive the charging and discharging power of EVs, adhering to specific inequality constraints:
and are the charging and discharging powers of the EV battery. and are the maximum charging and discharging capacities of the EV battery. is the number of time steps throughout the simulation period.
To enhance our analysis, we cluster EVs with similar driving patterns into separate fleets. This approach allows us to create an aggregate model for EV charging and discharging behaviors, facilitating more accurate predictions and optimizations.
2.3. Monte Carlo Simulation
MCS is used to analyze various samples of wind power, solar power, and EV charging/discharging power. This analysis is based on the stochastic models developed in Section 2.1 and Section 2.2 of the paper.
The generated samples serve as inputs into our objective function (f) to calculate the MCS outputs (Y), as represented by the following equation:
These MCS outputs create scenarios that replicate real-world conditions by simulating all possible states. At the conclusion of each simulation, we calculate the average values of the outputs. We ensure that the simulation is repeated sufficiently to achieve convergence to an optimal solution, at which point the average values stabilize and do not change with the inclusion of additional scenarios.
2.4. Distribution Network Reconfiguration (DNR)
Integration of DGs and EVs in distribution networks poses challenges for efficient and reliable operation of the system. The increased charging demands from EVs can elevate system loading, potentially stressing the network. Additionally, the power flow between DGs and EVs may lead to increased distribution system losses.
To tackle these issues, we propose a system reconfiguration optimization strategy aimed at adjusting the physical layout of the network to enhance power flow efficiency. This involves optimally opening normally closed sectionalizing switches and/or closing typically open tie switches.
An unbalanced three-phase power flow (PF) analysis is employed to calculate power loss for both the original and reconfigured systems. This analysis accounts for the inherent heterogeneity of overhead lines and the unbalanced nature of loads within the distribution network. By comparing power losses between the original and reconfigured networks, we can quantify the reduction in power loss achieved through network reconfiguration.
The objective function for minimizing power loss within the distribution grid is modeled as follows:
is the active power loss within the distribution network. and are the number of branches and tie-switches. , , and are the resistance, current, and status of the lth branch/tie switch.
The objective function is subject to specific constraints as follows:
2.4.1. Node Voltage Limit
The operating voltage at each bus () within the distribution network must adhere to standard limits, defined as follows:
is the operating voltage at each bus, with set at 0.95 pu and at 1.05 pu.
2.4.2. Feeder Capacity Limit
To ensure safe and reliable operation, the current through each branch must not exceed its maximum capacity:
is the maximum current threshold of the lth branch.
2.4.3. Bus Isolation Limit
To maintain connectivity, only one switch should remain open in a loop, ensuring that each bus is connected to at least one feeder during system reconfiguration. This prevents open loops and guarantees a constant power supply across the network.
2.4.4. Network Configuration Limit
The number of closed switches must equal the number of buses minus one, characteristic of a radial network. This constraint ensures that there is only one path between any two points in the network and is modeled as follows:
is the number of buses within the distribution network.
2.4.5. Power Balance Limit
Active and reactive power balance must be maintained in the reconfigured distribution system to ensure that all loads are met while compensating for losses. The balance equations are as follows:
and are the active power generation and demand at bus . and are the reactive power generation and demand at bus . and are the active and reactive power losses within the distribution network.
GA is used in our analysis to achieve optimal reconfiguration and minimize system losses.
3. Case Study
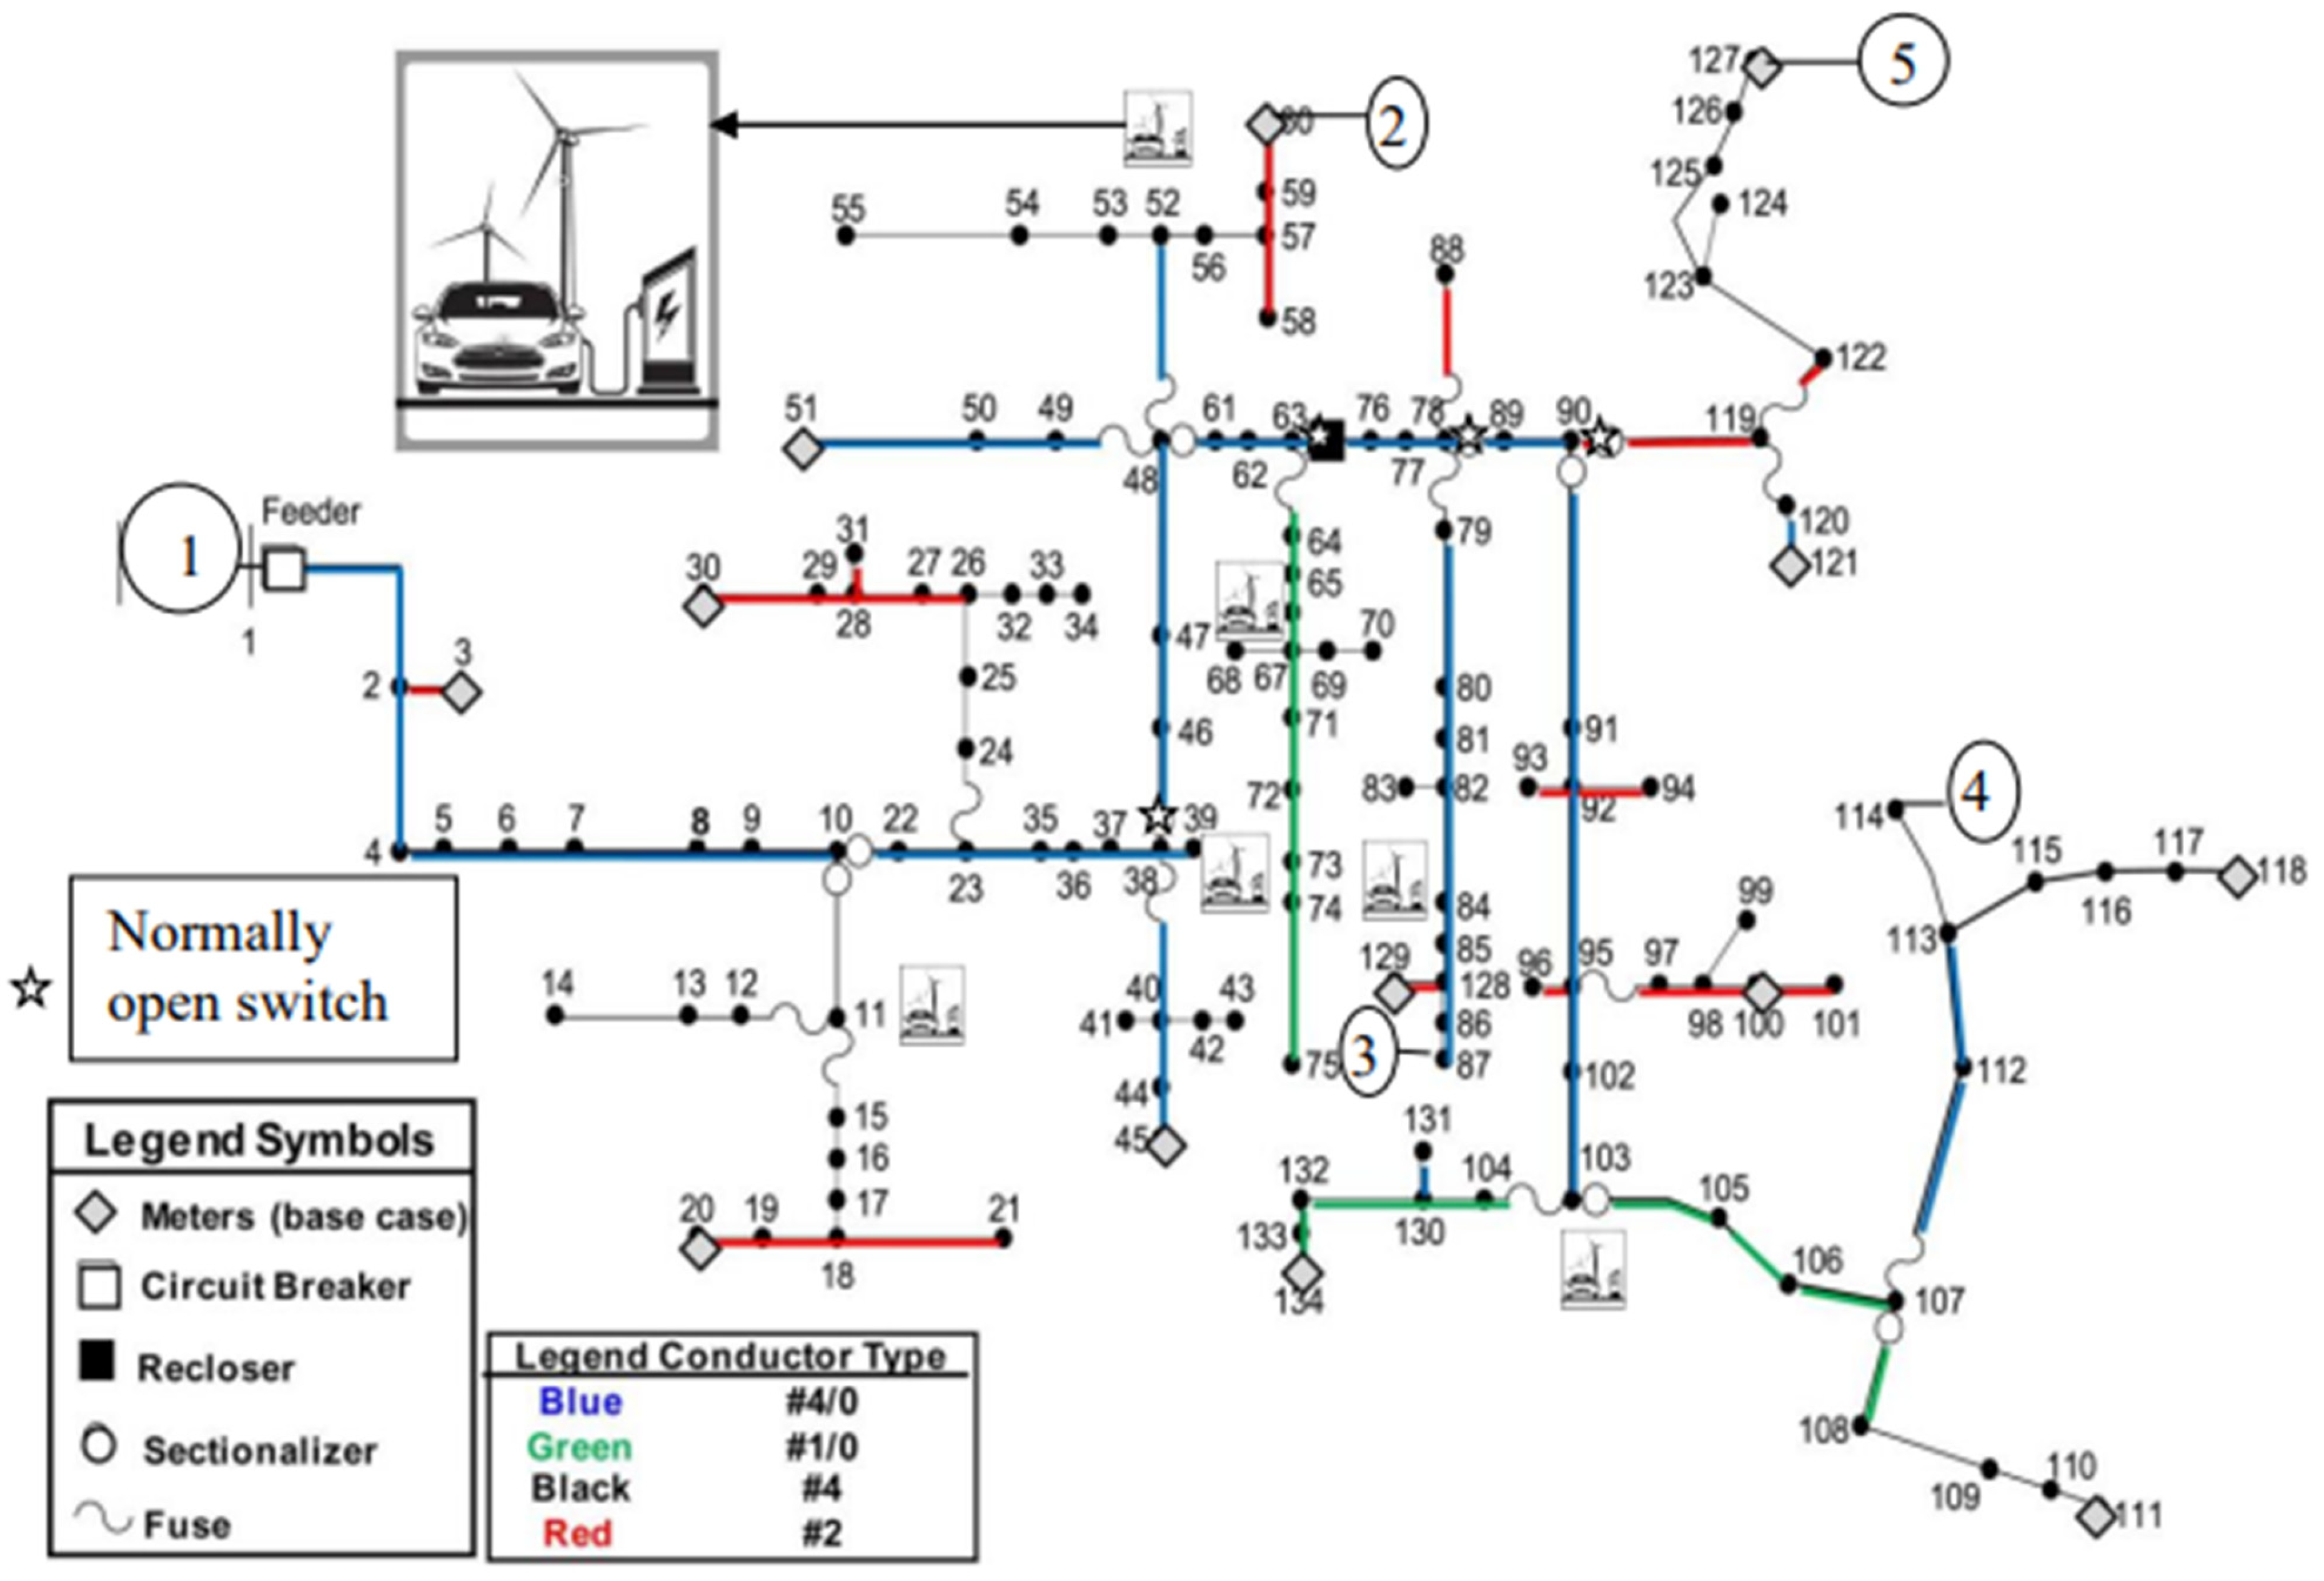
This section provides an overview of the test system utilized in our study to evaluate the performance of the proposed optimization method. The system comprises a 13.8 kV, 134-bus distribution network, as illustrated in Figure 1, which provides the single-line diagram.
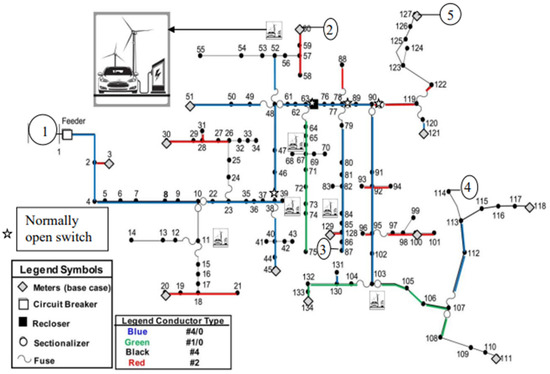
Figure 1.
Single-line diagram of the test network.
In this setup, we installed a 10 MW renewable DG capacity across six buses within the network. Specifically, buses 67, 84, and 103 are connected to three wind DGs operating at a power factor of 0.85. Additionally, buses 11, 39, and 52 host three solar DGs with a power factor of 0.95.
Furthermore, the network accommodates 484 EVs organized into six fleets. Reference [19] is used to derive the EV driving pattern data and to generate the aggregated charging and discharging power for each fleet. To enhance energy flow between the EVs and the renewable DGs, EV charging stations are strategically located on the same buses as the DGs. Notably, the EVs are equipped with vehicle-to-grid (V2G) functionality, allowing them to discharge power back to the grid when needed.
To simulate the renewable DG generation and the charging/discharging power of the EVs over a 24 h period, we generated 10,000 scenarios using MCS and averaged the results. The Mersenne Twister method is used for generating random numbers in the MCS due to its long period and efficiency. The MCS is run for a total of 10,000 iterations to ensure sufficient statistical sampling and convergence. Convergence is monitored by checking the stability of the mean across successive iterations. Convergence is defined as achieving a relative change of less than 1% in the mean value over the last 1000 iterations. This threshold is chosen to ensure that the simulation results are stable and reliable.
Table 1 provides the parameters of the GA used for DRN optimization in this study.

Table 1.
GA parameters.
4. Simulation Results
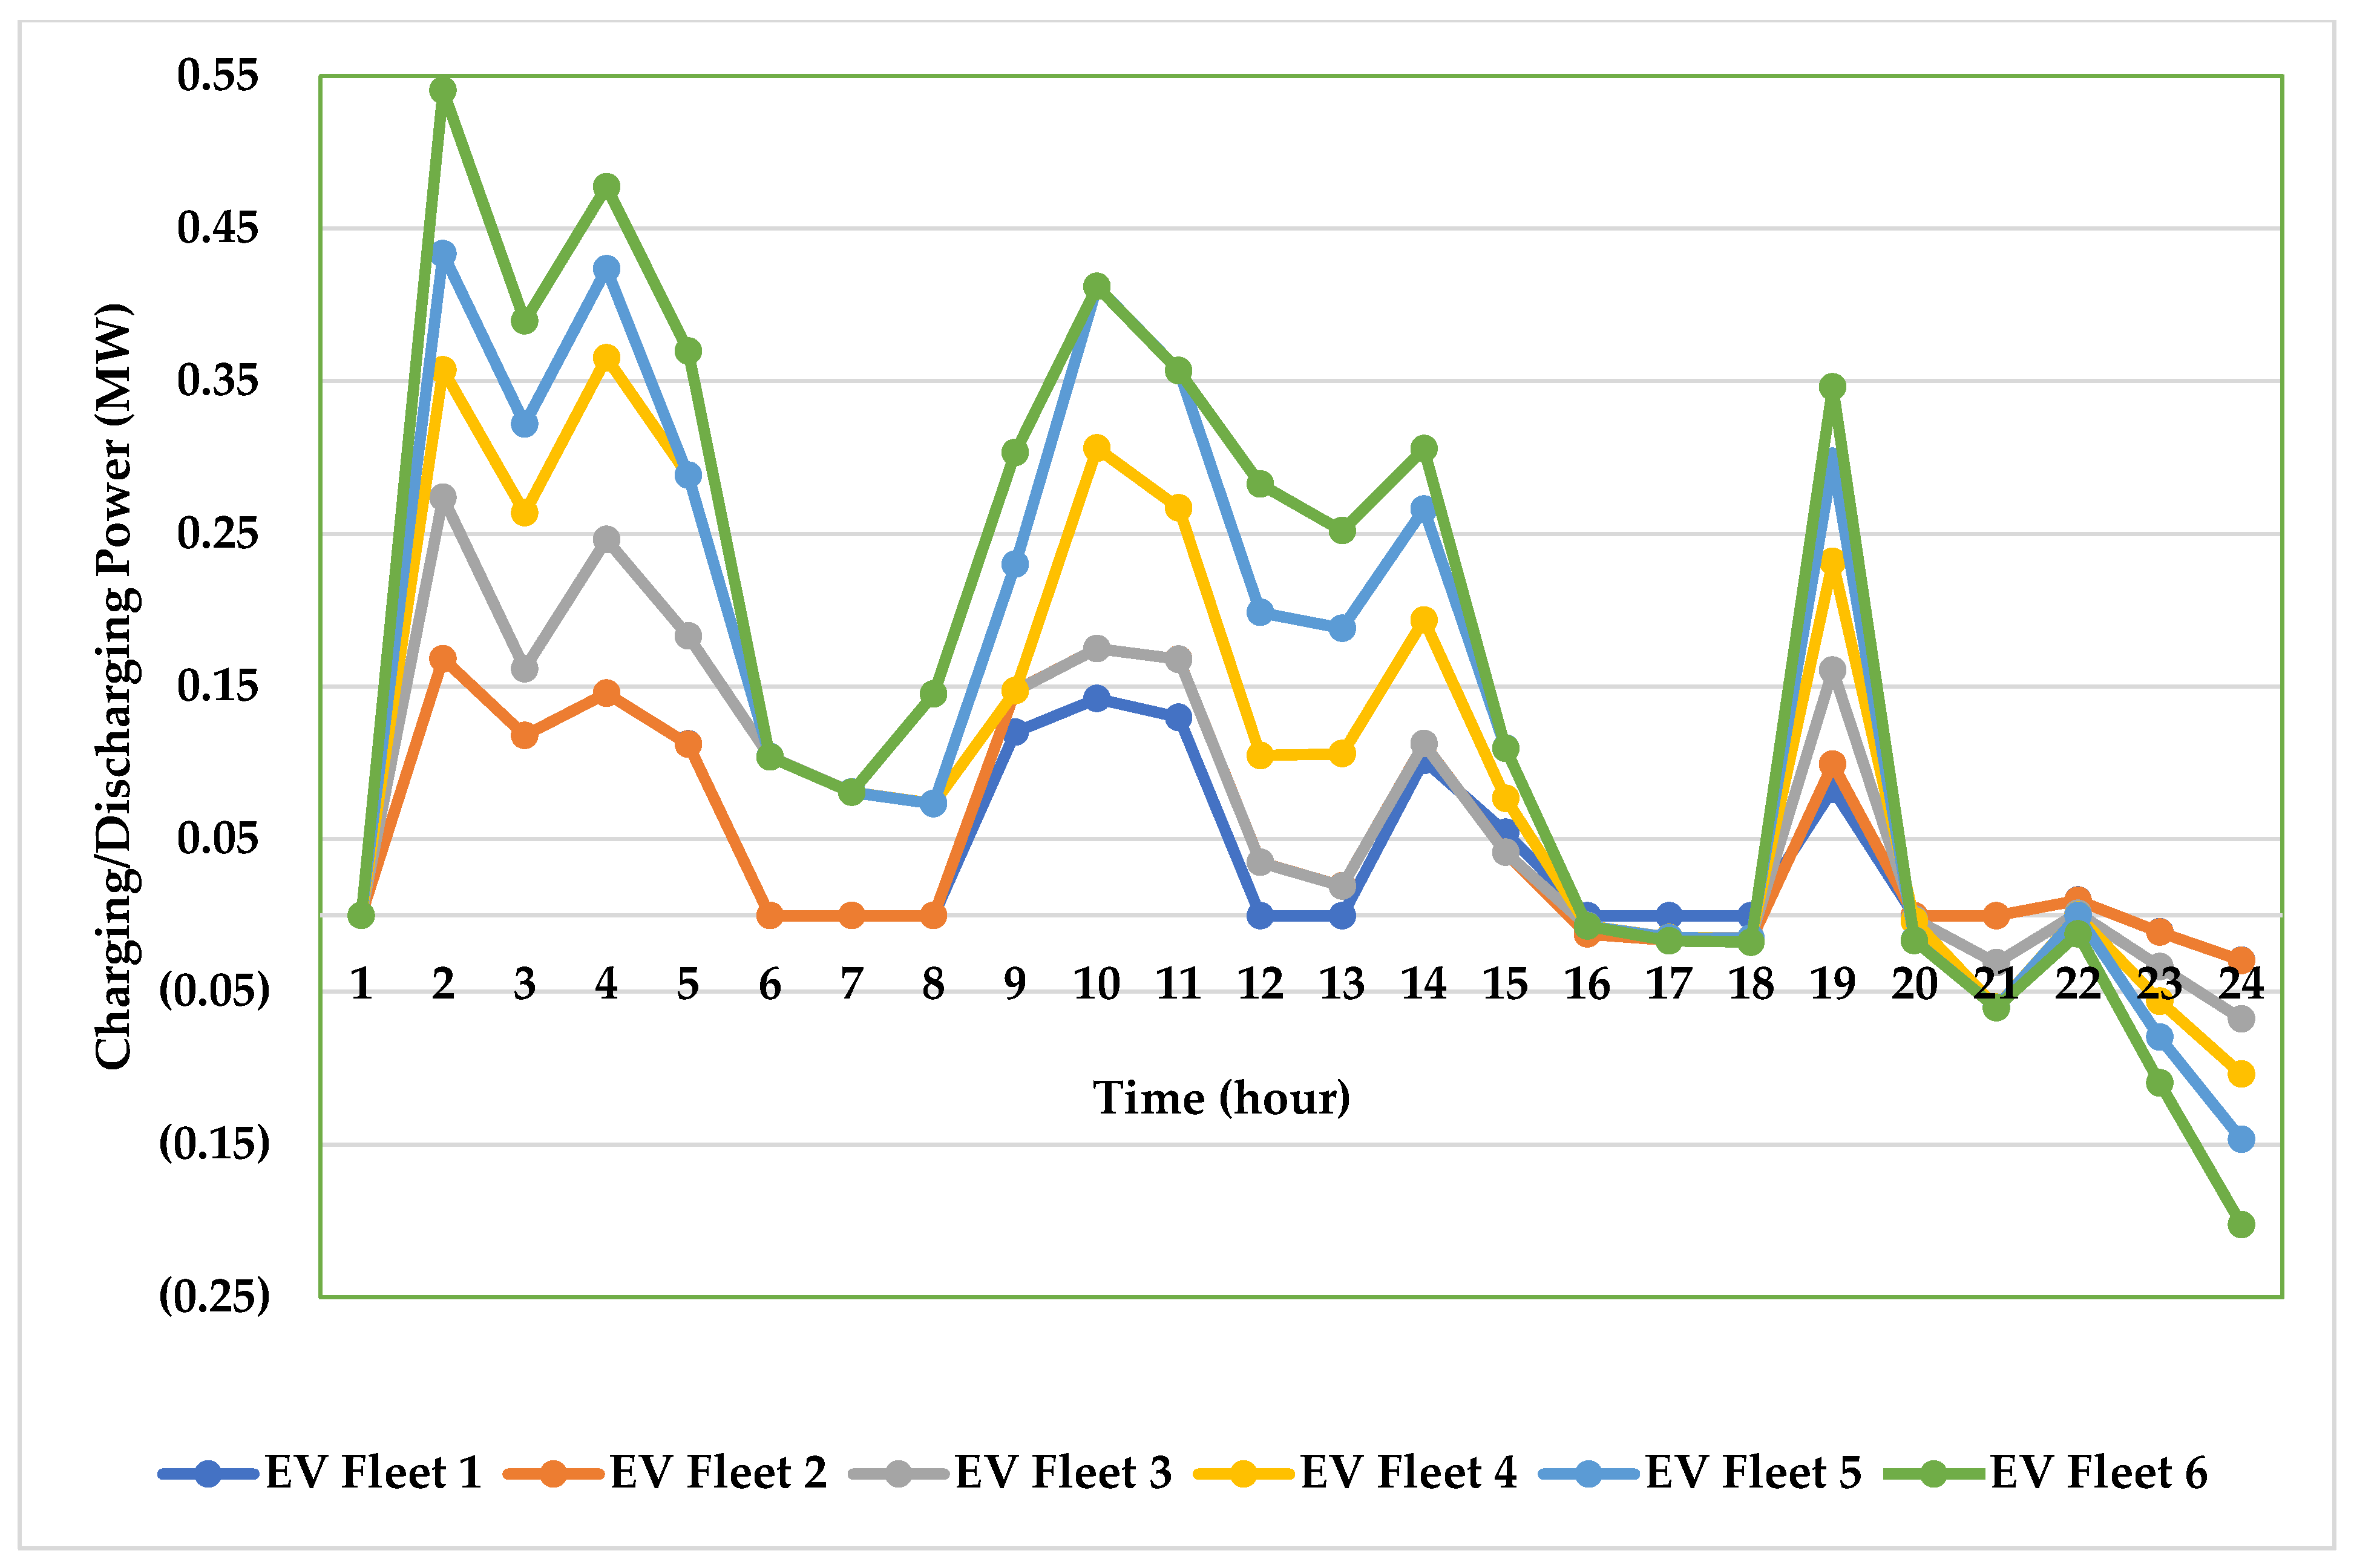
The State of Charge (SOC) values for each EV fleet are calculated across 10,000 MCS scenarios. These simulations model a variety of potential real-world conditions, allowing for a comprehensive analysis of the fleet’s charging and discharging behaviors. Once the SOC values are calculated for each simulation, they are averaged over time to determine the hourly power consumption or generation profile for each fleet. This averaging helps smooth out fluctuations and provides a reliable representation of the fleet’s energy use over time.
To determine the charging and discharging power for each fleet, the SOCs of consecutive hours are subtracted from one another. The difference between these values indicates whether the fleet is charging (positive difference) or discharging (negative difference). This subtraction method enables the tracking of power flows in and out of the EV fleet during the simulation period. Figure 2 visually illustrates the EV charging and discharging power over the 24 h simulation period. In the figure, positive values represent power being supplied from the grid to the EVs (charging), while negative values indicate power being discharged from the EVs back into the grid (discharging).
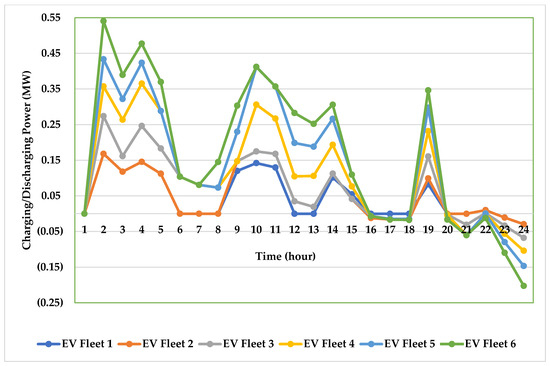
Figure 2.
Charging and discharging of the EV fleets for the 24 h simulation period.
In some cases, the values are very close to zero, which corresponds to minimal or negligible power exchange between the grid and the EV fleet. These small fluctuations can be attributed to the relatively steady SOC during certain hours, where the battery power remains constant, and there is little need for charging or discharging.
For the purposes of this study, the EVs are assumed to have a battery power rating of 6 kW, which serves as a baseline for the charging and discharging rates. However, the average power of each fleet varies depending on the number of EVs within the fleet, which is determined through a clustering process. The clustering groups the EVs based on their usage patterns, allowing for the simulation of different fleet sizes and their corresponding power demands or generation capabilities.
The proposed reconfiguration optimization is used in this section to minimize system losses through the optimal operation of switches. This optimization involves strategically closing and opening switches, and the effectiveness of loss reduction is assessed by conducting a three-phase power flow (PF) analysis on the reconfigured system. The power loss is then compared to that of the original network.
The optimization results indicate the following configurations:
- Four tie switches between buses 38–46, 63–76, 78–89, and 90–119 are set to a normally open status.
- Three sectionalizing switches between buses 10–22, 61–48, and 105–106 are maintained in a normally closed status.
- Additionally, new sectionalizing switches have been integrated between buses 62–63, 89–90, 95–102, and 102–103.
Table 2 provides a detailed view of the optimization results, outlining the hourly switching actions over the 24 h simulation period. In this table, green cells indicate switch-closing actions, red cells represent switch-opening operations, and shaded cells denote idle switching operations.
Table 2.
DNR optimization results.
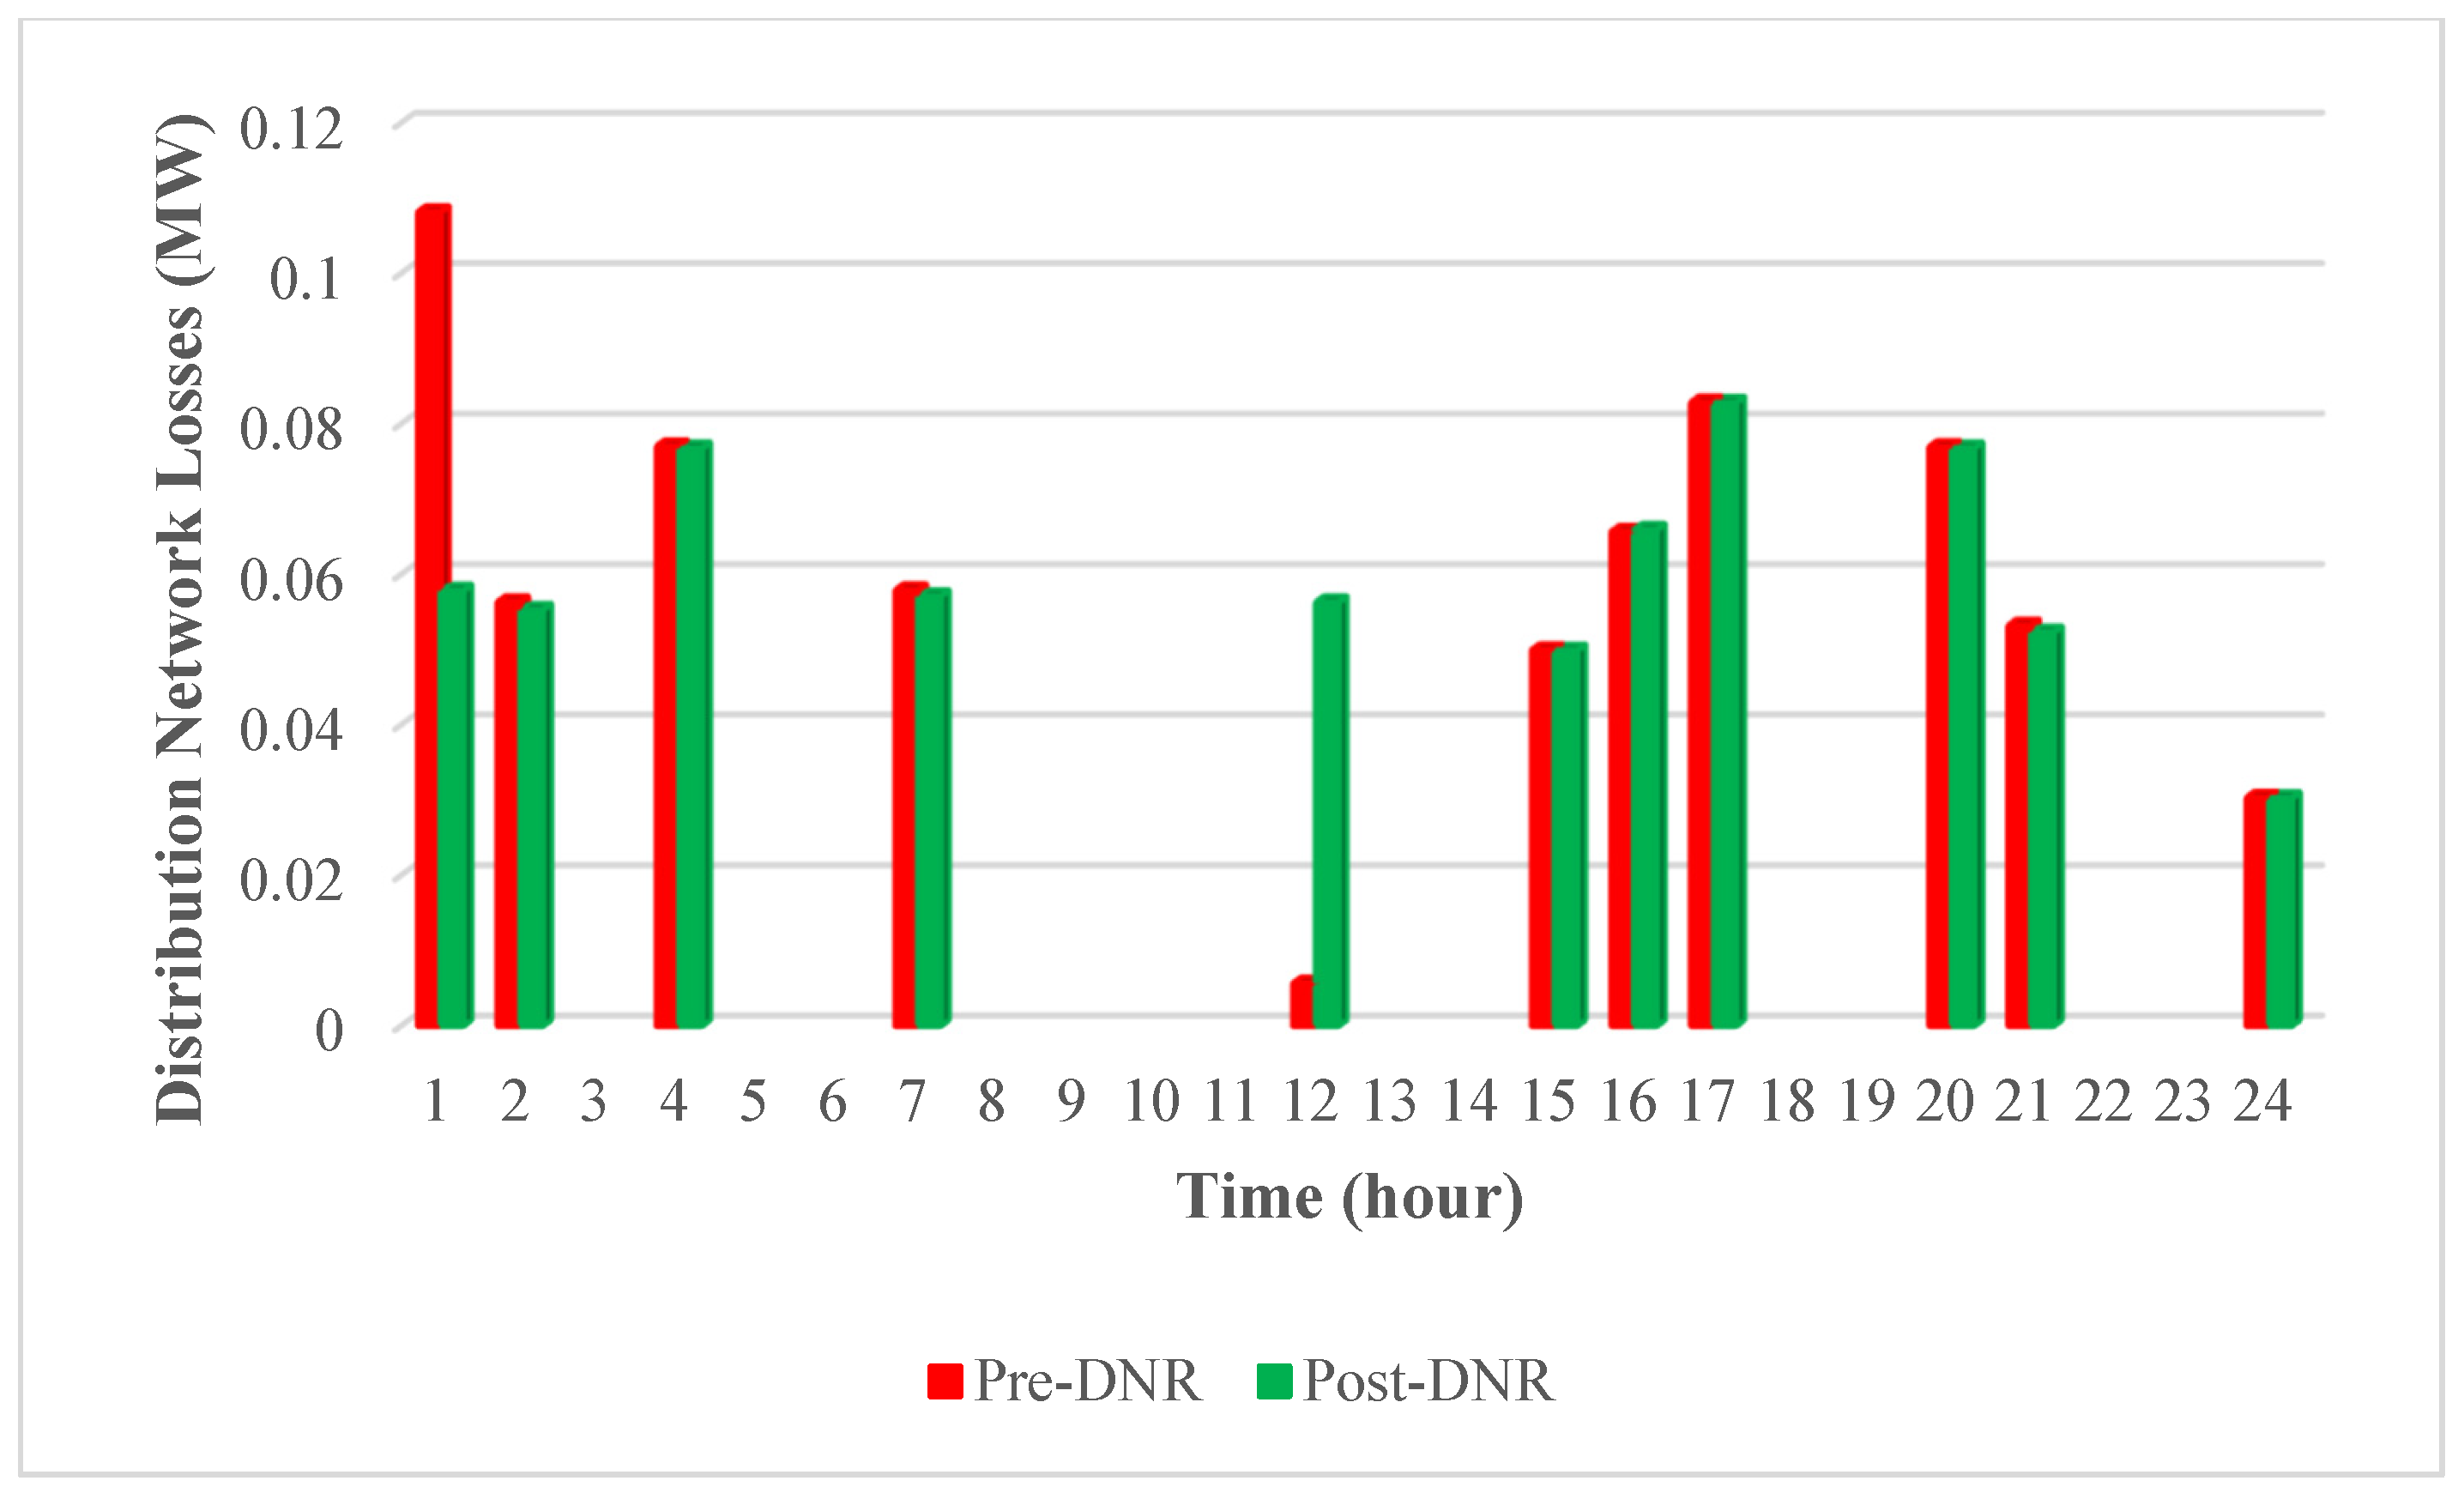
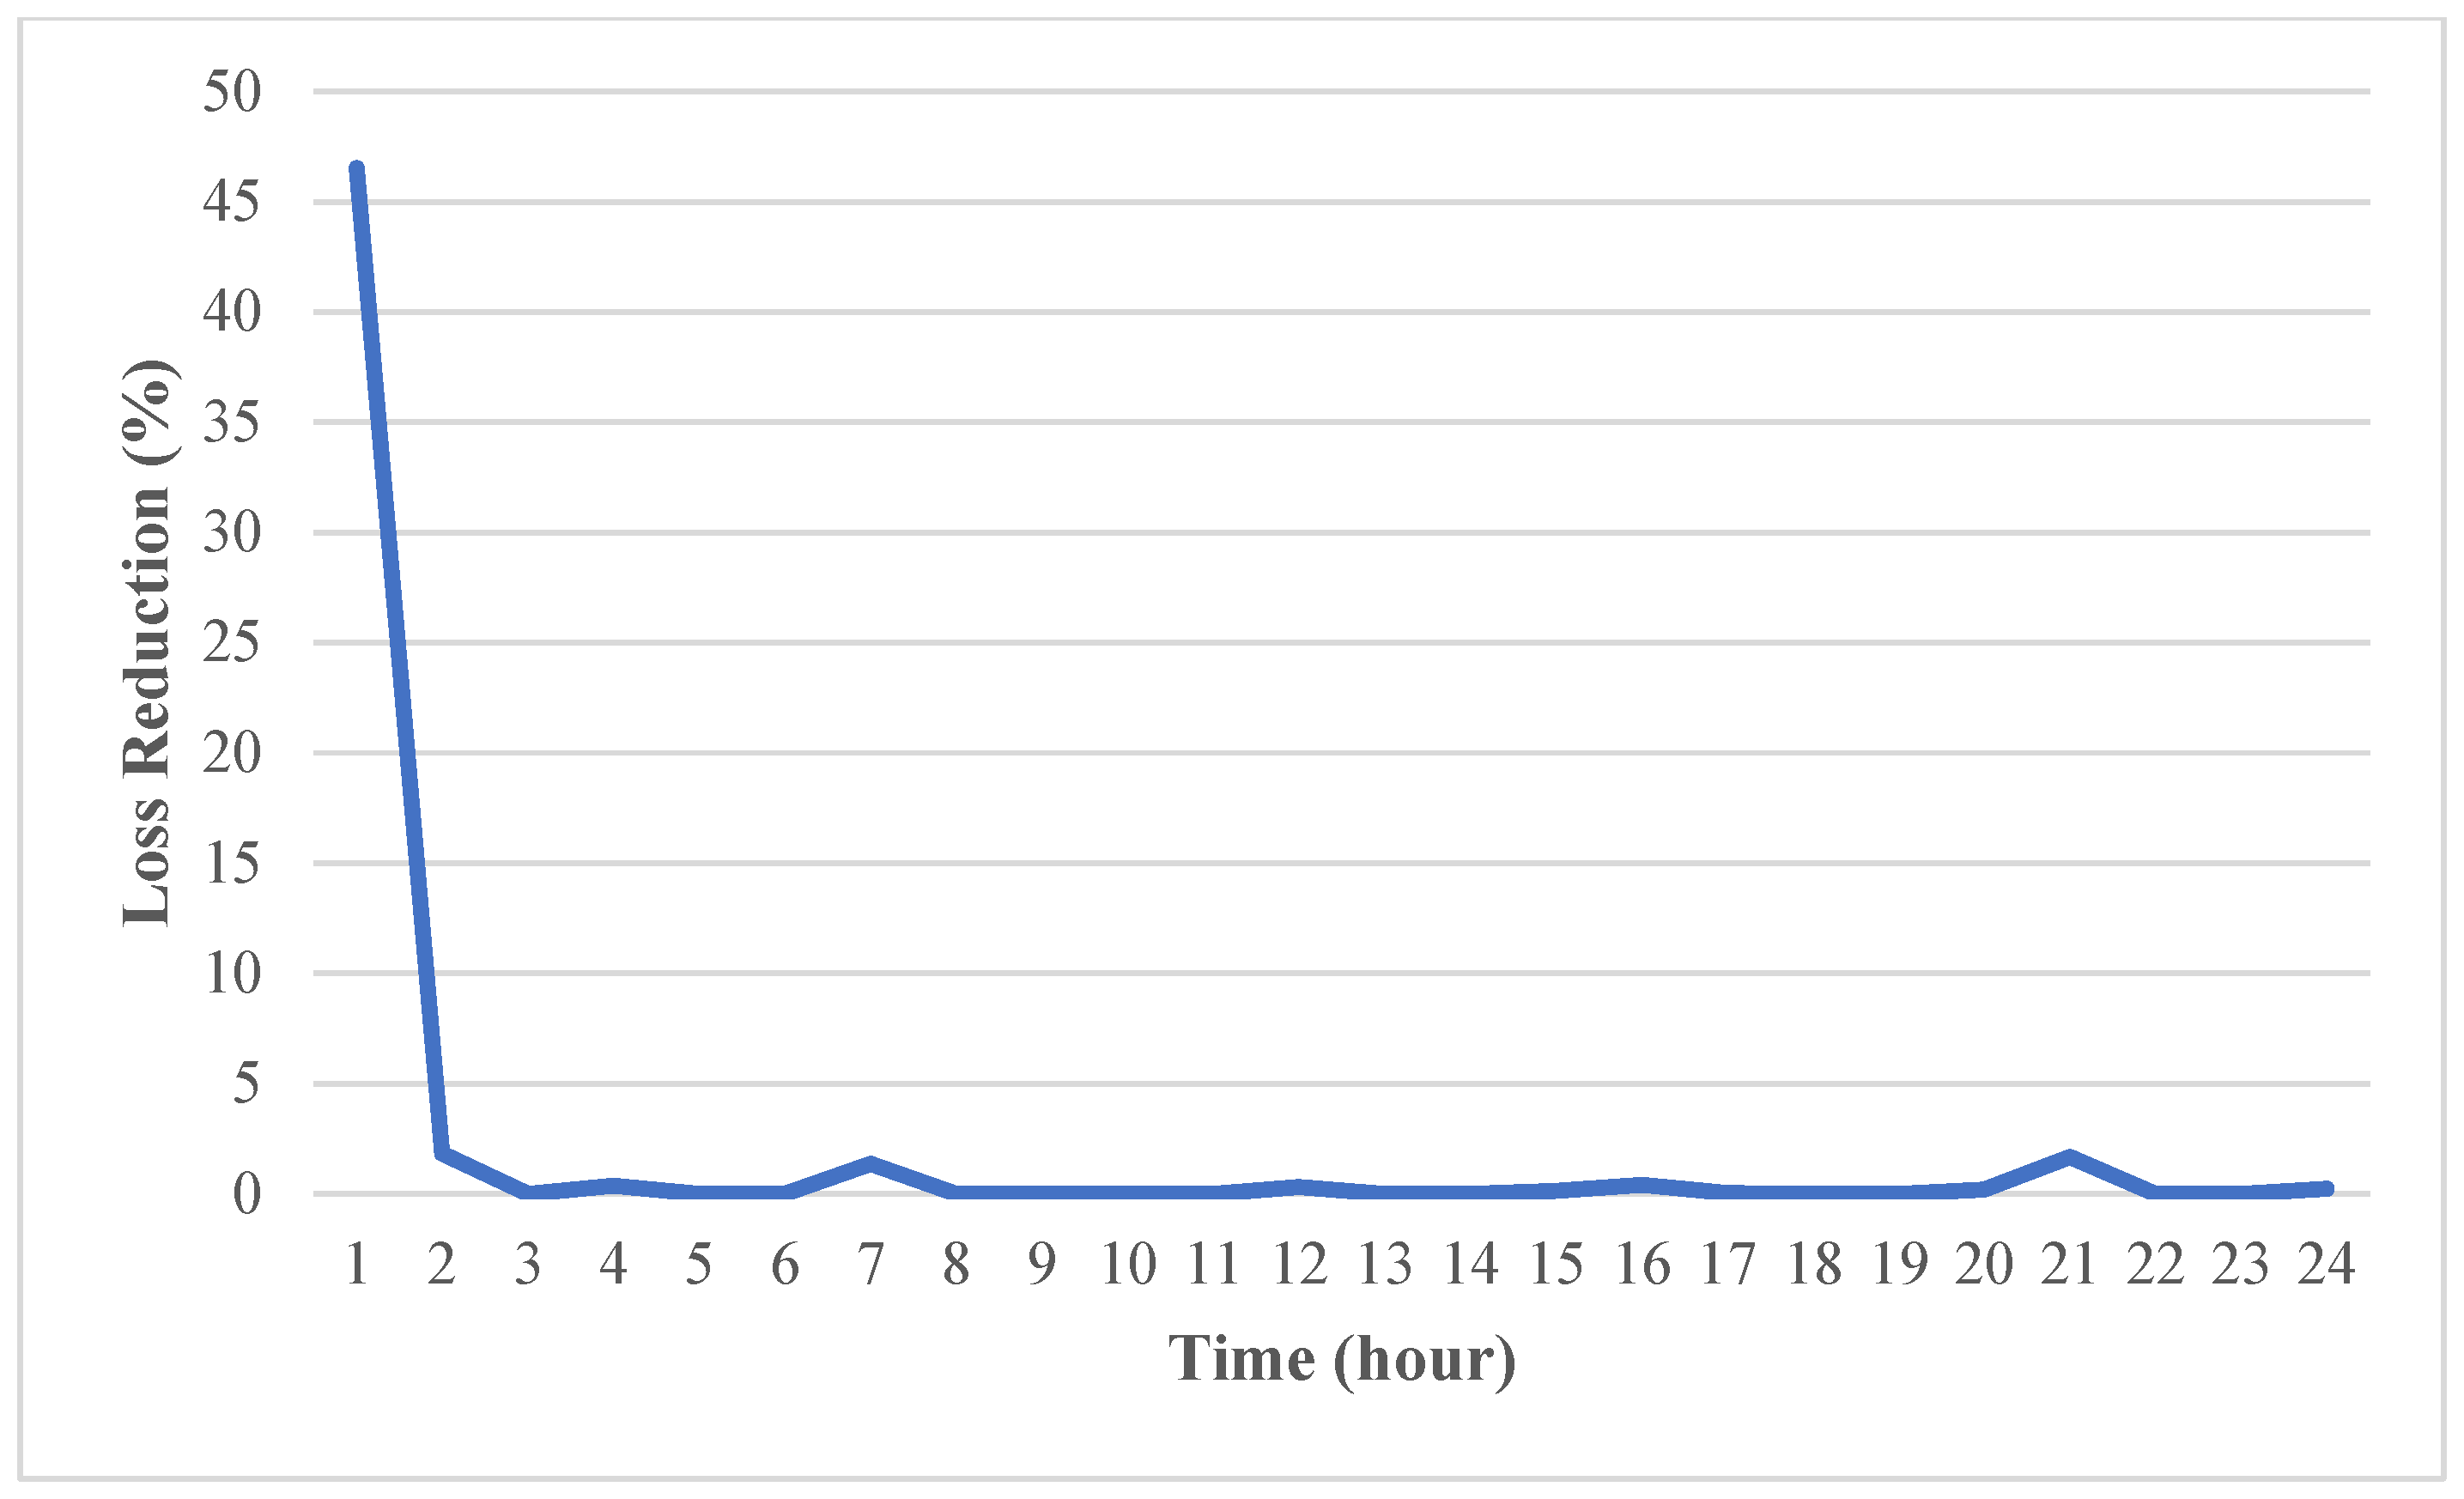
Figure 3 presents the power flow results, comparing system losses for both the original and reconfigured networks. Figure 4 demonstrates the loss reduction in percentage due to DNR optimization.
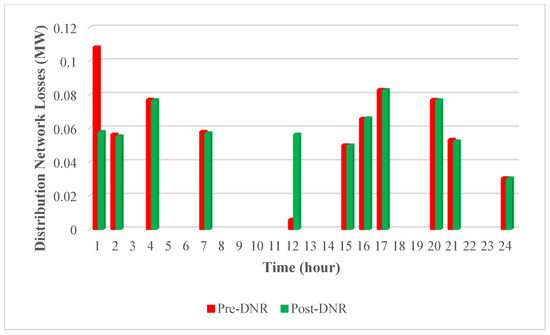
Figure 3.
Distribution network losses before and after DNR for the 24 h simulation period.

Figure 4.
Distribution network loss reduction after DNR optimization for the 24 h simulation period.
The simulation results can be characterized into two main areas: planning optimization and real-time operation optimization.
4.1. Planning Optimization
The simulation results demonstrate that adjusting the system configuration during hour 1 led to a substantial reduction in power losses, achieving a remarkable decrease of up to 46.52%. This significant improvement was made possible by strategically integrating new sectionalizing switches and executing eight switching actions that involved both the existing and newly added switches. By modifying the system configuration, power flow was more efficiently managed, which drastically minimized power loss. This emphasizes the importance of a well-thought-out planning approach that optimizes the distribution network’s structure in advance to reduce operational losses. The drastic reduction in power loss showcases the effectiveness of this planning strategy in enhancing the overall efficiency of the distribution network. These results underscore the effectiveness of the proposed optimization method in a planning context, where advanced system configuration and proactive changes in the distribution network can significantly enhance its efficiency and reduce operational losses. This emphasizes that the primary strength of the proposed method lies in its ability to optimize the network structure well in advance, in line with long-term planning objectives.
4.2. Real-Time Operation Optimization
From hours 2 to 24, the switching actions were largely responsive to dynamic changes in EV charging demand and the output from renewable DGs (such as solar and wind). These switching operations were designed to adapt to fluctuating energy generation from renewable sources and changing demand patterns caused by electric vehicle charging behaviors. Unlike the planning optimization, where substantial changes were made, the power losses during these hours were relatively minimal, resulting in only marginal power reductions. This indicates that the system had already been optimized in the earlier planning stage, and the real-time optimization mainly focused on fine-tuning the network in response to real-world fluctuations. This suggests that the proposed method is not primarily intended for real-time operation but rather as a planning tool designed to set up a robust foundation for the network. While real-time operations are important for adapting to immediate changes, the core advantage of the proposed method lies in its ability to establish an optimized system configuration that minimizes operational losses before these fluctuations even occur.
4.3. Discussion
Given these simulation results, it is clear that the proposed method is most effective as a planning tool, ensuring the distribution network is optimized well in advance to minimize losses during actual operation. While real-time adjustments are important, the proposed method’s value is realized primarily through strategic planning, where the significant reduction in power losses from hour 1 illustrates its potential for long-term efficiency improvements.
The real-time system reconfiguration and switching actions pose several challenges, such as communication delays (latency) and limited real-time control and automation [20]. Communication systems can experience delays due to various factors, such as network congestion, limited bandwidth, or the distance between components. These delays can cause a lag between the occurrence of a system event (e.g., a change in energy demand or renewable generation) and the response from the control system. This can result in delayed or suboptimal switching actions, which may affect the system’s stability or efficiency, especially when rapid reconfigurations are needed. Additionally, some areas of the grid may still rely on manual intervention or have slower automated response times due to limitations in control algorithms or hardware. This can lead to slower decision-making and may require human operators to intervene in some cases. Real-time switching actions would, therefore, be delayed, reducing the overall effectiveness of the reconfiguration. While the proposed method is designed as a planning tool, it could be adapted for real-time applications, with modifications to account for communication latency and other practical constraints. Future research could focus on integrating faster communication systems, distributed control mechanisms, or more advanced real-time optimization techniques to mitigate these challenges.
5. Sensitivity Analysis
A sensitivity analysis is conducted to evaluate the performance of the distribution system reconfiguration optimization at varying penetration levels of EVs and renewable DGs. The penetration level refers to the proportion of the total system load that is attributed to either EVs or renewable DGs, as outlined in Table 3. For this analysis, the total load of the system is fixed at 35.32 MVA. The penetration levels of both EVs and renewable DGs are expressed as percentages of the total system load and are distributed equally among these two technologies.
Table 3.
MVA load for EV fleets and renewable DGs at various penetration levels.
To effectively conduct the sensitivity analysis, the system is tested under two distinct scenarios to isolate the impacts of each technology individually:
- For Renewable DGs: The impact of renewable DGs is assessed by setting the penetration level of EVs to 0% (effectively turning off all EVs). In this case, the focus is placed entirely on varying the penetration levels of renewable DGs within the system. This allows us to understand how the integration of renewable energy sources, such as solar and wind, influences the system’s performance, including power loss reduction and efficiency, when there is no additional load from EVs.
- For EVs: Conversely, to examine the effects of EV penetration, the renewable DGs are set to 0% penetration, effectively turning off the renewable generators. This scenario focuses solely on the effects of EV integration on the distribution system. By doing so, the analysis can identify how varying levels of EV charging demand impact the overall network performance, including any potential overloads or increased losses that may result from the fluctuating charging behaviors of electric vehicles.
As in our previous study, we assume that switches 38–46, 63–76, 78–69, and 90–119 are normally open tie switches connecting five feeders before optimization. These switches serve as critical network components that can be toggled to alter the system configuration and optimize power flow. The status of these switches is important in the optimization process, as their operation directly affects the distribution network’s efficiency, especially in terms of power loss reduction and voltage regulation.
For the analysis, hour 1 is selected as the focal point for planning optimization due to the significant power loss reduction observed during this period. Hour 1 is seen as the optimal starting point for reconfiguration because it reflects the most impactful configuration adjustments that yield the highest reduction in power losses. The sensitivity analysis is specifically conducted at different penetration levels of EVs and renewable DGs for this hour. The focus on hour 1 allows for a detailed understanding of how the system responds to changes in penetration levels of EVs and DGs during an optimized planning phase.
However, it is important to note that although the sensitivity analysis is concentrated on hour 1, it can be extended to cover the entire 24 h simulation period.
Table 4 and Table 5 present the results of the sensitivity analysis. These tables include the proposed switching actions at various penetration levels of EVs and DGs, as well as the corresponding power loss reductions achieved under these conditions. The results provide a clear picture of how different configurations of the distribution network, influenced by varying EV and DG penetration levels, impact overall network performance. By reviewing these results, we can assess how the proposed optimization strategies perform in different scenarios and determine the most effective configurations for minimizing losses and ensuring the network’s efficient operation under various levels of renewable energy and EV integration.
Table 4.
DNR optimization and loss reduction for variable EV penetration with 0% DG penetration.
Table 5.
DNR optimization and loss reduction for variable DG penetration with 0% EV penetration.
5.1. Key Findings
The analysis revealed several important insights into the relationship between EV penetration, DG penetration, and system losses. These findings provide a deeper understanding of how the optimization process can reduce power losses based on varying levels of these technologies.
5.1.1. Impact of EV Penetration on Loss Reduction
As EV penetration in the system increases, the percentage of loss reduction also rises. This is because an increase in EV penetration corresponds to a higher total system load, which provides more opportunities for the optimization process to minimize losses. When more EVs are integrated, the overall demand on the system increases, allowing the reconfiguration process to adjust the network more efficiently and reduce losses. This phenomenon demonstrates how higher load levels can improve the effectiveness of the optimization in reducing power losses.
5.1.2. Non-Linear Correlation Between DG Penetration and Loss Reduction
Unlike EV penetration, the loss reduction percentage is not linearly correlated with the DG penetration level. In scenarios where DG penetration is either significantly lower or higher than the total system load, there tends to be a substantial power flow either from the grid to the distribution system or vice versa. This imbalance in power flow causes additional system losses, but these losses can still be minimized through the optimization process.
On the other hand, when the DG penetration is more closely matched to the system load, the local DG units are able to supply power directly to nearby loads. This results in minimal power flow between the distribution system and the grid, leading to lower system losses. As a result, the optimization process is less impactful in these scenarios because the need for further loss reduction is minimal.
An optimal DG penetration range appears to be one where DG capacity is well-aligned with the distribution network’s demand profile, typically in the moderate range of 40–60% of system load, allowing for efficient power distribution and minimal grid reliance.
5.1.3. Effect of DG Proximity to Load Pockets
The effectiveness of loss reduction is also influenced by the proximity of DG units to local load pockets. When large loads are served by nearby DGs, there is a reduced need for power to flow through the main branches of the distribution system. This reduces the amount of power loss in the system, as energy is consumed closer to its point of generation, minimizing transmission and distribution losses. In these situations, the optimization process is less effective because the system is already operating efficiently with minimal loss.
For instance, in the scenario where DG penetration is 75%, the loss reduction is relatively small (only 3%). This indicates that in cases with high DG penetration but limited proximity of DGs to large loads, the power flow remains optimized with little need for further adjustments, making the optimization process less impactful. Therefore, strategically locating DG units closer to major load centers can significantly reduce the need for extensive reconfiguration, and this can be an important consideration in determining the optimal penetration rate.
5.2. Switching Actions
The number of switching actions required in a distribution network can vary significantly depending on the penetration levels of EVs and renewable DG sources. In particular, the number of proposed switching actions for variable DG penetrations at 0% EV penetration is notably higher compared to those needed for varying EV penetrations. This discrepancy is primarily driven by the unique characteristics of renewable DG sources, specifically their intermittent nature and the associated challenges in balancing power generation and load.
As DG penetration increases, the network needs to adjust to the real-time availability of renewable power. The higher the DG penetration, the more frequently the system needs to reconfigure itself to either connect or disconnect specific parts of the network to align power generation with the demand in different areas.
These switching actions are essential to optimize the flow of electricity from renewable sources, ensuring that power generated by wind or solar energy is used efficiently and that the network remains stable. For instance, in times when solar generation is high, certain feeders might be reconfigured to utilize this local generation, while at other times, when solar output drops, the network may need to redirect power from the grid to maintain supply.
On the other hand, when EV penetration increases, the need for frequent switching actions is less pronounced. While EV charging patterns can certainly introduce additional demand and variability in load, they do not have the same level of fluctuation as renewable DG generation. EVs typically charge based on pre-set schedules or demand, which is more predictable than the instantaneous changes in solar or wind power.
Thus, while the increase in EV penetration does require adjustments in load management and potentially some switching, it does not demand as many dynamic and responsive switching actions as high DG penetration. This is because the charging behaviors of EVs are generally more stable and less subject to sudden fluctuations, unlike the intermittent nature of renewable energy generation.
Therefore, while both EV and DG penetration require network adjustments, DG penetration has a higher impact on the frequency of switching actions due to the fluctuating nature of renewable generation. This insight suggests that balancing DG and EV penetration rates is key to minimizing the need for excessive network reconfigurations.
5.3. Optimal Penetration Rates
Based on our analysis, this study offers recommendations regarding the most effective penetration rate levels for both technologies, which can significantly enhance network performance.
5.3.1. Optimal Penetration Rates for EVs
As our analysis demonstrates, increased EV penetration in the distribution network leads to a higher total system load, which offers more opportunities for the optimization process to reduce power losses. However, the effectiveness of loss reduction increases with the penetration of EVs up to a certain level, after which the system load may become too high to optimize effectively without additional infrastructure or support.
We suggest that the optimal EV penetration range lies between 20 and 40% of the total system load. This range allows the system to benefit from the additional load provided by EVs while maintaining manageable operational flexibility. Within this range, the optimization process can adjust the network configuration efficiently, leading to noticeable reductions in power losses.
5.3.2. Optimal Penetration Rates for DGs
In the case of DG penetration, the relationship with loss reduction is more complex. At low DG penetration levels, the system still depends heavily on power from the grid, leading to power flow imbalances and increased losses. Conversely, at very high DG penetration, power generation can become highly intermittent, causing potential imbalances in power flow and additional system losses.
Our findings suggest that the most effective loss reduction occurs when DG penetration is between 40 and 60% of the total system load. This range ensures that the local generation from DG units closely matches the system load, thereby reducing the need for power to flow from the grid and minimizing losses. When DG penetration exceeds this range, intermittent generation (e.g., from wind or solar) can cause fluctuations in power generation and demand, which might reduce the effectiveness of the optimization process.
5.4. Policy Implications
Based on the findings above, we suggest that grid planners aim for a balanced integration of EVs and DGs within these optimal penetration ranges to achieve the best network performance.
5.4.1. Targeted Incentives for EV Deployment
Policymakers should consider incentivizing EV adoption to reach the 20–40% penetration level within a reasonable timeframe. This will ensure that the additional load from EVs enhances the overall network performance by providing opportunities for optimization while keeping the system load manageable.
5.4.2. Support for DG Integration
Efforts should be made to encourage DG penetration within the 40–60% range. Policies that support the alignment of DG generation with local load demands, such as encouraging the installation of DG systems in areas with high energy consumption, will maximize the benefits of DG integration while minimizing additional losses caused by generation imbalances.
By focusing on these optimal penetration ranges, policymakers can create an efficient and sustainable energy system that balances the benefits of EVs and DGs while minimizing system losses and maximizing the potential for loss reduction.
6. Conclusions
This study presents a multi-objective network reconfiguration strategy aimed at effectively integrating EVs and renewable DGs into distribution grids. To address the variabilities in renewable generation and system uncertainties, we employed probabilistic models for wind and solar energy combined with Monte Carlo simulation techniques. This approach allows us to accurately capture the real-world conditions of such systems. Our application of this method to a 134-bus distribution network demonstrated significant efficacy in reducing power losses.
The optimization results are categorized into two phases: planning optimization and real-time operation optimization. The highest loss reduction was observed at hour 1, driven by integrating new sectionalizing switches and implementing switching actions during the planning phase. The optimization efforts during hours 2 to 24 focused on real-time operational adjustments, where the system continuously adapted to immediate changes in renewable generation and EV charging behaviors. While these adjustments were smaller in scale compared to the planning phase, they played a critical role in maintaining system stability and ensuring that the network could efficiently handle the variable nature of renewable energy and EV charging demands.
The sensitivity analysis conducted as part of this study provides optimal switching actions to minimize power losses while ensuring voltage stability and load balancing as EV and DG penetration levels change. Notably, the results of the sensitivity analysis indicate that more switching actions are required for variable DG penetration compared to variable EV penetration. The increased need for switching actions with renewable DGs reflects the dynamic nature of renewable energy generation. Unlike EVs, which introduce a more predictable load, the intermittent nature of wind and solar power generation necessitates more frequent adjustments to the distribution system to maintain balance and minimize losses. These dynamic adjustments are essential for optimizing system performance, reducing power losses, and ensuring network stability as the penetration of renewable energy sources increases.
However, the increased number of switching actions introduces additional challenges in terms of system complexity and control. Networks with high penetration of renewables require advanced control algorithms and real-time data monitoring to adjust the network configuration efficiently, ensuring that these increased switching actions do not result in undesirable side effects, such as system instability or operational delays.
Additionally, the most effective network performance in terms of loss reduction and switching actions can be expected when EV penetration ranges between 20 and 40% of the total system load and DG penetration is between 40 and 60% of the total system load. This range ensures that the system benefits from the additional load provided by EVs while maintaining a balance between DG generation and local demand, minimizing losses, and optimizing network performance. Policymakers should aim to target these ranges when planning for future grid integration, as they will likely yield the most efficient and sustainable performance while minimizing system losses and the need for frequent switching.
While the proposed strategy shows great promise, real-world implementation will require addressing additional challenges, including policy and regulatory issues, as well as the development of necessary communication and data infrastructure. These considerations are crucial as the adoption of EVs and renewable DGs continues to accelerate.
Funding
This research was funded by the University of Washington Bothell SRCP Seed Grant #06-0398.
Data Availability Statement
The datasets presented in this article are not readily available because the data are part of an ongoing study.
Conflicts of Interest
The authors declare no conflicts of interest.
Nomenclature
| Weibull PDF for wind speed. | |
| Shape parameter for Weibull PDF. | |
| Scale parameter for Weibull PDF. | |
| Wind speed. | |
| Output power of the wind DG. | |
| Rated power of the wind DG. | |
| Cut-in speed of the wind turbine. | |
| Cut-out speed of the wind turbine. | |
| Rated speed of the wind turbine. | |
| Hourly clearness index. | |
| Irradiance on a horizontal plane (kW/m2). | |
| Extraterrestrial solar irradiance (kW/m2). | |
| PDF for clearness index. | |
| Gamma function. | |
| Shape parameters of the Beta distribution. | |
| Output power of the PV DG. | |
| Area of the solar PV array. | |
| Efficiency of the solar PV array. | |
| Charging power of the EV battery. | |
| Discharging power of the EV battery. | |
| Maximum charging capacity of the EV battery. | |
| Maximum discharging capacity of the EV battery. | |
| Number of time steps throughout the simulation period. | |
| Active power loss within the distribution network. | |
| Reactive power loss within the distribution network. | |
| Number of branches. | |
| Number of tie switches. | |
| Resistance of the lth branch. | |
| Current of the lth branch. | |
| Status of the lth branch/tie switch (0 for open and 1 for close). | |
| Operating voltage at bus . | |
| Minimum voltage at bus . | |
| Maximum voltage at bus . | |
| Maximum current threshold of the lth branch. | |
| Number of buses within the distribution network. | |
| Active power generation at bus . | |
| Active power demand at bus . | |
| Reactive power generation at bus | |
| Reactive power demand at bus . |
References
- Sharma, T.; Chauhan, S. Fast heuristic based distribution network reconfiguration with distributed generations. In Proceedings of the 5th International Conference for Emerging Technology (INCET), Belgaum, India, 24–26 May 2024; pp. 1–6. [Google Scholar]
- Chanbasha, S.; Jayakumar, N.; Kumar, N.B. Hybrid Ttloa model for simultaneous distribution network reconfiguration and optimal placement of distributed generators for loss reduction: Validation on multiple test bus systems and outage scenarios. J. Electr. Syst. 2024, 20, 5146–5168. [Google Scholar]
- Wang, H.; Pan, J.-S.; Nguyen, T.-T.; Weng, S. Distribution network reconfiguration with distributed generation based on parallel slime mould algorithm. Energy 2022, 244, 123011. [Google Scholar] [CrossRef]
- Mahdavi, E.; Asadpour, S.; Macedo, L.H.; Romero, R. Reconfiguration of distribution networks with simultaneous allocation of distributed generation using the whale optimization algorithm. Energies 2023, 16, 4560. [Google Scholar] [CrossRef]
- Zhang, J.; Chen, C.; Xu, Z.; Dong, M.; Han, D.; Zhou, X. An optimization strategy for distribution network reconfiguration considering integration of electric vehicles. In Proceedings of the IEEE 3rd China International Youth Conference on Electrical Engineering (CIYCEE), Wuhan, China, 3–5 November 2022; pp. 1–6. [Google Scholar]
- Mejia, M.; Macedo, L.H.; Muñoz-Delgado, G.; Contreras, J.; Padilha-Feltrin, A. Active distribution system planning considering non-utility-owned electric vehicle charging stations and network reconfiguration. Sustain. Energy Grids Netw. 2023, 35, 101101. [Google Scholar] [CrossRef]
- Paudel, A.; Supingklad, W.; Ongsakul, W. Distribution network reconfiguration to support electric vehicles integration. In Proceedings of the International Conference on Cogeneration, Small Power Plants and District Energy (ICUE), Bangkok, Thailand, 14–16 September 2016; pp. 1–6. [Google Scholar]
- Srinivas, D.; Reddy, M.R. Optimal planning of electric vehicle charging station in radial distribution network along with reconfiguration. In Proceedings of the International Conference on Power Energy, Environment & Intelligent Control (PEEIC), Greater Noida, India, 19–23 December 2023; pp. 1039–1044. [Google Scholar]
- Gao, F.; Du, K.; Chen, X.; Xu, Y.; Li, D. Reconfiguration of the electric vehicle integrated distribution system considering carbon-reduction benefit. In Proceedings of the IEEE 5th International Electrical and Energy Conference (CIEEC), Nangjing, China, 27–29 May 2022; pp. 4975–4981. [Google Scholar]
- Wang, J.; Di, F.; Meng, H.; Meng, M.; Luo, X.; Wang, Y. Coordinated distribution reconfiguration with maintenance scheduling considering electric vehicles charging uncertainty. In Proceedings of the IEEE 5th International Electrical and Energy Conference (CIEEC), Nangjing, China, 27–29 May 2022; pp. 168–173. [Google Scholar]
- Tekeler, E.; Povrazoglu, G. Revisiting network reconfiguration in the era of unpredictable EV charger integration. In Proceedings of the 5th Global Power, Energy and Communication Conference (GPECOM), Nevsehir, Turkiye, 14–16 June 2023; pp. 489–494. [Google Scholar]
- Goli, P.; Gampa, S.R.; Kumar, N.M.; Jasthi, K.; Parimi, A.M.; Das, D.; Bansal, R.C.; Siano, P.; Guerrero, J.M. Strategic planning of distribution network integrated with EV charging stations using fuzzy pareto optimality for performance improvement and grid-side emission reduction benefits. Sustain. Energy Grids Netw. 2023, 36, 101–199. [Google Scholar] [CrossRef]
- Wang, J.; Wang, W.; Wang, H.; Zuo, H. Dynamic reconfiguration of multiobjective distribution networks considering DG and EVs based on a novel LDBAS algorithm. IEEE Access 2020, 8, 216873–216893. [Google Scholar] [CrossRef]
- Ghadi, Y.; Kotb, H.; Aboras, K.M.; Alqarni, M.; Yousef, A.; Dashtdar, M.; Alanazi, A. Reconfiguration and displacement of DG and EVs in distribution networks using a hybrid GA-SFLA multi-objective optimization algorithm. Front. Energy Res. 2023, 11, 1304055. [Google Scholar] [CrossRef]
- Pagidipala, S.; Sandeep, V. Optimal planning of electric vehicle charging stations and distributed generators with network reconfiguration in smart distribution networks considering uncertainties. Meas. Sens. 2024, 36, 101400. [Google Scholar] [CrossRef]
- Pratap, A.; Tiwari, P.; Maurya, R. Optimal allocation of controllable power factor distributed generation with network reconfiguration on electric vehicle charging station loaded distribution network. Int. J. Ambient. Energy 2024, 45, 2326157. [Google Scholar] [CrossRef]
- Katanchi, B.; Shojaei, A.A.; Yaghoobi, M. Distribution network reconfiguration in effective presence of DGs, EVCSs and DRP: A novel multi-objective approach. Electr. Power Compon. Syst. 2024, 1–17. [Google Scholar] [CrossRef]
- Choobdari, M.; Samiei Moghaddam, M.; Davarzani, R.; Azarfar, A.; Hoseinpour, H. Robust distribution networks reconfiguration considering the improvement of network resilience considering renewable energy sources. Sci. Rep. 2024, 14, 23041. [Google Scholar] [CrossRef] [PubMed]
- Available online: https://github.com/groupoasys/Data_EV_Driving_Patterns?utm_source=chatgpt.com (accessed on 1 March 2025).
- Lotfi, H.; Hajiabadi, M.E.; Parsadust, H. Power distribution network reconfiguration techniques: A thorough review. Sustainability 2024, 16, 10307. [Google Scholar] [CrossRef]
Disclaimer/Publisher’s Note: The statements, opinions and data contained in all publications are solely those of the individual author(s) and contributor(s) and not of MDPI and/or the editor(s). MDPI and/or the editor(s) disclaim responsibility for any injury to people or property resulting from any ideas, methods, instructions or products referred to in the content. |
© 2025 by the author. Licensee MDPI, Basel, Switzerland. This article is an open access article distributed under the terms and conditions of the Creative Commons Attribution (CC BY) license (https://creativecommons.org/licenses/by/4.0/).