Abstract
This paper reports the results of an experimental study that examines the impact of thermal aging on the electrical and chemical properties of insulating oil used in power transformers. Transformer-oil samples were thermally aged over a 5000 h period at different temperatures varying between 80 °C and 140 °C, replicating both normal and extreme operating conditions. Measurements of breakdown voltage, dielectric dissipation factor, acidity, and water content were taken at 500 h intervals. A novel approach of this research is the integration of these electrical and chemical characteristics into a comprehensive exponential regression analysis model. The results indicate that breakdown voltage and resistivity decrease with aging time, whereas the dielectric dissipation factor, acidity, and water content increase with aging time. The degradation trends computed by the proposed model show close correlation with both electrical and chemical properties, with correlation coefficients generally equal to or exceeding 90%, which demonstrates its reliability in predicting aging behavior of transformer oil. This integrated approach offers valuable insights into the combined electrical and chemical degradation processes due to thermal aging and assists in the condition assessment of power transformers.
1. Introduction
Transformers play a vital role in power networks, with their reliability heavily dependent on the condition of their insulation system. Typically, this insulation system comprises oil-impregnated paper used for the windings, in conjunction with mineral insulating oils, which serve both insulation and cooling functions. The regular monitoring of transformer oils by evaluating their electrical, chemical, and physical properties is essential to maintaining transformer performance. This monitoring not only helps reduce energy losses and detect insulation deterioration but also provides early warnings for necessary maintenance. Additionally, it offers insights into the condition of various transformer components, the existence of impurities, and any electrical activity such as partial discharges [1,2,3,4,5].
Over time, transformer oils are subjected to diverse stresses, such as electrical, thermal, and chemical factors. These factors, whether acting independently or in combination, lead to the progressive deterioration of transformer oils. Consequently, changes in the molecular structure can occur, reducing the oil’s overall stability. In the case of transformer oils, this loss of stability often results in decomposition and oxidation processes [6,7]. To maintain the reliable and continuous operation of power transformers, regular monitoring is essential. This involves detecting insulation deterioration, performing timely maintenance, and reducing energy losses. The monitoring process focuses on assessing changes in the electrical, chemical, and physical properties of transformer oils, which are critical for evaluating the operational condition of the transformer [8,9].
Aging and environmental factors are the primary contributors to moisture ingress in transformers, adversely affecting both the insulating liquid and solid, and hence degrading the transformer’s electrical performance by diminishing its dielectric strength and reducing the inception voltage for partial discharges [10,11,12,13,14,15].
Water and oxygen are widely recognized as key factors that significantly accelerate the aging and deterioration of transformer oil, contributing to the deterioration of its insulating properties and overall performance. It is widely recognized that cellulose paper, commonly used in transformer insulation, can absorb and retain moisture, while oxygen may exist in a dissolved state within the oil. Additionally, temperature variations and electrical fields are critical elements that exacerbate the aging process of transformer oil [16,17,18]. Temperature fluctuations can lead to the redistribution of moisture within the paper–oil insulation system, which accelerates the deterioration of both the oil and paper components. Moreover, temperature variations can influence the oil’s physical and chemical characteristics. Several studies have explored how temperature affects the dielectric properties of oil-impregnated paper insulation, often employing time-domain diagnostic techniques to analyze these effects [19,20,21,22].
Thermal aging significantly impacts the characteristics of transformer oils, often reducing the dielectric strength, breakdown voltage, and resistivity, while increasing the dielectric dissipation factor. This aging also accelerates the formation of dissolved gases, which further degrade the oil’s properties. Thermal stress impacts solid insulation by reducing the polymerization degree (DP) and the tensile strength (TS) of the insulating paper. Extensive researches have highlighted the interplay between thermal aging and these properties, underlining its critical influence on transformer insulation reliability [23,24,25,26,27,28,29,30,31,32,33,34,35].
In order to elucidate the relationship between thermal aging and transformer-oil properties, researchers have employed various numerical approaches [36,37,38,39,40]. Regression models are commonly utilized to identify correlations between oil characteristics and the thermal aging process. However, these analyses often fail to account for the impact of aging temperature, which is a fundamental variable influencing the rate and severity of oil deterioration. Similarly, numerical methods have offered valuable insights into how thermal aging affects the electrical characteristics of transformer oils. While many studies employ regression models to establish associations between oil degradation and aging [41,42,43,44], they frequently overlook the role of temperature during the aging process—a critical factor that directly affects the progression of oil degradation.
In a recent investigation by the authors [45], regression models were employed to explore the relationship between thermal aging and the electrical properties of transformer oil. However, this work primarily focused on electrical characteristics, without addressing the concurrent decline of chemical properties or the influence of varying aging temperatures on the oil’s overall condition. This paper advances this work by integrating both electrical (breakdown voltage, dielectric dissipation factor, resistivity) and chemical (acidity, water content) properties into a unified regression analysis framework. Furthermore, by systematically subjecting transformer-oil samples to accelerated aging at multiple temperatures (80 °C, 100 °C, 120 °C, and 140 °C), this research provides a more comprehensive understanding of how temperature-induced thermal aging influences the degradation of transformer oil.
A comprehensive set of experiments was conducted on various transformer-oil samples, subjected to accelerated thermal aging for a duration of 5000 h at specific temperatures of 80 °C, 100 °C, 120 °C, and 140 °C. This approach was designed to systematically evaluate how temperature influences the aging process of transformer oil. The experimental setup included the following steps:
- After every aging period of 500 h, a sample of oil was taken from the oven.
- The following electrical and chemical properties were measured:
- -
- Breakdown voltage;
- -
- Dielectric dissipation factor;
- -
- Relative permittivity;
- -
- Resistivity;
- -
- Acidity factor;
- -
- Water content.
These measurements were carried out in accordance with the applicable standards.
In the subsequent phase, a regression analysis was conducted to establish a mathematical model that correlates the experimental results across all measured electrical and chemical characteristics with the oil’s thermal aging. The findings indicate that the temperature at which aging occurs plays a crucial role in altering the electrical and chemical properties of transformer oil, significantly influencing its degradation. Moreover, the regression model demonstrates a robust correlation between thermal aging and all of the electrical and chemical properties, evidenced by high correlation coefficients.
The contributions of the present paper consist of:
- Developing a systematic approach to evaluate the influence of temperature on the aging of transformer oil by simulating normal and extreme operational scenarios;
- Providing a useful set of experimental data that can be used by other researchers/ engineers for comparison and validation purposes; and
- Proposing a mathematical model based on exponential regression that can be used for a condition assessment of transformer-oil insulation, and for correlating both electrical and chemical properties with temperature, an important factor influencing oil degradation.
2. Experimental Tests
Tests of aging were carried out on inhibited transformer-oil samples (Borak 22, Nynas, Graz, Austria) obtained from the Algerian Electricity and Gas Company (Sonelgaz, Algiers, Algeria). The properties of the samples are outlined in Table 1.

Table 1.
The properties of the oil samples.
The sampling methodology was implemented in accordance with IEC 60475 standard [46]. Initially, glass containers were thoroughly cleaned and dried, followed by exposure to a temperature of 110 °C to eliminate any residual contaminants and moisture. Once sterilized, these containers were filled with fresh transformer oil and sealed with cork stoppers, which were further encased in aluminum foil to safeguard against external contamination. The thermal aging experiments were carried out in four separate ovens, and the samples were maintained at varying temperatures of 80 °C, 100 °C, 120 °C, and 140 °C over a total aging period of 5000 h.
These temperature conditions were deliberately selected to simulate a range of operational and stress-induced scenarios typically encountered by transformers. By testing at temperatures covering normal operational conditions and more extreme thermal conditions, a better picture of the degradation behavior of transformer oil is obtained, which helps in assessing the impact of thermal stress on its electrical and chemical properties.
The breakdown voltage, dielectric dissipation factor, resistivity, acidity factor, and water content are measured according to the applicable guidelines defined in IEC 60156, 60247, 62021, and 60814 standards [47,48,49,50] after every 500 h of aging at all specified temperature conditions.
Breakdown voltage measurements were conducted in accordance with IEC 60156 [47], ensuring that the temperature remained within 5 °C of the ambient air temperature. The assessment was performed using the Automatic Oil Test Set OTS 100AF/2 device, which is equipped with a test cell featuring a system of sphere–sphere electrodes to precisely determine the AC breakdown voltage. The test was conducted using a voltage ramp rate of 2 kV/s until breakdown occurred.
The dielectric dissipation factor, relative permittivity, and resistivity were determined using the Automatic Dissipation Factor and Resistivity Test Equipment Dieltest DTL system, which operates on the Schering Bridge principle. In accordance with the guidelines set forth in IEC 60247 [48], this apparatus is equipped with a 45 mL test cell and features an automatic display panel for enhanced usability and accuracy in measurements. While the dielectric dissipation factor and relative permittivity measurements were conducted at an applied frequency of 50 Hz, the resistivity was measured under a DC voltage of 500 V.
Concerning the chemical properties, the acidity factor was assessed following the IEC 62021 [49]. This evaluation utilized a Potentiometric Titration apparatus designed to titrate to a specified end point, employing either variable or fixed increments of titrant for precision. For the assessment of water content, a Coulometric Karl Fischer Titrator was employed, adhering to the specifications outlined in IEC 60814 [50].
3. Regression Methods and Correlation
Regression analysis is used to establish the connection between the observed values of the test samples and the random variables derived from the statistical samples. This technique allows for a quantitative model to be constructed, revealing how the variables are interrelated. By fitting the data to a regression model, the underlying patterns and dependencies can be effectively captured, providing valuable insights into system’s dynamics. The relationship between variables can be determined through correlation methods, especially when the relationship is linear. A stronger correlation occurs when the random variable values closely align with experimental data, and regression analysis can reveal the functional relationship between these variables. Additionally, similar relationships can be established between the variables and experimental parameters. To address these challenges, mathematical procedures are applied, often represented graphically, to better visualize and understand the relationships. This study focuses on investigating the presence of nonlinear relationships between random variables and experimental values [51,52].
The relationship between values typically assumes a nonlinear equation when the distribution of random variables follows a nonlinear trend. The graphical representation of experimental data pairs is utilized to derive the corresponding mathematical expression. Subsequently, the results are analyzed and fitted through nonlinear regression to capture the complex relationships between the variables, particularly when their distribution is nonlinear. A low coefficient of determination suggests a weak nonlinear relationship between the variables. This indicates that the model’s explanatory power is limited, as the experimental data points do not align well with the predicted values, implying the existence of additional factors or a more complex relationship than the model captures. However, when the results are concentrated at specific points, the relationship becomes more evident [53,54].
In our investigation, an exponential regression model is developed to assess the impact of thermal aging on transformer oil by estimating key properties, including breakdown voltage, dielectric dissipation factor, resistivity, acidity factor, and water content. The exponential regression model used in this study is presented in Equation (1):
where x is the period of aging and y is the oil characteristics. a, b, c, and d are the regression’s parameters.
The Y vector, as shown in Equation (2), represents the random variables derived from the regression analysis. It consists of the values of the oil’s electrical and chemical characteristics under study, namely the breakdown voltage, dielectric dissipation factor, resistivity, acidity factor, and water content.
Equation (3) expresses the X-vector, which represents the aging time of the transformer oil at various temperatures.
The variation reflects the differences between individual data points and the mean value. The sum of squared variations, known as the sum of squares (SS), is calculated by squaring the differences between each data point and the fitted trend line. This value is crucial for evaluating how well the regression model represents the data, as shown in Equation (4), by quantifying the dispersion of data points around the fitted model.
where
- d(i) is the vector that comprises the parameters a, b, c, and d, which are defined by the specific model applied.x(i) is the period of aging.
- y(i) is the value of each experimental property.
- f(d(i),x(i)) is the function presented in Equation (1).
The coefficient of correlation, commonly referred to as R or the residual sum of squares, is a metric used to assess the degree to which the regression model aligns with the experimental data. It indicates the proportion of variance explained by the model, with a higher R signifying a stronger fit and a lower R reflecting a weaker fit [55,56]. This coefficient is calculated using the sum of squares (SS) in Equation (5).
where
- y is the experimental characteristic;
- is the correlated characteristic obtained by the regression analysis;
- is the mean value of the test.
4. Results and Discussion
4.1. Breakdown Voltage
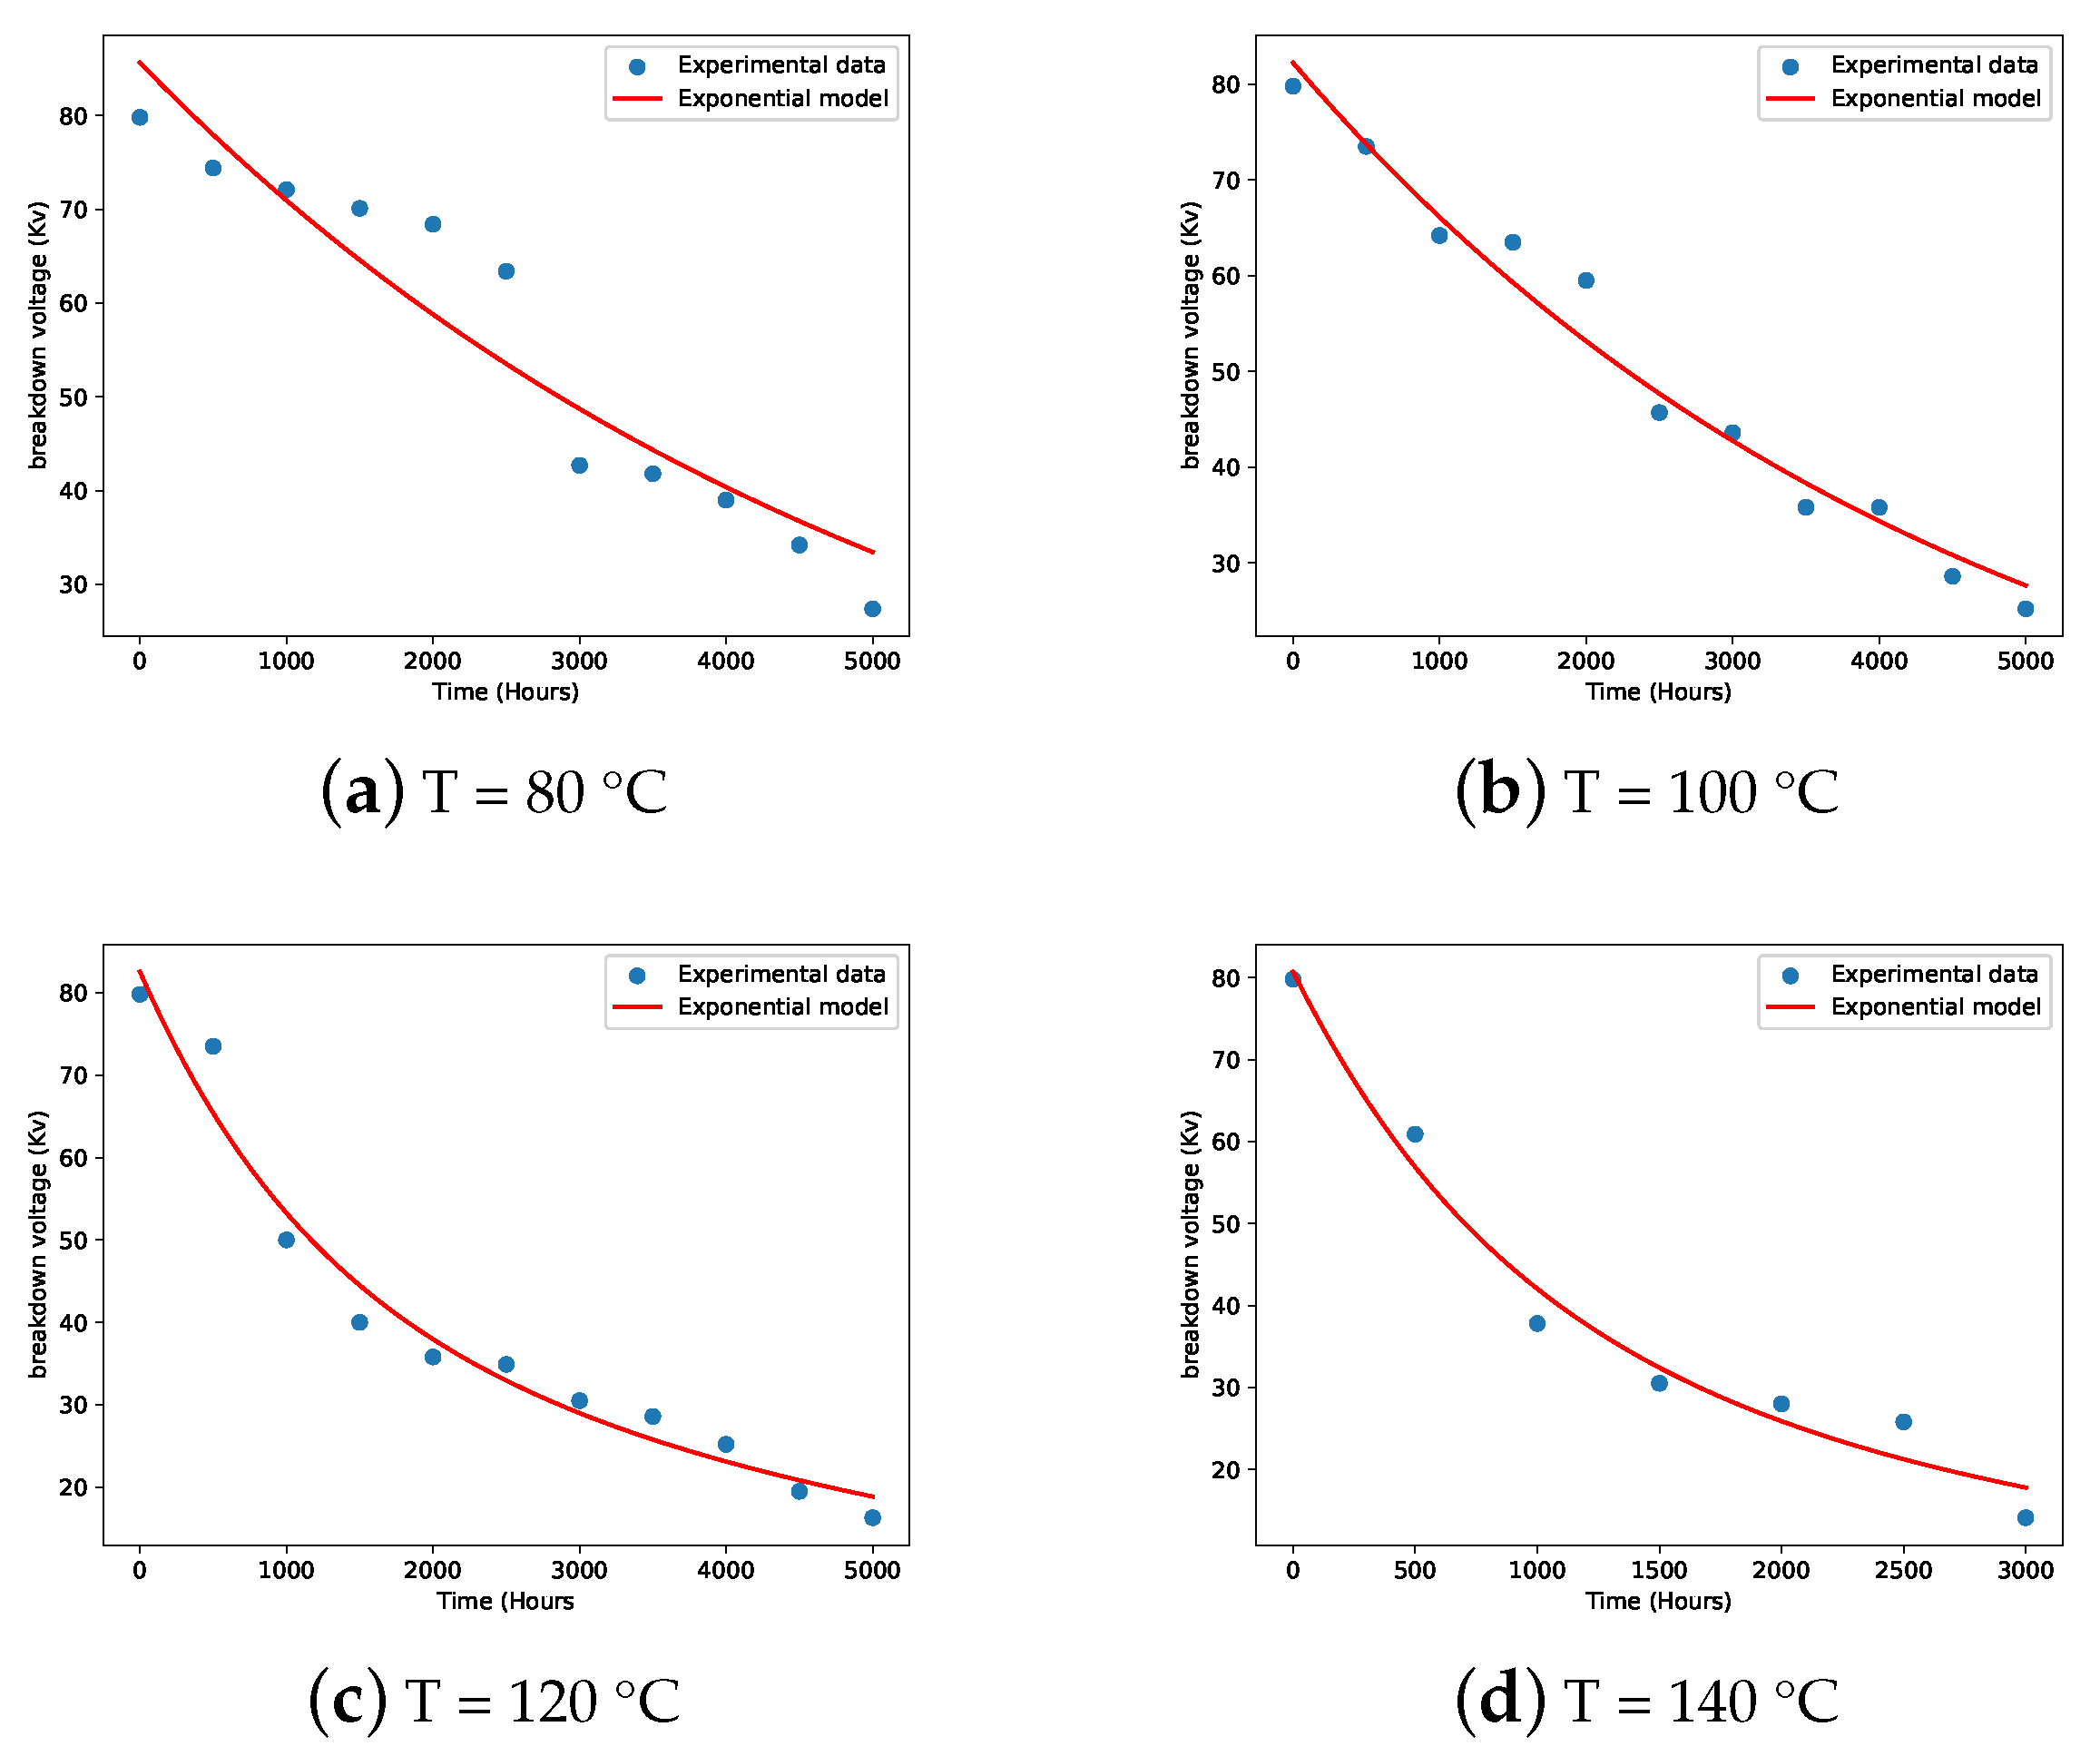
The results showing the breakdown voltage with aging duration for the four different aging temperatures are illustrated in Figure 1a, Figure 1b, Figure 1c and Figure 1d, respectively.
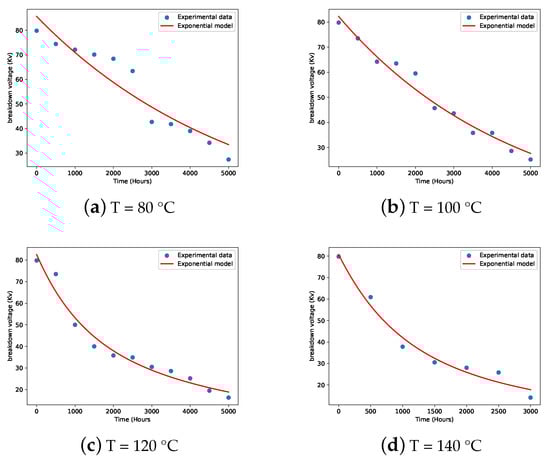
Figure 1.
Breakdown voltage variations with aging duration: (a) T = 80 °C, (b) T = 100 °C, (c) T = 120 °C, and (d) T = 140 °C.
The breakdown voltage continuously decreases with aging time at all four aging temperatures, demonstrating a similar trend related to thermal aging. For temperatures of 80 ° C and 100 ° C, the reduction in the breakdown voltage is quite comparable. However, at the highest aging temperature of 140 °C, the decline occurs at a significantly faster rate. This pattern illustrates how elevated temperatures can intensify the degradation of transformer-oil properties over time.
At 80 °C and 100 °C, the breakdown voltage of transformer oil after aging declines significantly, dropping from 79.8 kV to 27.4 kV and 25.2 kV, representing reductions of 65% and 68%, respectively, over a 5000 h aging period. A similar pattern is observed at 120 °C, where the breakdown voltage decreases to 16.3 kV at the end of the same duration, indicating a substantial reduction of 79%. In contrast, at the elevated temperature of 140 °C, the breakdown voltage experiences a rapid decline, plummeting to 14.1 kV after just 3000 h of aging, which corresponds to a staggering 82% decrease within the shorter aging periods. This highlights the accelerating impact of higher temperatures on the deterioration of transformer-oil properties.
The extended thermal aging of transformer oil leads to significant contamination, particularly with water, which accumulates over time. This rise in water content heightens the occurrence of partial discharges in the oil, and hence, reduces its dielectric strength. Consequently, this deterioration manifests as a decrease in the breakdown voltage of the transformer oil. However, the decrease in breakdown voltage after thermal aging was significantly lower in nanofluid-based insulating liquids compared to conventional insulating liquid. This can be attributed to the trapping of electrons by nanoparticles, which reduces their streaming velocity and increases their propagation time, as observed in [57]. The combined impact of moisture buildup and increased partial discharge activity highlights the significant role of thermal aging in reducing the insulating efficiency of transformer oil [58].
The evaluation of the breakdown voltage for all transformer-oil samples shows a distinct nonlinear relationship in relation to thermal aging. The correlation between the regression model and the experimental findings, displayed in Figure 1, demonstrates a strong alignment for each of the thermal aging scenarios examined. This close correspondence between the predicted and observed values further validates the regression analysis as an effective tool for characterizing the impact of thermal aging on breakdown voltage.
The analysis of correlation coefficients indicates a robust relationship among the samples studied. The coefficient for the oil aged at 80 °C was measured at 89.92%. In comparison, the samples aged at higher temperatures of 100 °C, 120 °C, and 140 °C exhibited even greater coefficients, recorded at 97.34%, 96.82%, and 97.53%, respectively. This suggests a high level of consistency in the parameters of the regression model across different thermal aging conditions.
The regression coefficients a, b, c, and d, which correspond to the breakdown voltage, are detailed in Table 2.
Table 2.
Breakdown voltage regression parameters.
4.2. Dielectric Dissipation Factor
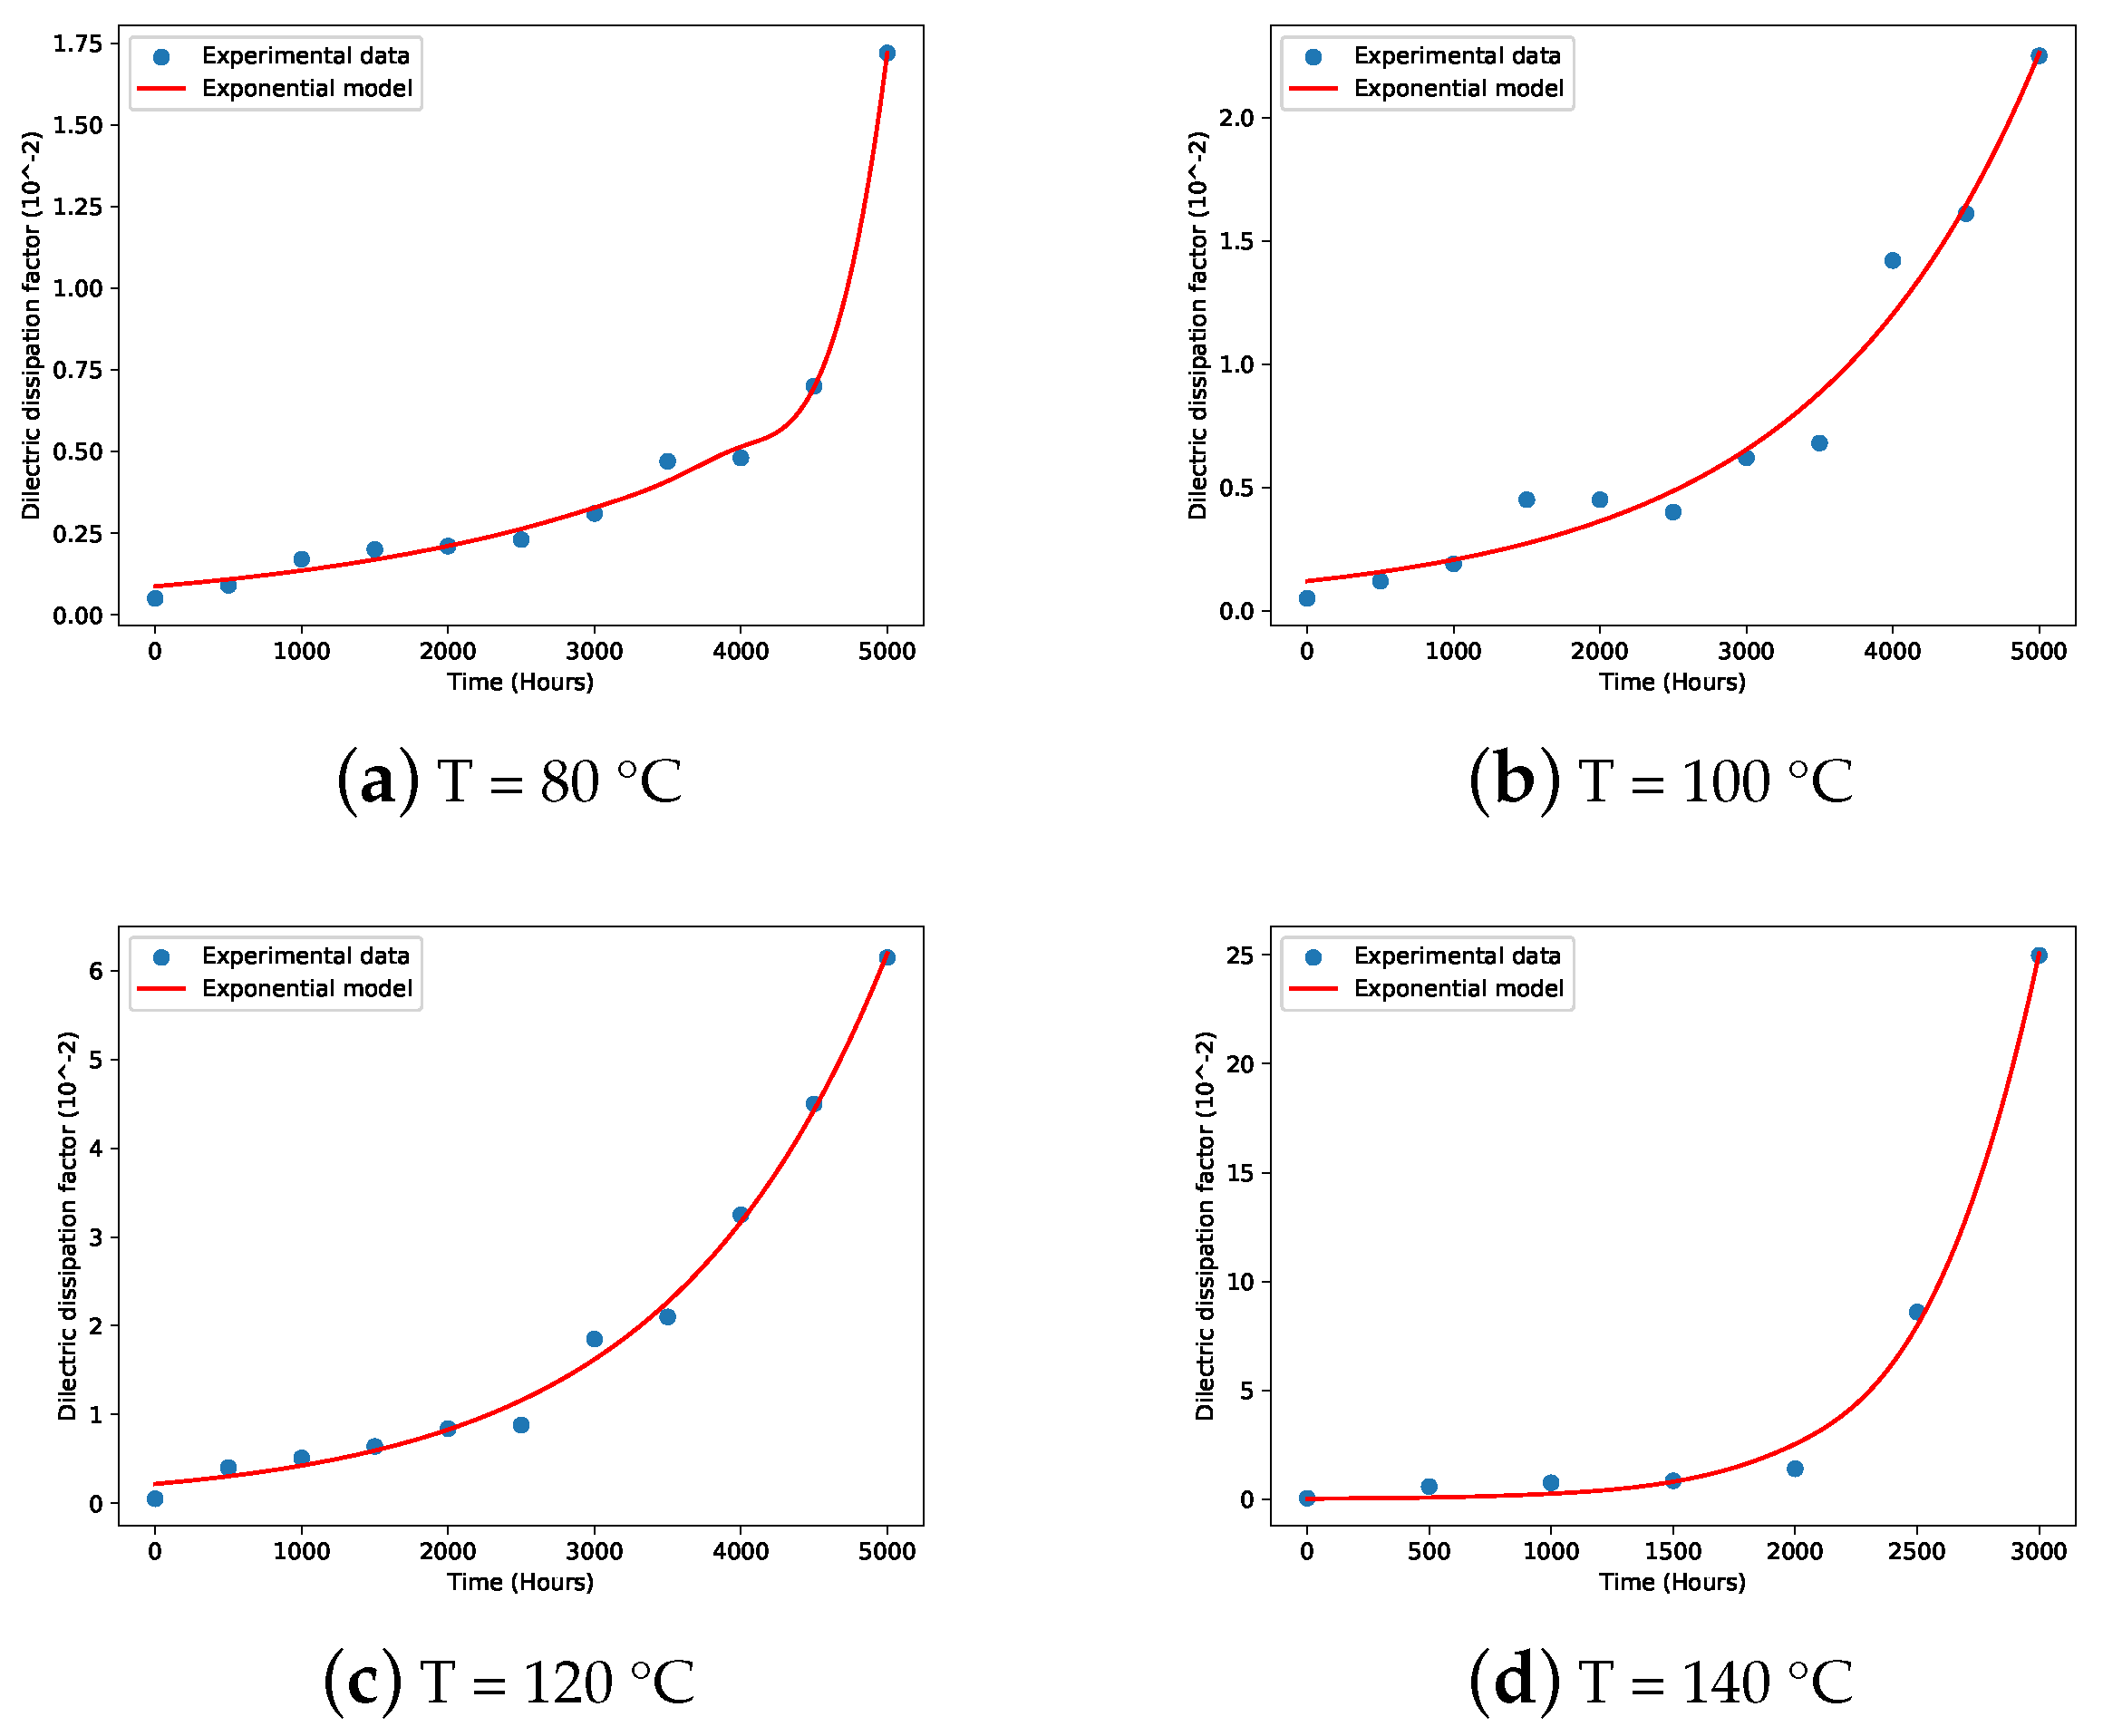
Figure 2a–d show the variation in the dielectric dissipation factor over aging time at temperatures of 80 °C, 100 °C, 120 °C, and 140 °C.
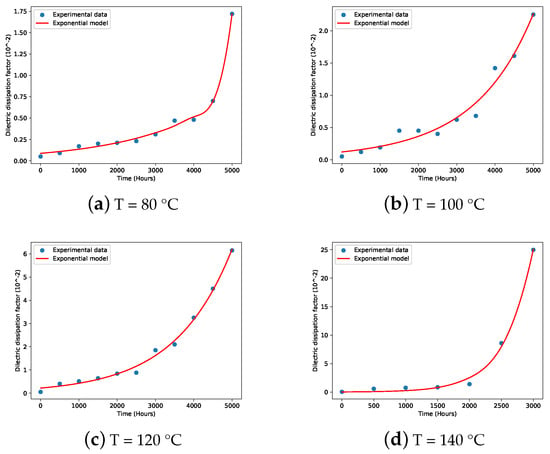
Figure 2.
Dielectric dissipation factor variations with aging duration: (a) T = 80 °C, (b) T = 100 °C, (c) T = 120 °C, and (d) T = 140 °C.
The dielectric dissipation factor consistently increases throughout the thermal aging process at all four temperatures. For aging temperatures of 80 °C and 100 °C, this increase in the dielectric dissipation factor follows a comparable trend. However, at 120 °C, the factor rises more sharply, and at 140 °C, the rate of increase is even more rapid, underscoring a substantial acceleration in degradation at higher temperatures.
In Figure 2a, the dissipation factor increases from an initial value of to after a prolonged aging period of 5000 h. Similarly, Figure 2b indicates a decrease in the dielectric dissipation factor to over the same duration. Crucially, these variations maintain values within industry-accepted limits, underscoring the reliability of the transformer oil’s dielectric characteristics despite moderate effects of aging [48].
For the higher thermal aging temperatures of 120 °C and 140 °C, shown in Figure 2c,d, the dielectric dissipation factor rises markedly, reaching significant values of and by the end of the aging period, respectively. Such elevated values reflect considerable thermal degradation, with the dissipation factor exceeding acceptable levels specified in industry standards [48]. Notably, due to the rapid deterioration observed at 140 °C, testing was concluded after 3000 h to prevent further degradation.
The observed increase in the dielectric dissipation factor can be attributed to a rise in oxidation products formed due to prolonged overheating during thermal aging. Elevated temperatures enhance ionic mobility, which intensifies ionic conduction losses and results in an increased dissipation factor [59]. This effect is further influenced by the elevated ion concentration in the liquid, oxidation reactions, and a reduction in viscosity, all of which are typical consequences of long-term aging under high-temperature conditions [60]. Furthermore, as reported in [61], variations in the dielectric dissipation factor as a function of frequency indicate differences in conductivity and nanoparticle distribution within the insulating liquid. This supports the observed increase in the dielectric dissipation factor at 90 °C across all insulating liquids, which reflects the enhanced mobility of charge carriers, likely due to impurities in the oil matrix.
The regression analysis of the dielectric dissipation factor across all samples reveals a nonlinear relationship attributable to thermal aging. This relationship is effectively represented in Figure 2a–d, wherein the regression model aligns closely with the experimental data obtained from the four different tests. The correlation coefficients computed for the samples exhibit a strong agreement, with values of 99.54%, 97.01%, 99.42%, and 99.56% for samples aged at 80 °C, 100 °C, 120 °C, and 140 °C, respectively. These findings highlight the robustness and predictive precision of the regression model in delineating the intricate interactions between thermal aging conditions and the dielectric dissipation factor, thus affirming its validity in characterizing the performance of dielectric materials under prolonged thermal stress.
The regression parameters a, b, c, and d for the different aging temperatures are detailed in Table 3.
Table 3.
Dielectric Dissipation Factor Regression Parameters.
4.3. Resistivity
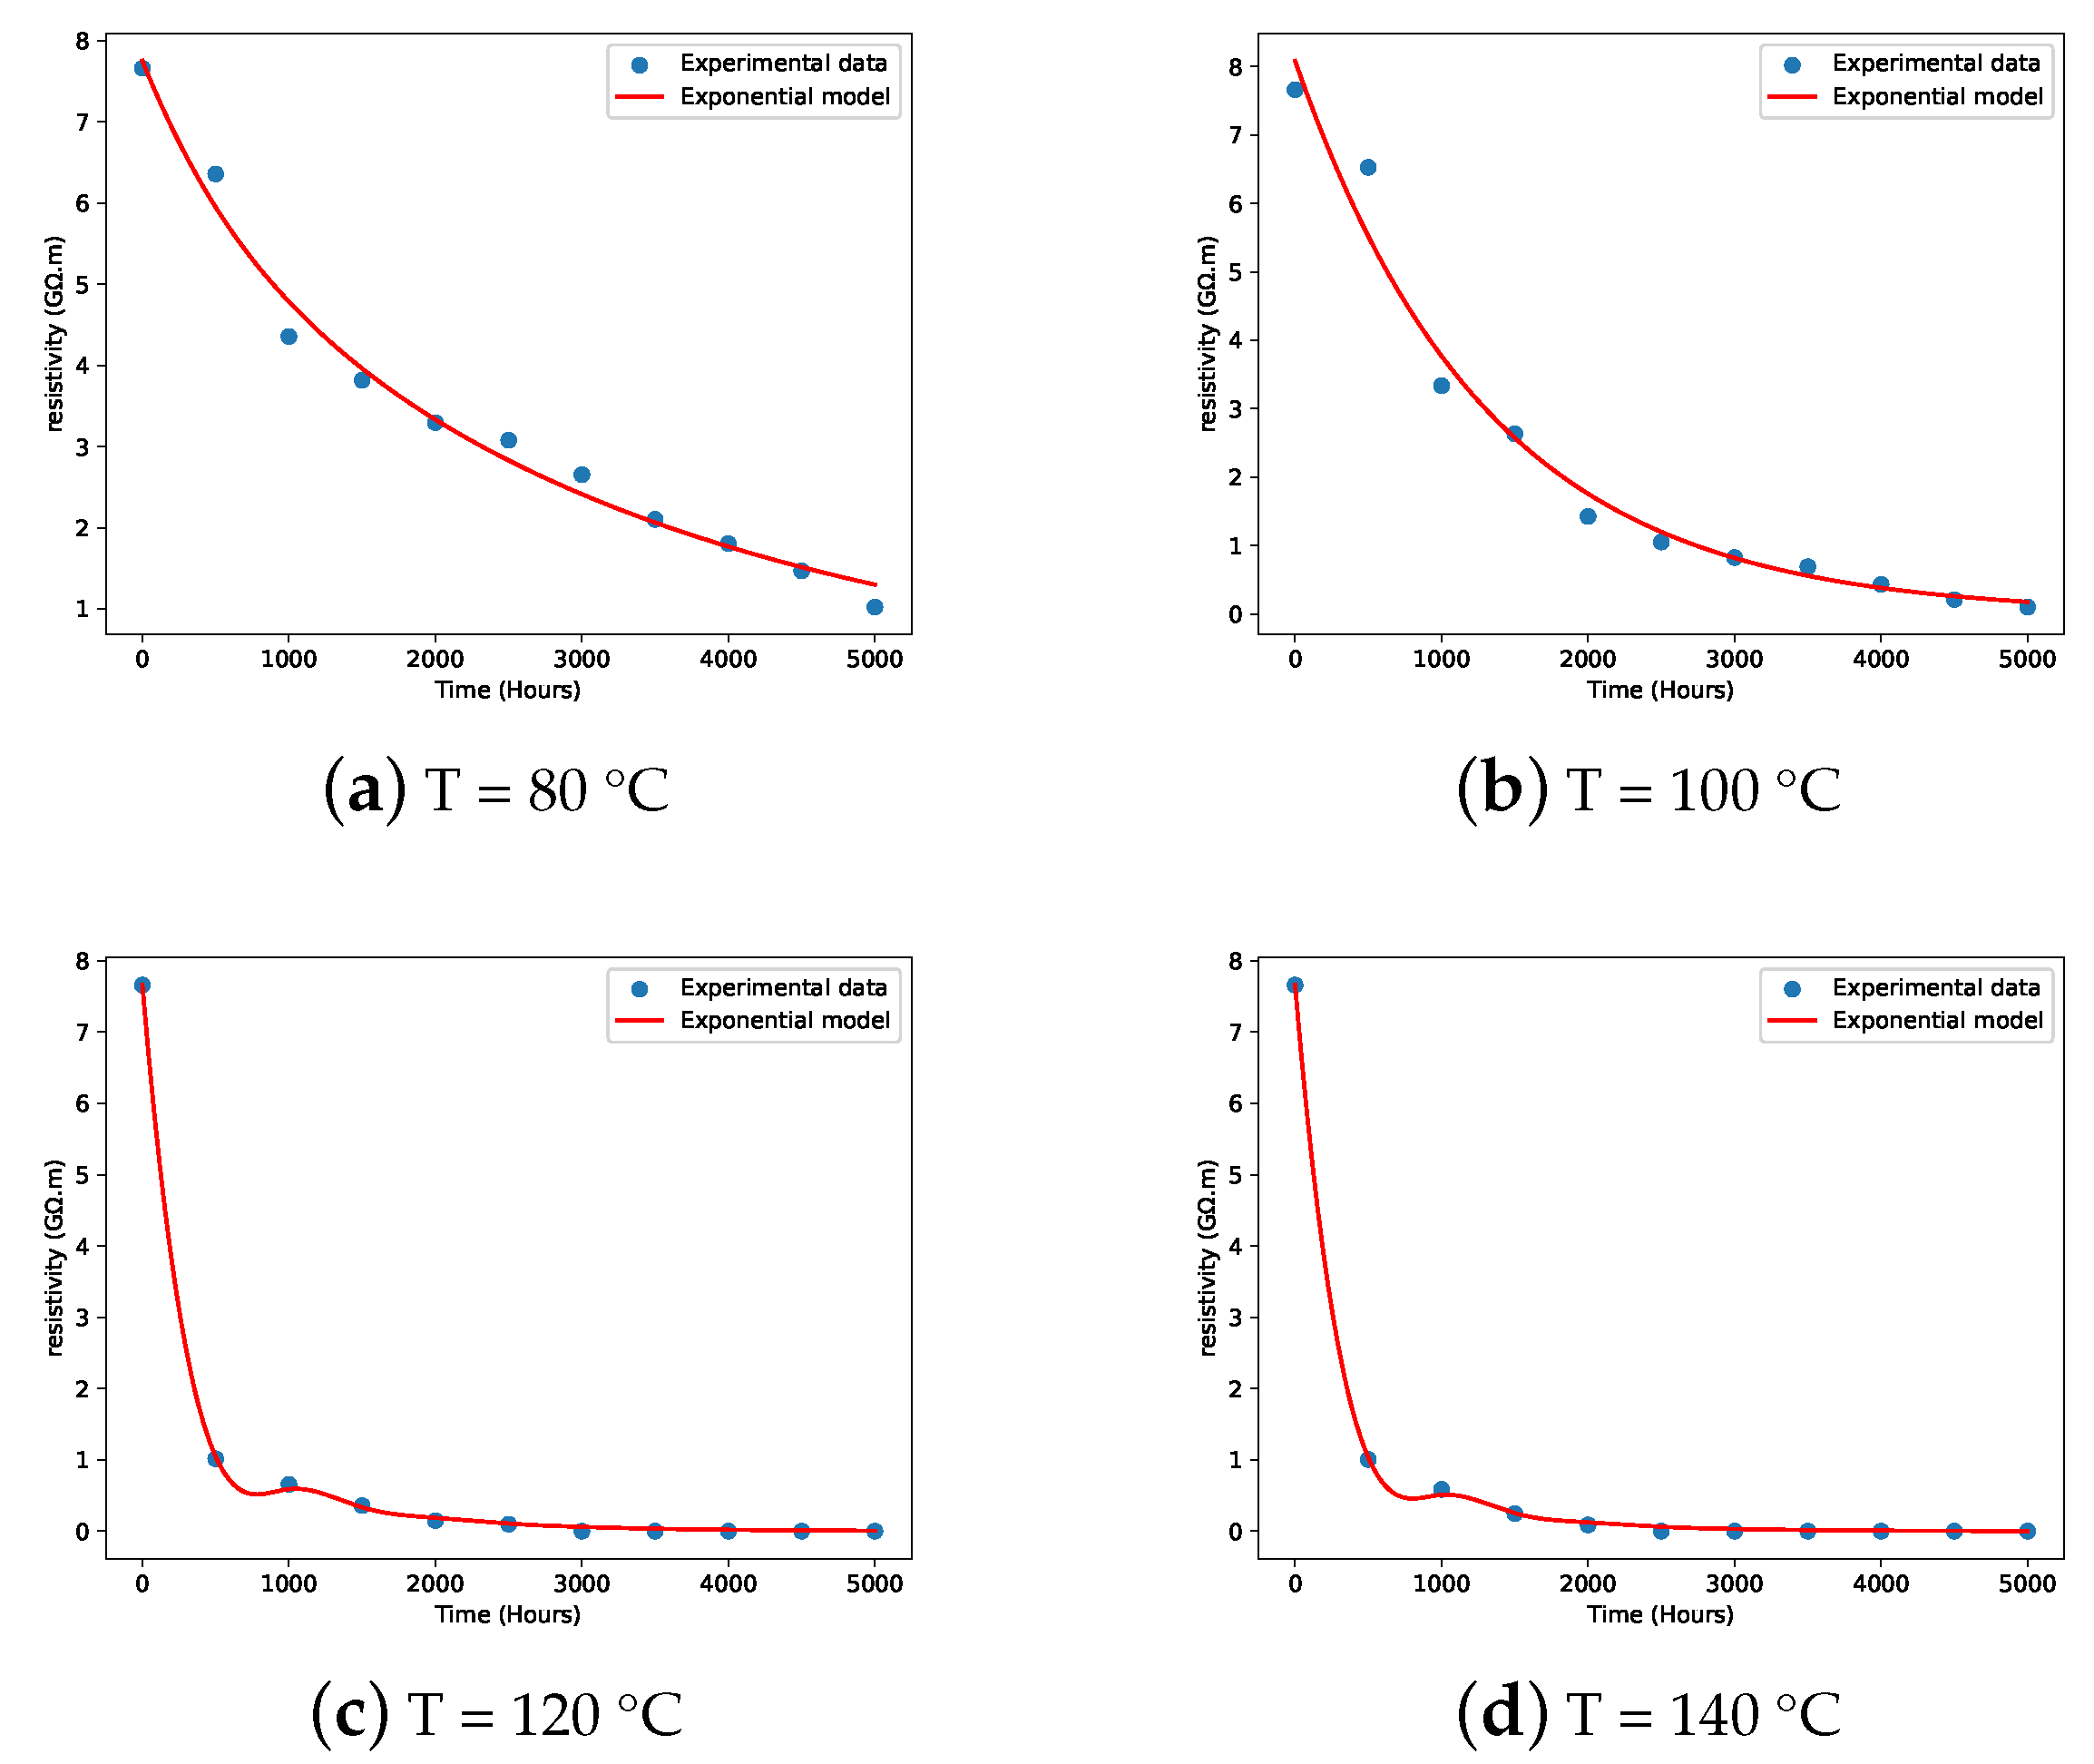
The relationship between aging time and resistivity across the four different aging temperatures 80, 100, 120, and 140 °C is presented in Figure 3a–d.
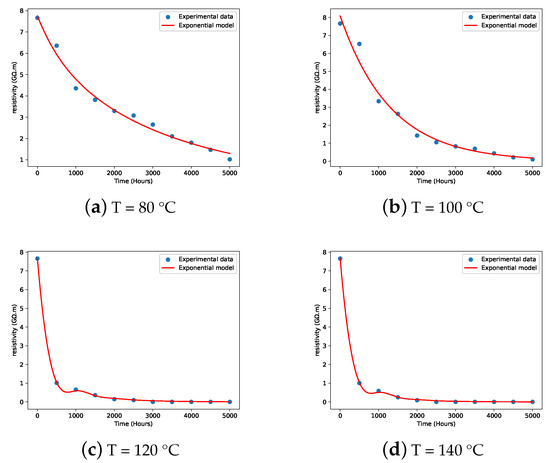
Figure 3.
Resistivity variations with aging duration: (a) T = 80 °C, (b) T = 100 °C, (c) T = 120 °C, and (d) T = 140 °C.
The analysis demonstrates a significant reduction in resistivity throughout the thermal aging process across all four temperature conditions, indicating a pronounced inverse correlation between aging duration and resistivity. Initially, the resistivity measures at 7.66 × 10, declining to 1.022 × 10cm at 80 °C, 1.02 × 10cm at 100 °C, 9.85 × 10cm at 120 °C, and finally reaching 8.75 × 10cm at 140 °C. This pattern underscores the impact of elevated temperatures on the electrical resistivity of transformer oil over time.
The observed reduction in resistivity at thermal aging temperatures of 80 °C and 100 °C does not raise significant concerns, as the values remain within the acceptable limits, even after a 5000 h duration. This stability in resistivity aligns with the standard requirements and indicates that the insulation properties of the transformer oil are still adequate under these conditions [48]. In contrast, at thermal aging temperatures of 120 °C and 140 °C, resistivity exhibits a marked decline at an accelerated pace, deteriorating significantly by 98% and 99% within just 2500 h and 2000 h of aging, respectively. This rapid degradation can be primarily linked to increased ionic mobility, a phenomenon that becomes particularly pronounced at higher temperatures [30]. Moreover, the reduction in resistivity observed during thermal aging can be attributed to the mechanisms that promote moisture accumulation in the oil at elevated temperatures. Overheating facilitates the ingress of water, which subsequently triggers the generation of partial discharges. This increase in partial discharge activity enhances ionic conduction within the oil, leading to a significant decline in resistivity [62].
The investigation into resistivity through regression analysis reveals a clear nonlinear relationship influenced by thermal aging processes as illustrated in Figure 3a–d, where the regression model aligns closely with the experimental findings across all aging temperatures.
The calculated correlation coefficients reveal a significant relationship between resistivity and aging temperature, demonstrating the reliability of the regression model. Specifically, samples subjected to thermal aging at 80 °C, 100 °C, 120 °C, and 140 °C show correlation coefficients of 98.62%, 97.71%, 99.97%, and 99.97%, respectively. These results underscore the model’s robustness across varying thermal conditions, emphasizing the pronounced influence of temperature on the behavior of resistivity.
The regression parameters for resistivity, labeled as a, b, c, and d, are presented in Table 4.
Table 4.
Resistivity regression parameters.
4.4. Acidity Factor
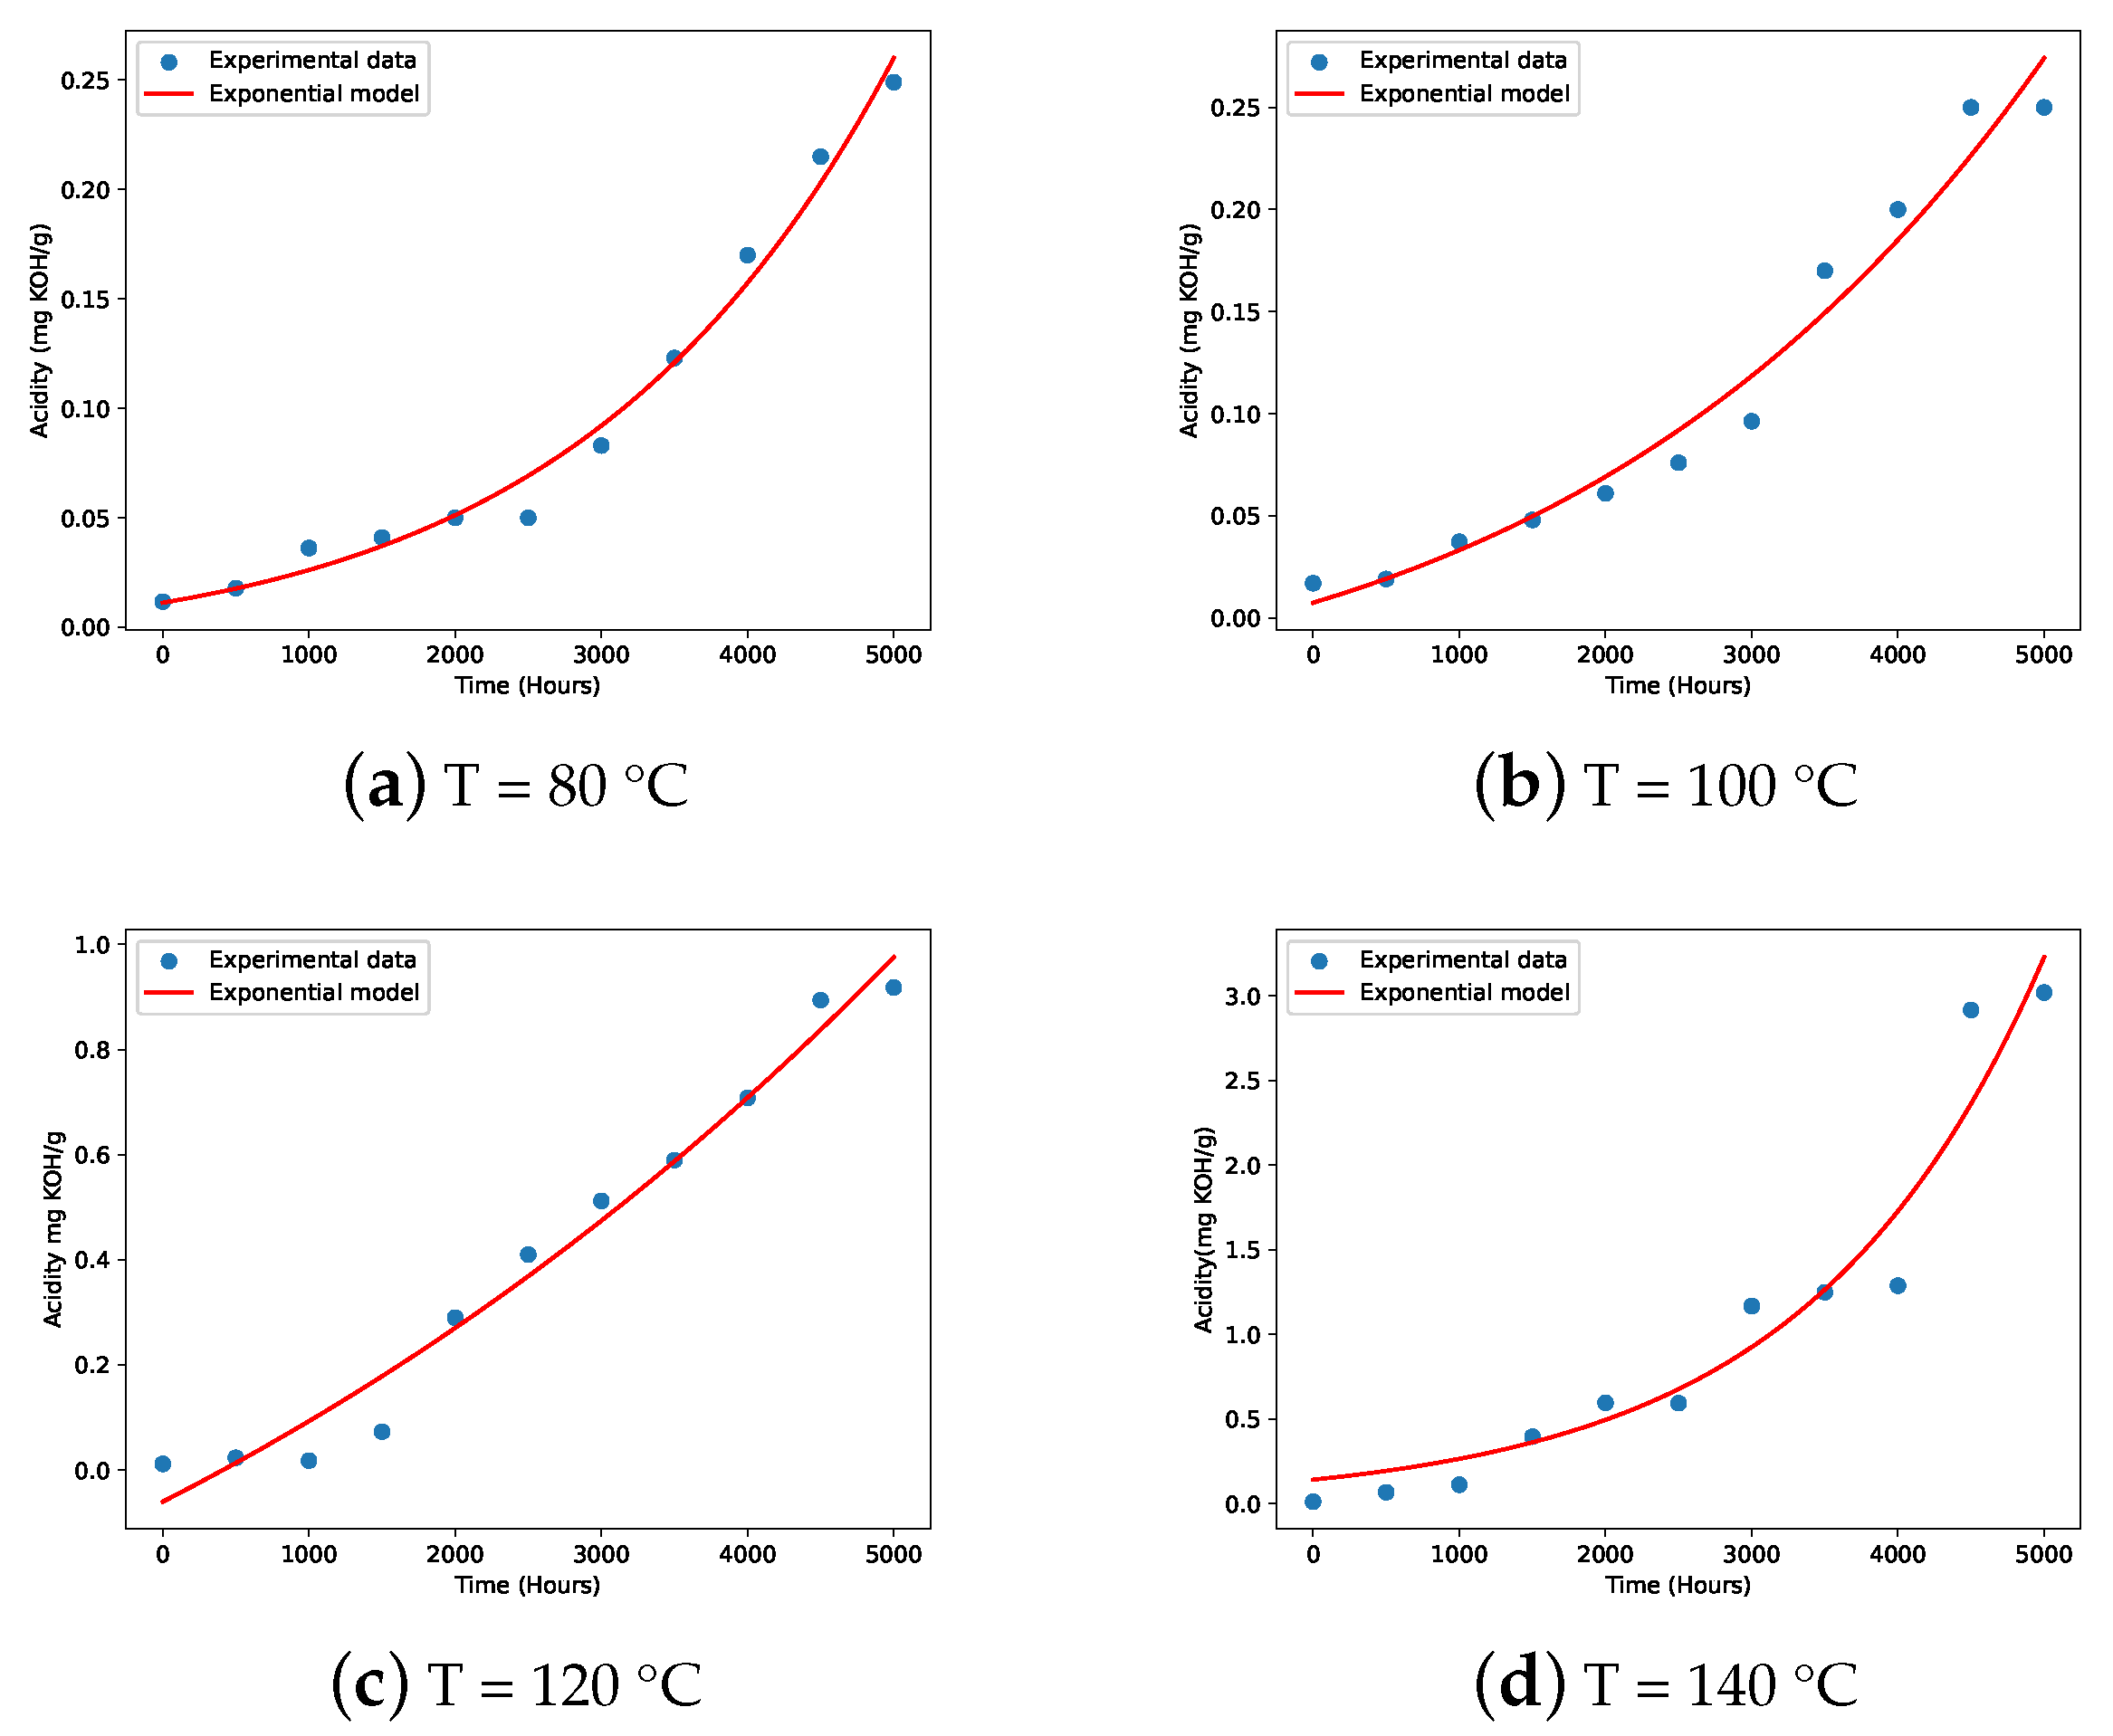
Figure 4a–d present the variation in the acidity factor as a function of aging time for temperatures of 80 °C, 100 °C, 120 °C, and 140 °C, respectively.
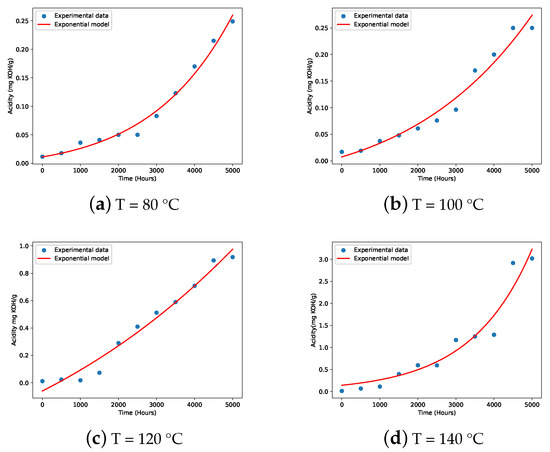
Figure 4.
Acidity factor variations with aging duration: (a) T = 80 °C, (b) T = 100 °C, (c) T = 120 °C, and (d) T = 140 °C.
The figures demonstrate that the acidity factor consistently rises with thermal aging across all tested temperatures. For aging temperatures of 80 °C and 100 °C, this increase in acidity follows a similar pattern. However, at 120 °C, the increase becomes more substantial, and at 140 °C, the acidity factor rises even more sharply, signaling a markedly accelerated degradation rate at the highest aging temperature.
Figure 4a,b illustrate the progression of the acidity factor over aging time at thermal aging temperatures of 80 °C and 100 °C. Despite the difference in temperatures, both graphs reveal a similar upward trend. In Figure 4a, the acidity factor increases from an initial value of 1.17 × 10 mg KOH/g to 24.9 × 10 mg KOH/g after an aging period of 5000 h. Similarly, Figure 4b shows a rise to 25 × 10 mg KOH/g over the same duration. These values remain within industry standards, indicating reliable acidity stability of the transformer oil under moderate thermal aging conditions [49].
For the elevated thermal aging temperatures of 120 °C and 140 °C, as depicted in Figure 4c,d, the acidity factor exhibits a significant increase, reaching substantial levels of 91.8 × 10 mgKOH/g and 301.9 × 10 mgKOH/g, respectively, by the end of the aging period. Notably, at 120 °C, the acidity factor escalates to a critical level, surpassing the acceptable standard limit after just 2000 h of aging. Similarly, at 140 °C, the threshold is exceeded even sooner, after only 1500 h. These elevated acidity values reflect considerable thermal degradation and highlight the urgent need for monitoring and control, as they exceed the permissible limits defined by industry standards [49].
The increase in the acidity factor can be linked to the accumulation of oxidation products resulting from extended overheating during thermal aging. Higher temperatures promote ionic mobility, leading to increased ionic conduction losses that contribute to a rise in the acidity factor. Additionally, this phenomenon is exacerbated by the elevated concentration of ions in the liquid, ongoing oxidation reactions, and a decrease in viscosity, all of which are common outcomes of prolonged exposure to elevated temperatures during aging. These interactions highlight the complex relationship between thermal conditions and the oil’s chemical stability [59].
The regression analysis conducted on the acidity factor for all samples demonstrates a significant nonlinear relationship associated with thermal aging. This relationship is effectively illustrated in Figure 4a–d, where the regression model closely aligns with the experimental data. The correlation coefficients obtained for the samples indicate a strong reliability, showing values of 98.53%, 96.64%, 97.35%, and 93.96% for samples subjected to aging at 80 °C, 100 °C, 120 °C, and 140 °C, respectively. These results underscore the robustness and predictive power of the regression model in elucidating the complex interactions between thermal aging conditions and the acidity factor, thereby validating its effectiveness in characterizing the behavior of dielectric materials under sustained thermal stress.
Table 5 presents the regression parameters a, b, c, and d associated with the acidity factor for the different aging temperatures.
Table 5.
Acidity factor regression parameters.
4.5. Water Content
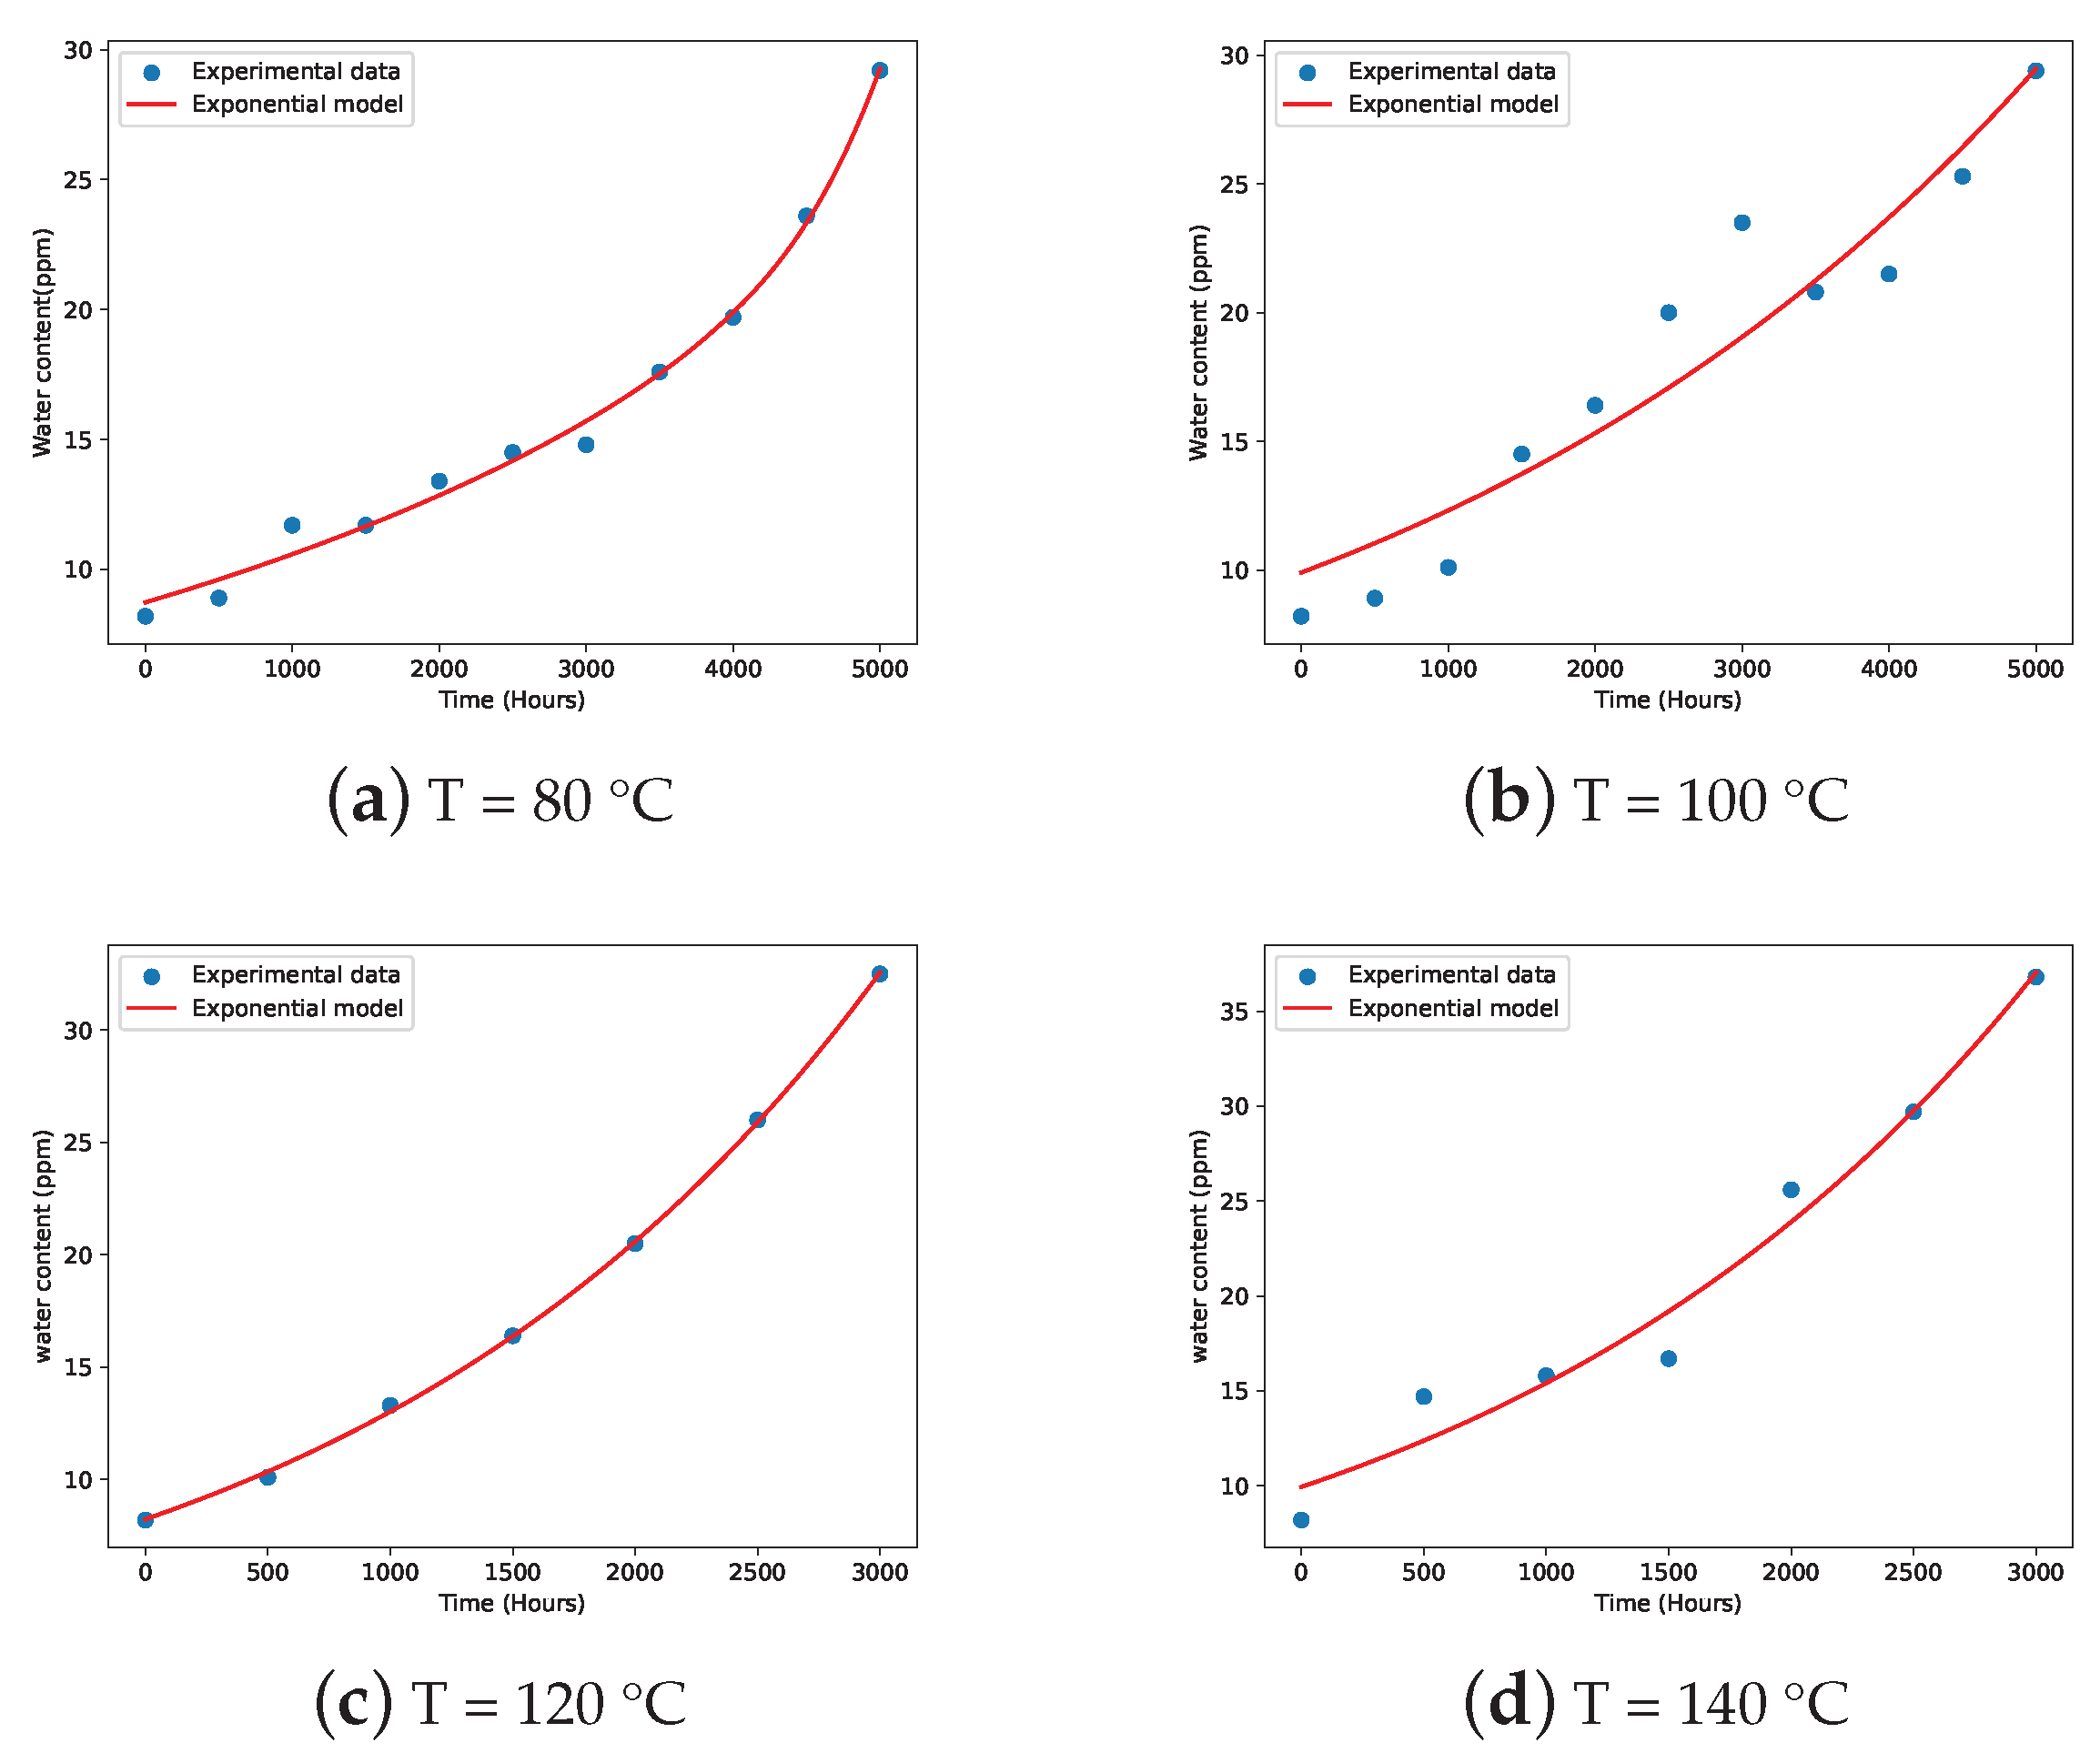
The changes in water content due to thermal aging at the temperatures of 80 °C, 100 °C, 120 °C, and 140 °C, respectively, comparing results from both experimental and numerical methods, are shown in Figure 5a, Figure 5b, Figure 5c and Figure 5d, respectively.

Figure 5.
Water-content variations with aging duration: (a) T = 80 °C, (b) T = 100 °C, (c) T = 120 °C, and (d) T = 140 °C.
The figures indicate that water content progressively increases with thermal aging across all temperatures tested. At 80 °C and 100 °C, this increase follows a relatively consistent pattern. In contrast, for the higher aging temperatures of 120 °C and 140 °C, the water content shows a more accelerated rise, reflecting intensified aging effects common at elevated temperatures.
Figure 5a,b depict the increase in water content over time for thermal aging at 80 °C and 100 °C. Both figures display a similar upward trajectory in water levels as aging progresses. In Figure 5a, water content rises from an initial 8.2 ppm to 29.2 ppm over 5000 h, while Figure 5b shows a similar rise to 29.4 ppm within the same period. These values align with industry thresholds, suggesting that the oil remains within acceptable stability limits under these moderate thermal aging conditions [50].
At thermal aging temperatures of 120 °C and 140 °C, as depicted in Figure 5c,d, the water content shows a significant increase, reaching levels of 32.5 ppm and 36.8 ppm, respectively, after 3000 h. These concentrations exceed the critical values established by industry standards [50].
The observed rise in water content is linked to the production of oxidation products due to prolonged overheating during thermal aging. Increased temperatures facilitate ionic mobility, which in turn exacerbates ionic conduction losses and leads to a subsequent rise in water content [60].
The relationship depicted in Figure 5a–d illustrates the regression analysis of water content across all samples, revealing a notable nonlinear correlation with thermal aging. The regression model aligns closely with the experimental data obtained from the various thermal aging conditions, demonstrating its accuracy in reflecting the underlying trends. The computed correlation coefficients further reinforce the model’s reliability, with values of 99.16%, 90.12%, 99.96%, and 97.02% for samples subjected to aging at 80 °C, 100 °C, 120 °C, and 140 °C, respectively, indicating the model’s strong predictive capability.
The regression parameters for water content, denoted as a, b, c, and d, are detailed in Table 6.
Table 6.
Water-content regression parameters.
5. Conclusions
This research explored the impact of long-term thermal stress on transformer oil’s electrical and chemical characteristics. The measured quantities describing these characteristics are used as key indicators of oil degradation, and include breakdown voltage, dielectric dissipation factor, resistivity, acidity factor, and water content. A mathematical model based on exponential regression was developed and used successfully to establish the link between the thermal aging duration and the measured electrical and chemical quantities. The thermal aging consists of subjecting oil samples to temperatures of 80 °C, 100 °C, 120 °C, and 140 °C for a total duration of 5000 h. The results show that the model characterizes effectively the oil’s degradation trends by accurately reproducing the time variations of the combined electrical and chemical characteristics using the same exponential formulation. This constitutes a notable novel approach compared to traditional methodologies that typically concentrate on individual characteristics.
The results show that the breakdown voltage and resistivity exhibit a progressive decline with extended thermal exposure, and the dielectric dissipation factor, acidity factor, and water content increase for all tested oil samples. At aging temperatures of 80 °C and 100 °C, the observed degradation remains within the acceptable limits established by relevant industry standards. However, at elevated aging temperatures of 120 °C and 140 °C, the rate of deterioration accelerates significantly, exceeding critical thresholds defined in established guidelines, with significant declines occurring after only 2500 h and 2000 h of exposure, respectively.
The proposed exponential model demonstrates a strong alignment with the experimental data, characterized by high correlation coefficients, typically equal to or exceeding 90%, emphasizing the effectiveness of the exponential model in predicting the oil’s aging trends and accurately capturing the impact of thermal aging on both its electrical and chemical properties. It should be noted that the model was validated using the experimental data obtained in this experimental study, and that its validity is limited to the range of temperatures considered. Further validation could be made using additional or published datasets to strengthen the model’s generalizability. The model can be validated in practice on operating transformers if the historical data measured as part of a monitoring programme is available. For example, measurements from sensors regularly measuring the environmental parameters influencing oil degradation, mainly temperature, can be correlated with the monitored electrical and chemical parameters and used to validate the model. Nevertheless, the practical implication of this approach is to provide an understanding of transformer-oil degradation under thermal stress, making it potentially applicable for transformer monitoring and diagnostics, and to support predictive maintenance strategies. To extend its applicability, future work should additionally consider other external factors such as moisture ingress, electrical stress, oil contamination, the impact of alternative insulating liquids, and the integration of machine learning for improved predictive accuracy.
Author Contributions
Conceptualization, S.A. and N.H.; methodology, S.A.; software, B.B.A.; validation, S.A., N.H. and B.B.A.; formal analysis, S.A.; investigation, S.A. and B.B.A.; resources, S.A.; data curation, S.A.; writing—original draft preparation, S.A.; writing—review and editing, S.A., N.H. and A.B.; visualization, S.A.; supervision, N.H., A.H. and A.B.; project administration, S.A.; funding acquisition, N.H. All authors have read and agreed to the published version of the manuscript.
Funding
This research received no external funding.
Data Availability Statement
The original contributions presented in the study are included in the article, further inquiries can be directed to the corresponding author.
Conflicts of Interest
The authors declare no conflicts of interest.
References
- Ma, H.; Saha, T.K.; Ekanayake, C. Statistical learning techniques and their applications for condition assessment of power transformer. IEEE Trans. Dielectr. Electr. Insul. 2012, 19, 481–489. [Google Scholar] [CrossRef]
- Wasserberg, V.; Borsi, H.; Gockenbach, E. A novel system for the prolongation of the lifetime of power transformers by reduced oxidation and aging. In Proceedings of the Conference Record of the 2004 IEEE International Symposium on Electrical Insulation, Indianapolis, IN, USA, 19–22 September 2004; pp. 233–236. [Google Scholar] [CrossRef]
- Meshkatoddini, M.R. A practical method for lifetime estimation of the used mineral oils. In Proceedings of the 2002 IEEE 14th International Conference on Dielectric Liquids. ICDL 2002 (Cat. No.02CH37319), Graz, Austria, 12 July 2002; pp. 305–308. [Google Scholar] [CrossRef]
- Kavitha, S.; Varuna, S.; Ramya, R. A comparative analysis on linear regression and support vector regression. In Proceedings of the 2016 Online International Conference on Green Engineering and Technologies (IC-GET), Coimbatore, India, 19 November 2016; pp. 1–5. [Google Scholar] [CrossRef]
- Wildi, T.; Sybille, G. Electrotechnique; De Boeck Université: Bruxelles, Belgique, 2005; Available online: https://www.deboecksuperieur.com/livre/9782804148928-electrotechnique (accessed on 6 April 2025).
- Densley, R.J.; Gupta, B.K. Effect of temperature on sensitivity of diagnostic tests on oil-impregnated paper insulation. In Proceedings of the Electrical Insulation Conference and Electrical Manufacturing and Coil Winding Conference (Cat. No.01CH37264), Cincinnati, OH, USA, 18 October 2001; pp. 601–604. [Google Scholar] [CrossRef]
- Pahlavanpour; Martins, M.; Eklund. Study of moisture equilibrium in oil-paper system with temperature variation. In Proceedings of the 7th International Conference on Properties and Applications of Dielectric Materials (Cat. No.03CH37417), Nagoya, Japan, 1–5 June 2003; Volume 3, pp. 1124–1129. [Google Scholar] [CrossRef]
- Rouse, T.O. Mineral insulating oil in transformers. IEEE Electr. Insul. Mag. 1998, 14, 6–16. [Google Scholar] [CrossRef]
- Saha, T.K.; Purkait, P. Investigations of Temperature Effects on the Dielectric Response Measurements of Transformer Oil-Paper Insulation System. IEEE Trans. Power Deliv. 2008, 23, 252–260. [Google Scholar] [CrossRef]
- Du, Y.; Zahn, M.; Lesieutre, B.C.; Mamishev, A.V.; Lindgren, S.R. Moisture equilibrium in transformer paper-oil systems. IEEE Electr. Insul. Mag. 1999, 15, 11–20. [Google Scholar] [CrossRef]
- Arakelian, V.G.; Fofana, I. Water in Oil-Filled, High-Voltage Equipment, Part I: States, Solubility, and Equilibrium in Insulating Materials. IEEE Electr. Insul. Mag. 2007, 23, 15–27. [Google Scholar] [CrossRef]
- Arakelian, V.G.; Fofana, I. Water in oil-filled high-voltage equipment part II: Water content as physicochemical tools for insulation condition diagnostic. IEEE Electr. Insul. Mag. 2007, 23, 15–24. [Google Scholar] [CrossRef]
- Wang, D.; Zhou, L.; Wang, A.; Li, H.; Liao, W.; Guo, L.; Cui, Y. Effects of thermal aging on moisture diffusion in insulation paper immersed with mineral oil. IEEE Trans. Dielectr. Electr. Insul. 2018, 25, 1888–1896. [Google Scholar] [CrossRef]
- Cui, Y.; Ma, H.; Saha, T.; Ekanayake, C.; Martin, D. Moisture-Dependent Thermal Modelling of Power Transformer. IEEE Trans. Power Deliv. 2016, 31, 2140–2150. [Google Scholar] [CrossRef]
- Martin, D.; Perkasa, C.; Lelekakis, N. Measuring Paper Water Content of Transformers: A New Approach Using Cellulose Isotherms in Nonequilibrium Conditions. IEEE Trans. Power Deliv. 2013, 28, 1433–1439. [Google Scholar] [CrossRef]
- Emsley, A.M.; Xiao, X.; Heywood, R.J.; Ali, M. Degradation of cellulosic insulation in power transformers. Part 3: Effects of oxygen and water on ageing in oil. Electr. Insul. Mag. 2021, 37, 19–26. [Google Scholar] [CrossRef]
- Li, Y.; Wu, G.; Li, W.; Cui, Y.; Gao, B. Influence of moisture and oxygen on aging of oil-paper insulation. IEEE Trans. Dielectr. Electr. Insul. 2020, 27, 1770–1777. [Google Scholar] [CrossRef]
- Vasovic, V.; Lukic, J.; Mihajlovic, D.; Bran. Aging of transformer insulation of experimental transformers and laboratory models with different moisture contents: Part II — moisture distribution and aging kinetics. IEEE Trans. Dielectr. Electr. Insul. 2021, 28, 1563–1571. [Google Scholar] [CrossRef]
- Wang, J.; Zhang, L.; Liu, Q. Thermal Aging of Oil-Paper Insulation: Influence on Dielectric Properties. J. Electr. Eng. Technol. 2023, 18, 895–904. [Google Scholar]
- Zhang, W.; Liu, J.; Wang, X. Dielectric Response of Oil-Paper Insulation Under Varying Temperature and Humidity. IEEE Trans. Dielectr. Electr. Insul. 2023, 30, 153–162. [Google Scholar]
- Li, Y.; Wu, G.; Li, W.; Cui, Y.; Gao, B. Effect of Temperature on Dielectric Properties of Oil-Paper Insulation. In Proceedings of the 2023 IEEE Electrical Insulation Conference (EIC), Knoxville, TN, USA, 28–31 May 2023; pp. 1–6. [Google Scholar] [CrossRef]
- Zhang, M.; Yu, M.; Zhou, W.; Liang, Y.; Lei, S.; Shi, Y.; Qu, L. Research on the Variation of Dielectric Properties of Oil-Paper Insulation for Power Equipment over a Wide Temperature Range. High Voltage 2024, 9, 648–658. [Google Scholar] [CrossRef]
- Singh, M.; Jindal, V.; Singh, J. Effects of Thermal Aging on Blended Oil Characteristics in Comparison to Mineral Oil and Synthetic Esters. IEEE Trans. Dielectr. Electr. Insul. 2023, 30, 1540–1547. [Google Scholar] [CrossRef]
- Fofana, I.; Borsi, H.; Gockenbach, E.; Farzaneh, M. Aging of transformer insulating materials under selective conditions. Eur. Trans. Electr. Power 2007, 17, 450–470. [Google Scholar] [CrossRef]
- Qin, C.; Lin, W.; Huang, Y.; Liang, H.; Hua, H. Study on Thermal Aging Insulation Characteristics of Transformer Oil-Paper Insulation. In Proceedings of the 2024 IEEE 4th International Conference on Power, Electronics and Computer Applications (ICPECA), Shenyang, China, 26–28 January 2024; Volume A59, pp. 744–748. [Google Scholar] [CrossRef]
- Abdi, S.; Boubakeur, A.; Haddad, A. Influence of thermal ageing on transformer oil properties. In Proceedings of the 2008 IEEE International Conference on Dielectric Liquids, Chasseneuil, France, 30 June–3 July 2008; pp. 1–4. [Google Scholar] [CrossRef]
- Guerbas, F.; Adjaout, L.; Abada, A. Accelerated Thermal Aging Effect on The New and Reclamation Transformer Oil Behavior. In Proceedings of the 2023 IEEE Electrical Insulation Conference (EIC), Quebec City, QC, Canada, 18–21 June 2023; pp. 1–4. [Google Scholar] [CrossRef]
- Abdi, S.; Boubakeur, A.; Haddad, A. Influence of Thermal Ageing on Dissolved Gases in Transformer Oil. In Proceedings of the Société Française d’Électrostatique, Paris, France, 7–9 July 2008. [Google Scholar]
- Negara, I.M.Y.; Aryani, N.K.; Asfani, D.A.; Fahmi, D.; Jauhari, R.; Wahyudi, M. Analysis of physical and electrical characteristics of transformer oil insulation during accelerated thermal aging experiment and its lifetime estimation using arrhenius law and breakdown voltage test. In Proceedings of the 2017 International Seminar on Intelligent Technology and Its Applications (ISITIA), Surabaya, Indonesia, 28–29 August 2017; pp. 139–143. [Google Scholar] [CrossRef]
- Abdi, S.; Boubakeur, A.; Haddad, A.; Harid, N. Influence of Artificial Thermal Aging on Transformer Oil Properties. Electr. Power Components Syst. 2011, 39, 1701–1711. [Google Scholar] [CrossRef]
- Martin, D.; Saha, T.; Dee, R.; Buckley, G.; Chinnarajan, S.; Caldwell, G.; Zhou, J.B.; Russell, G. Determining water in transformer paper insulation: Analyzing aging transformers. IEEE Electr. Insul. Mag. 2015, 31, 23–32. [Google Scholar] [CrossRef]
- Zhang, X.; Ren, L.; Yu, H.; Xu, Y.; Lei, Q.; Li, X.; Han, B. Dual-Temperature Evaluation of a High-Temperature Insulation System for Liquid-Immersed Transformer. Energies 2018, 11, 1957. [Google Scholar] [CrossRef]
- Wang, X.; Tang, C.; Huang, B.; Hao, J.; Chen, G. Review of Research Progress on the Electrical Properties and Modification of Mineral Insulating Oils Used in Power Transformers. Energies 2018, 11, 487. [Google Scholar] [CrossRef]
- Liu, L.; Wu, H.; Liu, T.; Feng, H.; Tian, H.; Peng, Z. Influence of moisture and temperature on the frequency domain spectroscopy characteristics of transformer oil. In Proceedings of the 2016 IEEE International Conference on Dielectrics (ICD), Montpellier, France, 3–7 July 2016; Volume 1, pp. 565–568. [Google Scholar] [CrossRef]
- Cheng, L.; Jiang, Y.; Dan, M.; Wen, H.; Li, Y.; Qin, W.; Hao, J. Effects of Fiber and Copper Particles on Conductivity and Breakdown Characteristics of Natural Ester and Mineral Oil under DC Voltage. Energies 2020, 13, 1818. [Google Scholar] [CrossRef]
- Pedro da Costa Souza, J.; Picher, P.; Zinflou, A.; Fofana, I.; Beheshti Asl, M. A Comprehensive Review on Artificial Intelligence-Based Applications for Transformer Thermal Modeling: Background and Perspectives. IEEE Access 2024, 12, 152310–152329. [Google Scholar] [CrossRef]
- Mokhnache, L.; Boubakeur, A.; Said, N. Comparison of different neural networks algorithms used in the diagnosis and thermal ageing prediction of transformer oil. In Proceedings of the IEEE International Conference on Systems, Man and Cybernetics, Yasmine Hammamet, Tunisia, 6–9 October 2002; Volume 6, p. 6. [Google Scholar] [CrossRef]
- Abdi, S.; Harid, N.; Safiddine, L.; Boubakeur, A.; Haddad, A.M. The Correlation of Transformer Oil Electrical Properties with Water Content Using a Regression Approach. Energies 2021, 14, 2089. [Google Scholar] [CrossRef]
- Yang, D.; Chen, W.; Zhou, Y.; Wang, Z.; Zhang, R.; Song, R. Prediction of Aging Degree of Oil-paper Insulation Based on Raman Spectroscopy and Fuzzy Neural Network. In Proceedings of the 2020 IEEE International Conference on High Voltage Engineering and Application (ICHVE), Beijing, China, 6–10 September 2020; pp. 1–4. [Google Scholar] [CrossRef]
- Gouda, O.E.; El Dein, A.Z. Prediction of Aged Transformer Oil and Paper Insulation. Electr. Power Components Syst. 2019, 47, 406–419. [Google Scholar] [CrossRef]
- Peng, D.; Yang, D.; Wang, C.; Li, M. Research of the Dielectric Loss factor tan delta of Transformer Oil by Multi-Parameter Regression Analysis. In Proceedings of the 2009 Asia-Pacific Power and Energy Engineering Conference, Wuhan, China, 27–31 March 2009; pp. 1–3. [Google Scholar] [CrossRef]
- Mokhnache, L.; Verma, P.; Boubakeur, A. Neural networks in prediction of accelerated thermal ageing effect on oil/paper insulation tensile strength. In Proceedings of the 2004 IEEE International Conference on Solid Dielectrics (ICSD 2004), Toulouse, France, 5–9 July 2004; Volume 2, pp. 575–577. [Google Scholar] [CrossRef]
- Rondla, P.; Falahi, M.; Zhan, W.; Goulart, A. A regression algorithm for transformer fault detection. In Proceedings of the 2012 IEEE Power and Energy Society General Meeting, San Diego, CA, USA, 22–26 July 2012; pp. 1–8. [Google Scholar] [CrossRef]
- Yang, Z.; Chen, W.; Yang, D.; Song, R. A Novel Recognition Method of Aging Stage of Transformer Oil-Paper Insulation Using Raman Spectroscopic Recurrence Plots. IEEE Trans. Dielectr. Electr. Insul. 2022, 29, 1152–1159. [Google Scholar] [CrossRef]
- Abdi, S.; Besseri, B.A.; Haddad, A.; Harid, N.; Boubakeur, A. Advanced Regression Modeling for Correlating Transformer Oil Electrical Properties with Thermal Aging Trends. In Proceedings of the 2024 59th International Universities Power Engineering Conference (UPEC), Cardiff, UK, 2–6 September 2024; pp. 1–6. [Google Scholar]
- IEC Standard 60475; Method of Sampling Insulating Liquids. International Electrotechnical Commission: Geneva, Switzerland, 2011.
- IEC Standard 60156; Determination of the Breakdown Voltage of Insulating Liquids at Power Frequency. International Electrotechnical Commission: Geneva, Switzerland, 1995.
- IEC Standard 60247; Measurement of Relative Permittivity, Dielectric Dissipation Factor and DC Resistivity of Insulating Liquids. International Electrotechnical Commission: Geneva, Switzerland, 2004.
- IEC Standard 62021; Determination of the Acidity of Insulating Liquids. International Electrotechnical Commission: Geneva, Switzerland, 2003.
- IEC Standard 60814; Determination of Water Content in Insulating Liquids by Coulometric Karl Fischer Titration. International Electrotechnical Commission: Geneva, Switzerland, 1997.
- Zou, K.H.; Tuncali, K.; Silverman, S.G. Correlation and simple linear regression. Radiology 2003, 227, 617–628. [Google Scholar] [CrossRef]
- Ádám Tamus, Z. Regression analysis to evaluate the reliability of insulation diagnostic methods. J. Electrost. 2013, 71, 564–567. [Google Scholar] [CrossRef]
- Zhang, L.; Shi, Z.; Cheng, M.M.; Liu, Y.; Bian, J.W.; Zhou, J.T.; Zheng, G.; Zeng, Z. Nonlinear Regression via Deep Negative Correlation Learning. IEEE Trans. Pattern Anal. Mach. Intell. 2021, 43, 982–998. [Google Scholar] [CrossRef]
- Esfahani, J.A.; Safaei, M.R.; Goharimanesh, M.; De Oliveira, L.R.; Goodarzi, M.; Shamshirband, S.; Bandarra Filho, E.P. Comparison of experimental data, modelling and non-linear regression on transport properties of mineral oil based nanofluids. Powder Technol. 2017, 317, 458–470. [Google Scholar] [CrossRef]
- Kovacević, U.; Vujisić, M.; Iričanin, B.; Osmokrović, P.; Milosavljević, S. The correlation and regression between the pre-breakdown current and breakdown voltage of the vacuum switchgear in dependence of switching operation. In Proceedings of the 2014 IEEE International Power Modulator and High Voltage Conference (IPMHVC), Santa Fe, NM, USA, 1–5 June 2014; pp. 384–387. [Google Scholar] [CrossRef]
- Jakšić, U.G.; Arsić, N.B.; Fetahović, I.S.; Stanković, K.Đ. Analysis of correlation and regression between particle ionizing radiation parameters and the stability characteristics of irradiated monocrystalline Si film. Nucl. Technol. Radiat. Prot. 2014, 29, 123–127. [Google Scholar] [CrossRef]
- Amalanathan, R.; Harid, N. Impact of adding activated bentonite to thermally aged ester-based TiO2 nanofluids on insulation performance. IET Nanodielectr. 2021, 4, 61–71. [Google Scholar] [CrossRef]
- Sha, Y.; Zhou, Y.; Nie, D.; Wu, Z.; Deng, J. A study on electric conduction of transformer oil. IEEE Trans. Dielectr. Electr. Insul. 2014, 21, 1061–1069. [Google Scholar] [CrossRef]
- Pompili, M.; Mazzetti, C. Effect of reduced viscosity on the electrical characteristics of transformer and switchgear oils. In Proceedings of the Conference Record of the the 2002 IEEE International Symposium on Electrical Insulation (Cat. No.02CH37316), Boston, MA, USA, 7–10 April 2002; pp. 363–366. [Google Scholar] [CrossRef]
- Kang, B.P. Thermal Dependency of Viscosity, Power Factor, and Ion Content of Electrical Insulating Oils-III Predictions of Power Factor of Oil Blends Through the Concept of Ion Content. IEEE Trans. Electr. Insul. 1967, EI-2, 121–128. [Google Scholar] [CrossRef]
- Koutras, K.N.; Peppas, G.D.; Tegopoulos, S.N.; Kyritsis, A.; Yiotis, A.G.; Tsovilis, T.E.; Gonos, I.F.; Pyrgioti, E.C. Ageing Impact on Relative Permittivity, Thermal Properties and Lightning Impulse Voltage Performance of Natural Ester Oil Filled with Semi-conducting Nanoparticles. IEEE Trans. Dielectr. Electr. Insul. 2023, 30, 1598–1607. [Google Scholar] [CrossRef]
- Beroual, A.; Tobazeon, R. Prebreakdown Phenomena in Liquid Dielectrics. IEEE Trans. Electr. Insul. 1986, EI-21, 613–627. [Google Scholar] [CrossRef]
Disclaimer/Publisher’s Note: The statements, opinions and data contained in all publications are solely those of the individual author(s) and contributor(s) and not of MDPI and/or the editor(s). MDPI and/or the editor(s) disclaim responsibility for any injury to people or property resulting from any ideas, methods, instructions or products referred to in the content. |
© 2025 by the authors. Licensee MDPI, Basel, Switzerland. This article is an open access article distributed under the terms and conditions of the Creative Commons Attribution (CC BY) license (https://creativecommons.org/licenses/by/4.0/).