Abstract
Relative to other renewable energy technologies, concentrated solar power (CSP) is only in the beginning phases of large-scale deployment. Its incorporation into national grids is steadily growing, with anticipation of its substantial contribution to the energy mix. A number of emerging economies are situated in areas that receive abundant amounts of direct normal irradiance (DNI), which translates into expectations of significant effectiveness for CSP. However, any assessment related to the planning of CSP facilities is challenging because of the complexity of the associated criteria and the number of stakeholders. Additional complications are the differing concepts and configurations for CSP plants available, a dearth of related experience, and inadequate amounts of data in some developing countries. The goal of the work presented in this paper was to evaluate the practical CSP implementation options for such parts of the world. Ambiguity and imprecision issues were addressed through the application of multi-criteria decision-making (MCDM) in a fuzzy environment. Six technology combinations, involving dry cooling and varied installed capacity levels, were examined: three parabolic trough collectors with and without thermal storage, two solar towers with differing storage levels, and a linear Fresnel with direct steam generation. The in-depth performance analysis was based on 4 main criteria and 29 sub-criteria. Quantitative and qualitative data, plus input from 44 stakeholders, were incorporated into the proposed fuzzy analytic hierarchy process (AHP) model. In addition to demonstrating the advantages and drawbacks of each scenario relative to the local energy sector requirements, the model’s results also provide accurate recommendation guidelines for integrating CSP technology into national grids while respecting stakeholders’ priorities.
1. Introduction
Widespread reliance on electricity has made its generation an indispensable element in the progress of modern society. The current operators of national grids must address numerous challenges associated with an expanding world population that still includes more than one billion people who lack adequate access to electricity. Other difficulties are linked to the increasing number of features of today’s world that now require power generation. Such considerations represent additional concerns over and above addressing ever-increasing demand, combined with pressures to reduce greenhouse gas emissions through the integration of renewable energy into the grid arising due to increasing global awareness of the urgent necessity to develop sustainable renewable energy sources (RESs). To this end, the total installed RES capacity has risen from close to 60 GW (2000) to more than 2628 GW (2023), with CSP accounting for 6.8 GW, generating 12,828 GWh of electricity in 2022 [1]. Figure 1 illustrates detailed global RES capacities, with the exception of hydropower.
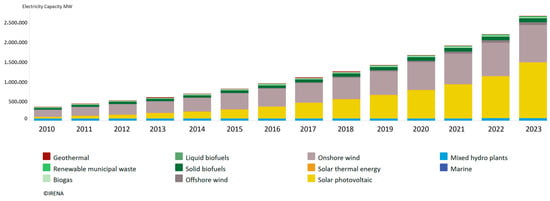
Figure 1.
Cumulative installed RES capacities worldwide. Source: IRENA, 2025 [1].
In particular, the past decade has seen notable advances with respect to solar power technology, and continual new developments are anticipated. Close examination of Figure 1 reveals that the bulk of solar technology development features photovoltaic (PV) elements, which extract power from solar global horizontal irradiance (GHI), in contrast to concentrated solar power (CSP), which harvests only from direct normal irradiance (DNI). The preponderance of PV technology is attributable to the higher exposure levels of and thus greater opportunities with GHI than with DNI, as indicated in Figure 2. The result has been huge sales of residential and large-scale PV installations, that have then led to lower costs for PV modules through economies of scale, plus research and development (R&D). With respect to both technological advances and diminished costs, CSP still fails to match PVs. On the other hand, CSP can offer important benefits, such as the use of thermal energy storage (TES) and opportunities for hybridization with conventional power plants and auxiliary burners, which can improve the effects of dispatchability and lengthen the electrical production times. These advantages favor the advancement of CSP, as does the forecast from the International Energy Agency (IEA) roadmap, which predicts that by 2050, a total of 22% of the power generated worldwide will be derived in equal parts from solar thermal technologies and PVs [2].
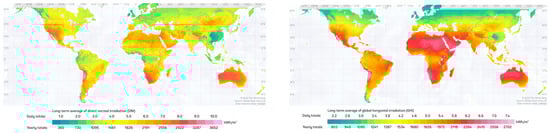
Figure 2.
World map for DNI (Left) and GHI (Right). Source: SolarGIS, 2025 [3].
To effectively integrate CSP systems into national electrical grids, several factors must be considered, including grid stability, dispatchability, and energy storage capabilities. CSP plants with TES can provide a stable and controllable power output, reducing the fluctuations caused by variable DNI levels. This makes CSP particularly advantageous compared to other intermittent renewable sources, as it can supply electricity even after sunset. Additionally, integrating CSP into existing grids requires proper grid infrastructure enhancements, including high-voltage transmission lines to transport electricity from sun-rich regions to demand centers. Policymakers and grid operators must also establish regulatory frameworks that accommodate CSP’s unique generation characteristics, ensuring smooth grid synchronization and load-balancing. By leveraging hybridization with conventional power plants and advanced forecasting techniques, CSP can play a significant role in improving the grid’s reliability while supporting the transition toward sustainable energy systems. This study aids in this integration by identifying key parameters such as TES capacity, reliability, and economic feasibility, among other parameters, helping policymakers and planners select CSP configurations that align with grid requirements.
Previous financial backing of electrical installations based on fossil fuels means that changing to new methods of power generation requires government-mandated facilitation. This state of affairs, which is called the lock-in effect, is prevalent in developed countries, where long-established capital interests underpin the national grids that provide electricity to most populated areas [4]. Conditions are drastically different in more economically advanced countries, which must meet ongoing demands for sizable expansion of the generation capacity in response to fast growth. In these countries, grid operators must decide on complicated issues surrounding their choice of mechanisms for augmenting their electrical networks. Despite their motivation to explore new technologies, many developing countries that enjoy abundant solar radiation, with a corresponding potential to exploit solar energy, are also deficient in adequate experience to authorize and initiate CSP projects. A further impediment is the early emergent stage of widespread CSP deployment, the lack of a requisite blend of conceptually disparate technical components, and a dearth of the data necessary to correctly evaluate possible solutions. Together, these barriers compound any related reservations that might have a bearing on an investor’s desire to underwrite CSP projects. A crucial need thus exists for frameworks that can draw on all of the obtainable data and address intangible factors to provide a systematic decision-making procedure that incorporates all related paths and perspectives: technical, economic, environmental, social, and political. A vital consideration to underscore is that electrical systems must be viewed as complex systems, comprising numerous elements and disparate entities whose interactions through networks result in new properties, as well as evolving adaptive and learning techniques [5]. Taking this point into account in the overall decision-making is essential. A World Bank study directed at investigating the scaling up of CSP in emerging economies highlighted India, South Africa, and the Middle East and North Africa (MENA) as regions where large-scale CSP projects might be feasible [6].
The Literature Review
The literature provides reports of RES evaluations based on both regular and fuzzy multi-criteria decision-making (MCDM) techniques [7] With respect to investigations of CSP in particular, numerous researchers have assessed CSP technology in terms of its power generation, but most of these have concentrated primarily on technical and economic factors [8,9,10,11,12,13]. Few have considered solar thermal power from a multi-criteria perspective. Nixon et al. [14] employed the analytic hierarchy process (AHP) to choose the optimal methodology for solar thermal collection in northwestern India. For future research, the authors recommended obtaining more accurate outcomes by applying further assessment criteria and consulting with additional experts. They concluded that using linear Fresnel (LF) technology in combination with secondary compound parabolic trough (PT) or parabolic dish (PD) reflectors would be the most desirable solution. Rai [15] proposed a quantitative evaluation model for a comparative analysis of the development of the installed solar energy capacity in various geographical alternatives. They employed a combination of modified CRITIC and VIKOR methods and identified areas with a strong performance and those that needed improvements in solar energy development. Ingenhoven et al. [16] conducted a techno-economic assessment of a CSP system that could deliver process heat at a temperature of 1100 °C, with the levelized cost of heat (LCOH) for the solar component ranging between 37 and 39 USD/GJ, achieving an annual solar share of 28% to 53% of the total heat demand for industrial processes. Their analysis indicated that while the system was not yet optimized for the lowest cost of industrial heat, the sensitivity analysis showed that the solar share could be nearly doubled with only a 5% increase in the LCOH, highlighting the potential for an improved performance with further optimization.
With the goal of prioritizing CSP projects to maximize the profits of medium-sized Spanish companies, Aragonés-Beltrán et al. [17] evaluated economic feasibility and analyzed project risk. They divided their work into three phases, each with a set of decision criteria as stipulated by local project teams and decision-makers. To examine the use of CSP approaches in Italy, Cavallaro [18] chose the preference ranking organization method for enrichment evaluation (PROMETHEE). He specified 12 explicit alternatives, designated according to the methodologies and components employed in the CSP plants, establishing seven decision criteria for assessment. The criteria were derived from technical, environmental, and economic perspectives, as set out mainly in the European concentrated solar thermal road mapping report [19]. In other work, Peterseim et al. [20] used the AHP to assess how well CSP technologies could be hybridized with both conventional energy technologies and RESs. Nixon et al. [21] analyzed novel LF collector designs by developing a model based on both MCDM and quality function deployment (QFD) techniques. Abouhawwash and Jameel [22] evaluated solar power installations using a neutrosophic MCDM approach, emphasizing criteria such as technological feasibility, economic viability, environmental impact, legal frameworks, and social acceptance. They employed the CRITIC method to determine the weights of these criteria, providing insights for informed decision-making in solar power solutions.
To contribute additional knowledge to the findings already reported in the literature, the goal of this research was to develop a basis for evaluating practical alternative CSP technologies and implementation strategies in developing countries. Because fuzzy analytics are an effective means of successfully dealing with uncertainty, such as that associated with CSP, MCDM was applied in a fuzzy environment to assess a variety of possible CSP scenarios. The complexity inherent in centralized power plants projects arises from the multiple parameters and numerous stakeholders engaged in the process. For this reason, some level of uncertainty and subjectivity is always present, and in the particular conditions under study, the lack of CSP experience and insufficient data prevalent in the countries of interest only exacerbate these challenges. The analysis undertaken for this research was reliant on numerous assessment factors. As explained in Kassem et al. [23], the criteria adopted were determined based on comprehensive definitions developed through a structured analytic deliberative process (ADP) derived from a solid consensus of experienced experts in the CSP domain. With respect to the alternatives explored, rather than targeting only the collection technologies, this work involved the examination of scenario-based possibilities as a means of widening the scope of the analysis. The inclusion of varied scenarios in the evaluation served to emphasize more practical solutions and increased the accuracy of the results. The goal was to provide planners in developing countries with a method for honing in on the practical possibilities during the early planning phases so that they would be able to discern the CSP technologies and configurations that could enhance the support for sustainable development in ways that met the local requirements.
2. The CSP Assessment Background
The planning involved in providing electrical generation is complicated. Such projects are usually subject to national development stipulations, with numerous interconnected parameters, stakeholders, investments, and affected consumers. A further element is the vital process of incorporating RESs into national grids, which adds enormous difficulties and unpredictable hurdles [5]. A successful analysis of all relevant assessment criteria must take into account not just crucial technical and economic factors but also environmental, social, and political elements. Generation facility planners must therefore carefully appraise a myriad of often incompatible constraints and diverse stakeholder perspectives. For this reason, a fully optimal solution that provides the best outcomes from all points of view is thus unfeasible in practice; instead, rather than providing perfect answers, MCDM techniques can indicate the possibilities in order of priority. An important benefit of using MCDM is its ability to analyze multiple options based on consideration of a variety of criteria, expressed in differing units of measurement [24].
Many MCDM methods, such as VIKOR, PROMETHEE, TOPSIS, and the Best–Worst Method, have been developed and widely adopted for decision-making problems. However, none of the many versions of MCDM available can effectively address all problems: each has both advantages and disadvantages. For this study, the AHP was chosen because of a number of elements that make it especially appropriate for tackling the challenges associated with CSP planning. First, the AHP clarifies and streamlines the decision-making mechanism by decomposing complicated issues hierarchically. A second benefit is that the AHP establishes a baseline for the computational requirements involved in both quantitative data and any associated qualitative and intangible elements, thus offering the mathematical capability to merge such diverse forms of input into one matrix, leading to a unified final solution. The third asset of the AHP is its unique review opportunity to check for and screen out inconsistent stakeholder input values, thus enhancing the accuracy of the outcomes. Mapping the qualitative preferences derived from the judgment of stakeholders without at least potentially introducing subjectivity is difficult. Additional ambiguity accompanies the insufficient data and inexperience with large-scale CSP projects that characterize conditions in many emerging economies, and the fact that CSP itself is still in the early development stage only compounds these problems. Also, the AHP features a crisp numerical scale that has received negative reviews in some literature reports because it cannot satisfactorily handle the uncertainty and imprecision involved in delineating human perceptions [25]. For these reasons, using a fuzzy environment in which to employ the AHP can enhance the accuracy of the assessment outcomes since this technique enables any associated vague language, uncertain parameters, and inadequate knowledge to be addressed.
While alternative weighting methods exist, each comes with specific limitations that make them less suited to this study. VIKOR and PROMETHEE, for instance, are primarily ranking-based methods that focus on identifying compromise solutions and preference outranking, respectively. However, they do not provide the needed structured hierarchical decomposition, making them less effective for handling multi-level decision problems involving both qualitative and quantitative factors. The Best–Worst Method (BWM), although useful in reducing the number of comparisons and improving consistency, relies on the accurate identification of the most and least important criteria, which can introduce subjectivity and bias. Although the BWM offers simplicity and enhanced consistency through fewer comparisons, we specifically selected the AHP over the BWM for two main reasons. First, the AHP enables the comprehensive capture of stakeholders’ input and representations of their judgments without explicitly identifying a single best and worst criterion, as in the BWM, or an ideal solution, as in TOPSIS. This feature is crucial for this research, as the goal is to thoroughly evaluate various CSP scenarios, clearly determining their strengths and weaknesses, thereby supporting informed and flexible current and future decision-making rather than pinpointing one optimal solution. Second, the structured hierarchical evaluation provided by the AHP makes it particularly suitable for the complexities tackled in this study. CSP assessments involve detailed consideration of numerous interconnected technical, economic, environmental, and social criteria and sub-criteria. The structured nature of the AHP effectively manages and transparently presents these multifaceted evaluations, enhancing stakeholders’ understanding and facilitating more robust decision-making. By integrating fuzzy logic into the AHP framework (FAHP), the chosen approach further enhances the handling of ambiguity and uncertainty inherent in CSP planning, systematically incorporating both expert judgment and quantitative data into a coherent assessment. This combination effectively balances the computational feasibility with structured, expert-driven evaluations, thus supporting robust and informed decision-making.
The literature mentions a number of fuzzy AHP extent analysis techniques that have been applied to provide a variety of systematic and computational methods for resolving issues related to the uncertainties associated with alternative selections and problem justifications by means of employing a fuzzy concept. Bozbura et al. [24] and Demirel et al. [26] published comprehensive comparisons that detailed the benefits and drawbacks of AHP fuzzy extent methods. For the work presented here, the choice was to employ Chang’s extent analysis method [27,28], which relies on triangular fuzzy numbers (TFNs) rather than crisp values. Because the Chang extent technique adheres to the same structure as the original AHP, it offers the previously mentioned critical advantage of checking for inconsistent stakeholder-supplied variables so that they can be screened out. The Chang extent also circumvents the enormous computational loads associated with other approaches, such as those of Van Laarhoven and Pedrycz [29] and Buckley [30]. A further bonus is that to limit the pressure that questionnaire respondents might feel when they have no opinion about or knowledge of particular questions, the Chang extent permits blank responses. Building on these foundational advantages, we specifically selected the triangular fuzzy numbers (TFNs) within Chang’s extent framework due to their straightforward, easily understandable format, crucial for engaging our diverse group of stakeholders effectively. This method not only simplifies the interpretation of fuzzy logic for non-experts but also integrates seamlessly with the rank number of alternatives (RNA) method used in this study, ensuring robust data handling across both qualitative judgments and quantitative metrics. By maintaining methodological rigor without excessive computational demands, TFNs optimize the balance between the depth of the analysis and its practical feasibility, thus enhancing our capacity to manage the uncertainties inherent in evaluating various CSP scenarios efficiently and transparently.
Evaluating the development of a CSP facility requires the establishment of adequate assessment criteria. When power generation is owned primarily by private sector entities, the development focus tends to lean more toward technical and commercial practicality. This perspective is the norm in developed countries where governments enact legislation that provides financial incentives to help less established technologies reach equal footing to that of more full-fledged ones. This strategy serves to diversify energy initiatives, creating more sustainable electricity generation alternatives. In contrast, the usual arrangement in evolving nations is state-owned power production, which has the effect of expanding the focus of electric generation projects beyond techno-economic drivers. In prior work, we conducted extensive research to examine combinations of assessment criteria for CSP plants in emerging economies [23]. The resultant aggregated value tree is displayed in Figure 3, and the alternatives were assessed for this study according to the process indicated.
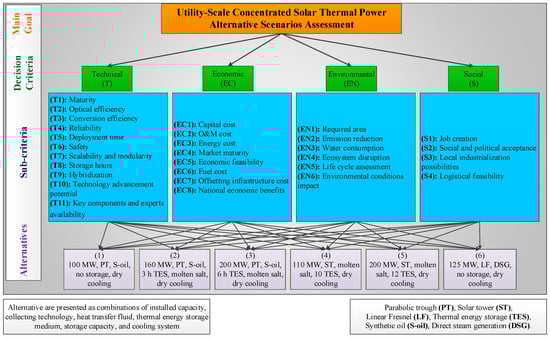
Figure 3.
CSP evaluation value tree for use in developing countries [23,31].
In terms of alternatives, six alternative scenarios were defined in a previous study, including combinations of different potential CSP technologies, as shown in Figure 3 [31]. These alternatives were defined based on comprehensive research into the merits of the different technologies involved in CSP power plants through a strength, weakness, opportunities, and threats (SWOT) analysis. Simulations were carried out of the alternative scenarios to evaluate technical and economic parameters that essentially had high influence. The different capabilities of the alternatives urge for consideration of all of the related criteria and the inclusion of stakeholders’ evaluations for the criteria and sub-criteria weights; this helps overcome the shortcomings of a mere techno-economic evaluation in that when certain alternatives perform better technically with the compromise of higher costs, the evaluation matrix considers these differences based on stakeholders’ interests. The alternative scenarios are presented below; they were defined to support the concentration on practical potential configurations of CSP technologies to support sustainable electrification in developing countries in the early stages of CSP adoption, whereas Saudi Arabia was taken as a case study [31].
- Alternative 1: Gross capacity of 100 MW, parabolic trough (PT) with synthetic oil as the heat transfer fluid (HTF), no storage, and dry cooling;
- Alternative 2: Gross capacity of 170 MW, PT with synthetic oil as the HTF, molten salt for 3 h of TES, and dry cooling;
- Alternative 3: Gross capacity of 200 MW, PT with synthetic oil as the HTF, molten salt for 6 h of TES, and dry cooling;
- Alternative 4: Gross capacity of 110 MW, solar tower (ST), molten salt as the HTF and for 10 h of TES, and dry cooling;
- Alternative 5: Gross capacity of 200 MW, ST, molten salt as the HTF and for 12 h of TES, and dry cooling;
- Alternative 6: Gross capacity of 125 MW, linear Fresnel (LF) with direct steam generation (DSG), no storage, and dry cooling.
3. Methodology
The goal of the methodology proposed in this paper, as summarized in Figure 4, was to evaluate potential alternative CSP scenarios based on hierarchal consideration of all pertinent criteria. Stakeholders’ opinions about the decision criteria and sub-criteria were obtained through the application of pairwise comparisons of TFNs. Rigorous research was directed at acquiring alternative assessments that took into account both quantitative and qualitative factors. Achieving this objective entailed the calculation of priority weights, comparison of the levels of possibility, and the establishment of weight vectors. To screen out inconsistent outcomes, the checking feature was engaged to verify the parameter evaluations: any assessments that exhibited discrepancies were sent back to the stakeholders with feedback reports so that these parameters could be re-evaluated. In this way, the model was synthesized, an evaluation matrix was acquired, and findings were output. The next step was the sensitivity analysis, followed by the final recommendations.
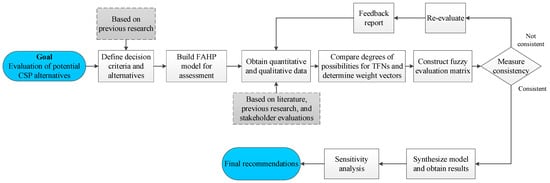
Figure 4.
Proposed methodology.
To enable quantification of the ambiguity inherent in imprecise human thoughts and perceptions, as well as the uncertainty that characterizes the planning of early-phase renewable energy initiatives, the AHP method was combined with fuzzy set theory [24,25]. Chang’s extent analysis method enables the use of TFNs to handle uncertainty and ambiguity through representation and processing in a fuzzy environment [32]. Normally, a TFN is defined as a triplet and denoted as M, which can be represented by (l, m, u) in which (l < m < u). For greater values of u − l and fuzzier degrees and if l = m = u, then M is not a fuzzy number. Table 1 indicates the TFN scale employed to convert the language of the stakeholder input based on data elicitation.

Table 1.
Triangular fuzzy conversion scale [33].
The basic TFN mathematical operations employed were as follows:
Addition: M1 ⊕ M2 = (l1, m1, u1) ⊕ (l2, m2, u2) = (l1 + l2, m1 + m2, u1 + u2)
Multiplication: M1 ⨀ M2 = (l1, m1, u1) ⨀ (l2, m2, u2) ≈ (l1l2, m1m2, u1u2)
Inversion: (M1)−1 = (l1, m1, u1)−1 ≈ (1/u1, 1/m1, 1/l1)
The Chang extent analysis method smooths the process of comparing fuzzy numbers in order to prioritize factors and alternatives. The following subsections detail the specific steps in the proposed methodology.
3.1. Data Collection
Before the fuzzy analytic hierarchy process (FAHP) calculations were performed, both qualitative and quantitative data were collected, with the latter having measurable parameters. A review of prior analyses of RESs and solar technology revealed the frequent heavy weighting given to a number of technical and financial parameters: the conversion efficiency, annual energy output, initial cost, and energy cost. Pursuant to these findings, in a previous comprehensive examination, we established accurate data for these quantitative parameters [31]. Additionally, for the work presented here, further quantitative and qualitative data were acquired in conjunction with an assessment of tangible and intangible parameters as a means of establishing the sub-criteria, which were based on an in-depth search of the literature, industrial reports, and international databases. The qualitative assessments, however, involved evaluation of the criteria relative to the primary objective of prioritizing the CSP alternatives and establishing appropriate sub-criteria for the parent criteria. These qualitative data were extracted from responses to a questionnaire completed by stakeholders representing economically emerging countries whose environments were deemed to be suitable for CSP. The questionnaire asked the respondents to weight a large number of assessment parameters according to a linguistic scale, and the resulting linguistic values were then converted into TFNs.
3.2. Establishing Priority Weighting
This phase of the methodology entailed the use of TFNs for pairwise comparisons. The findings with respect to the use of AHP applications reported in previous publications showed that greater numbers of decision criteria and sub-criteria led to frequently contradictory answers from participants, which was attributable to the complexities arising from the consequently larger number of pairwise comparisons. In an effort to alleviate this issue, for this study, an FAHP-integrated scaling method was employed to gather participants’ responses. The answers were then aggregated as rank numbers of alternatives (RNA) for conversion into pairwise comparisons suitable for inclusion in the FAHP scale. Equation (4) defines the calculation of a scoring value (SV) introduced in order to establish a pairwise comparison of two alternatives (A and B) [34].
In contrast, for quantitative parameters, values that designated sub-criteria alternatives were translated into TFNs with the use of a specified step value (h) in the range from Kmin to Kmax based on Equations (5) and (6) [34].
where Kmax and Kmin are the maximum and minimum values of the alternative quantitative data associated with a particular parameter. The RNAs were determined according to Equation (6) and transposed into TFNs using the mapping values listed in Table 2.
where i = 1, 2, …, n, and n is the number of alternatives.
Table 2.
Individual pairwise comparison of decision criteria with respect to the overall evaluation goal.
Priority weight values were then acquired from the synthetic extent value S for the ith object, as expressed in Equation (7).
where
3.3. Comparing the Degrees of Possibility
The next action was to compare the fuzzy numbers. For pairwise comparisons, the bigger number in each set of two TFNs was identified as a means of computing approximations for the sets of weight values. The degree of possibility was established as follows:
where sup represents the supremum, which is the least upper bound of a set, and x and y represent the values on the axis of the membership function [32,35]. M1 and M2 are convex fuzzy numbers; the following equations were employed to calculate their comparisons:
where iff stands for if and only if; otherwise,
where hgt represents the height, and d is thus the ordinate of the highest intersection point between μM1 and μM2, that is, the highest intersection point between the two fuzzy numbers M1 and M2, as displayed graphically in Figure 5:
V (M2 ≥ M1) = 1, iff m2 ≥ m1
V (M2 ≥ M1) = 0, iff l1 ≥ u2
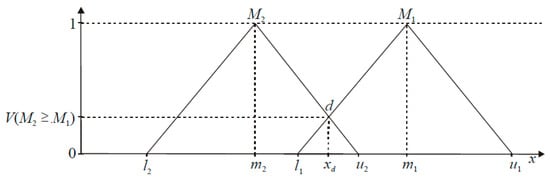
Figure 5.
Comparison of two fuzzy numbers M1 and M2 [27].
3.4. Obtaining the Weight Vector
The next step was to establish the weight vector W′ in a non-fuzzy form, as follows:
where d′(Ai) is assumed to be
W′ = [d′ (A1), d′ (A2) … d′ (An)]
d′ (Ai) = min V (Si ≥ Sk) k = 1, 2… n and k ≠ I
The degree of possibility associated with a convex fuzzy number can be defined to be greater than k convex fuzzy number Mi (i = 1, 2… k), as given in the following equation:
V (M ≥ M1, M2… Mk) = V [(M ≥ M1), (M ≥ M2) … (M ≥ Mk)]
V = min V (M ≥ Mi) i = 1, 2… k
Normalizing W′ then gives W, which is a non-fuzzy number that can be used to assess alternatives based on Saaty’s main AHP approach [36,37], whereby
W = [d (A1), d (A2)… d (An)]
4. The Case Study
The next stage of this work was to conduct a sample case study of the process of choosing CSP plant technologies in developing countries. However, the model developed is also appropriate for use with different technologies and other geographic areas.
4.1. Criteria and Sub-Criteria Priority Weighting
This section explains how the second- and third-level hierarchical priority weights were established. The opinions of 44 stakeholders associated with renewable energy in a number of developing countries that exhibit significant potential to successfully employ CSP were solicited by means of a questionnaire. Table 2 presents the individual pairwise comparisons, for which the responses of three stakeholders are designated by the three rows in each cell of the matrix, employed to assess the primary criteria related to the overall evaluation goal. Then, Table 3 provides the aggregated pairwise comparisons according to the TFN geometric means for all of the participants with respect to the decision criteria associated with the goal.
Table 3.
Aggregated pairwise comparison of decision criteria with respect to the overall evaluation goal.
Based on the aggregated pairwise comparison, the synthetic extents were determined using Equations (7)–(9) as follows:
S1 = (0.15,0.28,0.49), S2 = (0.16,0.30,0.54), S3 = (0.13,0.23,0.43), S4 = (0.12,0.19,0.35).
Then, the degrees of possibilities were found through Equations (10) to (13):
V(S1 ≥ S2) = 0.96, V(S1 ≥ S3) = 1, V(S1 ≥ S4) = 1: So, V(S1 ≥ S2, S3, S4) = 0.96
V(S2 ≥ S1) = 1, V(S2 ≥ S3) = 1, V(S2 ≥ S4) = 1: So, (S2 ≥ S1, S3, S4) = 1
V(S3 ≥ S1) = 0.85, V(S3 ≥ S2) = 0.81, V(S3 ≥ S4) = 1: So, V(S3 ≥ S1, S2, S4) = 0.81
V(S4 ≥ S1) = 0.70, V(S4 ≥ S2) = 0.66, V(S4 ≥ S1) = 0.85: So, V(S4 ≥ S1, S2, S3) = 0.66
Priority weights were, in turn, established for the four parent decision criteria according to Equations (14)–(18), and the sub-criteria priority weights associated with each parent criterion were then calculated in a similar manner.
Guidelines for assessment of the alternatives were derived from comprehensive research in the literature, industrial reports, international databases, and previous simulation results. All of this information played a role in ascertaining how well each alternative performed in regard to each sub-criterion. Table 4 specifies the quantitative and qualitative factors employed to assess the alternatives vis-à-vis each sub-criterion. Furthermore, an extended analysis of the data presented in Table 4 can be found in the Supplementary Materials.
Table 4.
Measurement factors for evaluation of alternatives with respect to sub-criteria.
4.2. Results and Discussion
An FAHP model was applied to assessing the CSP alternatives relative to the primary goal, criteria, and sub-criteria. The findings were derived from quantitative and qualitative data extracted from the literature, simulation results, industrial reports, and international databases, as well as stakeholders’ feedback and opinions.
Figure 6 provides a graphical representation of the local assessment of all of the sub-criteria of the parent nodes, as indicated by the sub-criteria codes given in Figure 3. For the technical node, their responses revealed that the stakeholders deemed reliability to be the greatest priority, followed closely by maturity and conversion efficiency. In emerging economies, the desire is for reliable mechanisms that can maintain and improve the grid’s stability in burgeoning national networks. Another reason why maturity and conversion efficiency were judged to have significant value is that investors require assurance that such costly expenditures will be safeguarded by adequate operational experience and highly efficient power generation. With respect to the economic sub-criteria, capital cost and energy cost were awarded the highest weighting priority, unsurprising ratings given that for all energy systems, the initial energy expenses are the primary factors in their implementation. Among the environmental sub-criteria, water consumption and emission reductions were identified as having the greatest priority. Water consumption is a recognized critical concern for operators of generation facilities, particularly since the majority of possible CSP sites tend to be arid with high DNI values and a notably limited water supply. The top priority within the social sub-criteria was considered to be job creation: the employment opportunities that could be anticipated for each alternative scenario.
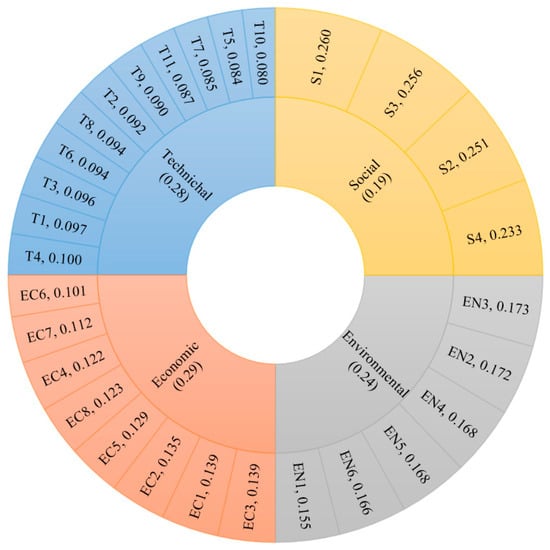
Figure 6.
Priority weights for criteria and sub-criteria.
The local priority weights for each alternative with regard to the technical sub-criteria are displayed in Figure 7. As can be seen, alternative 1 received the highest priority rating at 0.24, followed by alternative 5 at 0.19. Alternative 1 fared particularly well with respect to maturity because a PT with no storage is the most mature technology. This alternative also outperformed the others in terms of deployment time, safety, and hybridization capability. The next highest weights were earned by alternatives 4 and 5, with both being credited with a high-performing optical and conversion efficiency linked to their large concentrations of solar tower (ST) systems and consequently their high operating temperatures. Those systems are also strengthened by their long-lasting thermal energy storage (TES). Alternatives 2, 3, and 6 received low overall scores for technical priority weighting, which could be attributed to their low degrees of maturity, optical efficiency, and conversion efficiency. Regarding maturity, as indicated in Table 4, even though PTs are the most mature collection technology, they are less mature when molten salt is integrated for TES. However, this kind of arrangement still has potential, as evidenced by several facilities in operation, primarily in Spain, along with others being constructed that will have up to 9 h of storage. Other examples in the development stage are expected to provide up to 16 h of storage.
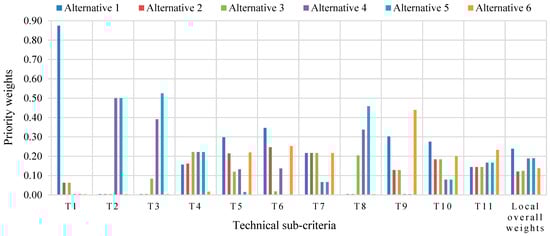
Figure 7.
Local priority weighting for each alternative with respect to the technical decision criterion.
Figure 8 indicates the local priority weighting of the sub-criteria in the economic category for each alternative. Despite being subject to the greatest capital and O&M costs, alternative 5 clearly surpassed the others. Its priority weight of 0.24 is testimony to its outstanding performance, which, either singly or along with other alternatives, garnered it the highest priority weights in relation to multiple factors. Alternative 5 offers advantages associated with the low energy costs arising from the high system operating temperatures of STs and long-running TES, which result in substantial capacity factors. For these reasons, and since the high levels of cost-effective energy production that it provides compensate for its considerable initial expense, alternative 5 offers significant economic feasibility. With respect to the other choices, both alternatives 3 and 5 represent serious contributions to the national economy because of the anticipated significant increases in local industrialization and job opportunities such massive investments engender. However, an additional but crucial consideration is that in some countries, the implementation of alternatives 3 and 5 is hindered by the difficulty of attracting the requisite financing. In such cases, alternatives 1 and 6, which rely on PTs and LF technology, could be acceptable substitutes that come with economic compromises: the diminished practicality of both alternatives and the inferior market maturity in the case of LF technology. Overall, alternative 2 was given the lowest priority weight in the economic domain because of its inferior performance with respect to a number of characteristics: the steep capital and energy costs stemming from a low capacity factor per initial cost. Alternatives 3, 4, and 6 received similar overall weights, with varied degrees of efficacy at the individual sub-criteria level. Consequently, slight changes in the assessments could create marked discrepancies in the overall economic weights.
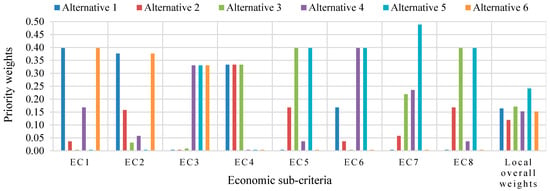
Figure 8.
Local priority weighting for each alternative with respect to the economic decision criterion.
Figure 9 reveals the local priority weights given to the alternatives for the environmental sub-criteria. As is evident from the figure, alternative 6 earned a top-ranking value of 0.34 and exhibited unequalled features in regard to ecosystem disruption and the impact on environmental conditions. This outcome is attributable to the fact that this method uses direct steam generation (DSG) rather than synthetic oil and molten salt, employs linear flat mirrors positioned near the ground, and circumvents the need for tracking systems. Alternative 6 also demonstrated standout levels for the life cycle assessment (LCA) sub-criterion because relative to comparable non-storage PT plants for high DNI levels, it featured a low degree of material demand and a respectable amount of annual energy production per net capacity. Alternatives 3 and 5, at 0.07 and 0.08, respectively, received the lowest priority weighting. The less than satisfactory required area and emission reduction values for both alternatives were the result of their substantial installed capacities. Alternative 5 was also given the lowest score for water consumption owing to its requirements for an extensive solar field and inherently separated heliostats.
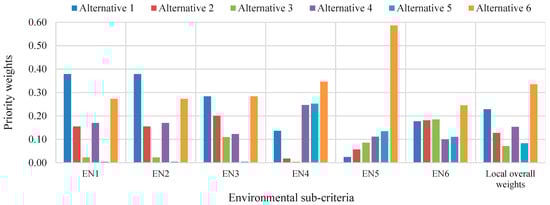
Figure 9.
Local priority weighting for alternatives with respect to the environmental decision criterion.
Figure 10 depicts the local priority weighting of the social sub-criteria for each alternative. The priority weight of 0.28 awarded to alternative 5 is patently superior to those given to the other alternatives. The preference for alternative 5 is a consequence of its top rating for local industrialization possibilities, along with its respectable score for job creation, the social priority that stakeholders ranked as most significant. With priority weights of 0.18 and 0.17, respectively, alternatives 3 and 4 were placed third and fourth. As the two biggest projects, alternatives 3 and 5 were strong contenders because of their considerable associated opportunities for job creation. The robust support for local industrialization engendered by alternative 4 netted it a priority weight second only to that of the larger ST system offered by alternative 5. Both were characterized by extensive material demands that could be partially met by local manufacturers. Alternative 1 was the recipient of the lowest overall social priority weight: 0.10. Its poor result was a combined outcome of its inadequate performance in all of the social sub-criteria. The only exception was logistical feasibility, for which it fared well because of the excellent maturity of PTs with no storage. However, since the stakeholders considered logistical feasibility to be the least important parameter, this sub-criterion consequently had very little influence on the overall weight.
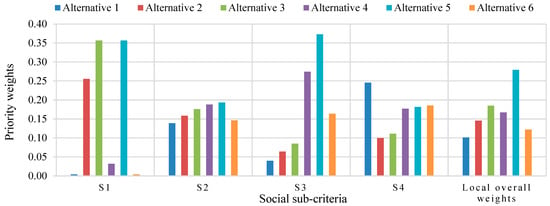
Figure 10.
Local priority weighting for each alternative with respect to the social decision criterion.
The goal of developing this analysis was to provide recommendations for the adoption of CSP projects in the context of the local requirements and objectives. Figure 11 displays the main criteria derived from the stakeholder input obtained for this research. The highest priority was assigned to the economic criterion, followed closely by the technical criterion. This outcome aligns with the essential necessity of techno-economic dimensions as the primary impetus for sustainable development. Environmental and social criteria were placed third and fourth, respectively. In many emerging economies, the government owns the national power companies and initializes large energy plant projects, which means that the scope of such projects goes beyond purely financial determinants. Figure 7, Figure 8, Figure 9 and Figure 10 indicate the local overall weights that signify the priority weights of each alternative with regard to each parent criterion. These weights were calculated based on the assessment of the alternatives relative to the associated sub-criteria, plus an evaluation of the sub-criteria in relation to the parent nodes. In Figure 11, the overall global weights indicate the priority weights calculated with respect to the goal of ranking the CSP alternatives to meet the stakeholders’ requirements based on their evaluation of the main criteria, as displayed in the FAHP matrix provided in the figure.
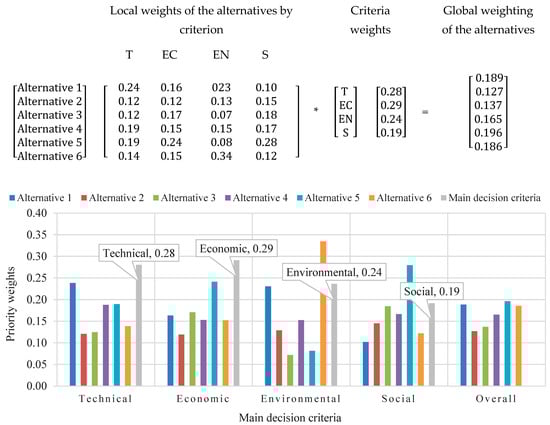
Figure 11.
Global priority weights of alternatives with respect to the goal.
Figure 11 reveals that alternative 5 received the top overall global priority weight, with alternatives 1 and 6 only slightly behind. These leaders involved conceptually varied technologies and configurations, thus demonstrating that concentrating on the primary objectives and barriers can expedite decision-making. The aim of this study was not to identify a particular alternative as the optimal choice in every respect but instead to assist those responsible in prioritizing alternative courses of action depending on the relative benefits and drawbacks of each choice as measured against stakeholder and energy sector needs. In the particular case examined for this study, the superlative results for alternative 5 with respect to a number of parameters justified its highest overall global priority weighting. In regard to technical considerations, alternative 5 provided the best capacity factor, reliability, and storage hours, which made it the most suitable choice for ST systems because of the superior optical efficiency that translates into high operating temperatures. The fact that alternatives 4 and 5 involved comparable technologies but with diverse installed capacity and storage hour configurations indicates that bigger plants and extended TES can meet stakeholders’ needs. Alternative 6 entailed the use of LF technology as a promising technology, which features less material demand but exhibits fewer advantages in the technical category as a whole. From an economic perspective, alternative 5 was stronger because of its low energy cost based on the LCOE as the measurement indicator and because of the national economic benefit, which nonetheless came at the expense of significant capital and O&M costs, plus a low degree of market maturity. Likewise, alternative 6 featured a low energy cost in the LCOE while at the same time offering the benefit of lower capital and O&M costs. Environmentally, alternative 6 was found to have a definite edge over the other options, whereas alternative 5 placed next to last. Alternative 1, featuring a PT with no storage, received higher weights for most of the main criteria than did alternatives 2 and 3, which also employed PTs but with TES and greater capacities. Alternative 3 received high marks, especially because of its significant reliability since it offered 6 h of storage and mature PT technology. Also, because it involved a supersized project, alternative 3 was characterized by substantial economic feasibility, job creation, and national economic benefits. These assets meant that alternative 3 outperformed alternative 2 but nonetheless occupied only second last place after the calculation of the global weights for all alternatives. As additional PTs become operational with longer-lived TES than ST plants (i.e., more than 9 h), the balance of advantages could shift to improve the overall performance of PTs. It will therefore be imperative to note whether the stakeholders for a specific geographic area favor the factors that characterize alternative 3. Alternative 2, on the other hand, cannot be judged as preferable to either alternative 1 or alternative 3 since these options provide two PT configurations that can meet the needs set out in the defined objectives better.
5. Conclusions and Implications
Burgeoning recognition of the crucial necessity of RES implementations is mirrored in the constantly expanding capacities of these types of technology. Of these, CSP offers major possibilities for widespread deployment in a number of developing economies, with potential for integration into their national electrical generation grids. However, CSP is still too early in the development stage for large-scale power plant implementation. Additional restrictive factors only exacerbate the already inherently complicated planning procedures for RES plant operation: the disparate configurations of CSP plants and supporting technologies and the inadequate data and expertise available in some emerging countries.
The goal of the research presented here was to provide a basis for assessing practical alternative scenarios for the possible early integration of CSP plants in appropriate developing regions. This work entailed the creation of an MCDM model in a fuzzy environment as a means of analyzing the quantitative and qualitative parameters that featured in the evaluation. The decision was to employ a four-level processing hierarchy: the first level expressed the goal of prioritizing CSP alternatives, the second comprised 4 primary criteria for the evaluation, the third included 29 sub-criteria extracted from the main trajectories, and the fourth encompassed six alternatives that characterized a range of possible CSP plant configurations. A questionnaire was administered to elicit the evaluations of 44 diverse stakeholder participants from South Africa, India, and the MENA region. Their responses were used to assess the main criteria with respect to the goal, as well as to evaluate the sub-criteria relative to the parent criteria. The appraisal of the alternatives according to each sub-criterion was achieved based on a comprehensive examination of the literature, industrial reports, international databases, and results from prior simulations. The developed model successfully processed the uncertainty and ambiguity that accrue from human judgment and also proficiently analyzed both the quantitative and qualitative data in order to promote effective decisions.
Six previously defined alternative scenarios were examined: three PT plants using synthetic oil, two of which employed molten salts for three and six hours of storage; two ST plants with 10 and 12 storage hours provided by molten salt as the heat transfer fluid (HTF); and one LF plant with DSG and no TES. The primary assessment criteria were technical, economic, environmental, and social factors. The aggregated stakeholder rankings gave the greatest overall priority to economic and technical elements, with just small variations between the two categories. With respect to the priority weighting of the sub-criteria under each parent criterion, the following components were assigned the top priorities: reliability, maturity, and conversion efficiency (technical); energy cost and capital cost (economic); water consumption and emission reductions (environmental); and job creation and local industrialization possibilities (social).
Based on the combined priority stakeholder ranking, alternative 5 (200 MW, a ST with 12 h of TES) exhibited impressive overall results, with exemplary individual outcomes in a number of contributing considerations: reliability, conversion efficiency, energy cost, job creation, and local industrialization. On the other hand, its advantages might be offset by its possible limitations: the requirement for the most formidable capital investment among the options and a maturity rating that ranked below that of the PT choices. In regard to the three PT alternatives, alternative 2, featuring a midrange installed capacity and TES level, failed to surpass the other two PT alternatives in any of the evaluation factors. This outcome confirms that subject to the specific needs and priorities of a particular energy sector and its stakeholders, PT solutions tend to be regarded as peripheral because of their lengthier or non-existent TES and greater capacity. From an overall perspective, alternatives 1 and 6, which provide no storage, were awarded second and third priority, with only marginal discrepancies between them. Compared to the other options, alternative 1 (a PT with synthetic oil as the HTF) offered exceptional maturity, a modest level of water consumption, and lower amounts of GHG emissions. The benefits of alternative 6 (LF technology with DSG) included the lowest energy cost and respectable rankings for all of the environmental sub-criteria. An added advantage of both alternatives is their low associated capital costs. In summary, the overarching verdict is that constant, careful consideration is of the utmost importance when alternatives are under review so that all of the benefits and drawbacks can be taken into account and balanced against the specific requirements and barriers in each case.
The proposed methodology was developed with the goal of assisting decision-makers in honing in on the most preferable options to meet their requirements during the initial phases of CSP integration. The new framework will help stakeholders in their efforts to comprehend and evaluate the advantages and disadvantages associated with each course of action relative to the local energy sector needs, weather conditions, stakeholder objectives, and obstacles to CSP integration. The model was focused on an assessment of CSP alternatives suitable for the conditions in developing economies. However, it is also appropriate for evaluating a variety of technologies in diverse regions if the decisions involve issues characterized by comparable parameters featuring uncertainty, numerous and varied criteria, and input from diverse stakeholders. Enhancements to this research could include broadening the analysis to encompass an assessment of alternatives hybridizing conventional and renewable power, as well as exploration of the possibilities for enabling local grid integration. The effects of local differences, such as interest rates, lifetime expectations, and geopolitical factors, could also be topics for additional examination. A wider range of future research could encompass complex adaptive systems and complexity theory: these studies could be directed at the behavioral dynamics and interactions among varied system elements.
Supplementary Materials
The supporting information can be downloaded at: https://www.mdpi.com/article/10.3390/en18081957/s1, A comprehensive file illustrating detailed calculations and data on the pairwise comparisons conducted at the lower levels of the FAHP hierarchy is prepared. It includes the derivation of priority weights for all alternatives with respect to each sub-criterion, providing a more in-depth understanding of the FAHP framework applied in this study. References [38,39,40,41,42,43,44,45,46,47,48,49,50,51,52,53,54,55,56,57,58,59,60,61,62,63,64,65,66,67,68,69] are cited in the Supplementary Materials.
Author Contributions
Conceptualization, A.A., K.A.-H. and D.K.; Methodology, A.A. and D.K.; Software, A.A.; Validation, A.A. and A.S.; Formal analysis, A.A. and K.A.-H.; Investigation, A.A. and D.K.; Resources, A.A., K.A.-H. and A.S.; Data curation, A.A.; Writing—original draft, A.A.; Writing—review & editing, A.A., K.A.-H., D.K. and A.S.; Visualization, A.A.; Supervision, K.A.-H., D.K. and A.S.; Project administration, K.A.-H. All authors have read and agreed to the published version of the manuscript.
Funding
This research received no external funding.
Data Availability Statement
The original contributions presented in this study are included in the article/Supplementary Materials. Further inquiries can be directed to the corresponding author.
Acknowledgments
The authors gratefully acknowledge the invaluable contribution of the stakeholders who shared their knowledge through the questionnaire. In addition, the support of the Islamic University of Madinah in Saudi Arabia is thankfully acknowledged.
Conflicts of Interest
The authors declare no conflict of interest.
Nomenclature
| Abbreviation | Meanning |
| ADP | Analytic Deliberative Process |
| AHP | Analytic Hierarchy Process |
| CRITIC | Criteria Importance through Intercriteria Correlation |
| CSP | Concentrated Solar Power |
| DNI | Direct Normal Irradiance |
| FAHP | Fuzzy Analytic Hierarchy Process |
| GHI | Global Horizontal Irradiance |
| IEA | International Energy Agency |
| LCA | Life Cycle Assessment |
| LCOE | Levelized Cost of Energy |
| LCOH | Levelized Cost of Heat |
| LF | Linear Fresnel |
| MCDM | Multi-Criteria Decision-Making |
| MENA | Middle East and North Africa |
| PD | Parabolic Dish |
| PROMETHEE | Preference Ranking Organization Method for Enrichment Evaluations |
| PT | Parabolic Trough |
| PV | Photovoltaic |
| QFD | Quality Function Deployment |
| R&D | Research and Development |
| RES | Renewable Energy Source |
| RNA | Rank Number of Alternatives |
| DSG | Direct Steam Generation |
| ST | Solar Tower |
| TES | Thermal Energy Storage |
| TFN | Triangular Fuzzy Number |
| TOPSIS | Technique for Order of Preference by Similarity to Ideal Solution |
| VIKOR | Multi-Criteria Optimization and Compromise Solution |
References
- IRENA Data & Statistics. International Renewable Energy Agency. 2024. Available online: https://public.tableau.com/app/profile/irena.resource/viz/IRENARETimeSeries/ExploreDashboard (accessed on 20 February 2025).
- Cédric, P.; Frankl, P.; Tam, C.; Abdelilah, Y.; Bahar, H.; Mueller, S.; Waldron, M. Technology Roadmap: Solar Thermal Electricity; International Energy Agency: Paris, France, 2014. [Google Scholar]
- SolarGIS. World Bank Group. 2025. Available online: https://solargis.com/resources/free-maps-and-gis-data (accessed on 13 February 2025).
- Bosetti, V.; Catenacci, M.; Fiorese, G.; Verdolini, E. The future prospect of PV and CSP solar technologies: An expert elicitation survey. Energy Policy 2012, 49, 308–317. [Google Scholar] [CrossRef]
- Bale, C.S.; Varga, L.; Foxon, T.J. Energy and complexity: New ways forward. Appl. Energy 2015, 138, 150–159. [Google Scholar] [CrossRef]
- Kulichenko, N.; Wirth, J. Concentrating Solar Power in Developing Countries: Regulatory and Financial Incentives for Scaling Up; World Bank Publications: Washington, DC, USA, 2012. [Google Scholar]
- Ahmad, S.; Tahar, R.M. Selection of renewable energy sources for sustainable development of electricity generation system using analytic hierarchy process: A case of Malaysia. Renew. Energy 2014, 63, 458–466. [Google Scholar] [CrossRef]
- Roni, M.M.; Hoque, I.U.; Ahmed, T. Comparative study of levelized cost of electricity (LCOE) for concentrating solar power (CSP) and photovoltaic (PV) plant in the southeastern region of Bangladesh. In Proceedings of the International Conference on Electrical, Computer and Communication Engineering (ECCE), Cox’s Bazar, Bangladesh, 7–9 February 2019. [Google Scholar]
- Khan, M.I.; Gutiérrez-Alvarez, R.; Asfand, F.; Bicer, Y.; Sgouridis, S.; Al-Ghamdi, S.G.; Kurniawan, T.A.; Abid, M.; Pesyridis, A.; Farooq, M. The economics of concentrating solar power (CSP): Assessing cost competitiveness and deployment potential. Renew. Sustain. Energy Rev. 2024, 200, 114551. [Google Scholar] [CrossRef]
- Alaqel, S.; Djajadiwinata, E.; Saeed, R.S.; Saleh, N.S.; Al-Ansary, H.; El-Leathy, A.; Danish, S.; Shafiq, T.; Golob, M.; Nguyen, C.; et al. Performance of the world’s first integrated gas turbine–solar particle heating and energy storage system. Appl. Therm. Eng. 2022, 215, 119049. [Google Scholar] [CrossRef]
- Kennedy, K.M.; Ruggles, T.H.; Rinaldi, K.; Dowling, J.A.; Duan, L.; Caldeira, K.; Lewis, S.A. The role of concentrated solar power with thermal energy storage in least-cost highly reliable electricity systems fully powered by variable renewable energy. Adv. Appl. Energy 2022, 6, 100091. [Google Scholar] [CrossRef]
- Rodat, S.; Thonig, R. Status of Concentrated Solar Power Plants Installed Worldwide: Past and Present Data. Clean Technol. 2024, 6, 365–378. [Google Scholar] [CrossRef]
- Orangzeb, S.; Qaisrani, M.A.; Shafiq, B.; Ahmed, N.; Sahar, M.S.U.; Ullah, S.; Farooq, M.U.; Jiabin, F. Potential Assessment and Economic Analysis of Concentrated Solar Power against Solar Photovoltaic Technology. Int. J. Energy Res. 2023, 1, 3611318. [Google Scholar] [CrossRef]
- Nixon, J.D.; Dey, P.K.; Davies, P.A. Which is the best solar thermal collection technology for electricity generation in north-west India? Evaluation of options using the analytical hierarchy process. Energy 2010, 35, 5230–5240. [Google Scholar] [CrossRef]
- Pratik, R.; Sasadhar, B. A comparative evaluation model for assessing solar energy capacity development of multiple geographical alternatives. In Proceedings of the IEEE International Conference on Industrial Engineering and Engineering Management (IEEM), Kuala Lumpur, Malaysia, 7–10 December 2022. [Google Scholar]
- Ingenhoven, P.; Lee, L.; Saw, W.; Rafique, M.M.; Potter, D.; Nathan, G.J. Techno-economic assessment from a transient simulation of a concentrated solar thermal plant to deliver high-temperature industrial process heat. Renew. Sustain. Energy Rev. 2023, 185, 113626. [Google Scholar] [CrossRef]
- Aragonés-Beltrán, P.; Chaparro-González, F.; Pastor-Ferrando, J.-P.; Pla-Rubio, A. An AHP (Analytic Hierarchy Pro-cess)/ANP (Analytic Network Process)-based multi-criteria decision approach for the selection of solar-thermal power plant investment projects. Energy 2014, 66, 222–238. [Google Scholar] [CrossRef]
- Cavallaro, F. Multi-criteria decision aid to assess concentrated solar thermal technologies. Renew. Energy 2009, 34, 1678–1685. [Google Scholar] [CrossRef]
- Pitz-Paal, R.; Dersch, J.; Milow, B. European Concentrated Solar Thermal Road-Mapping (ECOSTAR); Coordinated action sustainable energy systems SES6-CT-2003-502578; European Commission: Cologne, Germany, 2005. [Google Scholar] [CrossRef]
- Peterseim, J.H.; White, S.; Tadros, A.; Hellwig, U. Concentrated solar power hybrid plants, which technologies are best suited for hybridisation? Renew. Energy 2013, 57, 520–532. [Google Scholar] [CrossRef]
- Nixon, J.D.; Dey, P.K.; Davies, P.A. Design of a novel solar thermal collector using a multi-criteria decision-making methodology. J. Clean. Prod. 2013, 59, 150–159. [Google Scholar] [CrossRef]
- Abouhawwash, M.; Jameel, M. Evaluation Factors of Solar Power Plants to Reduce Cost Under Neutrosophic Multi-Criteria Decision Making Model. Sustain. Mach. Intell. J. 2023, 2, 1–11. [Google Scholar] [CrossRef]
- Kassem, A.; Al-Haddad, K.; Komljenovic, D.; Schiffauerova, A. A value tree for identification of evaluation criteria for solar thermal power technologies in developing countries. Sustain. Energy Technol. Assess. 2016, 16, 18–32. [Google Scholar] [CrossRef]
- Bozbura, F.T.; Beskese, A.; Kahraman, C. Prioritization of human capital measurement indicators using fuzzy AHP. Expert Syst. Appl. 2007, 32, 1100–1112. [Google Scholar] [CrossRef]
- Chan, F.T.; Kumar, N. Global supplier development considering risk factors using fuzzy extended AHP-based approach. Omega 2007, 35, 417–431. [Google Scholar] [CrossRef]
- Demirel, T.; Demirel, N.Ç.; Kahraman, C. Fuzzy analytic hierarchy process and its application. In Fuzzy Multi-Criteria Decision Making: Theory and Applications with Recent Developments; Springer: Berlin/Heidelberg, Germany, 2008; pp. 53–83. [Google Scholar]
- Chang, D.-Y. Applications of the extent analysis method on fuzzy AHP. Eur. J. Oper. Res. 1996, 95, 649–655. [Google Scholar] [CrossRef]
- Zhu, K.-J.; Jing, Y.; Chang, D.-Y. A discussion on extent analysis method and applications of fuzzy AHP. Eur. J. Oper. Res. 1999, 116, 450–456. [Google Scholar] [CrossRef]
- Laarhoven, P.V.; Pedrycz, W. A fuzzy extension of Saaty’s priority theory. Fuzzy Sets Syst. 1983, 11, 229–241. [Google Scholar] [CrossRef]
- Buckley, J.J. Fuzzy hierarchical analysis. Fuzzy Sets Syst. 1985, 17, 233–247. [Google Scholar] [CrossRef]
- Kassem, A.; Al-Haddad, K.; Komljenovic, D. Concentrated solar thermal power in Saudi Arabia: Definition and simulation of alternative scenarios. Renew. Sustain. Energy Rev. 2017, 80, 75–91. [Google Scholar] [CrossRef]
- Tang, Y.-C.; Beynon, M.J. Application and development of a fuzzy analytic hierarchy process within a capital investment study. J. Econ. Manag. 2005, 1, 207–230. [Google Scholar]
- Zheng, G.; Jing, H.H.Y.; Shi, G.; Zhang, X. Developing a fuzzy analytic hierarchical process model for building energy conservation assessment. Renew. Energy 2010, 35, 78–87. [Google Scholar] [CrossRef]
- Komljenovic, D.; Kecojevic, V. Multi-attribute selection method for materials handling equipment. Int. J. Ind. Syst. Eng. 2009, 4, 151–173. [Google Scholar] [CrossRef]
- Celik, M.; Er, I.D.; Ozok, A.F. Application of fuzzy extended AHP methodology on shipping registry selection: The case of Turkish maritime industry. Expert Syst. Appl. 2009, 36, 190–198. [Google Scholar] [CrossRef]
- Saaty, T.L. How to Make a Decision: The Analytic Hierarchy Process. Eur. J. Oper. Res. 1990, 48, 9–26. [Google Scholar] [CrossRef]
- Saaty, T.; Vargas, L.G. Models, Methods, Concepts & Applications of the Analytic Hierarchy Process; Springer Science & Business Media: Berlin, Germany, 2012; Volume 175. [Google Scholar]
- NREL. Concentrating Solar Power Projects. Available online: http://www.nrel.gov/csp/solarpaces/ (accessed on 1 March 2016).
- World Bank. Middle East and North Africa Region Assessment of the Local Manufacturing Potential for Concentrated Solar Power (CSP) Projects; The World Bank and ESMAP: Washington, DC, USA, 2011. [Google Scholar]
- Lemmer, V. Comparative Market Analysis and Economic Simulation for Morocco of the Parabolic Trough and Dish CSP Technologies. Master Thesis, University of Lisboa, Lisboa, Portugal, 2014. [Google Scholar]
- IRENA. Renewable Energy Technologies: Cost Analysis Series—Concentrated Solar Power; International Renewable Energy Agency (IRENA): Abu Dhabi, United Arab Emirates, 2012. [Google Scholar]
- Forrester, J. The value of CSP with thermal energy storage in providing grid stability. Energy Procedia 2013, 49, 1632–1641. [Google Scholar] [CrossRef]
- Mills, D.A.; Wiser, R. An Evaluation of Solar Valuation Methods Used in Utility Planning and Procurement Processes; Ernest Orlando Lawrence Berkeley National Laboratory: Berkeley, CA, USA, 2012. [Google Scholar]
- Denholm, P.; Hummon, M. Simulating the Value of Concentrating Solar Power with Thermal Energy Storage in a Production Cost Model; National Renewable Energy Laboratory (NREL): Golden, CO, USA, 2012. [Google Scholar]
- IRENA. Concentrating Solar Power: Technology Brief; International Renewable Energy Agency (IRENA): Abu Dhabi, United Arab Emirates, 2013. [Google Scholar]
- Lovegrove, K.; Watt, M.; Passey, R.; Pollock, G.; Wyder, J.; Dowse, J. Realising the Potential of Concentrating Solar Power in Australia: Summary for Stakeholders; Australian Solar Institute Pty, Limited: Newcastle, NSW, Australia, 2012. [Google Scholar]
- Burgherr, P.; Hirschberg, S.; Spada, M. Comparative assessment of accident risks in the energy sector. In Handbook of Risk Management in Energy Production and Trading; International Series in Operations Research & Management Science; Springer: Boston, MA, USA, 2013. [Google Scholar] [CrossRef]
- Tyner, C.; Wasyluk, D. eSolar’s Modular, Scalable Molten Salt Power Tower Reference Plant Design. Energy Procedia 2014, 49, 1563–1572. [Google Scholar] [CrossRef][Green Version]
- Peterseim, J.H.; White, S.; Tadros, A.; Hellwig, U. Concentrating solar power hybrid plants—Enabling cost effective synergies. Renew. Energy 2014, 67, 178–185. [Google Scholar] [CrossRef]
- Konstantin, P.; Kretschmann, J. Assessment of Technology Options for Development of Concentrating Solar Power in South Africa for the World Bank. Presentation Slideshow of Fichtner. In Proceedings of the ESMAP 2010, Johannesburg, South Africa, 9–10 December 2010. [Google Scholar]
- Cekirge, H.M.; Elhassan, A. A Comparison of Solar Power Systems (CSP): Solar Tower (ST) Systems versus Parabolic Trough (PT) Systems. Am. J. Energy Eng. 2015, 3, 29–36. [Google Scholar] [CrossRef]
- Zhu, G.; Wendelin, T.; Wagner, M.J.; Kutscher, C. History, current state, and future of linear Fresnel concentrating solar collectors. Sol. Energy 2014, 103, 639–652. [Google Scholar] [CrossRef]
- NREL. System Advisor Model Help; National Renewable Energy Laboratory (NREL): Golden, CO, USA, 2015. [Google Scholar]
- Padmanathan, P. Renewable Energy: A Compelling Value Proposition. In Proceedings of the Saudi Arabia Smart Grid Conference, Jeddah, Saudi Arabia, 6–8 December 2016. [Google Scholar]
- Agboola, O.P. The Potentials of Concentrating Solar Thermal Power (CSTP) in Meeting Saudi Future Energy Gap. In Proceedings of the World Congress on Engineering, London, UK, 5–7 July 2015; pp. 1111–1115. [Google Scholar]
- Ong, S.; Campbell, C.; Denholm, P.; Margolis, R.; Heath, G. Land-Use Requirements for Solar Power Plants in the United States; National Renewable Energy Laboratory (NREL): Golden, CO, USA, 2013. [Google Scholar]
- Fabrizi, F. CSP Technologies Environmental Impact; Energy Sector Management Assistance Program (ESMAP): Washington, DC, USA, 2012. [Google Scholar]
- Hernandez, R.R.; Easter, S.B.; Murphy-Mariscal, M.L.; Maestre, F.T.; Tavassoli, M.; Allen, E.B.; Barrows, C.W.; Belnap, J.; Ochoa-Hueso, R.; Ravi, S.; et al. Environmental impacts of utility-scale solar energy. Renew. Sustain. Energy Rev. 2014, 29, 766–779. [Google Scholar] [CrossRef]
- Burkhardt, J.J.; Heath, G.A.; Turchi, C.S. Life cycle assessment of a parabolic trough concentrating solar power plant and the impacts of key design alternatives. Environ. Sci. Technol. 2011, 45, 2457–2464. [Google Scholar] [CrossRef]
- Hang, Y.; Balkoski, K.; Meduri, P. Life Cycle Analysis of Linear Fresnel Solar Power Technology. In Proceedings of the ASME 2013 Power Conference, Boston, MA, USA, 29 July–1 August 2013; pp. 1–9. [Google Scholar]
- Lecho, Y.; de la Ru, C.; Sa, R. Life Cycle Environmental Impacts of Electricity Production by Solarthermal Power Plants in Spain. J. Sol. Energy Eng. 2008, 130, 021012. [Google Scholar] [CrossRef]
- Energy Analysis-Life Cycle Assessment Harmonization Results and Findings. Available online: https://www.nrel.gov/analysis/life-cycle-assessment.html (accessed on 9 February 2024).
- Burkhardt, J.J.; Heath, G.; Cohen, E. Life Cycle Greenhouse Gas Emissions of Trough and Tower Concentrating Solar Power Electricity Generation: Systematic Review and Harmonization. J. Ind. Ecol. 2012, 16, S93–S109. [Google Scholar] [CrossRef]
- Wagner, M.; Zhu, G. A direct-steam linear Fresnel performance model for NREL’s system advisor model. In Proceedings of the ASME 2012 6th International Conference on Energy Sustainability & 10th International Conference on Fuel Cell Science, Engineering and Technology, San Diego, CA, USA, 23–26 July 2012; American Society of Mechanical Engineers: New York, NY, USA, 2012. [Google Scholar]
- Weinrebe, G.; Bohnke, M.; Trieb, F. Life cycle assessment of an 80 MW SEGS plant and a 30 MW Phoebus power tower. In Proceedings of the International Solar Engineering Conference “Solar Engineering 1998”, Albuquerque, NM, USA, 14–17 June 1998; pp. 417–424. [Google Scholar]
- CSP Prospects in Saudi Arabia 2014: A comparison of concentrated solar power and photovoltaics in the most promising solar market in the world. In Proceedings of the MENASOL, Dubau, United Arab Emirates, 6–7 May 2014.
- Lancereau, Q.; Rabut, Q.; Itskhokine, D.; Benmarraze, M. Wind Loads on Linear Fresnel Reflectors’ Technology: A Numerical Study. Energy Procedia 2015, 69, 116–125. [Google Scholar] [CrossRef]
- Wagner, M.J. Simulation and Predictive Performance Modeling of Utility-Scale Central Receiver System Power Plants. Master Thesis, University of Wisconsin, Madison, WI, USA, 12 December 2008. [Google Scholar]
- Perez, I.; Lopez, A.; Briceño, S.; Relancio, J. National Incentive Programs for CSP—Lessons Learned. Energy Procedia 2014, 49, 1869–1878. [Google Scholar] [CrossRef][Green Version]


Disclaimer/Publisher’s Note: The statements, opinions and data contained in all publications are solely those of the individual author(s) and contributor(s) and not of MDPI and/or the editor(s). MDPI and/or the editor(s) disclaim responsibility for any injury to people or property resulting from any ideas, methods, instructions or products referred to in the content. |
© 2025 by the authors. Licensee MDPI, Basel, Switzerland. This article is an open access article distributed under the terms and conditions of the Creative Commons Attribution (CC BY) license (https://creativecommons.org/licenses/by/4.0/).