Article

Industrial Electricity Pricing and Renewable Energy: A Temporal Analysis of the Effect of Taxes

by
Gbeminiyi John Oyewole
1,* and
George Alex Thopil
2
1
School of Mechanical, Industrial and Aeronautical Engineering, University of Witwatersrand, Johannesburg 2017, South Africa
2
Department of Engineering and Technology Management, University of Pretoria, Pretoria 0002, South Africa
*
Author to whom correspondence should be addressed.
Energies 2025, 18(8), 2026; https://doi.org/10.3390/en18082026
Submission received: 18 February 2025 / Revised: 27 March 2025 / Accepted: 4 April 2025 / Published: 15 April 2025
(This article belongs to the Section C: Energy Economics and Policy)

Abstract

:
This study investigates the industrial electricity pricing (IEP) profiles of 22 OECD countries to understand the effect of renewable energy and taxes on overall prices. Clustering analysis was performed on pricing data from the year 2000 to 2018 to observe how prices evolved. Ordinal logit regression analysis was performed to determine possible associations between the clustered groups and the percentage share of renewables generated (REG), specifically linked to wind, solar photovoltaics and solar thermal. Other independent variables indicating economic and market structures were also considered. Clustering results for both prices before and after tax indicated three pricing clusters, termed low, median, and high pricing clusters. IEP in Italy and Germany was found to have the highest effect owing to taxes, while IEP in countries such as the US, Norway, Canada, and Denmark was least affected by taxes. Regression results show positive associations between the clustered profiles and REG. The positive association between the non-taxed component of IEP and a unit increase in REG is 1.41 times, whereas the positive association of overall IEP price (including taxes) and a unit increase in REG is 56.26 times, which is 39.9 times higher. Our results show that REG penetration has had a minimal effect on IEP over the time under consideration, but rather that the taxation on IEP coincides with REG penetration, contributing to IEP increases.

1. Introduction

Renewable energy technology innovations have created major changes in how different societies are adapting and changing given the move towards net zero emissions [1]. Given that electricity availability is vital for most societies, investigating its prices and demand patterns over certain periods could provide more insights. The demand for electricity, both for household and industrial use, has increased over the years due to several factors, including automation, emerging technologies, and increased electrification [2,3]. To meet the growing demand and the need to preserve the environment [4,5,6], noted that countries have been exploring several green energy alternatives to add to their total energy mix. While it is not disputable that electricity demand has practically or consistently been in an upward trend over the years, electricity pricing has been debatably described as volatile, either having downward or upward trends over the years [7,8,9]. The uncertainty in the trend of electricity pricing has partly contributed to the prominence and increased research activity in the area of electricity pricing, as indicated by [10]. Countries will, therefore, find it desirable to understand and accurately predict their trends in electricity pricing.
As both developed and developing countries will be keen on ensuring electricity is available and affordable to their households, the affordability of electricity for industrial usage is likely to pose more of a concern due to its corresponding development and economic implications [11,12]. On the one hand, high industrial pricing of electricity in a country might mean that companies that largely depend on electricity for their operations might become uncompetitive with companies in neighboring countries with cheaper pricing, just as observed by [13]. Moreover, the possibility of passing on the increased cost to customers or seeking out alternative independent electricity generation plans at some costs are likely outcomes of increased pricing. On the other hand, low electricity pricing can ensure competitiveness for industries with significant dependence on electricity and also increase consumption, as discussed by [14,15]. There have also been some arguments towards the possible negative effects of low electricity pricing [9,16]. According to [14], low electricity pricing could further encourage environmental pollution by heavy industries and high-energy consumers. As noted by [17], end-user electricity price varies among different countries due to the contribution of different taxes levied (e.g., value-added tax, environmental tax, excise tax, etc.) and the structure of the market being either liberal or regulated [18]. According to [19], there is no solid consensus on the increasing or decreasing effect of renewables on electricity pricing. In addition, they noted studies that have attempted to investigate the impact of other factors such as national developmental indices, electricity demand, market reforms (e.g., deregulation), and other green energy initiatives on decreasing or increasing electricity pricing over time.
This research, while attempting to understand the adaptation of societies to renewable technology penetration, primarily studies the before-tax and after-tax components of IEP profiles. We systematically grouped 22 OECD countries over a period of nineteen years (2000–2018) for our study. The timespan for our analysis is deliberately chosen to account for a period without global electricity market shocks such as the pandemic and the conflict in Europe. We excluded the data for 2019 due to data gaps across the different datasets used in Section 3.1. Our secondary interests seek to determine the association of the share of renewable energy (wind, solar photovoltaics (PV), and solar thermal) with the pricing clusters (to generically study the association with countries), while also attempting to consider the effects of economic and market structures of the countries being examined. The unique contributions in our work are highlighted as follows: (i) Application of clustering analysis to investigate the IEP of a selected panel of countries and determine the ordinal number of clusters. (ii) The use of clustered industrial electricity prices to understand the contribution of taxes as the share of renewables increases. (iii) The application of a regression model to fit the regression variables with the ordinal IEP clusters and to observe the relationship of the variables with pricing clusters. Therefore, this study presents a novel clustering-dependent regression to analyze temporal IEP profiles. The study also takes into consideration variables related to the economic structure of a country, such as the gross domestic product per capita, and other market structures of the country, such as energy imports, greenhouse gas emissions, etc.
Our study contributes to the body of knowledge by providing a temporal analysis of nearly two decades of data and identifying that renewable technologies as such do not contribute to increased prices. Our methodology, which combines temporal clustering and regression-based clustering, is unique in establishing the relationship between IEP and the impact of taxes on IEP. Knowing the impact of taxes on IEP, along with economic and market factors, can help in the formulation of sustainable tax policies and can assist decision-makers and policymakers as countries transition towards decarbonization of their electric grids without overburdening electricity consumers and negatively impacting economic growth.
The structure of the following sections in this paper is presented below. A review of the related literature on IEP, including possible factors affecting its increase or decrease and the motivation for the use of the clustering technique as part of the methodology, is presented in Section 2. This is followed by Section 3, which provides the datasets and the analytical methods, i.e., clustering and the regression model used in the study. Section 4 presents the results from grouping the IEP profiles and the findings of the regression analysis. Section 5 subsequently discusses the clustering results and the associations of the selected factors on the price groupings. Conclusions, recommendations, and future directions regarding the study are presented in Section 6.

2. Literature Review

The IEP for the EU market was studied by [20]. Their findings suggest a 67% increase in IEP in 15 EU countries between 2003 and 2013. They, however, admitted a decrease in industrial electricity prices within the years 2013 and 2014 by 1% and suggested a longer period of observation to conclude on the trend. Ref. [10] investigated electricity pricing in Germany by analyzing spot market demand and supply data from 2014 to 2018. Their arguments were largely in favor of reducing spot-market electricity prices, although they acknowledged some earlier research indicating an increase in electricity prices for German households between 2000 and 2019. Ref. [7] investigated wholesale electricity pricing in Portugal, focusing on the balance between demand and supply. Similarly to [10], their findings not only show a decrease in the price of electricity, but also reveal an increase in its volatility. Ref. [9] examined the renewable energy policy paradox and its effect on electricity pricing in the Italian market, while Refs. [15,21] studied association between IEP in Spain and cost of energy from fuel. The findings of [21] indicated a positive association between IEP and the price of petroleum products. Alternative energy sources, such as renewables, were recommended to combat increasing electricity prices, which are impacted by the uncertain and mostly volatile prices of petroleum products. The period of study, as reported by [15], spanned from 2015 to 2019. Their research efforts focused on identifying the causes of industrial electricity pricing disparities in Spain and other EU member countries. Their findings revealed that the electricity prices in Spain were higher than in other neighboring EU countries. They suggested that the reason for this was the limited or nonexistent electrical interconnection between Spain and the rest of Europe.
Ref. [16] researched electricity pricing (industrial, commercial, wholesale, and retail) using the electricity deregulation experience of the United States (US) as a case study. Their findings revealed that neither lower nor higher electricity pricing should be a determinant in appraising the success of market reforms introduced. Ref. [14] supported this observation using China as a case study and noting that reducing IEP can possibly promote some growth, but not a desirable high-quality economic transformation. Their study suggests that an increase of about 1% in industrial electricity prices has a direct and indirect increase of 12.4% and 2% in industrial green productivity, respectively.
As Ref. [16] further indicated, electricity pricing is affected by many factors and the effects of these factors on pricing are often difficult to eliminate. Refs. [10,20] suggested the need for ongoing research activities in the area of determining the impact of renewables on electricity pricing. As indicated by [19,20], there appears to be a lack of consensus among authors on the impact of renewables on electricity pricing. Ref. [19] concluded that renewable energy supply would possibly increase the uncertainty level in electricity prices. Ref. [20] in their study of IEP for 15 EU countries between 2003 and 2013, observed a positive relationship between industrial electricity pricing and the share of renewable energy and gross domestic product per capita.
Various authors have continued to research renewable energy generation and its relationship to industrial electricity pricing and tax contributions based on their specific regions or countries. Ref. [22], in their econometric analysis of the Russian power industry from 1990 to 2021, discovered that economic growth, financial development, and CO2 emissions increase electricity use, while renewables lower it in the long run. [23] In their study of 27 EU countries, they found that countries with high energy demand are leading the shift to renewable energy, with Austria, Belgium, and Germany leading in renewable production. Using Australia as their case study, Ref. [24] observed that carbon tax had a significant impact on wholesale electricity prices and created energy substitution effects. Ref. [25], in their regression analysis of countries in the EU, including Norway, observed that high electricity taxes result in high electricity prices and further promote responsible production and consumption. Ref. [26], in their multivariate regression analysis study of Poland, found that effective carbon taxes and an increase in renewables are crucial policies for reducing emissions.
Ref. [27] studied the effect of electricity price increase/decrease on demand in India and its effect on reaching net-zero emissions when prices are lowered. Ref. [28] examined the optimal energy mix of industrial complexes in Korea and emphasized the critical role of regional electricity tariffs and carbon pricing in energy system feasibility. Ref. [29] studied 285 cities in China and noted that cities subscribing to critical peak industrial electricity pricing had a reduction in greenhouse gas emissions. Additionally, the critical peak industrial electricity pricing could encourage green transitions in China through green technological innovation and energy substitution. Ref. [30] studied selected Chinese industrial enterprises and observed that electricity price cross-subsidies, in which industrial enterprises are charged higher than residential buildings, affect the green factor’s total productivity by improving resource allocation and inhibiting technological advancement. Ref. [31], in their study of the Zhejiang region in China, explained that carbon taxes are less effective than carbon emissions control, and that stricter carbon pricing leads to a reduction in carbon intensity but slows GDP growth, as manufacturing and other industrial activities may decline. Table A1 in the Appendix A provides a summary description of some of the recent studies on industrial electricity pricing and renewable energy discourse.
Artificial intelligence techniques and algorithms for electricity pricing predictions and analysis have gained prominence among researchers [32]. For example, Ref. [33] developed a trust algorithm for electricity forecasting models, while Ref. [34] proposed a machine learning model for electricity price forecasting. Clustering, a form of unsupervised machine learning, has over the years seen increased use in electricity pricing studies. The use of clustering, as noted by [35,36,37,38], has been very effective in pattern recognition and analysis of both static and time-series data, such as electricity consumption, demand, or load profiles. Ref. [35] stressed the importance of the use of clustering in grouping load profiles, revealing outliers, and categorizing electricity consumers. Ref. [37] emphasized the effective use of clustering algorithms, such as k-means and its variants–k-medoids and fuzzy c-means, when analyzing time-series data. In their study, Ref. [39] found the k-means and k-medoids clustering algorithms to be effective in extracting information from raw energy data time series from buildings. Ref. [40] used the k-means clustering and point estimate methods to solve the probabilistic load flow (PLF) problem in distribution networks. Although the use of clustering techniques has largely been limited to grouping energy data, such as electricity load profiles, consumption, or demand, their vast potential in recognizing patterns in datasets, including electricity pricing data, remains largely unexplored. Therefore, our study primarily employs clustering to study IEP data.

3. Datasets and Methods

The datasets used for this study employ a panel dataset, similar to those used in [4,23], target twenty-two (22) countries primarily selected from the OECD group of countries. The data used for our study were specifically from the period between 2000 and 2018. We did not include data for the year 2019 because of data gaps across multiple datasets, and the period from 2020 onwards was not taken into account due to global energy price volatility because of the pandemic and the war in Europe.

3.1. Datasets

Annual time-series datasets obtained are categorized and further described below:
(1) Industrial electricity pricing excluding tax (IEPET) and industrial electricity pricing including tax (IEPIT). The method of computing these prices is further detailed in [41,42]. As indicated in [17,41], the industrial electricity prices possibly depend on the market structure and different tax structures of the respective countries. The tax components being considered are those that are levied on the consumption of electricity by the industrial sectors. These do not include taxes paid by industries, such as power plants, for generating electricity from various energy sources. All price units expressed [41] in pence/kWh were converted to the United States cents per kilowatt-hour (cents/kWh) using annual average exchange rates [43].
(2) Total electricity generated per year in terawatt hour, TEG (TWh), and renewable energy generated per year in terawatt hour, REG (TWh). We focused on the renewable sources of energy from wind, solar PV, and solar thermal to make up REG (TWh) for this study. These sources of renewable energy have been shown in the literature to have some impact on the trend of electricity pricing [7,10]. Moreover, there has been a rapid expansion and increased developmental and market interest in the use of these green energy sources in recent years. TEG (TWh) and REG (TWh) were needed to calculate the percentage of renewables in the total energy generated by the countries. The percentage (which we have termed REG) was calculated as the ratio of REG (TWh) to TEG (TWh). The data for TEG (TWh) and REG (TWh) for our study covered the period between 2000 and 2018 [44].
(3) Economic data on gross domestic product per capita in local currency, i.e., GDPpc [45]. GDP pc for the twenty-two countries was captured for further association studies with the electricity pricing data. Similarly to the energy sources data, the economic data for this study was available for the years from 2000 to 2018. As discussed by [46], GDPpc indicates the level of economic activity in a country.
(4) Greenhouse gas emissions by energy industries as a percentage of total emissions (EIE) [47]. The data obtained for the study was from the years 2000 to 2018. EIE captures the emissions of greenhouse gases such as carbon dioxide (CO2), nitrous oxide (N2O), chlorofluorocarbons (CFC), etc. An increase in the EIE reflects an increase in human activities using fossil fuels in manufacturing, energy generation, transportation, etc. For countries within the European Union (EU), data on EIE gives a measure of the influence of energy control policies such as the Emissions Trading Scheme (ETS), which puts a cap allowance on the permitted amount of greenhouse gases to be emitted [48], therefore being a factor that can impact electricity prices by affecting the cost of energy production. For countries outside the EU, the EIE data can indicate the extent of country-specific efforts to limit greenhouse gases, which in turn may affect electricity prices by increasing or decreasing the cost of energy.
(5) Energy imports, net (% of energy use) [49].
The volatility of prices in the international markets could be linked to energy imports, consequently affecting the price of electricity produced from such energy fuels imported. As described by [50], this also gives an indication of countries’ dependence on energy imports or, simply, energy dependency (ED). The data available for our study were from 2000 to 2018.
We represent the electricity pricing data excluding and including tax with boxplots for these 19 years in Figure 1 and Figure 2, respectively. In addition, Figure 3 shows the box plot of tax data obtained from the difference between the excluding and including tax data. All the box plots reveal the dispersion and skewness for each country. In addition, it is also easy to observe the prices below the first quartile (25%), median (50%), third inter-quartile price values (25% and 75%), the possible outliers for each country, and maximum and minimum data values. A statistical summary of the data used is presented in Appendix A, Table A3, and the list of abbreviations used is in Table A2, Appendix A.
Figure 1 shows that Italy displays the highest variation in yearly pricing excluding tax and a wide variation in absolute prices. Norway showed the lowest yearly pricing with minimal variation during the 19 years considered.
Similarly, Figure 2 shows Italy retaining the highest absolute prices when taxes are included and with the widest variation. Norway showed the lowest absolute prices with taxes being included and the variation in pricing, out of the 22 countries during the 19 years.
Figure 3 shows the variation of the year-by-year % difference in pricing (IEPIT vs. IEPET), representing the % tax from 2000 to 2018. Germany is shown to have the highest and widest variation of year-by-year tax change along with Italy, while the variation for countries such as the USA, Ireland, Norway, New Zealand, and Finland has been low to minimal. These variations can be observed in more detail on a time-scale plot in Figure 4.
Figure 4 shows that both Italy and Germany had more than 50% increase in % tax between 2000 and 2018. Italy and Austria showed the highest year-by-year tax increases (in %) between 2000 and 2008. Since 2008, Germany has shown the highest year-by-year tax increases (in %), with increases peaking in 2014 (at 89%). All the countries in the study, except for France, Austria, Italy, and Germany, showed a year-by-year tax increase of below 25% over the 19 years.

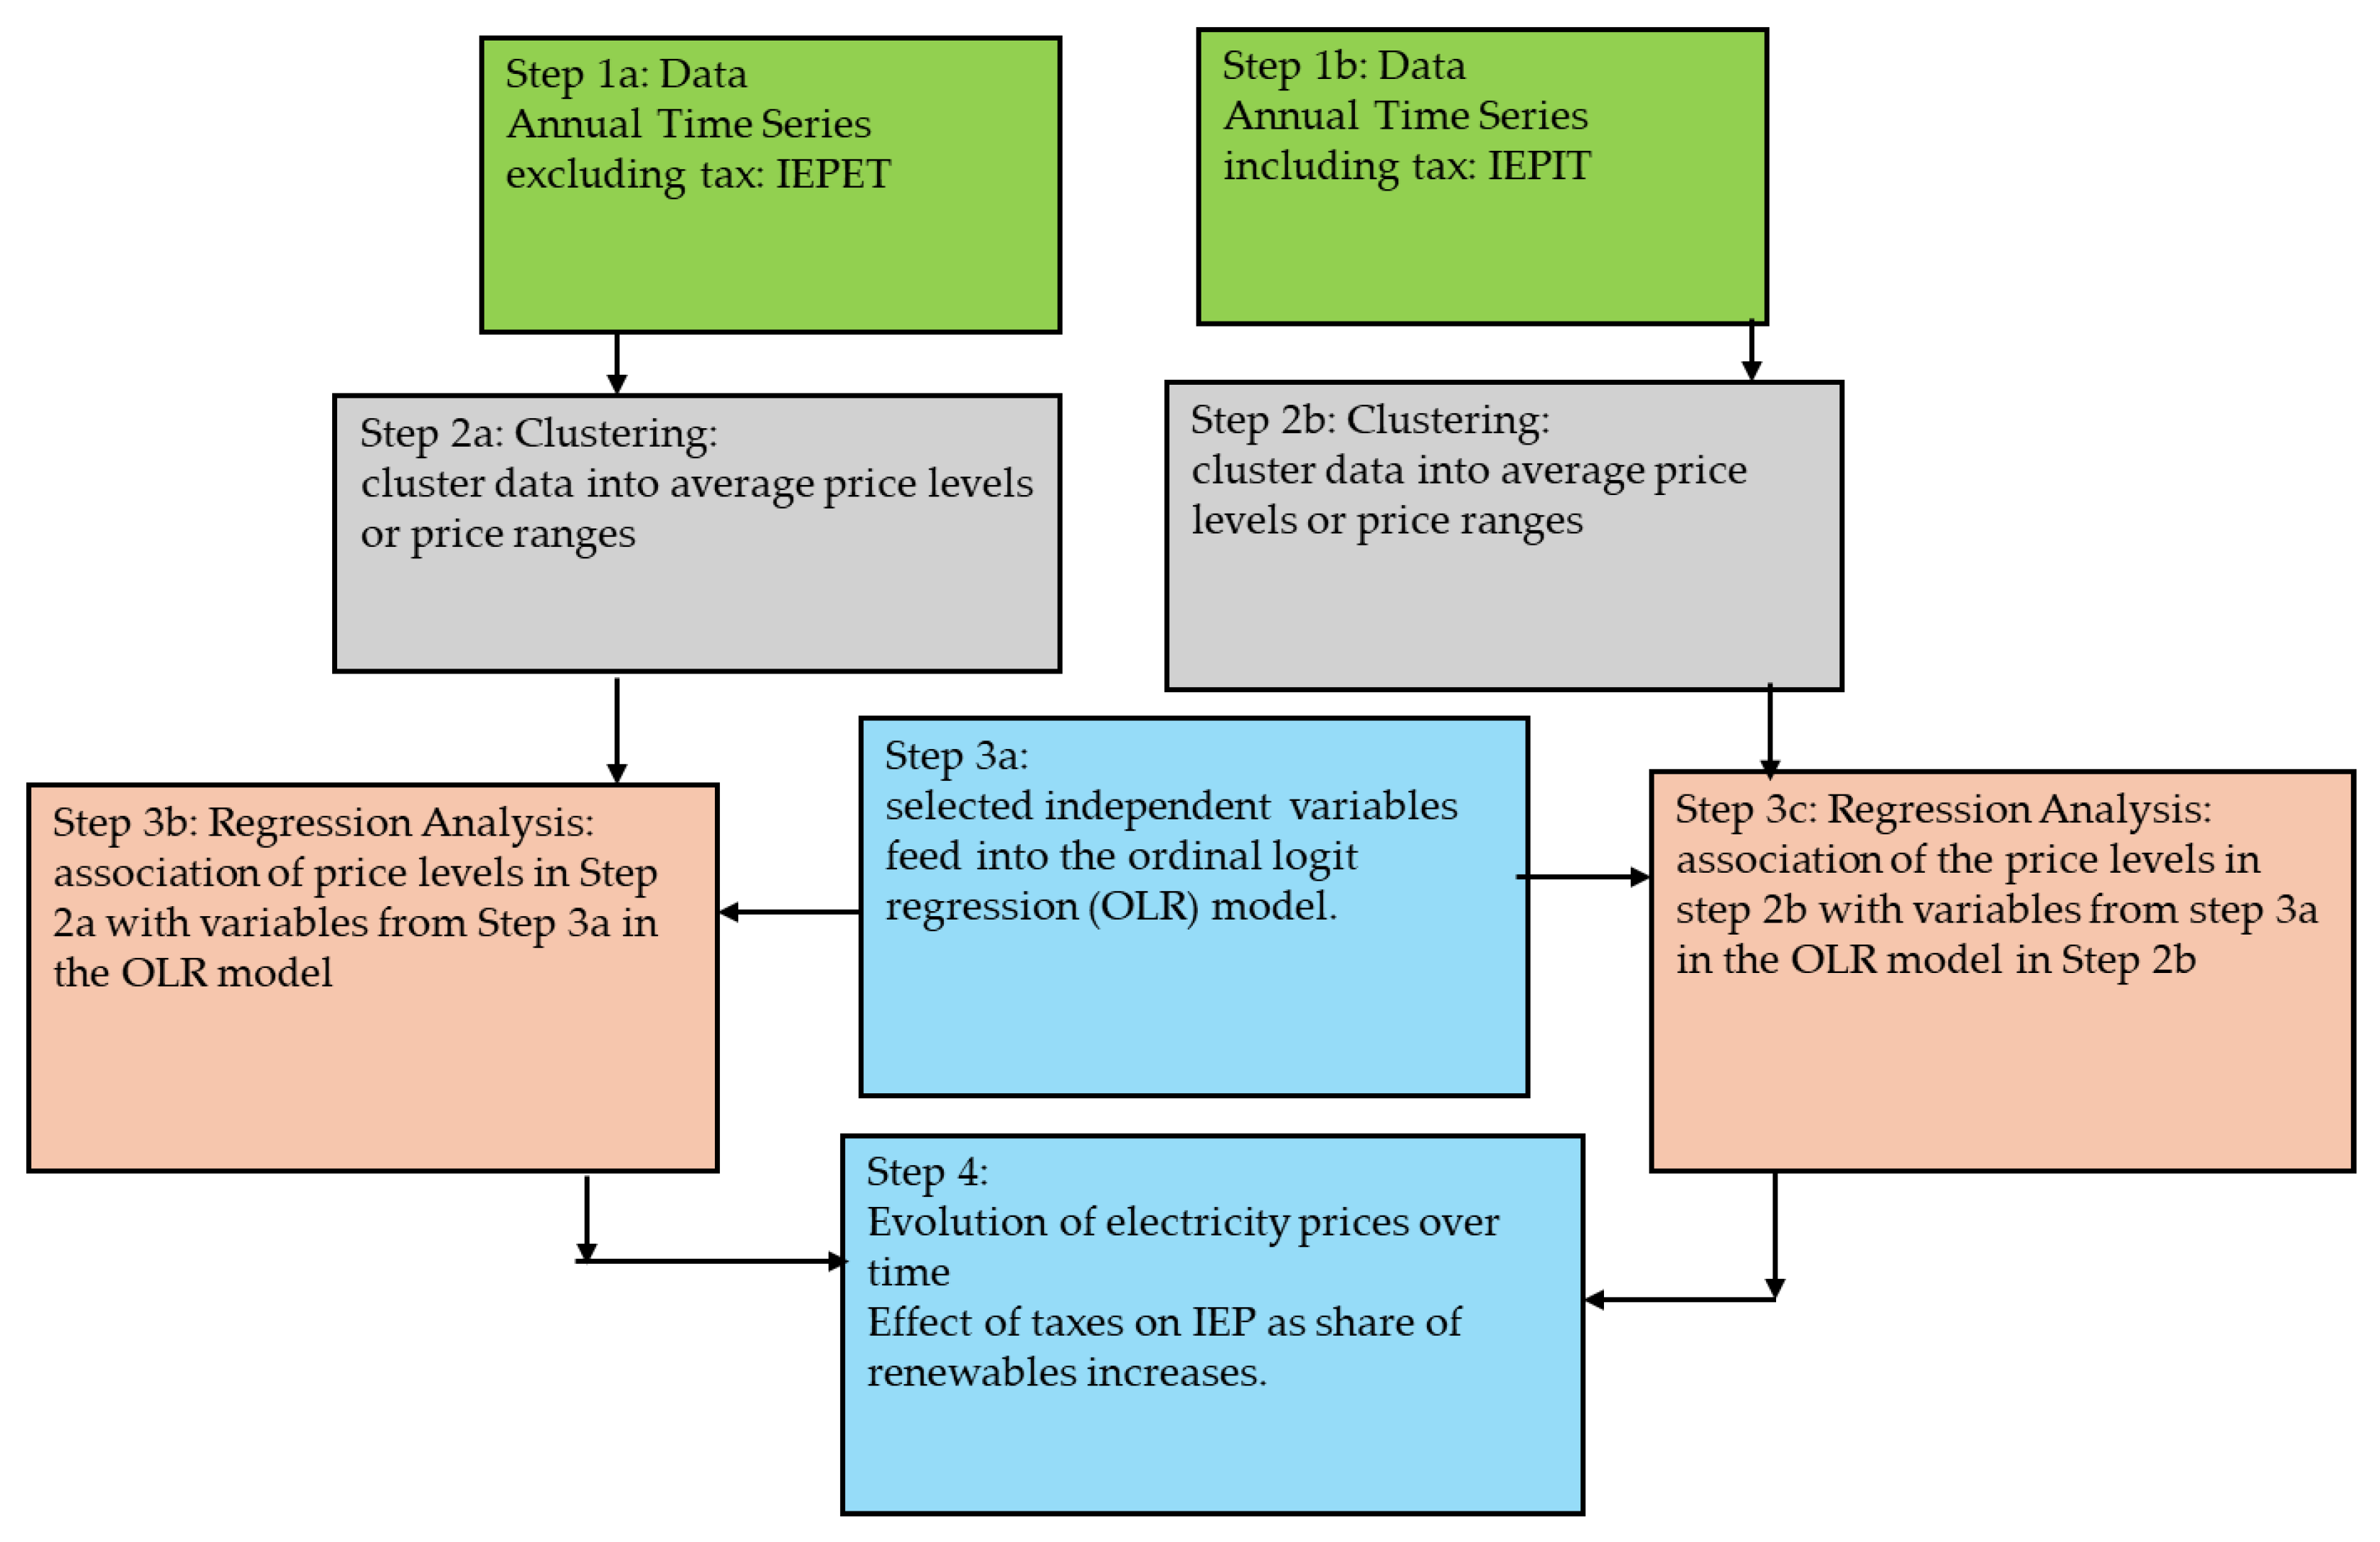
3.2. Method of Analysis

A flow chart of the methods employed in this study is presented in Figure 5. Our research employed clustering and regression analysis. R-statistics software program (version 4.2.0) and Microsoft Excel were used for data analysis and visualization. We specifically used the NbClust library [51] and other time-series functions in R for the clustering analysis. For the regression analysis, we used the MASS library [52] and the Stargazer library [53] within the R statistics library.

3.2.1. Determining the Pricing Cluster Levels

We performed clustering analysis for the IEP time-series datasets (excluding and including tax). The twenty-two countries were categorized into price levels using the k-means clustering algorithm. The k-means technique was used due to its popularity among other clustering techniques [54,55,56], and versatility [57] in clustering time-series static data. In addition, the k-means technique and its variants are widely used in energy profiling studies such as [35,37,39,58,59,60]. The k-means clustering puts into levels or groups a dataset by optimizing a particular similarity/dissimilarity measure or distance function iteratively [57,61]. We follow the approach of [35,55,62], using the NbClust to determine the optimal number of clusters in the dataset before clustering is performed.

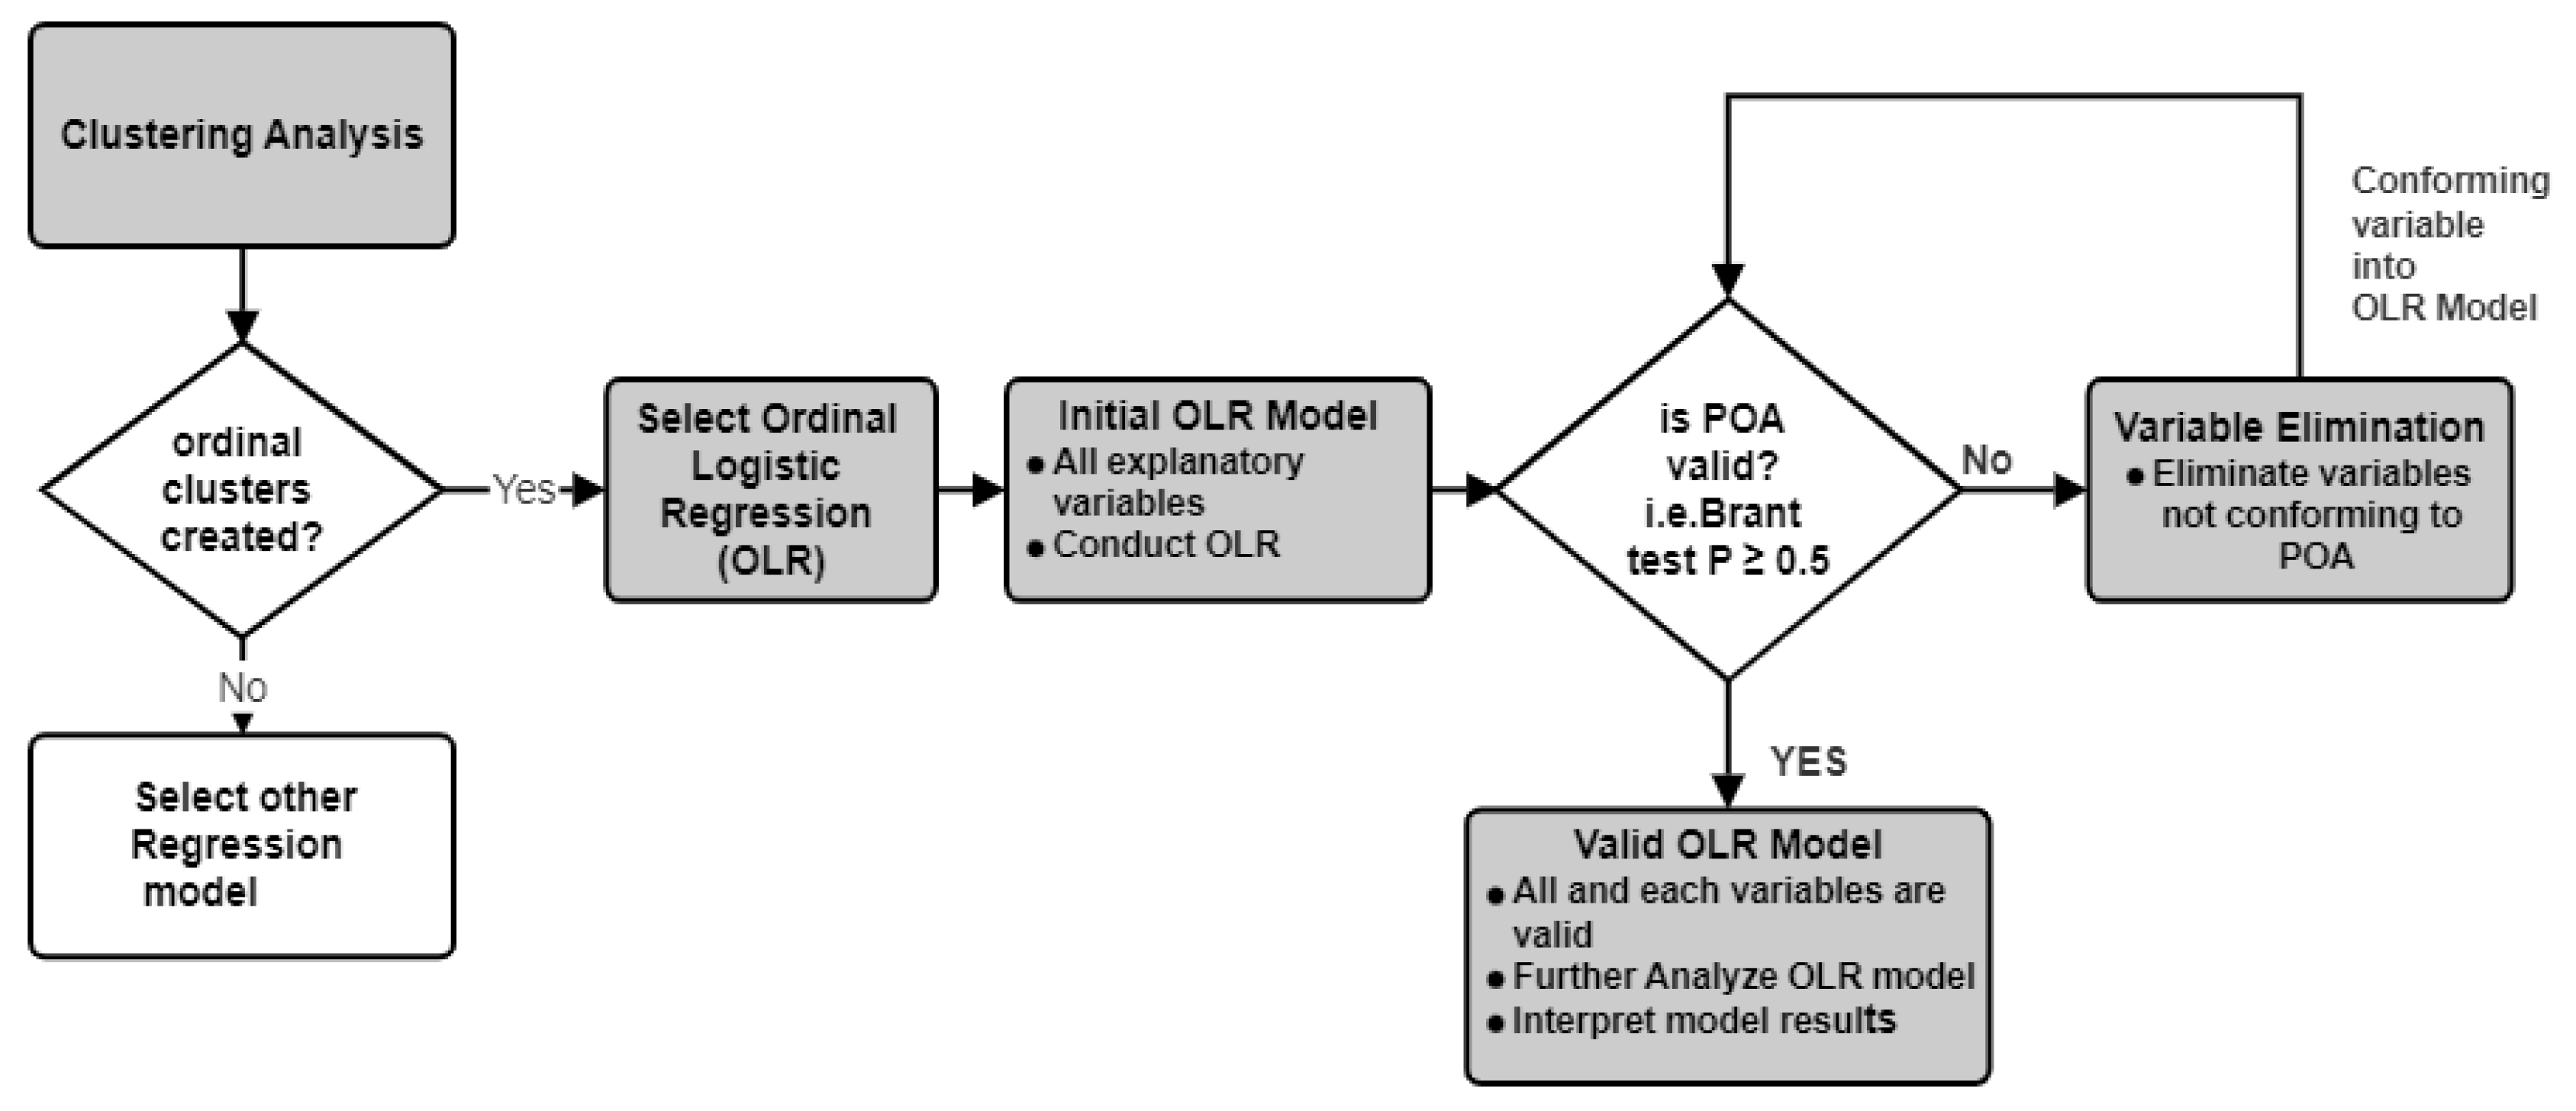
3.2.2. Ordinal Logistic Regression (OLR) Model

The regression model used in this study was dependent on the results obtained from the clustering analysis. OLR gives outputs in log odds and is also referred to as the proportional odds model [63]. This model is used when there is a need to obtain a relationship between independent and dependent variables when there is a form of order in the dependent variable (with three or more levels such as low, median, and high, as in our case) [64,65,66,67].
l o g i t   P Y j =   δ j 1   X 1 + + δ j n     X n + α j 0
For j = 1 ,   2   ,   J 1  and  n = number of independent variables,
J => the number of categories or levels of the ordinal dependent variable
Y => ordinal dependent variable (levels or categories)
X n => n independent variables
α j 0   => intercept dependent on the number of categories or levels of the ordinal dependent variable minus one ( j = 1 ,   ,   J 1 )
δ j n => coefficients dependent on the j and the number of independent variables ( n : 1 n )
P Y j => probability (cumulative) of the dependent variable Y less than or equal to a specific ordinal category or level j = 1 ,   ,   J 1 .
l o g i t   P Y j =     log P Y j P Y > j
Equation (2) is referred to as the logit or the log odds equation.
As discussed by [68], POA emphasizes the parallelism between the categories or levels of the dependent variable (Y). [69] described POA as attempting to fit a series of logistic regression models into different categories (cluster groupings in our case) where the coefficients of independent variables do not change for each of the logistic regressions, though the intercepts could differ. The POA provides a limitation to the OLR model. Studies such as [70] provided suggestions to overcome this limitation through relaxation of the assumption.
However, the approach we used in dealing with this limitation, especially if any of the variables failed the test, was to remove the independent variable from the OLR model and re-compute the OLR. Brant’s test [71] was conducted to validate the fit of the OLR model used. According to the Brant test, the parallel or proportional regression assumption determines the fit of the model for all the variables through the omnibus (all the variables together) and for each variable through their respective results. The assumption holds for the omnibus and individually when the probability (p) of the omnibus is greater than 0.05 level of significance (i.e., p ≥ 0.05) and does not hold if p < 0.05. In addition, Brant’s test also shows the validity of the assumption for each variable included in the model. Figure 6 provides a flowchart of the regression analysis procedure followed in this study to conduct regression after results were obtained from the clustering.

4. Results

4.1. Results of Cluster Analysis

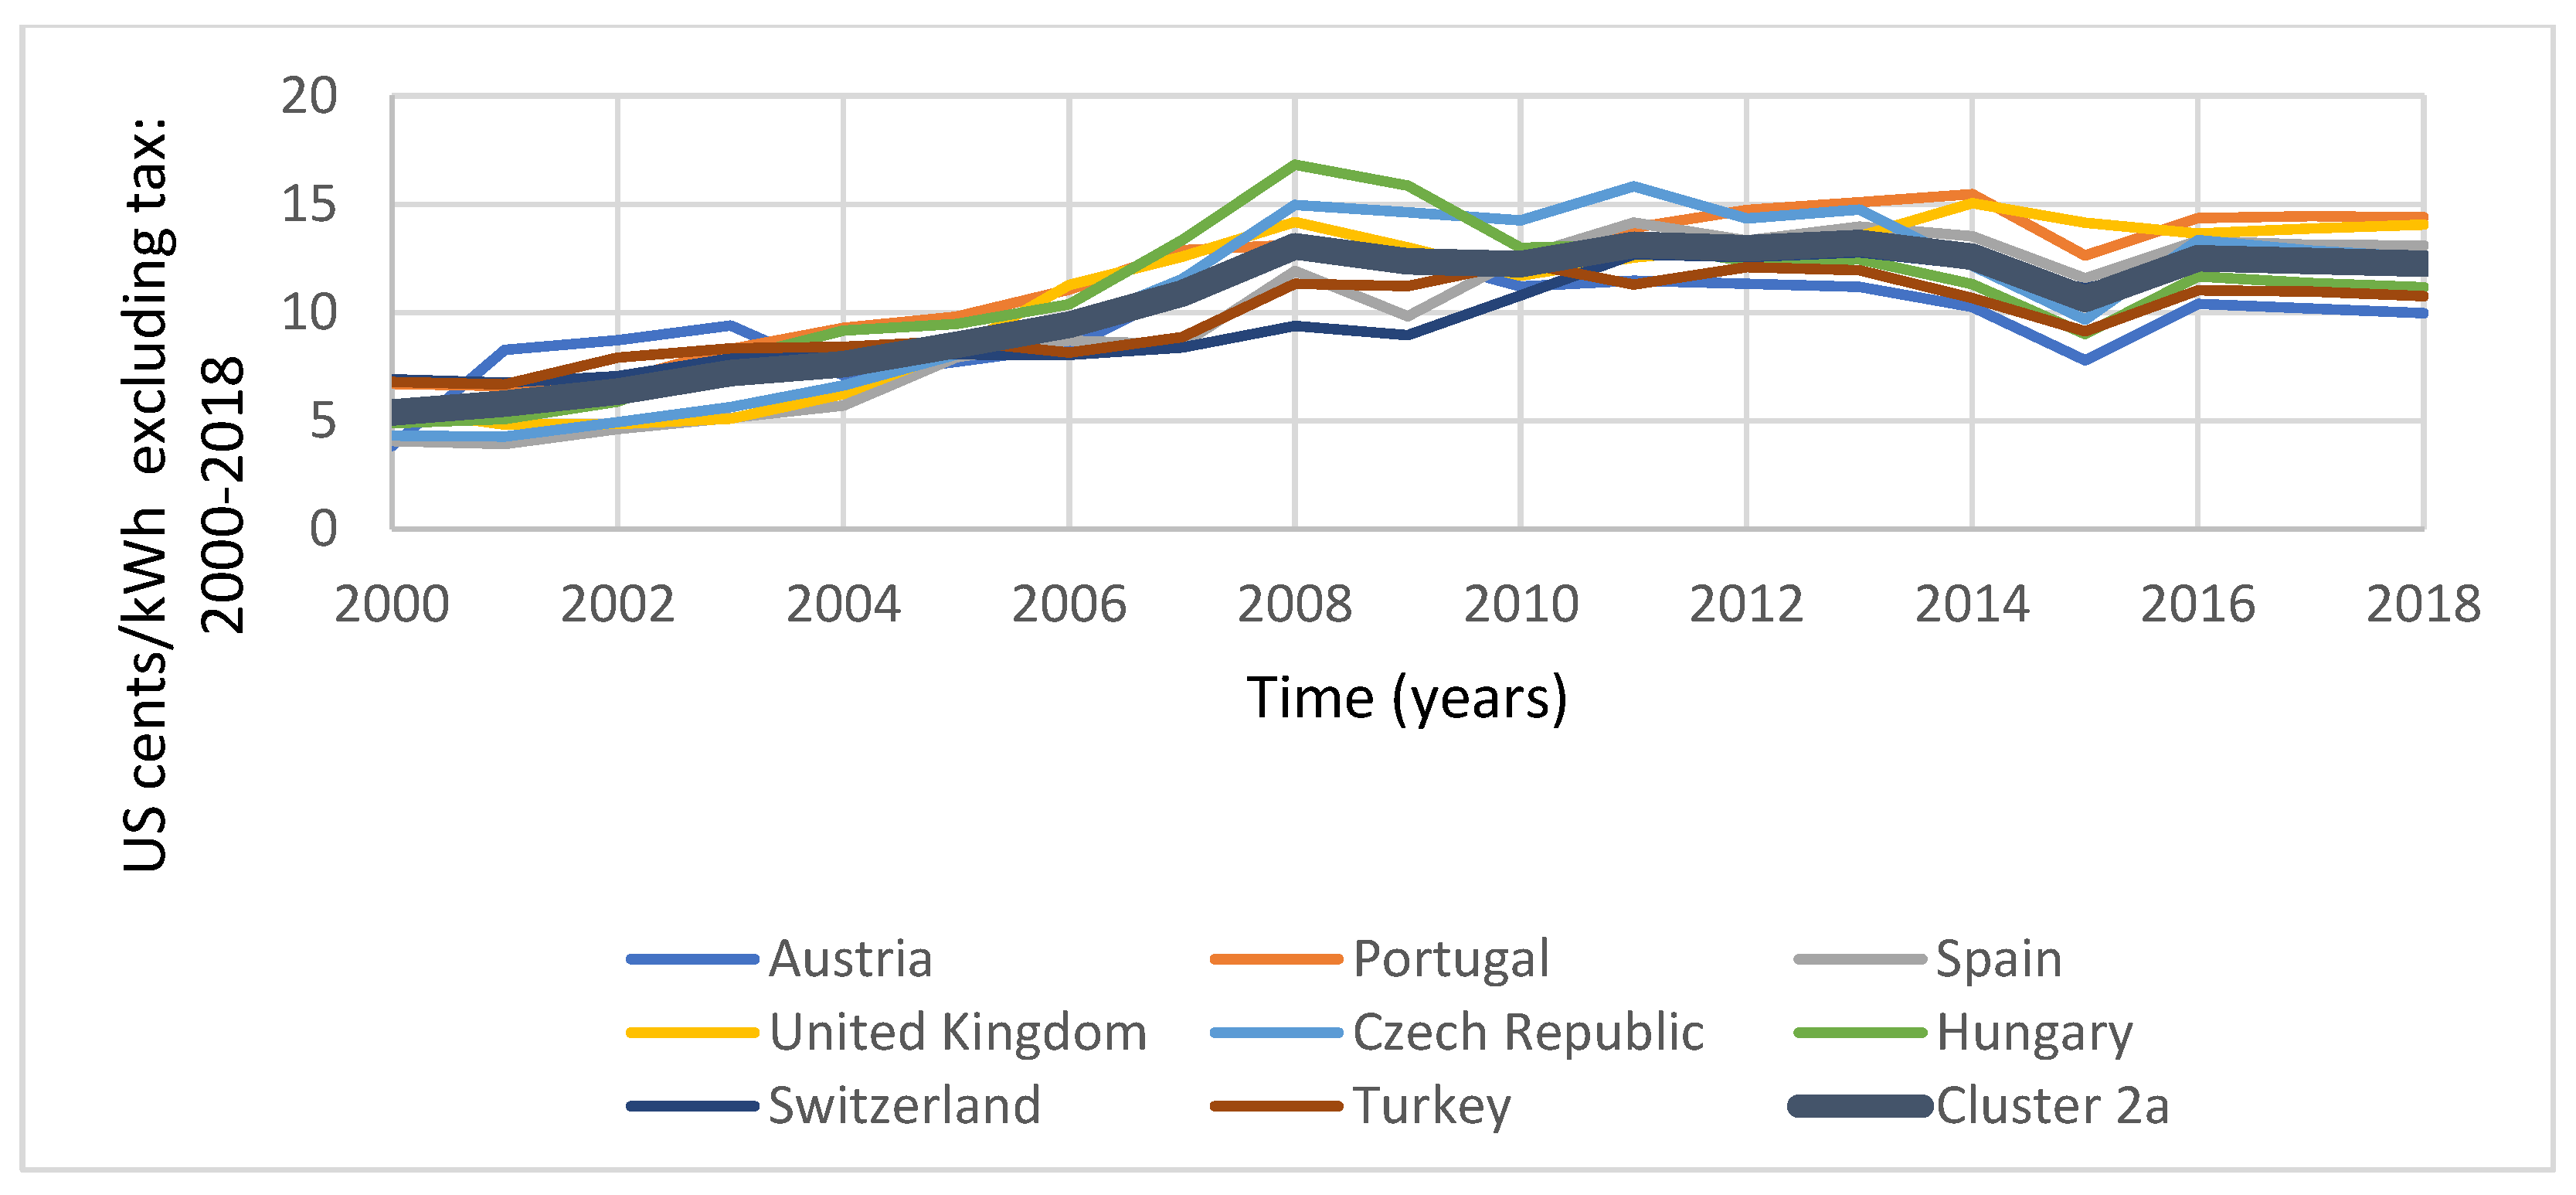
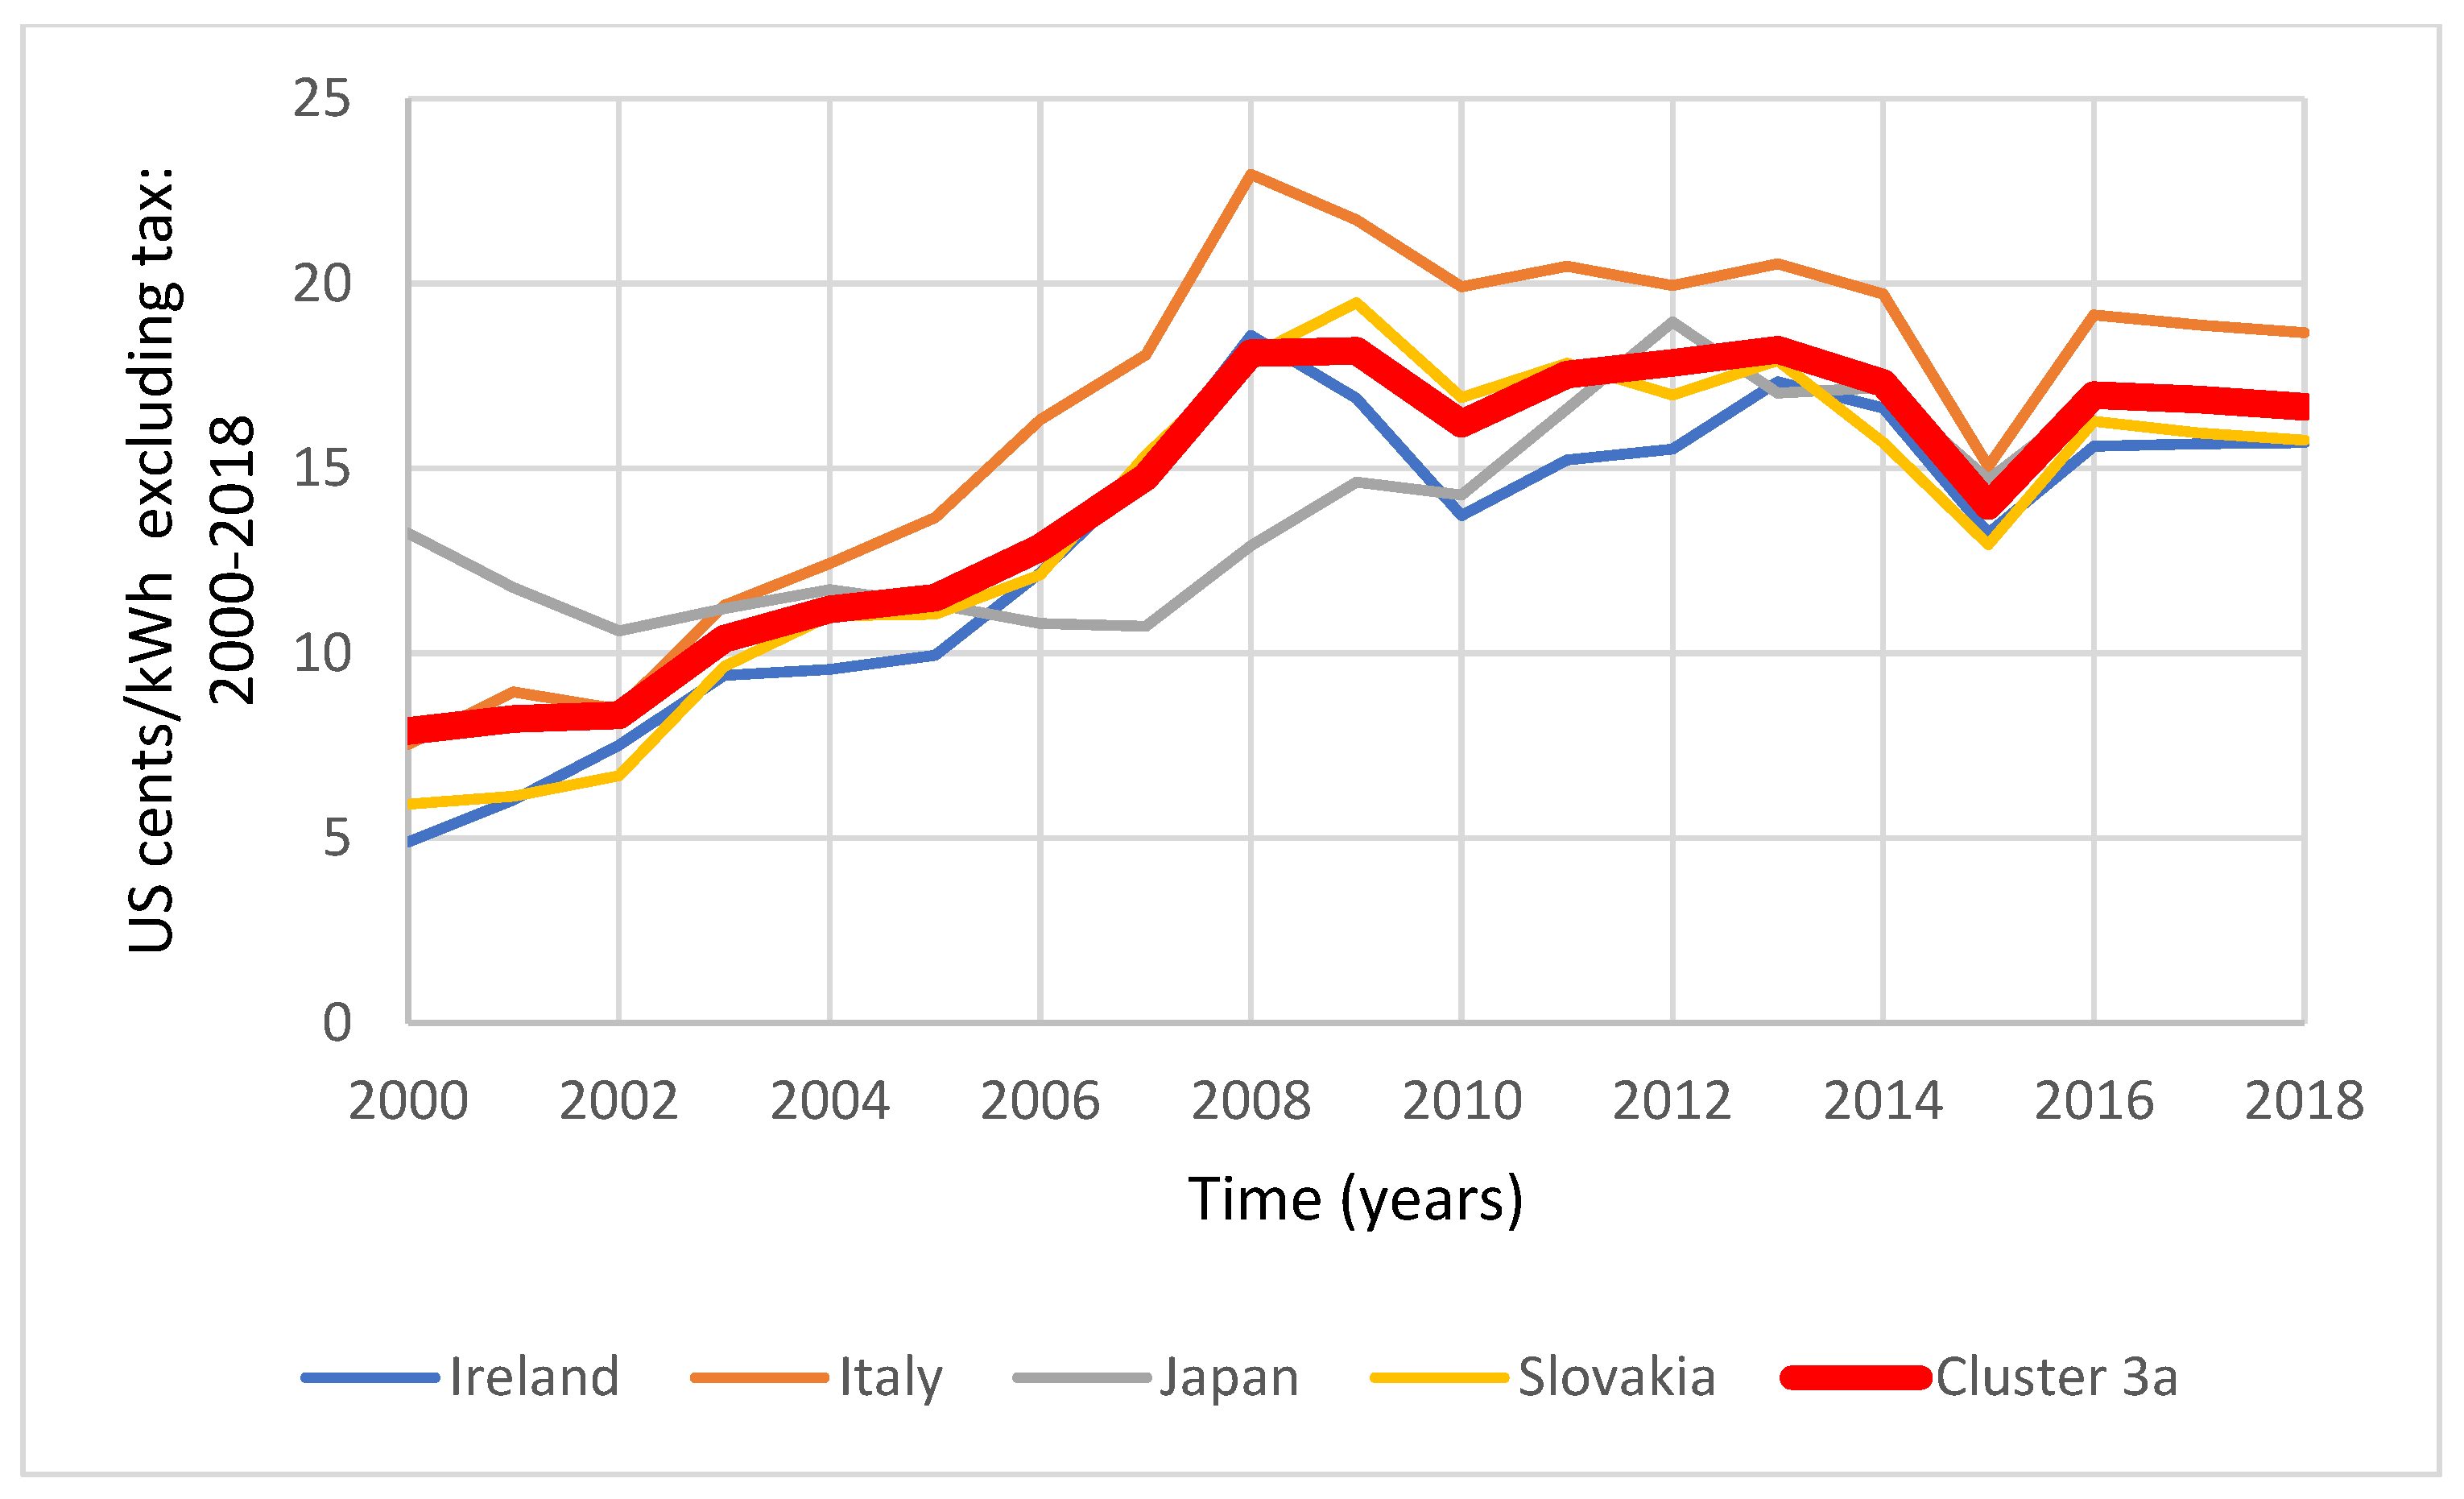
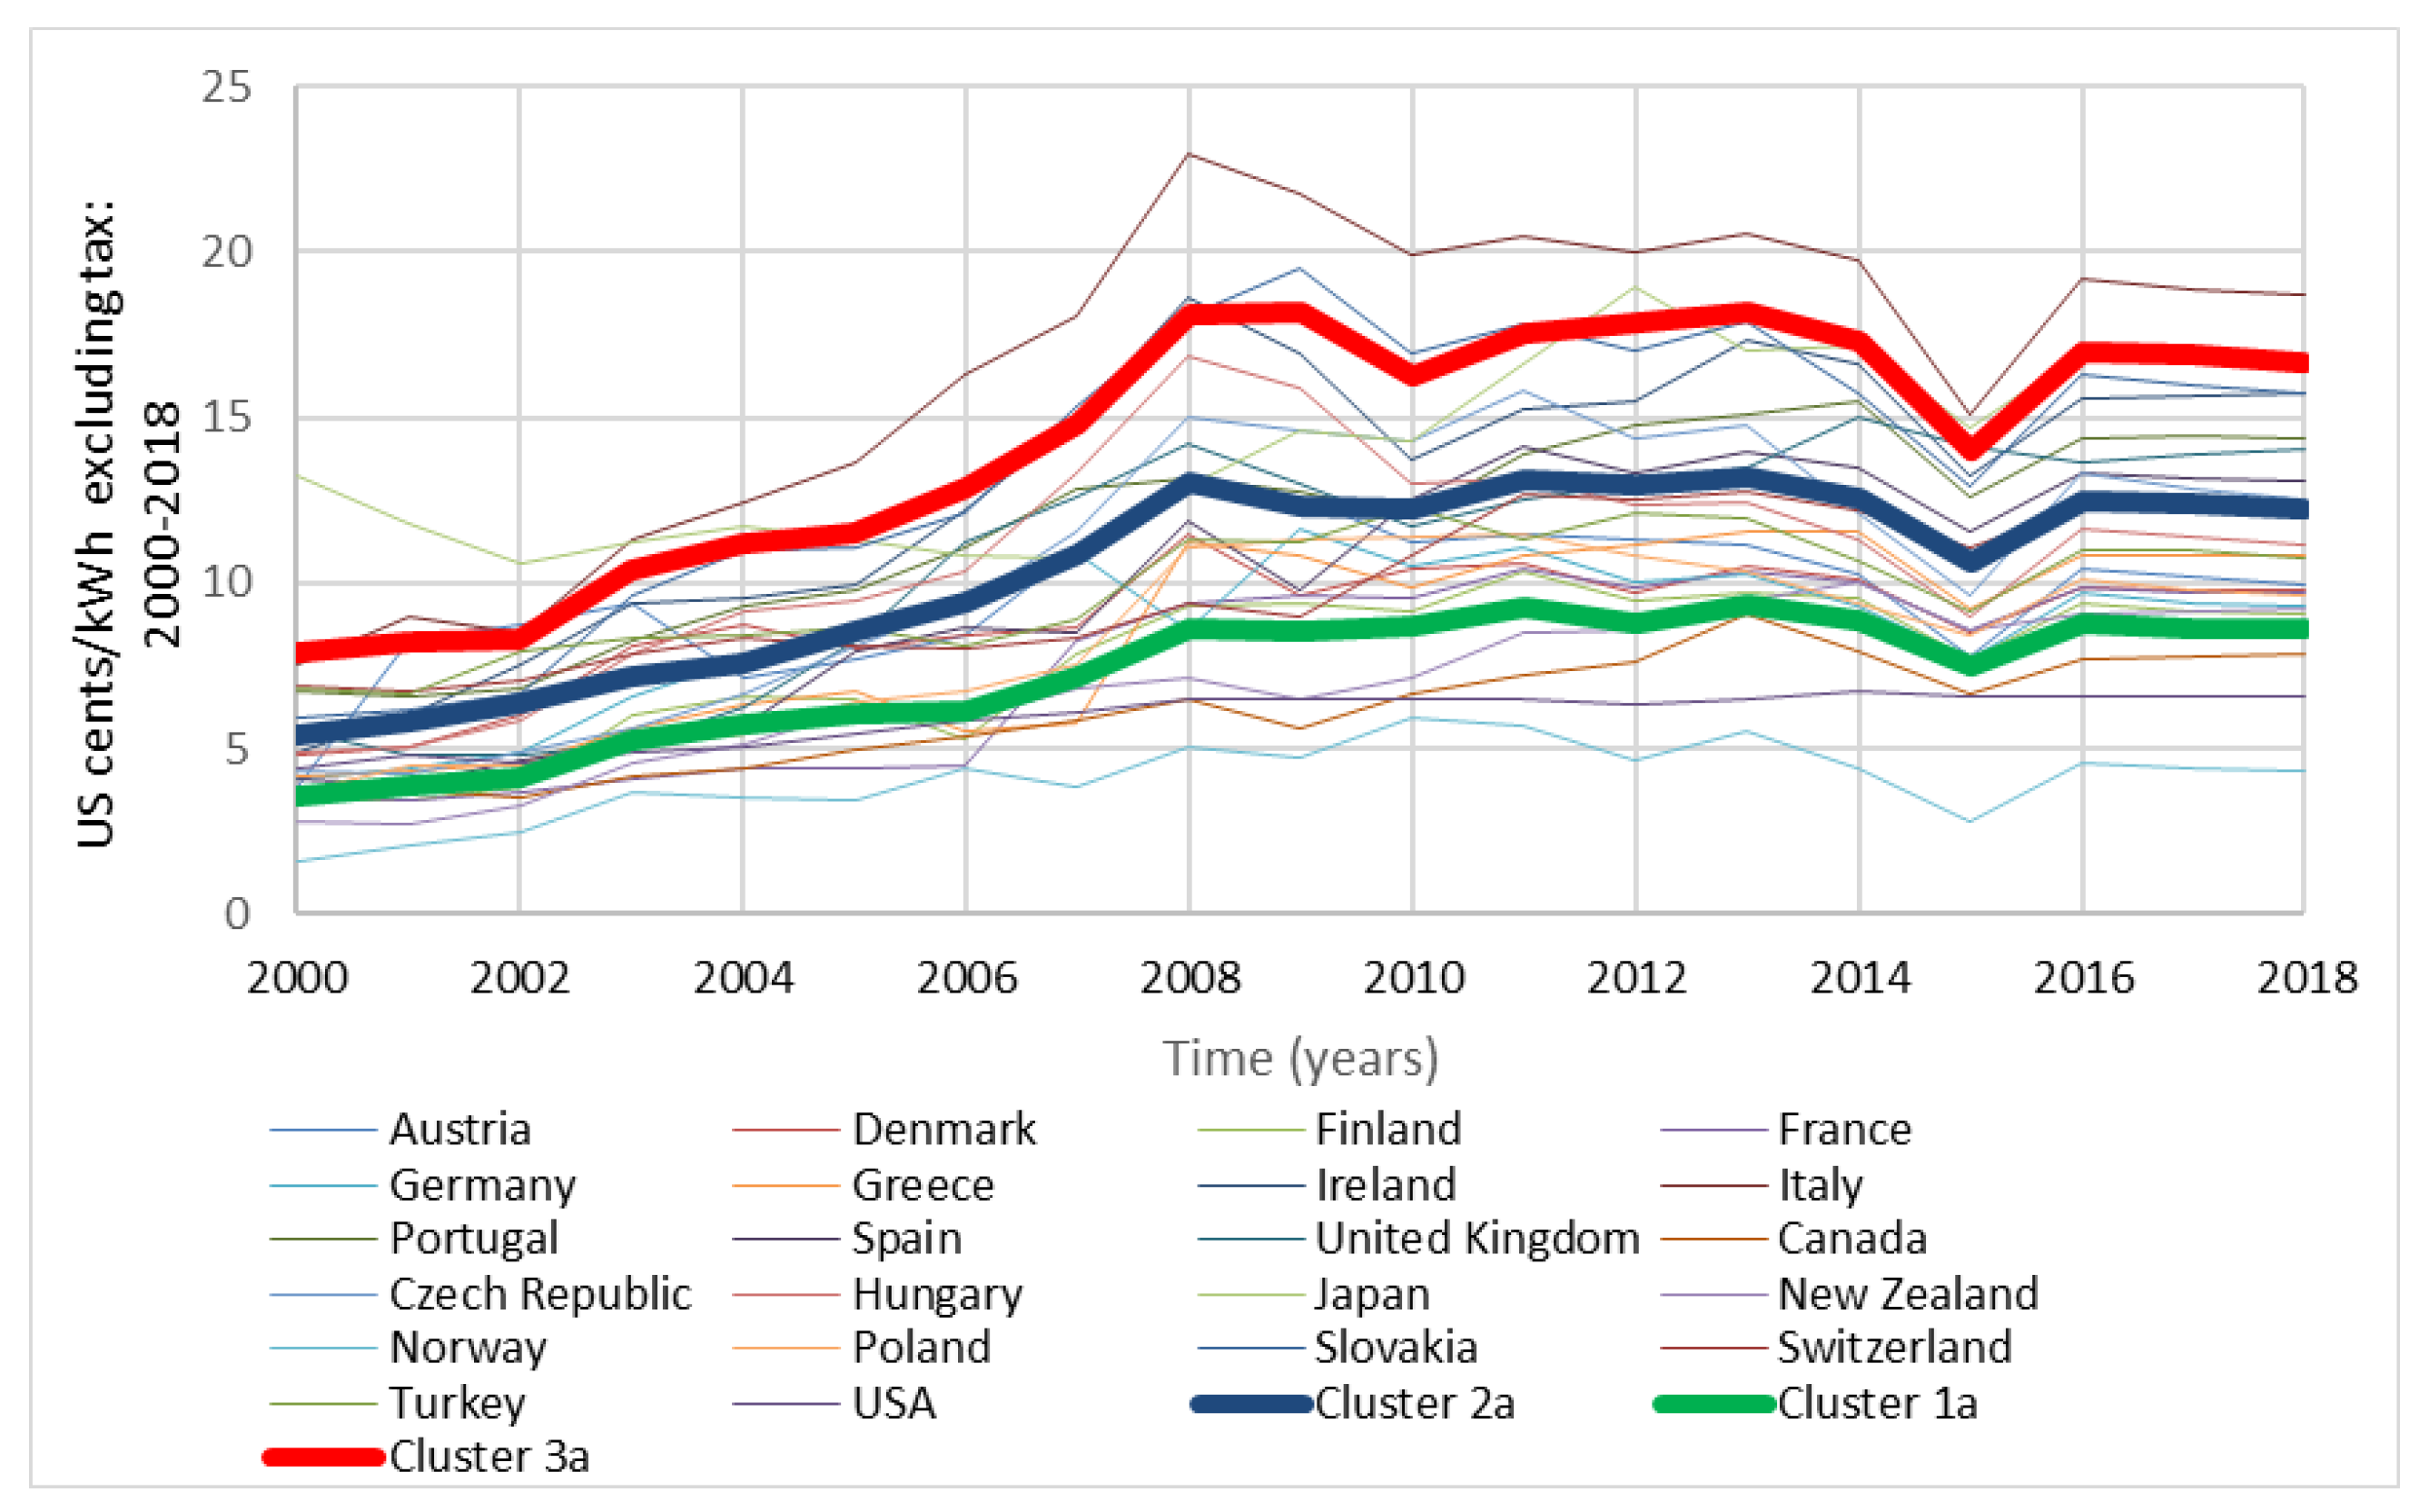
4.1.1. Industrial Electricity Pricing Excluding Tax

The optimal number of clusters obtained was three (3). The price ranges (center bounds) and countries in each price range (cluster sizes) are shown in Table 1. Cluster 1a (price grouping between 3.954 and 8.622 cents/kWh) includes prominent EU member countries (such as Denmark, France, and Germany), North American countries (such as Canada and the US), and it also includes New Zealand. Cluster 2a (price grouping between 5.373 and 12.253 cents/kWh) consists of a greater number of EU countries except for Switzerland and the UK. Similarly to cluster 2a, cluster 3a (price grouping between 7.898 to 16.666 cents/kWh) consists of a smaller number of EU countries and Japan.
In Figure 7, we present the combined time-series plot for all the 22 countries, including the three clusters identified. Figure A1, Figure A2 and Figure A3 (in Appendix A) show the time-series plot of the clusters and the cluster averages obtained. For all countries, we observed upward and downward trends in prices, with a few countries falling below 5 cents/kWh and a few going above 15 cents per kWh throughout the years considered. In between these trends, there are periods of sharp drops in electricity prices around 2010 and 2015. The price plots of each cluster in Figure A1, Figure A2 and Figure A3 (in Appendix A) also illustrate this clearly. The time-series cluster plot indicates an upward movement of prices between 2000 and 2010. However, this upward trend declined and plateaued between 2010 and 2015.

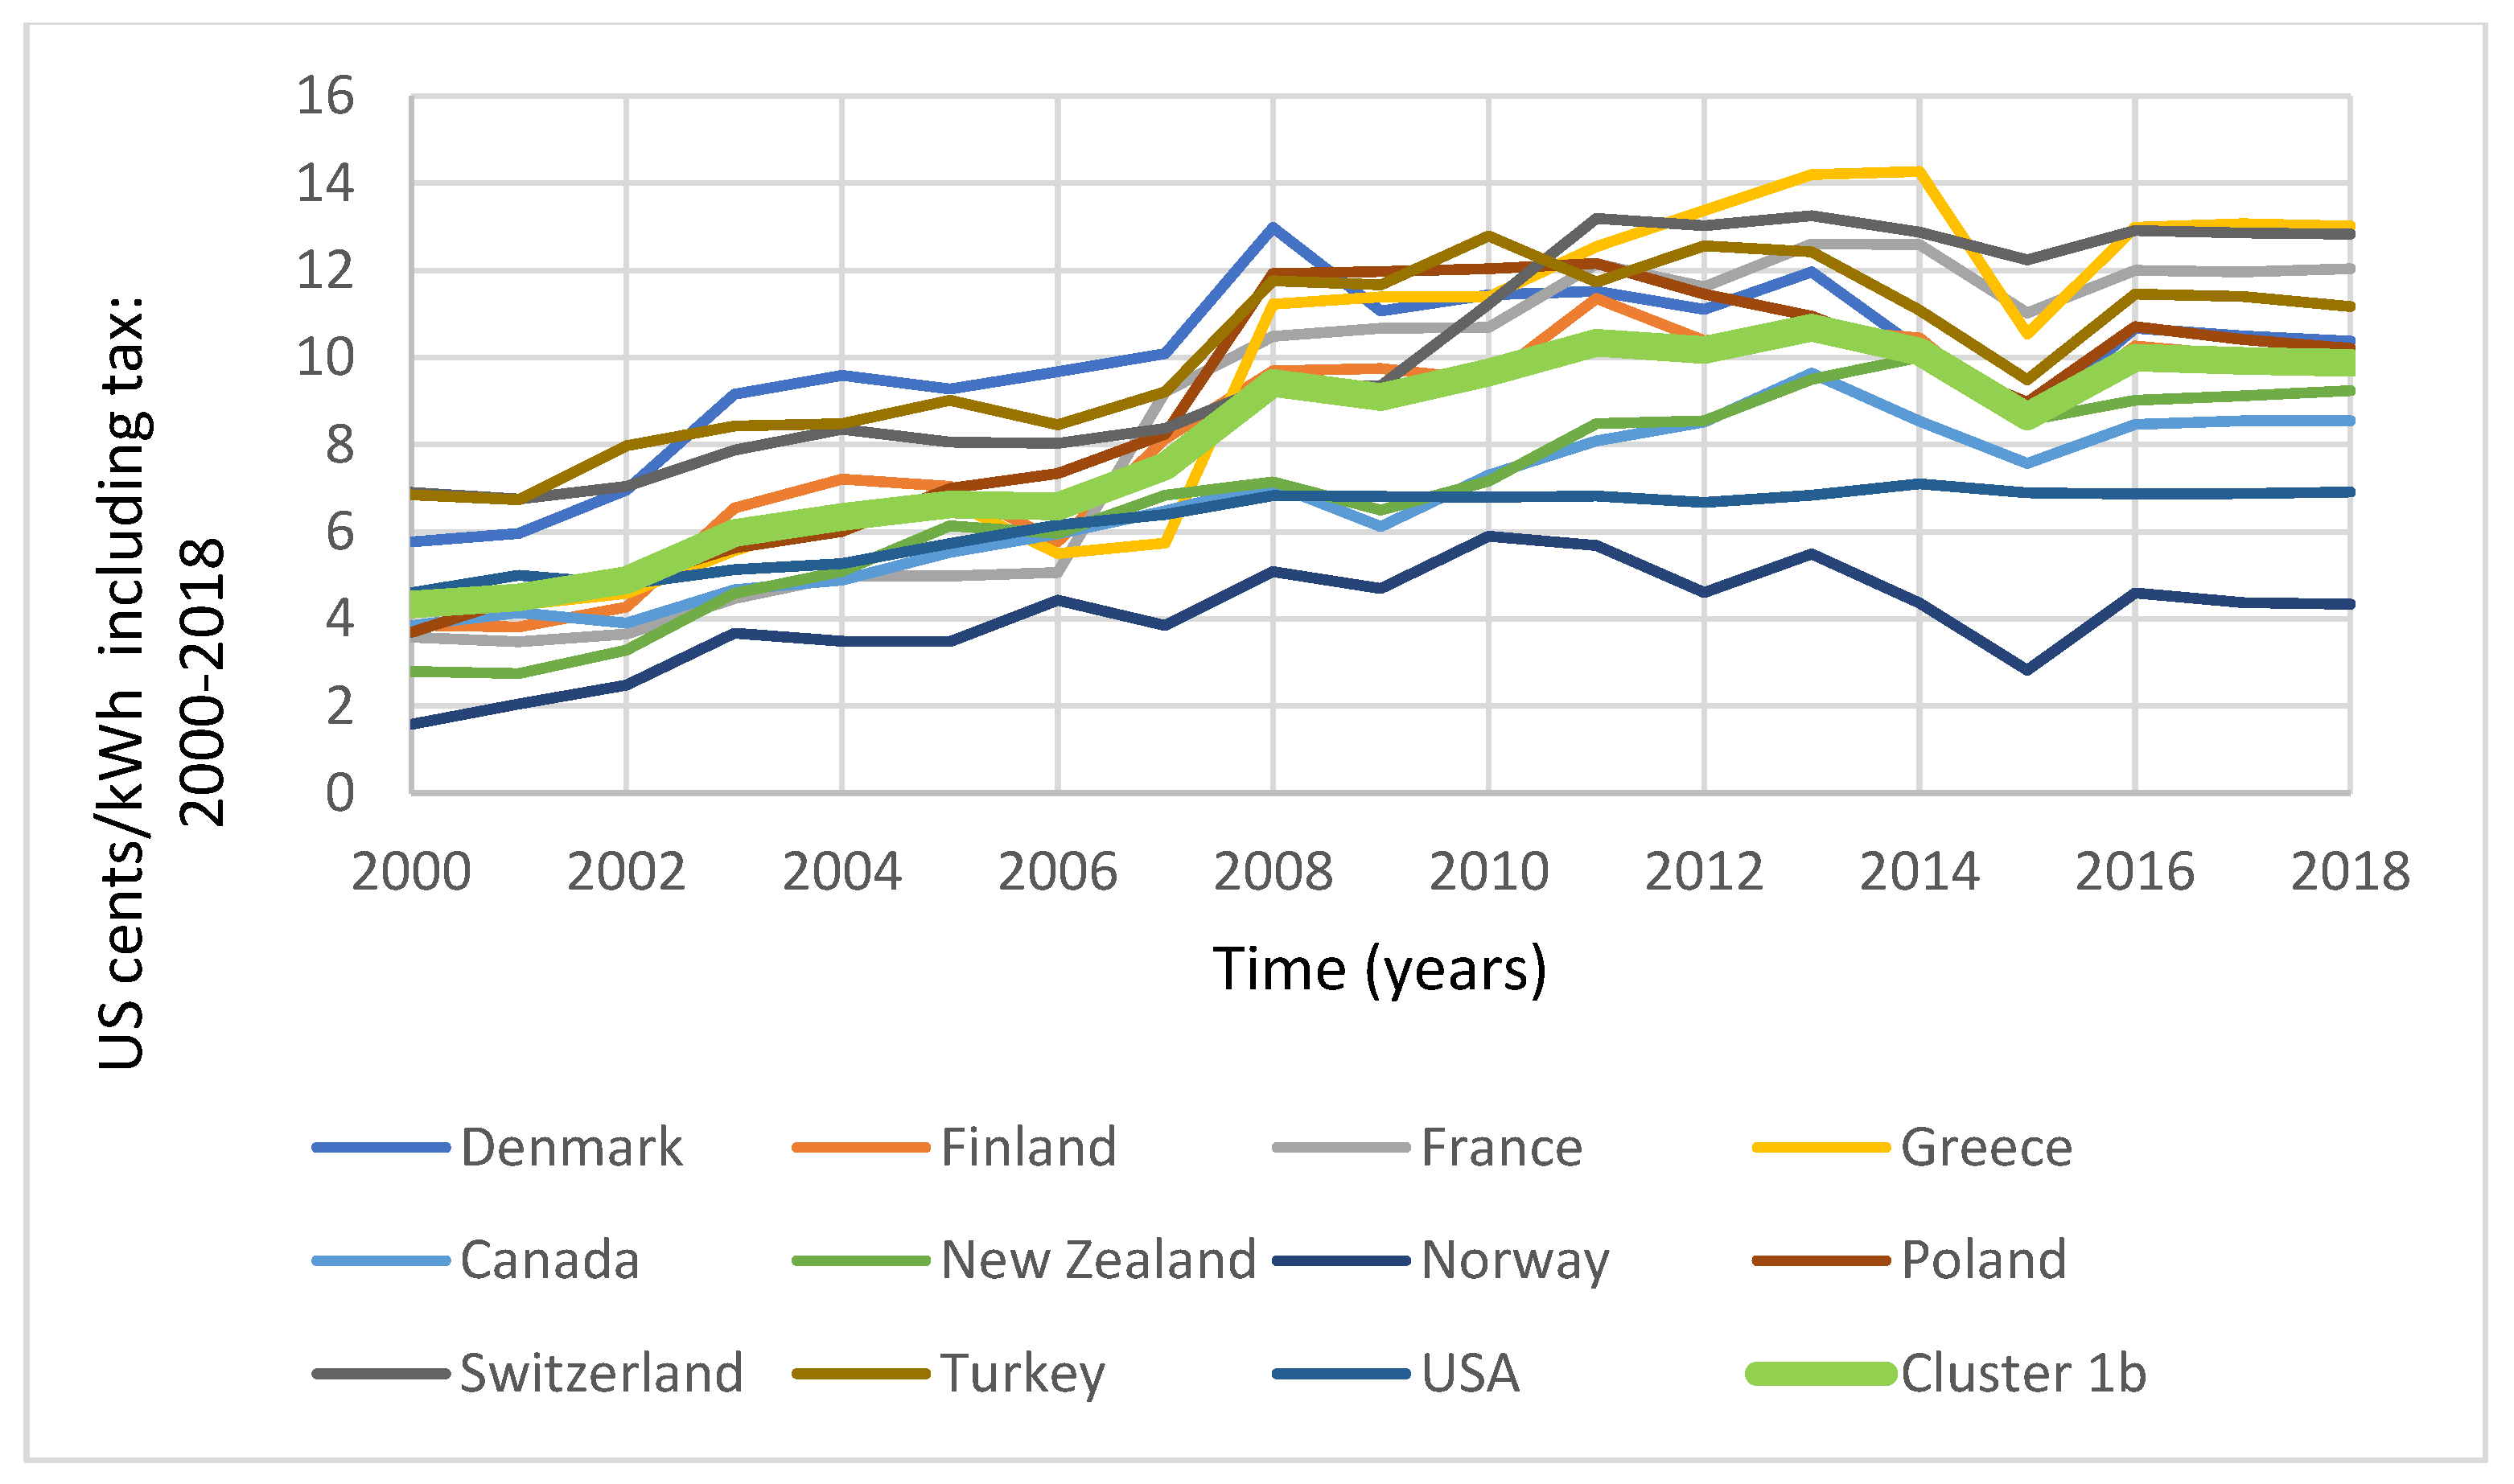
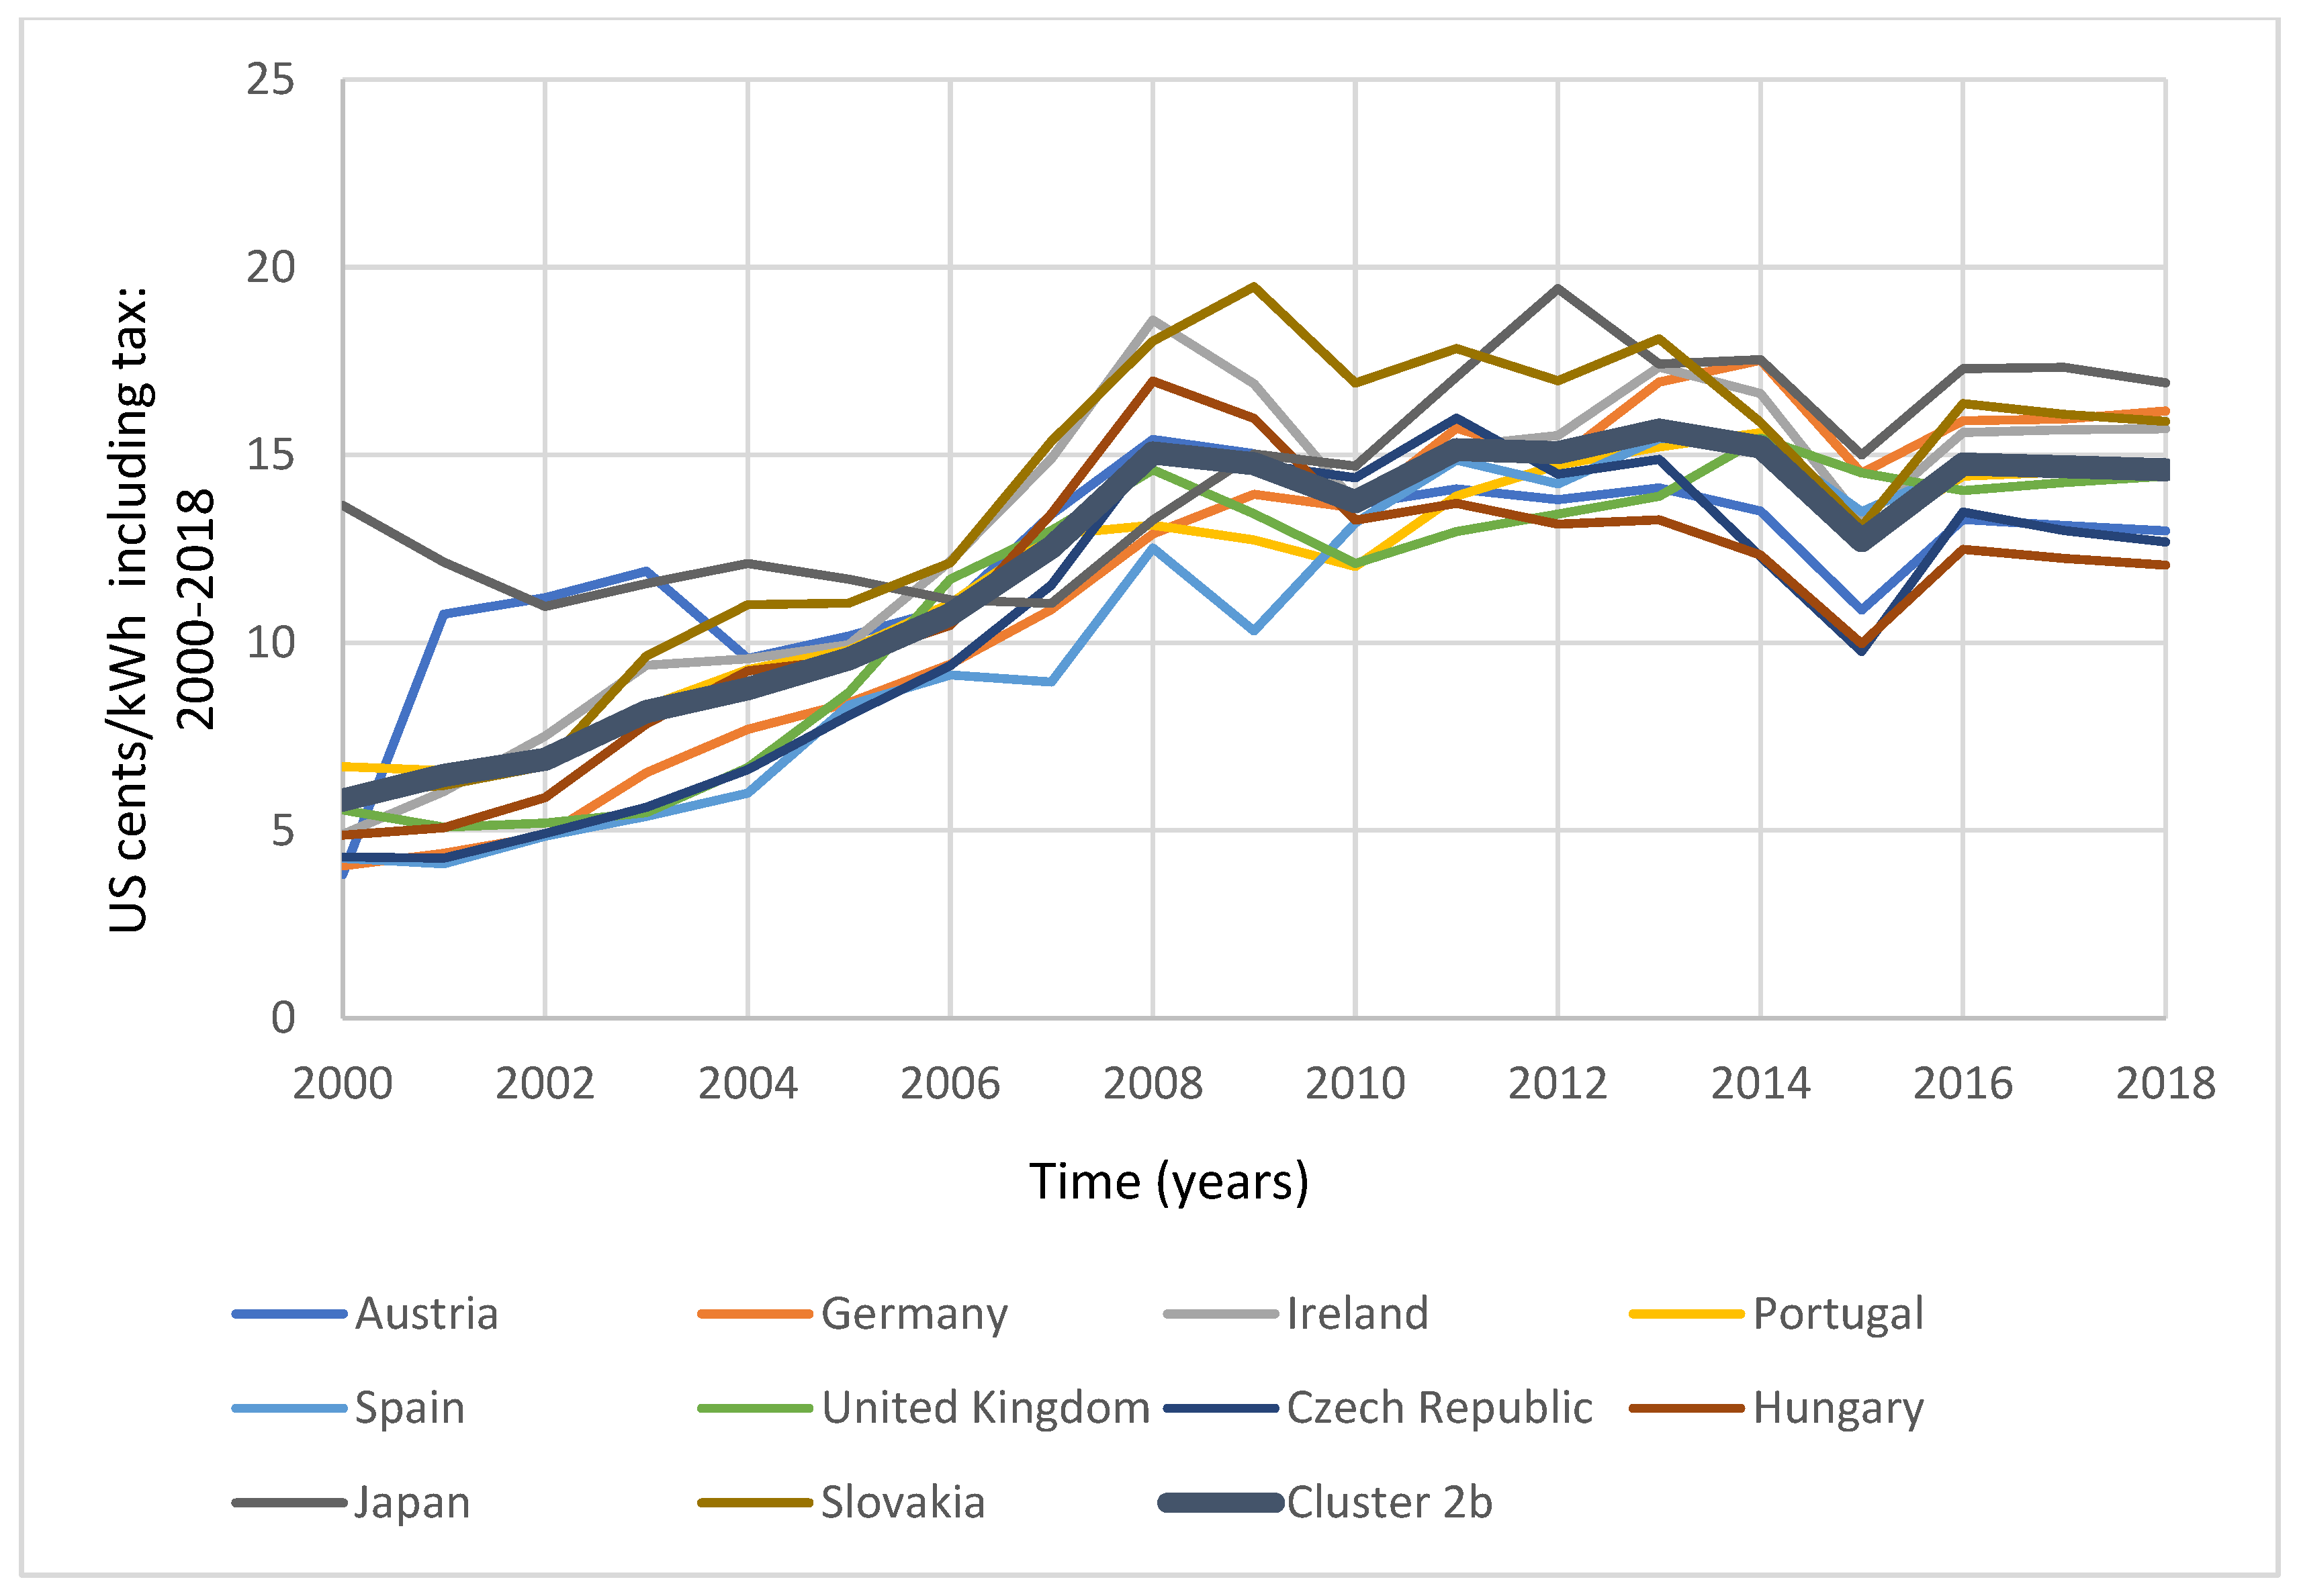
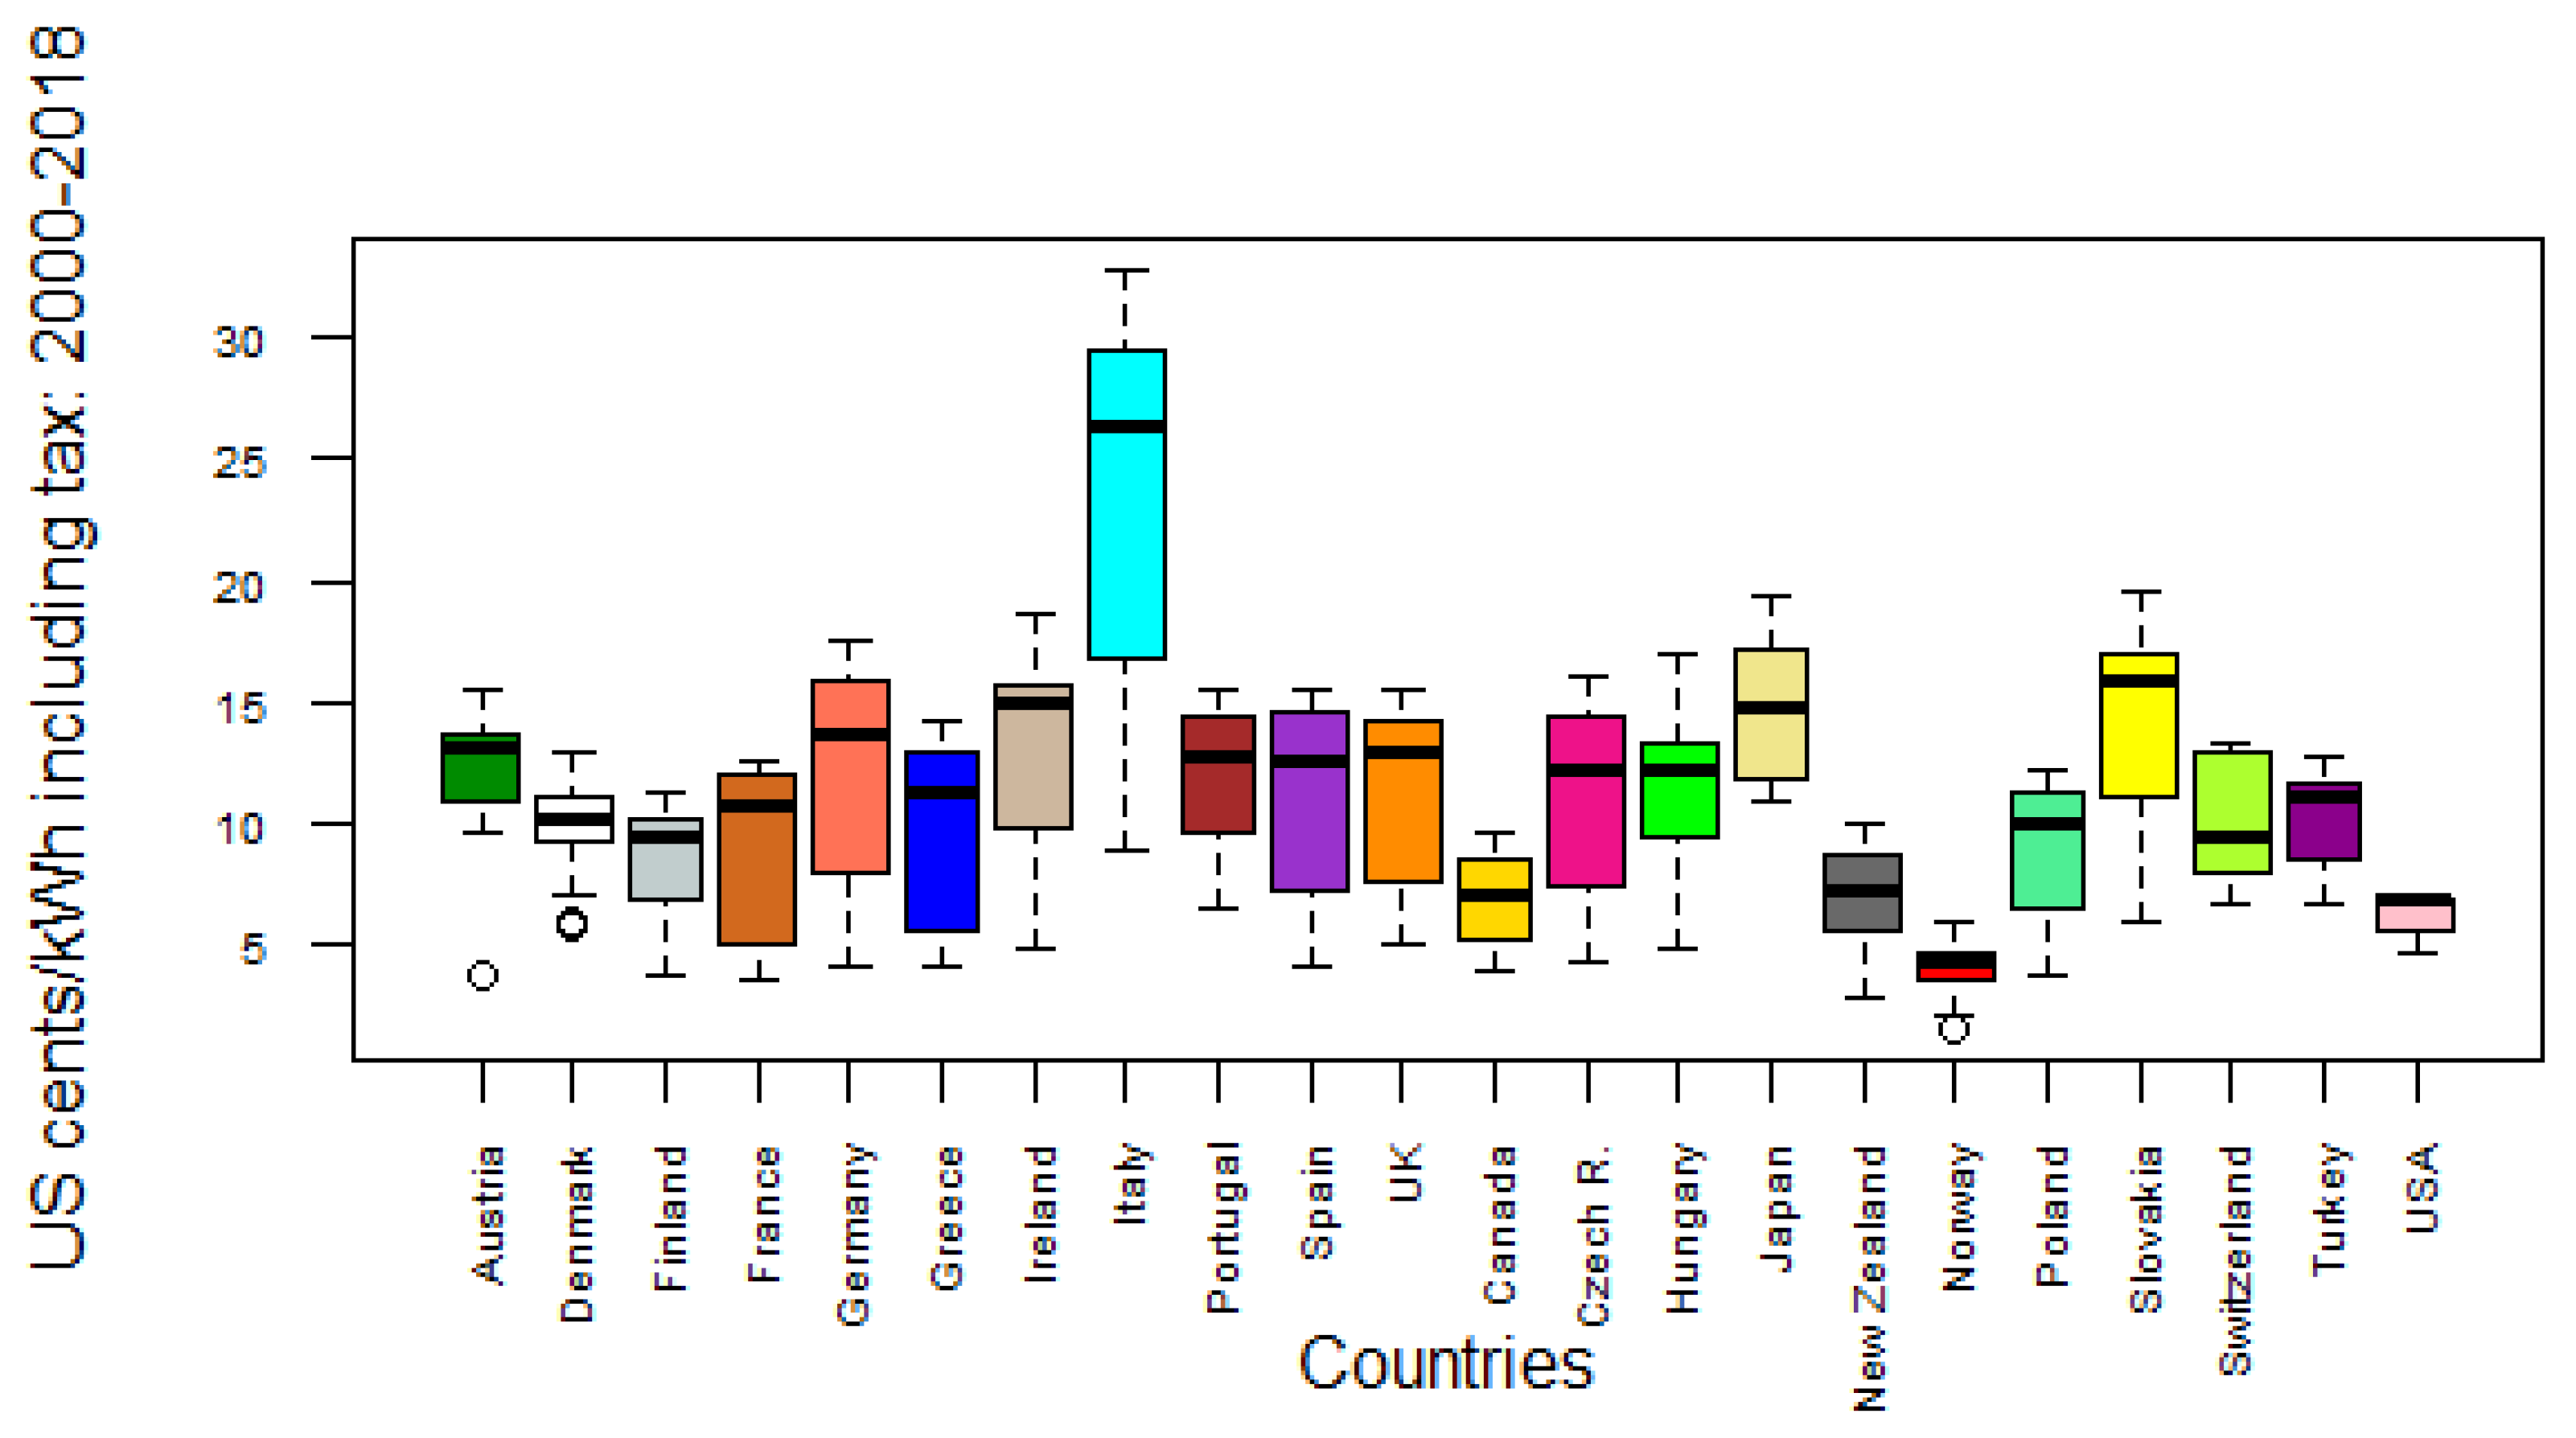
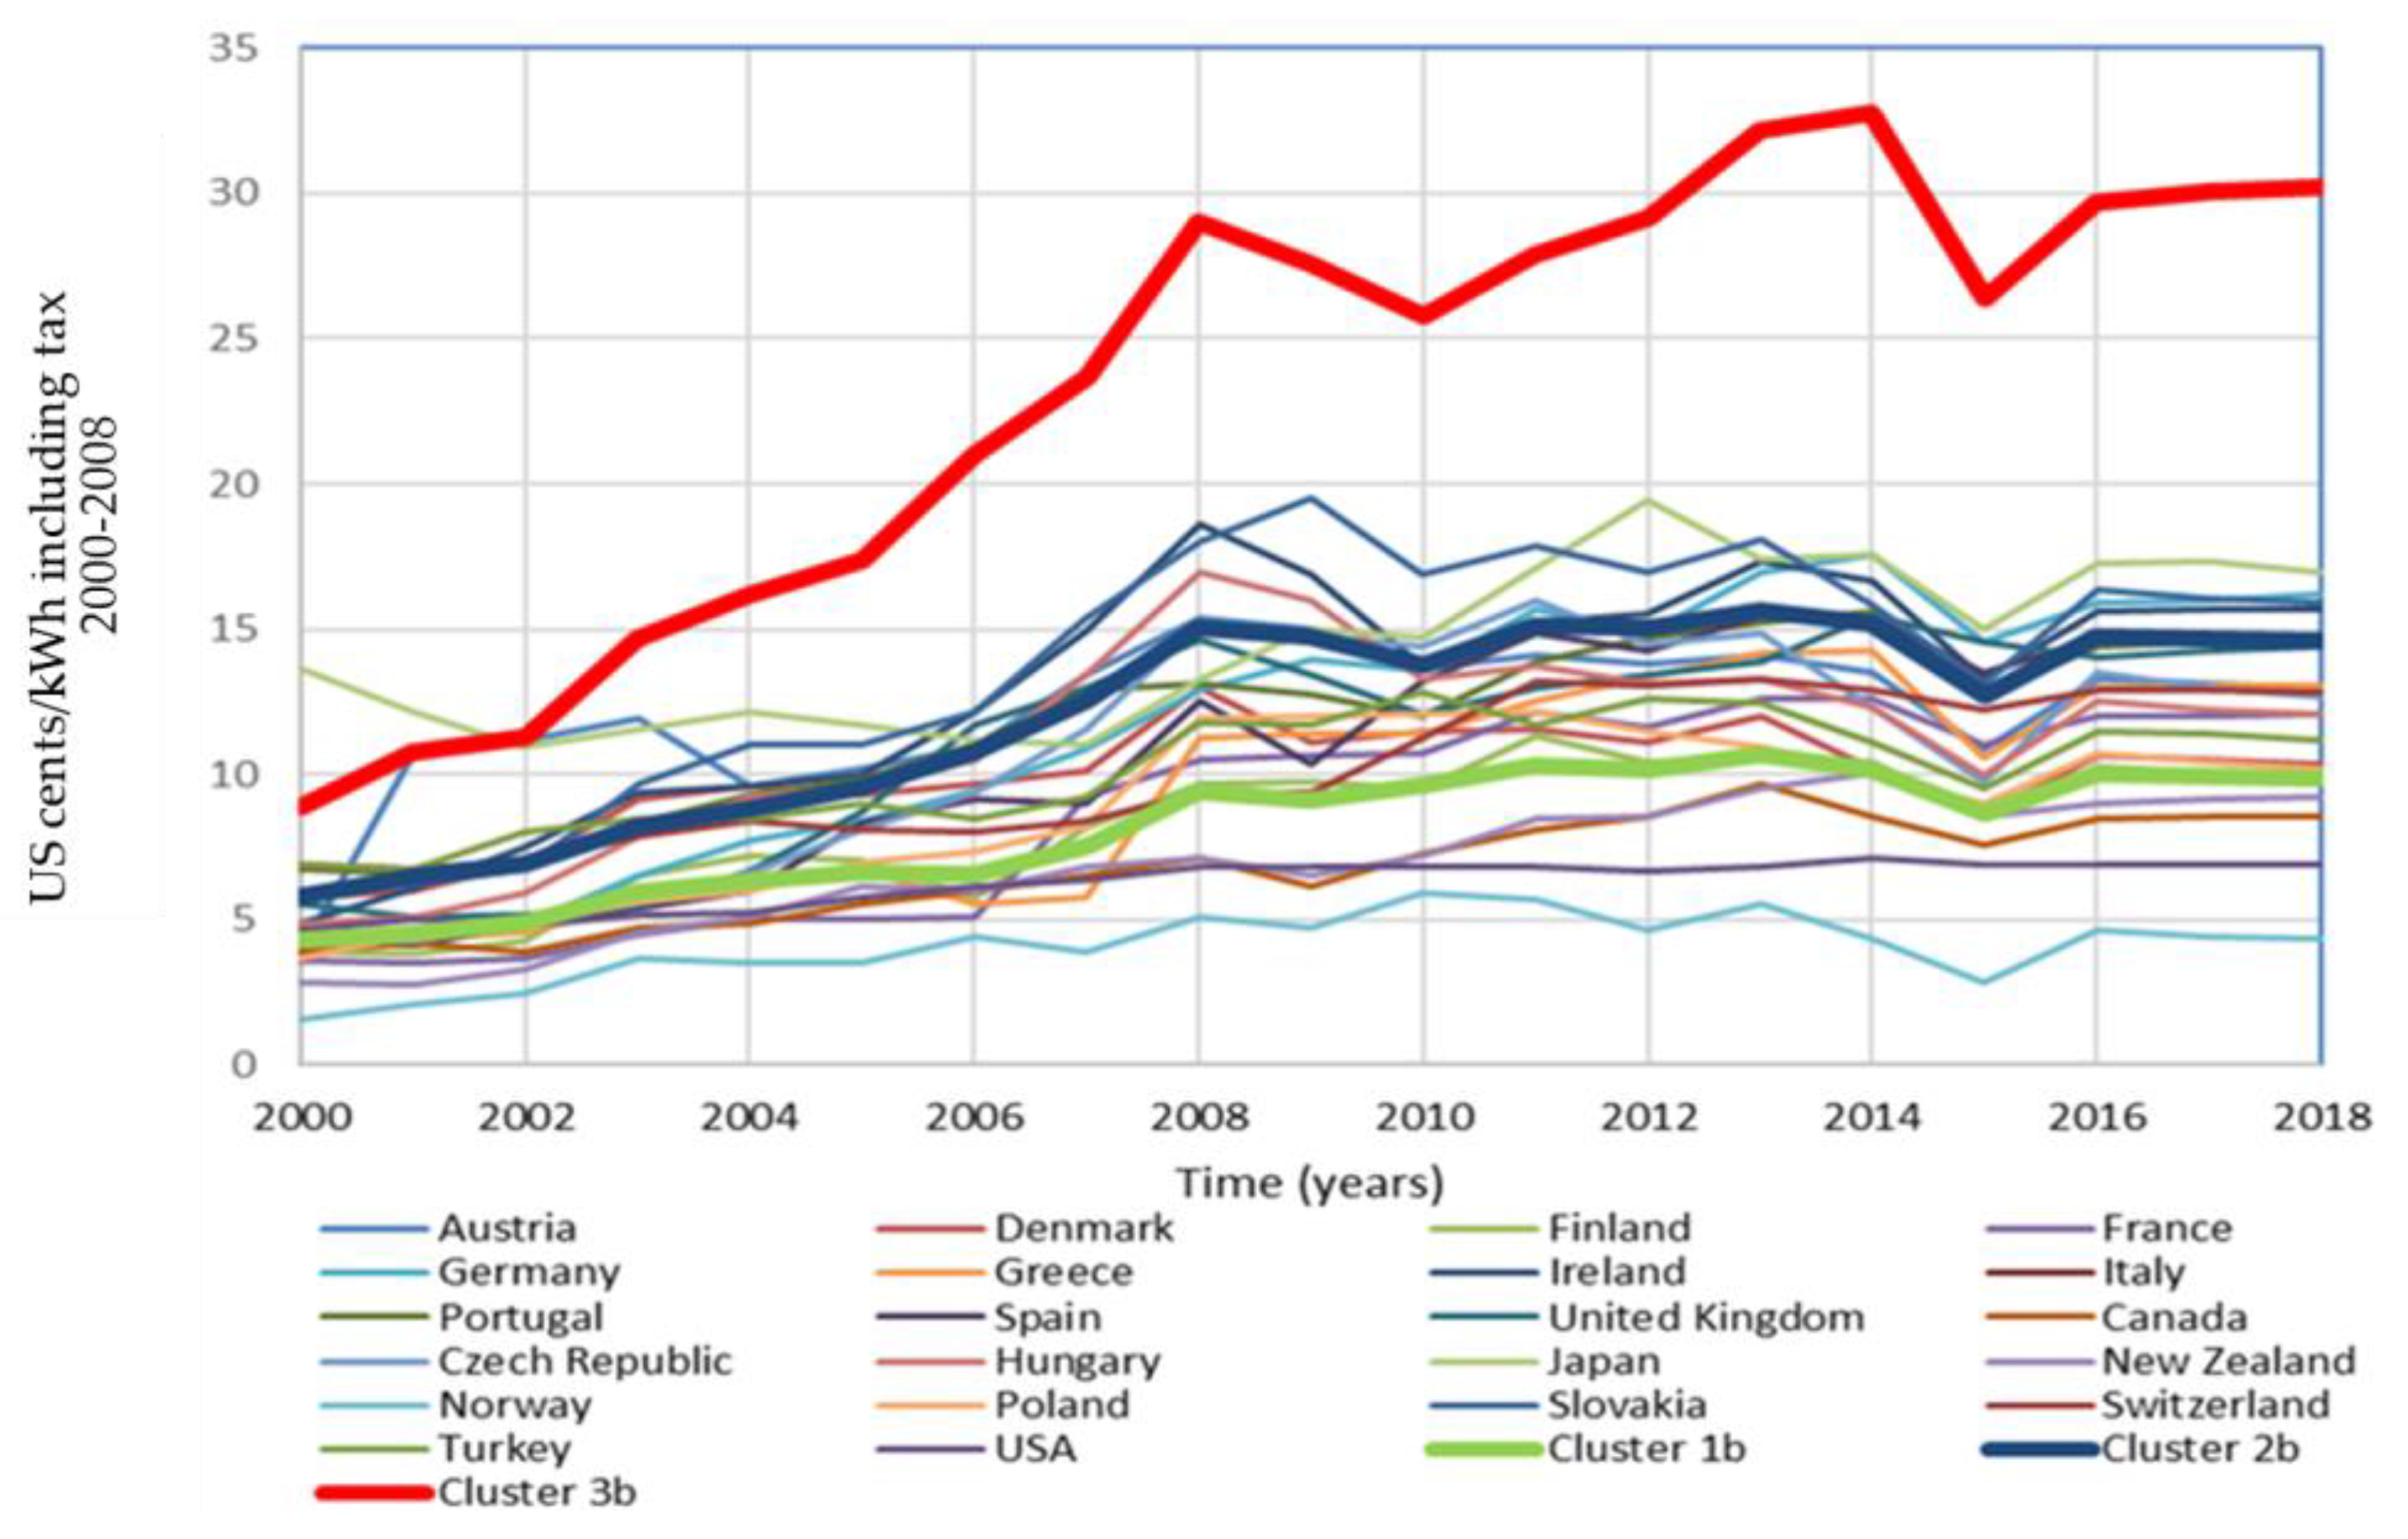
4.1.2. Industrial Electricity Pricing Including Tax

The optimal number of clusters obtained in this category of industrial pricing data was three (3). Although the optimal number of clusters for both the including tax and excluding tax categories was the same, the compactness of the clusters obtained for each category of pricing varied. The average within-cluster sum of squares obtained for the excluding tax and including tax categories were 401.64 and 551.73, respectively. This clustering metric shows that the excluding tax clusters were tighter compared to the including tax clusters and that the inclusion of taxes created more variation in prices, as shown in the boxplot in Figure 3 above. The clustering results which show the group of countries is presented in Table 2. We also present similar results showing the time-series clustering of the countries in Figure 8.
In Figure 8, we present the combined time-series plot of the 22 countries including the three clusters obtained. Figure A4, Figure A5 and Figure A6 (in Appendix A) show the time-series plot for the cluster and the cluster averages obtained.
For all the countries in the period of study, comparable upward and downward trends similar to those of the excluding tax category (Section 4.1.1) were observed. While a plateau-like pricing trend between 2010 and 2015 was observed in the prices excluding tax plots of Figure 7 (also see Appendix A Figure A1, Figure A2 and Figure A3), an increasing pricing trend was observed in the prices including tax plots of Figure 8 (also see Appendix A, Figure A4, Figure A5 and Figure A6). The majority of countries showed price movements between 5 cents/kWh and 20 cents/kWh during the 19 years of study.

4.2. Results of Regression Analysis

4.2.1. Regression Results Excluding Tax

The OLR results for IEPET are presented in this section. The first model (Model 1a) includes all the independent variables. Model 1a coefficients are presented in Table 3, and simply represented (without the mathematical formulation) in terms of the independent variables considered below:
Model 1a: Cluster (IEPET) ~ (REG) + (GDPpc) + (EIE) + (ED).
The variable EIE in Model 1a failed the POA assumption, and as discussed in Section 3.2.2. This was removed from the regression analysis to obtain Model 1b. The description of Model 1b is given as follows:
Model 1b: Cluster (IEPET) ~ (REG) + (GDPpc) + (ED). The variable ED also failed the POA assumption and was removed from the regression analysis to obtain Model 1c.
Model 1c satisfied the POA in the omnibus (Section 3.2.2) and for the individual variables (REG and GDPpc) and is simply represented as
Model 1c: Cluster (IEPET) ~ (REG) + (GDPpc).
The regression results showing the coefficient of the regression and validity of the POA (Brant test) for models 1a, 1b, and 1c are presented in Table 3.
Model 1a shows a positive association in REG and ED with IEPET. A negative association is obtained in EIE. However, the association values will not be further discussed given the failed POA of the model. Model 1b conformed to the POA assumption, although only the ED variable did not individually conform to the assumption. In Model 1c, the overall model confirmed the POA and the individual variables consisted of the REG and GDPpc. The logit coefficient and other significance tests for Model 1c (satisfying the POA) are presented in Table 4.
For the variable REG in Table 3 and Table 4, the logit coefficient is interpreted as a 0.34 increase being expected at the cluster level, given a 1% increase in renewables, assuming all other variables are kept constant. A better interpretation is that of the exponentiated value of the logit coefficient (odds ratio) in Table 4. Keeping all other variables constant when the renewable mix variable (REG) increases by 1%, it is 1.410 times more likely for the IEPET of countries to move from a lower pricing category to a higher pricing category. The association of GDPpc showed a positive effect similar to REG, although this was of a lesser magnitude, with 0.1% odds of moving to a higher pricing category. The variables REG and GDPpc are significant as shown by the p-value (p < 0.01) and confidence interval (assuming normality).

4.2.2. Regression Results Including Tax

The first model considered under the including tax category (Model 2a) consists of all the independent variables. Based on the regression experiment discussed in Section 3.2.2, other models were obtained. The description of Model 2a is given below:
Model 2a: Cluster (IEPIT) ~ (REG) + (GDPpc) + (EIE) + (ED).
The ED variable was removed from Model 2a to give Model 2b due to Model 2a’s violation of the POA. Model 2b is obtained given the description below:
Model 2b: Cluster (IEPIT) ~ (REG) + (GDPpc) + (EIE).
The regression results for Models 2a and 2b are presented in Table 5 below.
Similar to Section 4.2.1, Model 2a represents the model when all the variables are included in the regression. In Model 2a, a positive association was obtained for REG, GDPpc, and ED, while a negative association was obtained for EIE. Due to the failed POA, our discussions of Model 2a will be limited. The OLR validity for the including tax category terminates with Model 2b. The model, including its associated variables, satisfied the POA. Additionally, Model 2b showed a positive association with the ordinal dependent variable (for REG and GDPpc), while a negative association was observed for EIE. The regression results and other significance tests for Model 2b which confirms the POA are presented in Table 6 below.
The interpretation of the regression analysis of the IEPIT is also similar to that given in Section 4.2.1, except that the effect of the tax components included can be inferred. Given a 1% increase in REG, assuming all other variables are kept constant, a 4.03 increase is expected in the cluster level. Also using the exponentiated value, as REG increases by 1%, it is 56.26 times more likely for the IEPIT of the countries under study to move from a lower pricing category to a higher pricing category keeping all other variables constant.
The association of GDPpc in the category of including tax showed a similar positive effect as that of REG, although of a lesser magnitude and marginal when compared. The marginal effect is further confirmed by the odds ratio value of (1.001). The significance of the variables REG and GDPpc in the model is also shown by the p-value (p < 0.01) and the confidence interval (assuming normality). The EIE variables showed a marginal negative logit coefficient relationship. Given a 1% increase in EIE, it could be interpreted as marginally likely for IEPIT of the countries to move from a higher pricing category to a lower one. The EIE variable not being significant limits our discussion on EIE for the final Model 2b. Comparing regression results for both IEPET and IEPIT, it is observable that both % REG and GDPpc maintained their conformity to the POA through the iteration. Looking at the final models representing before-tax pricing (Model 1c) and after-tax pricing (Model 2b), it can be observed that as REG increases, the effect of the tax is amplified.
The effect of GDPpc on pricing was found to be minimal. The logit coefficient for GDPpc was approximately equal (1.001) in both cases. The EIE showed a negative association with IEPIT and conformity to the POA in the final after-tax model 2b.
For IEPET, a negative association was also observed but not in the final pre-tax model 1c. The EIE log-odds coefficient for the penultimate Model 1b (IEPET) and final Model 2b (IEPIT) suggests that as the percentage of greenhouse gas emissions increases, the tax component effect is reduced.

5. Discussion

5.1. Discussion on Cluster Analysis

In this section, we discuss the clustering results obtained, including the importance of countries falling into the different clusters.

5.1.1. Industrial Pricing Excluding Tax

As seen in Table 1, countries that were grouped in the low-price range, such as Denmark, Germany, Canada, and the US, suggest a mix of reasons that contribute to lower pricing. These reasons could range from the ability of these countries to promote favorable energy policies such as market liberalization and develop technologies that to a large extent optimize the cheap production and supply of electricity from their respective local resource endowments or imported fuel. This was also noted by [23]. The middle-price range suggests that countries that fall into this category, such as Spain, the UK, and Turkey, have, to a significant extent, been able to optimize the production of electricity from available local resources and endowments. However, various factors have contributed to a higher increase in prices compared to the low-range countries. These factors include being net energy importers, the type of fuel utilized in generating electricity (for example production from gas produces less energy at a higher cost than coal), more stringent policies on renewables, and the impact of external factors. Countries falling into the higher-price range, such as Italy, Japan, and Ireland, tend to depend more on energy imports compared to the median range group. In addition, the high cost of electricity production, transmission, and distribution has also affected electricity prices. For example, Italy has been noted to be affected by the peninsula’s geographical shape, thus resulting in different market prices of electricity [72], while in Ireland, electricity is largely generated from price-sensitive natural gas [73].
In summary, yearly inflation rate specific to each country, the amount of local energy-source endowment (e.g., weather patterns, natural fuel, and mineral resources) possessed by different countries, such as cheap fossil fuels in the US, cheap coal in Australia, inexpensive hydroelectricity in Scandinavia and Canada, cheap nuclear energy resource in France, high wind power generation in Denmark, and high solar power generation in Germany) and the cost of exploitation of these resources to a considerable measure, also contributes to the pricing category a country will fall into in comparison with other countries. Within geographically large countries such as the US, Canada, and Australia, significant internal variations in pricing can occur due to variations in the types of local resource endowments. However, the effect of internal resource endowment is not within the scope of this study.

5.1.2. Industrial Pricing Including Tax

Our clustering results classifying Italy as having very high IEP including tax might be consistent with the observation noted by [17,74]. The study period (Finnish Energy Industries, 2010) [74] is not recent but falls within our study period, which spans from 2000 to 2018. The study concluded that Italy, Germany, and the Netherlands have some of the highest electricity consumption taxes for energy-intensive industries, offering little or no relief. These results appear consistent with recent findings by [17,75,76], specifically indicating high electricity pricing in Germany. Ref. [17] specifically indicated that countries such as Germany and Italy impose higher taxes that other countries do not impose on their industrial consumers, such as the excise tax. These findings of high electricity prices due to high taxes, specifically in EU countries, are supported by [25]. Our studies align with this by indicating a move in Germany from a lower pricing category to a median category when taxes were included. In addition, Ref. [74] stated that companies in countries such as the US, Switzerland, Portugal, and Great Britain are not subjected to power consumption tax which might partly explain why the US and Switzerland still retain low prices after tax.
In their study of household electricity pricing, Ref. [75] showed that some EU countries such as Italy, Germany, Austria, and Spain had increasing pricing with all taxes included. Tax changes in countries with high prices, such as Germany, Italy, Spain, and Austria, have increased with a wide disparity, while tax changes in countries with low prices, such as the US, Norway, and Finland, have been minimal with a low disparity. A further explanation of the low pricing as revealed by [17] for Norway and other Scandinavian countries is connected to the abundance of renewable sites guaranteeing low production costs, while the US is reported to have benefited from low fuel costs.
In summary, when taxes are included, countries falling in the median range (compared to the low range) partly suggest a higher electricity consumption tax levied by the governments of such countries. In addition, the median-range end-user electricity price is also connected to the high import of energy fuels, unfavorable government policies, and external factors such as volatility in global prices of energy fuels. As discussed by [77,78,79], the impact of the COVID-19 pandemic and, more recently, the Russia–Ukraine conflict, has been an external factor affecting the global production and supply of energy. High energy prices have been noted to increase the price of consumer electricity [80]. Countries in the high-price range (such as Italy), compared to the countries falling in the median range, suggest a much higher tax component levied. This is also connected to the dependence on fossil fuel imports and the value-added tax and excise tax levied on consumers.
The box plot of our dataset in Figure 3 confirms large variability in IEPIT. The time-series plot of Figure 4 shows the extent of annual tax increases for some countries such as Germany and Italy in comparison to countries such as the US, New Zealand, Canada, and Finland, which had very low variability in taxes. Figure 3 and Figure 4, though, could indicate the extent of tax change per country but are insufficient to reveal possible related reasons for countries having similar electricity prices, as noted earlier. Also, Figure 4 may not show the contribution of the taxes as the share of renewables increases.

5.2. Discussion on Regression Analysis

5.2.1. Regression Analysis Excluding Tax (Model 1c)

Based on our results in Section 4.2.1, as the share of renewables (wind, solar PV, and solar thermal) increases, it is more likely for the IEP (IEPET) of the countries under study to shift from lower to higher pricing. Our result for GDPpc is consistent with the findings of [20,46], who showed a positive association of GDPpc with retail electricity pricing based on the EU panel data reviewed. As [20] noted, GDPpc reveals information about the structure and development of an economy. Moreover, [46] described GDPpc information as an indicator of demand metrics for electricity.

5.2.2. Regression Analysis Including Tax (Model 2b)

With the addition of taxes to IEPET and as the share of renewables increases, our association results indicate a higher chance of the countries moving to a higher pricing category. As earlier indicated, tax components have varied across countries. For example, taxes are higher in certain countries such as Italy, and Germany, while countries such as the US, France, Canada, and Denmark levy low taxes in comparison. Our results for pricing including taxes are partly consistent with the discussion of a move of countries such as Germany into a higher degree of electricity pricing due to an increase in electricity tax and high output of renewables [76].
With the introduction of taxes, GDPpc showed a similar positive association with electricity pricing data in both final models (1c and 2b). The comparative values indicate that for the period of study and based on our panel data, the effect of the introduction of taxes was not important enough to bring about a higher magnitude of a positive association of GDPpc with IEP.
EIE continued to show a negative association compared to REG and GDPpc when taxes were included. However, the association was of lesser magnitude compared to the excluding tax (Model 1a) value of EIE. The non-significance of EIE (Model 2b) even at p < 0.1 limits our discussion on the association in this section, as non-significant variables might affect the precision of the model. Looking at our regression results for IEPET and IEPIT during these 19 years, we observed that as the share of renewables increased, the contribution of taxes had a much higher impact than what price increases due to inflation would have contributed to, as seen in the prices before tax. Regression results showed 38 times greater positive association with the introduction of taxes as the share of renewables increased. Therefore, our argument based on the regression, clustering and the literature review is not whether factors such as the introduction of renewables will lead to industrial electricity price increases or not, but that the contribution of taxes has been significant in the period of study. Furthermore, our findings, while in line with the literature [20,46] about renewable technologies being attributed to price increases, also highlight that taxes are the primary reason for price increases. These reiterate the paper’s main contribution, including the clustering analysis.

6. Conclusions

Using clustering techniques IEP of end-users consisting of both prices excluding tax, termed as IEPET, and pricing after tax (IEPIT) can be studied to understand the evolution of prices as societies adapt to increases in renewable technologies. Furthermore, OLR analysis could associate explanatory factors with price movements within the cluster groupings obtained. The clustering results indicated three (3) different IEP groups, excluding and including tax. Each group had a low-price range, median-price range, and high-price range. Countries with high dependence on energy imports, unfavorable production environment, or inadequate local energy sources are more likely to fall within the medium to higher range of electricity pricing groups, both before and after-tax components are included.
The IEPET and IEPIT data showed an increasing trend from 2000 to 2018, though certain periods of price decreases were observed within the years. The periods of the electricity price study (either quarterly or annually) highlight the increasing or decreasing IEP. Taxes, inflation, and external factors might have contributed to the price increases over the 19 years in the study, but the contribution of taxes has been more significant.
The findings of this research are useful in several ways. Firstly, they help identify key factors contributing to increasing or decreasing IEP. Regression results show that taxes have an amplifying effect on IEP, as a function of the share of renewable energy varies. This implies that with adequate monitoring and evaluation of tax regulations, countries can manage the pricing increases after tax. Secondly, individual countries can understand the types of national energy policies, technological developments, or tax interventions in the industrial sectors that have been beneficial in keeping prices low or high. For example, the policies for green energy alternatives introduced by the US and Germany have had different effects on electricity pricing [76]. While taxes (and prices to some extent) have soared in Germany and Italy, prices have remained stable in the US. Countries within the same region, such as the EU, with interconnections in energy markets, can also institute better policies to ensure that their pricing is not far below or far above the average pricing in the region. Thirdly, developing economies that have been fossil fuel-dependent and with a growing industrial base, will find studies about IEP useful when transitioning their electricity technology portfolio. Based on this study, additional factors that could cause countries to fall in the median- and high-range IEPET and IEPIT include the high cost of energy production. This can result in high living standards for people in such countries, as industries often transfer high production costs of goods and services to final consumers. Countries with low-range pricing can take advantage of their cheaper electricity pricing to further grow their industrial base and export electricity to other countries.
Based on the regression results, it may be argued that a reduction in renewables (thereby increasing fossil fuels use) will be a justifiable pathway to a reduction in industrial electricity pricing. However, the environmental cost (particularly external costs) associated with non-renewable electricity generation, outweighs the increases in pricing due to taxes [46]. Therefore, it would be counterintuitive to focus on reducing renewable electricity generation to avoid increasing prices in the short run. Rather, the focus should be on reducing the environmental cost associated with non-renewable electricity generation in the long run.
Similar investigations in non-OECD regions, such as Africa, Latin America, and parts of Asia, may reveal other interesting conclusions. Obtaining good-quality historical datasets for these regions is a challenge [81]. Furthermore, studies on electricity price variation within large countries (such as the USA and Canada) rather than using annual single pricing could reveal additional insights. A comparative analysis of household and industrial electricity pricing patterns could offer further insights into the discussion of electricity pricing for better policy formulation and industry use.
The grouping of countries into clusters presents an average overall effect of the independent factors on the IEP data. The association between pricing and renewable energy considered in this study could be enhanced by integrating additional renewable sources, such as hydroelectric energy and bioenergy. Developing countries face additional social and economic development pressures compared to OECD countries. In such cases, multi-criteria analysis can be used to consider explanatory factors such as regulatory systems and other possible qualitative factors that can have an impact on industrial electricity prices. Lastly, using other econometric/regression models and validity tests that can investigate some of the variables that did not conform to the POA of the OLR analysis could provide new directions.

Author Contributions

Conceptualization, G.A.T.; methodology, G.J.O. and G.A.T.; software, G.J.O.; validation, G.J.O. and G.A.T.; formal analysis, G.J.O.; investigation, G.J.O.; resources, G.J.O. and G.A.T.; data curation, G.J.O.; writing—original draft preparation, G.J.O.; writing—review and editing, G.J.O. and G.A.T.; visualization, G.J.O.; supervision, G.A.T.; project administration, G.A.T. and G.J.O. All authors have read and agreed to the published version of the manuscript.

Funding

This research received no external funding.

Data Availability Statement

Conflicts of Interest

The authors declare no conflicts of interest.

Appendix A

Table A1. Literature on industrial electricity pricing in relation to renewable energy/taxes.
Reference Number.Period of Study/Data Country/Sector of StudyMethodsFindings
[22]1990 to 2021Russia/Power industryEconometric analysisEconomic growth, financial development and CO2 emissions increase electricity use, while renewables lower this in the long run
[23]2000 to 202127 EU Countries and UKData gathering and nomenclature of territorial units for statistical geographical classificationCountries with high energy demand are leading the shift to renewable energy
[24]2010 to 2016AustraliaFixed effect regression analysisCarbon tax has a significant impact on wholesale electricity prices and creates energy substitution effects
[25]2007 to 2016EU 28 Countries plus NorwayPanel vector autoregressive estimation approachHigh electricity taxes result in high electricity prices and further promote responsible production and consumption
[26]1990 to 2010PolandMultivariate quantile on quantile regression with Granger causalityEffective carbon taxes and an increase in renewables are crucial policies for reducing emissions
[27]1981 to 2016India/Industrial electricityTwo-threshold non-linear auto regressive distributed lag modelEffect on reaching net-zero emissions when industrial electricity prices are lowered
[28]2023Korea/Baland Industrial ComplexSystems model analysisThe critical role of regional electricity tariffs and carbon pricing in energy system feasibility
[31]2024 to 2050China/Zhejiang regionComputable general equilibrium modelCarbon taxes are less effective than carbon emissions control, and stricter carbon pricing leads to a reduction in carbon intensity, but slows GDP
[29]2003 to 2019China/285 Chinese citiesDifference-in Difference-methodologyCities subscribing to critical peak industrial electricity pricing had a reduction in greenhouse gas emissions
[30]2006 to 2016China/Chinese Industrial listed EnterprisesRamseys optimal pricing and slacks-based measure Directional distance functionElectricity price cross-subsidies, affect the green factor’s total productivity by improving resource allocation
Table A2. Key Abbreviations for the Study.
AbbreviationFull Meaning
IEPIndustrial electricity pricing
REGShare of renewables generated
IEPETIndustrial electricity pricing excluding tax
IEPITIndustrial electricity pricing including tax
TEGTotal electricity generated per year
TWH Terawatt hour
GDPpcGross domestic product per capita
EIEGreenhouse gas emissions by energy industries as a percentage of total emissions
EDEnergy dependency
OLROrdinal logistic regression
POAProportional odds assumption
Table A3. Descriptive statistics for the data input.
Data TypeNumber of ObservationsMinimum ValueMaximum ValueMeanStandard Deviation
IEPET (US cents)4181.58013922.946759.7000914.063308
IEPIT (US cents)4181.58013932.7651410.645325.050645
REG4180.0000000.510.0510.077
GDPpc4187774.4824,262,321386,160.4966,938.0
EIE4186.0648.8127.9511.04
ED418−843.48187993.98126011.192270149.064917
Figure A1. Plot of countries within the low-range pricing cluster (excluding tax).
Energies 18 02026 g0a1
Figure A2. Plot of countries within the median-range pricing cluster (excluding tax).
Energies 18 02026 g0a2
Figure A3. Plot of countries within the high-range pricing cluster (excluding tax).
Energies 18 02026 g0a3
Figure A4. Plot of countries within the low-range pricing cluster (including tax).
Energies 18 02026 g0a4
Figure A5. Plot of countries within the median-range pricing cluster (including tax).
Energies 18 02026 g0a5
Figure A6. Plot of the countries within the high-range pricing cluster (including tax). Italy falls within cluster 3b.
Energies 18 02026 g0a6

References

  1. Xu, D.; Abbas, S.; Rafique, K.; Ali, N. The race to net-zero emissions: Can green technological innovation and environmental regulation be the potential pathway to net-zero emissions? Technol. Soc. 2023, 75, 102364. [Google Scholar] [CrossRef]
  2. Xenos, D.P.; Noor, I.M.; Matloubi, M.; Cicciotti, M.; Haugen, T.; Thornhill, N.F. Demand-side management and optimal operation of industrial electricity consumers: An example of an energy-intensive chemical plant. Appl. Energy 2016, 182, 418–433. [Google Scholar] [CrossRef]
  3. Fischer, D.; Surmann, A.; Lindberg, K.B. Impact of emerging technologies on the electricity load profile of residential areas. Energy Build. 2020, 208, 109614. [Google Scholar] [CrossRef]
  4. Irandoust, M. Innovations and renewables in the Nordic countries: A panel causality approach. Technol. Soc. 2018, 54, 87–92. [Google Scholar] [CrossRef]
  5. Aziz, S.; Jahan, S.M. Determinants of international development investments in renewable energy in developing countries. Energy Sustain. Dev. 2023, 74, 215–230. [Google Scholar] [CrossRef]
  6. Wang, K.; Yu, M.; Niu, D.; Liang, Y.; Peng, S.; Xu, X. Short-term electricity price forecasting based on similarity day screening, two-layer decomposition technique and Bi-LSTM neural network. Appl. Soft Comput. 2023, 136, 110018. [Google Scholar] [CrossRef]
  7. Macedo, D.P.; Marques, A.C.; Damette, O. The impact of the integration of renewable energy sources in the electricity price formation: Is the Merit-Order Effect occurring in Portugal? Util. Policy 2020, 66, 101080. [Google Scholar] [CrossRef]
  8. Dehghan, H.; Amin-Naseri, M.R. A simulation-based optimization model to determine optimal electricity prices under various scenarios considering stakeholders’ objectives. Energy 2022, 238, 121853. [Google Scholar] [CrossRef]
  9. Cieplinski, A.; D’alessandro, S.; Marghella, F. Assessing the renewable energy policy paradox: A scenario analysis for the Italian electricity market. Renew. Sustain. Energy Rev. 2021, 142, 110838. [Google Scholar] [CrossRef]
  10. Kolb, S.; Dillig, M.; Plankenbühler, T.; Karl, J. The impact of renewables on electricity prices in Germany-An update for the years 2014–2018. Renew. Sustain. Energy Rev. 2020, 134, 110307. [Google Scholar] [CrossRef]
  11. Lebepe, P.; Mathaba, T.N.D. Impact assessment of electricity shortage on enterprises: A systematic literature review. Energy Sustain. Dev. 2024, 81, 101468. [Google Scholar] [CrossRef]
  12. Koster, G.; Van Sark, W.; Ricker, B. Solar potential for social benefit: Maps to sustainably address energy poverty utilizing open spatial data in data poor settings. Energy Sustain. Dev. 2024, 80, 101453. [Google Scholar] [CrossRef]
  13. Li, K.; Yuan, W. The nexus between industrial growth and electricity consumption in China–New evidence from a quantile-on-quantile approach. Energy 2021, 231, 120991. [Google Scholar] [CrossRef]
  14. Ai, H.; Xiong, S.; Li, K.; Jia, P. Electricity price and industrial green productivity: Does the “low-electricity price trap” exist? Energy 2020, 207, 118239. [Google Scholar] [CrossRef]
  15. González, J.S.; Alonso, C.Á. Industrial electricity prices in Spain: A discussion in the context of the European internal energy market. Energy Policy 2021, 1148, 111930. [Google Scholar] [CrossRef]
  16. Yang, Y.; Faruqui, A. Reducing electricity prices and establishing electricity markets in China: Dos and don’ts. Electr. J. 2019, 32, 106633. [Google Scholar] [CrossRef]
  17. International-Energy-Agency. Electricity Market Report—December 2020-Report Extract 2020 Global Overview: Price. 2020. Available online: https://www.iea.org/reports/electricity-market-report-december-2020/2020-global-overview-prices (accessed on 30 December 2024).
  18. Trebbien, J.; Rydin Gorjão, L.; Praktiknjo, A.; Schäfer, B.; Witthaut, D. Understanding electricity prices beyond the merit order principle using explainable AI. Energy AI 2023, 13, 100250. [Google Scholar] [CrossRef]
  19. Adom, P.K.; Insaidoo, M.; Minlah, M.K.; Abdallah, A.-M. Does renewable energy concentration increase the variance/uncertainty in electricity prices in Africa? Renew. Energy 2017, 107, 81–100. [Google Scholar] [CrossRef]
  20. Del-Río, B.; Fernández-Sainz, A.; De Alegria, I.M. Industrial electricity prices in the European Union following restructuring: A comparative panel-data analysis. Util. Policy 2019, 60, 100956. [Google Scholar] [CrossRef]
  21. Moreno, B.; García-Álvarez, M.T.; Ramos, C.; Fernández-Vázquez, E.A. General Maximum Entropy Econometric approach to model industrial electricity prices in Spain: A challenge for the competitiveness. Appl. Energy 2014, 135, 815–824. [Google Scholar] [CrossRef]
  22. Kilinc-Ata, N.; Proskuryakova, L.N. Empirical analysis of the Russian power industry’s transition to sustainability. Util. Policy 2023, 82, 101586. [Google Scholar] [CrossRef]
  23. Hassan, Q.; Nassar, A.K.; Al-Jiboory, A.K.; Viktor, P.; Telba, A.A.; Awwad, E.M.; Amjad, A.; Fakhruldeen, H.F.; Algburi, S.; Mashkoor, S.C.; et al. Mapping Europe renewable energy landscape: Insights into solar, wind, hydro, and green hydrogen production. Technol. Soc. 2024, 77, 102535. [Google Scholar] [CrossRef]
  24. Gonçalves, R.; Menezes, F. The carbon tax and the crisis in Australia’s National Electricity Market. Energy Econ. 2024, 133, 107522. [Google Scholar] [CrossRef]
  25. Karimu, A.; Bali Swain, R. Implication of electricity taxes and levies on sustainable development goals in the European Union. Energy Policy 2023, 177, 113553. [Google Scholar] [CrossRef]
  26. Musibau, H.; Gold, K.L.; Abdulrasheed, Z.; Muili, H.A. Poland’s net-zero pathways: Moderating role of carbon tax and renewable energy on electricity generation through a novel multivariate quantile-on-quantile regression approach. J. Environ. Manage. 2025, 380, 124848. [Google Scholar] [CrossRef]
  27. Tran, N.D.; Sahu, N.C. Asymmetric price response of industrial electricity demand in India. Util. Policy 2023, 82, 101552. [Google Scholar] [CrossRef]
  28. Kang, M.; Park, S.; Cho, K. An Empirical Study of the Economic Net-Zero Energy Mix in Industrial Complexes. Energies 2024, 17, 5404. [Google Scholar] [CrossRef]
  29. Wang, K.; Zhong, C.; Yu, R. The greenhouse gas reduction effect of critical peak pricing for industrial electricity: Evidence from 285 Chinese cities, 2003–2019. Energy Policy 2024, 190, 114147. [Google Scholar] [CrossRef]
  30. Xie, L.; Huang, Z. Electricity price cross-subsidies and enterprises’ green total factor productivity: Empirical evidence from Chinese industrial listed enterprises. J. Asian Econ. 2025, 96, 101848. [Google Scholar] [CrossRef]
  31. Shi, B.; Jiang, Q.; Shi, M.; Managi, S. Exploring the Effects of Carbon Pricing and Carbon Quota Control on the Energy Transition Towards Carbon Neutrality: A Computable General Equilibrium Analysis of the Zhejiang Region of China. Energies 2025, 18, 1029. [Google Scholar] [CrossRef]
  32. Oyewole, G.J.; Thopil, G.A. Data clustering: Application and trends. Artif. Intell. Rev. 2023, 56, 6439–6475. [Google Scholar] [CrossRef] [PubMed]
  33. Heistrene, L.; Machlev, R.; Perl, M.; Belikov, J.; Baimel, D.; Levy, K.; Mannor, S.; Levron, Y. Explainability-based Trust Algorithm for electricity price forecasting models. Energy AI 2023, 14, 100259. [Google Scholar] [CrossRef]
  34. Iwabuchi, K.; Kato, K.; Watari, D.; Taniguchi, I.; Catthoor, F.; Shirazi, E.; Onoye, T. Flexible electricity price forecasting by switching mother wavelets based on wavelet transform and Long Short-Term Memory. Energy AI 2022, 10, 100192. [Google Scholar] [CrossRef]
  35. Rhodes, J.D.; Cole, W.J.; Upshaw, C.R.; Edgar, T.F.; Webber, M.E. Clustering analysis of residential electricity demand profiles. Appl. Energy 2014, 135, 461–471. [Google Scholar] [CrossRef]
  36. Motlagh, O.; Berry, A.; O’neil, L. Clustering of residential electricity customers using load time series. Appl. Energy 2019, 237, 11–24. [Google Scholar] [CrossRef]
  37. Liu, C.; Wang, X.; Huang, Y.; Liu, Y.; Li, R.; Li, Y.; Liu, J. A Moving Shape-based Robust Fuzzy K-modes Clustering Algorithm for Electricity Profiles. Electr. Power Syst. Res. 2020, 187, 106425. [Google Scholar] [CrossRef]
  38. Müller, I.M. Feature selection for energy system modeling: Identification of relevant time series information. Energy AI 2021, 4, 100057. [Google Scholar] [CrossRef]
  39. Ruiz, L.; Pegalajar, M.; Arcucci, R.; Molina-Solana, M.A. Time-Series Clustering Methodology for Knowledge Extraction in Energy Consumption Data. Expert Syst. Appl. 2020, 160, 113731. [Google Scholar] [CrossRef]
  40. Salehi, M.; Rezaei, M.M. An improved probabilistic load flow in distribution networks based on clustering and Point estimate methods. Energy AI 2023, 14, 100272. [Google Scholar] [CrossRef]
  41. Gov.UK. International Industrial Energy Prices. 2024. Available online: https://www.gov.uk/government/statistical-data-sets/international-industrial-energy-prices (accessed on 19 October 2024).
  42. Department-For-Business-Energy & Industrial-Strategy. International Comparisons—Data Sources and Methodologies. 2014. Available online: https://assets.publishing.service.gov.uk/government/uploads/system/uploads/attachment_data/file/647135/International_price_methodology_-_updated_Sept_2017.pdf (accessed on 19 October 2024).
  43. OECD-Data. Exchange Rates. 2020. Available online: https://data.oecd.org/conversion/exchange-rates.htm (accessed on 19 October 2024).
  44. International-Energy-Agency. World Energy Balances: Overview. 2020. Available online: https://www.iea.org/reports/world-energy-balances-overview (accessed on 27 April 2024).
  45. THE-WORLD-BANK-DATABANK. World Development Indicators. 2020. Available online: https://databank.worldbank.org/source/world-development-indicators (accessed on 27 April 2024).
  46. Oosthuizen, A.M.; Inglesi-Lotz, R.; Thopil, G.A. The relationship between renewable energy and retail electricity prices: Panel evidence from OECD countries. Energy 2022, 238, 121790. [Google Scholar] [CrossRef]
  47. OECD-Data. Air and GHG Emissions, OECD Air and Climate Statistics. 2021. Available online: https://www.oecd-ilibrary.org/environment/air-and-ghg-emissions/indicator/english_93d10cf7-en (accessed on 15 August 2024).
  48. European-Commission. Climate Action: EU Emissions Trading System (EU ETS). Available online: https://climate.ec.europa.eu/eu-action/eu-emissions-trading-system-eu-ets_en (accessed on 10 August 2024).
  49. THE-WORLD-BANK. Energy Imports, Net (% of Energy Use). 2018. Available online: https://data.worldbank.org/indicator/EG.IMP.CONS.ZS (accessed on 25 July 2024).
  50. Moreno, B.; López, A.J.; García-Álvarez, M.T. The electricity prices in the European Union. The role of renewable energies and regulatory electric market reforms. Energy 2012, 48, 307–313. [Google Scholar] [CrossRef]
  51. Charrad, M.; Ghazzali, N.; Boiteau, V.; Niknafs, A. Determining the Best Number of Clusters in a Data Set. 2015. Available online: https://bioconductor.statistik.tu-dortmund.de/cran/web/packages/NbClust/NbClust.pdf (accessed on 9 April 2024).
  52. Venables, W.; Ripley, B. Modern Applied Statistics; Fourth, S., Ed.; Springer: New York, NY, USA, 2002. [Google Scholar]
  53. Hlavac, M. Stargazer: Well-Formatted Regression and Summary Statistics Tables Package, Version 5.2.1; 2018. Available online: https://cran.R-project.org/package=stargazer (accessed on 27 April 2024).
  54. Xu, R.; Wunsch, D.C. Clustering algorithms in biomedical research: A review. IEEE Rev. Biomed. Eng. 2010, 3, 120–154. [Google Scholar] [CrossRef] [PubMed]
  55. Pereira, M.M.; Frazzon, E.M. A data-driven approach to adaptive synchronization of demand and supply in omni-channel retail supply chains. Int. J. Inf. Manag. 2021, 57, 102165. [Google Scholar] [CrossRef]
  56. Carreon, A.; Barwey, S.; Raman, V. A generative adversarial network (GAN) approach to creating synthetic flame images from experimental data. Energy AI 2023, 13, 100238. [Google Scholar] [CrossRef]
  57. Liao, T.W. Clustering of time series data—A survey. Pattern Recognit. 2005, 38, 1857–1874. [Google Scholar] [CrossRef]
  58. Al-Wakeel, A.; Wu, J. K-means based cluster analysis of residential smart meter measurements. Energy Procedia 2016, 88, 754–760. [Google Scholar] [CrossRef]
  59. Rajabi, A.; Eskandari, M.; Ghadi, M.J.; Li, L.; Zhang, J.; Siano, P. A comparative study of clustering techniques for electrical load pattern segmentation. Renew. Sustain. Energy Rev. 2020, 120, 109628. [Google Scholar] [CrossRef]
  60. Zhou, Y. Advances of machine learning in multi-energy district communities—Mechanisms, applications and perspectives. Energy AI 2022, 10, 100187. [Google Scholar] [CrossRef]
  61. Nguyen, H.-T.; Domingo, P.; Vervisch, L.; Nguyen, P.-D. Machine learning for integrating combustion chemistry in numerical simulations. Energy AI 2021, 5, 100082. [Google Scholar] [CrossRef]
  62. Sekula, M.N. OptCluster: An R Package for Determining the Optimal Clustering Algorithm and Optimal Number of Clusters. Master’s Thesis, University of Louisville, Louisville, KY, USA, 2015. [Google Scholar]
  63. Sanguineti, F.; Maran, T. Navigating the clouds: Cultural influences on technology acceptance in the workplace. Technol. Soc. 2024, 77, 102553. [Google Scholar] [CrossRef]
  64. Liu, X.; Koirala, H. Ordinal regression analysis: Using generalized ordinal logistic regression models to estimate educational data. J. Mod. Appl. Stat. Methods 2012, 11, 21. [Google Scholar] [CrossRef]
  65. Brant, R. Assessing proportionality in the proportional odds model for ordinal logistic regression. Biometrics 1990, 46, 1171–1178. [Google Scholar] [CrossRef] [PubMed]
  66. Bilder, C.R.; Loughin, T.M. Analysis of Categorical Data with R; CRC Press: Boca Raton, FL, USA, 2014. [Google Scholar]
  67. UCLA:-STATISTICAL-CONSULTING-GROUP. How Do I Interpret the Coefficients in an Ordinal Logistic Regression in R? 2021. Available online: https://stats.idre.ucla.edu/r/faq/ologit-coefficients/ (accessed on 22 January 2024).
  68. Mauracher, C.; Procidano, I.; Valentini, M. How Product Attributes and Consumer Characteristics Influence the WTP, Resulting in a Higher Price Premium for Organic Wine. Sustainability 2019, 11, 1428. [Google Scholar] [CrossRef]
  69. Kasza, J.; Wolfe, R. Interpretation of commonly used statistical regression models: Interpretation of regression models. Respirology 2014, 19, 14–21. [Google Scholar] [CrossRef]
  70. Fullerton, A.S.; Xu, J. The proportional odds with partial proportionality constraints model for ordinal response variables. Soc. Sci. Res. 2012, 41, 182–198. [Google Scholar] [CrossRef]
  71. Schlegel, B.; Steenbergen, M. Brant: Test for Parallel Regression Assumption. R Package Version 0.2-0. 2020. Available online: https://benjaminschlegel.ch/r/brant/ (accessed on 17 February 2025).
  72. Ghiani, E.; Galici, M.; Mureddu, M.; Pilo, F. Impact on Electricity Consumption and Market Pricing of Energy and Ancillary Services during Pandemic of COVID-19 in Italy. Energies 2020, 13, 3357. [Google Scholar] [CrossRef]
  73. Gore, K.; Rigot-Müller, P.; Coughlan, J. Cost-benefit assessment of shore side electricity: An Irish perspective. J. Environ. Manag. 2023, 326, 116755. [Google Scholar] [CrossRef]
  74. Finnish-Energy-Industries. Energy Taxation in Europe, Japan and The United States. 2010. Available online: https://www.elektormagazine.com/news/Energy-Taxation-in-Europe--Japan-and-The-United-States (accessed on 9 April 2024).
  75. Peña, J.I.; Rodríguez, R. Are EU’s Climate and Energy Package 20-20-20 targets achievable and compatible? Evidence from the impact of renewables on electricity prices. Energy 2019, 183, 477–486. [Google Scholar] [CrossRef]
  76. IEEE-Spectrum. Germany’s Energiewende, 20 Years-Later. 2020. Available online: https://spectrum.ieee.org/energy/renewables/germanys-energiewende-20-years-later? (accessed on 9 April 2024).
  77. Halbrügge, S.; Schott, P.; Weibelzahl, M.; Buhl, H.U.; Fridgen, G.; Schöpf, M. How did the German and other European electricity systems react to the COVID-19 pandemic? Appl. Energy 2021, 285, 116370. [Google Scholar] [CrossRef]
  78. Min, H. Examining the Impact of Energy Price Volatility on Commodity Prices from Energy Supply Chain Perspectives. Energies 2022, 15, 7957. [Google Scholar] [CrossRef]
  79. Aguirre, G.; Lazo, J.; Watts, D. Regulatory response to COVID-19 in the Ibero-American electricity sector: Policy implications and critical analysis of support measures. Energy Policy 2023, 183, 113852. [Google Scholar] [CrossRef]
  80. Khudaykulova, M.; Yuanqiong, H.; Khudaykulov, A. Economic Consequences and Implications of the Ukraine-Russia War. Int. J. Manag. Sci. Bus. Adm. 2022, 8, 44–52. [Google Scholar] [CrossRef]
  81. Zhai, Z.; Zhang, L.; Hou, X.; Yang, Q.; Huang, Z. Price elasticity of electricity demand in China—A new instrument variable based on marketization policy. Energy Sustain. Dev. 2023, 76, 101275. [Google Scholar] [CrossRef]
Figure 1. Boxplot of industrial electricity pricing excluding tax (IEPET) dataset 2000–2018.
Energies 18 02026 g001
Figure 2. Boxplot of industrial electricity pricing including tax (IEPIT) dataset 2000–2018.
Energies 18 02026 g002
Figure 3. Boxplot of the percentage difference of IEPIT and IEPET: 2000 to 2018.
Energies 18 02026 g003
Figure 4. Year-by-year change in tax (in %): 2000 to 2018.
Energies 18 02026 g004
Figure 5. Summary of methods employed in the study.
Energies 18 02026 g005
Figure 6. Regression analysis procedure in this study.
Energies 18 02026 g006
Figure 7. Plot of countries and clusters obtained for IEPET.
Energies 18 02026 g007
Figure 8. Plot of countries and clusters obtained for IEPIT.
Energies 18 02026 g008
Table 1. IEPET showing price categories or ranges (Excluding tax).
Cluster 1a (Low-Range)
Price Range (Cents/kWh):
3.954–8.622
Cluster 2a (Median-Range)
Price Range (Cents/kWh):
5.373–12.253
Cluster 3a (High-Range)
Price Range (Cents/kWh):
7.898–16.666
DenmarkAustriaIreland
FinlandPortugalItaly
FranceSpainJapan
GreeceUKSlovakia
GermanyCzech Republic
CanadaHungary
New ZealandSwitzerland
NorwayTurkey
Poland
USA
Table 2. IEPIT clusters of countries with price categories or ranges (including tax).
Cluster 1b (Low-Range)
Price Range (Cents/kWh):
4.331–9.877
Cluster 2b (Median-Range)
Price Range (Cents/kWh):
5.808–14.606
Cluster 3b (High-Range)
Price Range (Cents/kWh):
8.893–30.200
DenmarkAustria
FinlandGermanyItaly
FranceIreland
GreecePortugal
CanadaSpain
New ZealandUK
NorwayCzech Republic
PolandHungary
SwitzerlandJapan
TurkeySlovakia
USA
Table 3. IEPET regression models and Brant tests towards satisfying POA.
Independent
Variables
Model
1a
Logit Coefficient
Model 1a
Brant Test
Model
1b
Logit Coefficient
Model 1b
Brant Test
Model
1c
Logit Coefficient
Model 1c
Brant Test
REG1.23690.82−0.14060.980.34340.7
GDPpc0.00610.110.00050.110.00070.2
EIE−0.05770.02----
ED0.02860.060.03260.02--
Model (All variables) *n/a0.03n/a0.06n/a0.4
* Brant’s test for this indicates whether the model representing all variables violates or supports the proportionality assumption. Brant tests values < 0.05 mean that the model violates POA and values ≥ 0.05 mean that it supports POA. - Variable not included in the model due to previous violations of the proportional odds assumption (POA). n/a: no coefficient values are returned.
Table 4. Regression results for Model 1c satisfying the POA.
Independent
Variable
Logit Coefficient (Log Odds)Odds RatioStd Errort-Valuep-Value95%
Confidence Interval for Logit Coefficient
(2.5%, 97.5%)
REG0.34341.410 ***0.0059394.440(0.3318, 0.35502)
GDPpc0.00071.001 ***0.00015.210(0.0004, 0.0009)
Significant at *** p < 0.01 and also with confidence interval. A narrow confidence interval as shown by the upper and lower limit suggests precision at the estimate of the log-odds.
Table 5. IEPIT regression model results with variables satisfying the POA.
Independent
Variables
Model 2a
Logit Coefficient
Model 2a
Brant Test
Model 2b
Logit Coefficient
Model 2b
Brant Test
REG4.80690.274.030.37
GDPpc0.00030.060.00050.07
EIE−0.00870.54−0.00810.93
ED0.03270 -
Model (All variables) *n/a0n/a0.25
* Brant’s test for this indicates whether the model representing all variables violates or supports the proportionality assumption. Brant tests values < 0.05 mean that the model violates POA and values >= 0.05 mean that it supports POA. - Variable not included in the model due to previous violations of the POA or incomplete data, n/a: no coefficient values are returned.
Table 6. Regression results for Model 2b.
Independent VariableLogit Coefficient (Log −Odds)Odds RatioStd Errort-Valuep-Value95%
Confidence Interval for Logit Coefficient
(2.5%, 97.5%)
REG4.0356.26 ***0.0061652.100.00(4.0179, 4.0421)
GDPpc0.00051.001 ***0.00014.84710.00(0.0003, 0.0007)
EIE−0.00810.9920.009−0.90710.36(−0.0258, 0.0094)
Significant at *** p < 0.01, and also with the confidence interval. A narrow confidence interval, as shown by the upper and lower limits, suggests precision at the estimate of the log-odds.
Disclaimer/Publisher’s Note: The statements, opinions and data contained in all publications are solely those of the individual author(s) and contributor(s) and not of MDPI and/or the editor(s). MDPI and/or the editor(s) disclaim responsibility for any injury to people or property resulting from any ideas, methods, instructions or products referred to in the content.

