

Low-Temperature Performance and Durability of Electric Vehicle Battery Cells Under Isothermal Conditions

Abstract
1. Introduction
2. Methods
2.1. Cell Selection
- The availability of EV packs such that test cells could be extracted;
- The prevalence of the respective EVs within the Canadian market;
- The diversity in physical size, format, and capacity of the chosen cells and the EV architecture from which they were extracted.
2.2. Performance Evaluation
- Provide an overview of baseline performance;
- Estimate the general state of health of the test cells;
- Establish limits of operation.
2.3. Durability Evaluation
- Determine an absolute value for useful service life (if possible in testing timeframe) under laboratory controlled conditions;
- Establish the cell aging trends at various operating conditions, which can inform numerical models.
2.4. Testing Apparatus
3. Results
4. Discussion
Parametrization of Battery Models
5. Conclusions
Author Contributions
Funding
Data Availability Statement
Conflicts of Interest
References
- Jaguemont, J.; Boulon, L.; Venet, P. Low Temperature Aging Tests for Lithium-ion. In Proceedings of the 2015 IEEE 24th International Symposium on Industrial Electronics (ISIE), Buzios, Brazil, 3–5 June 2015. [Google Scholar]
- Burow, D.; Sergeeva, K.; Calles, S.; Schorb, K.; Börger, A.; Roth, C.; Heitjans, P. Inhomogeneous degradation of graphite anodes in automotive lithium ion batteries under low-temperature pulse cycling conditions. J. Power Sources 2016, 307, 806–814. [Google Scholar] [CrossRef]
- Ecker, M.; Sabet, P.S.; Sauer, D.U. Influence of operational condition on lithium plating for commercial lithium-ion batteries—Electrochemical experiments and post-mortem-analysis. Appl. Energy 2017, 206, 934–946. [Google Scholar] [CrossRef]
- Darcovich, K.; MacNeil, D.D.; Recoskie, S.; Cadic, Q.; Ilinca, F.; Kenney, B. Coupled Numerical Approach for Automotive Battery Pack Lifetime Estimates with Thermal Management. J. Electrochem. Energy Convers. Storage 2018, 15, 021004. [Google Scholar] [CrossRef]
- Fleischhammer, T.W.M.; Bisle, G.; Hogg, B.-I.; Wohlfahrt-Mehrens, M. Interaction of cyclic ageing at high-rate and low temperatures and safety in lithium-ion batteries. J. Power Sources 2015, 274, 432–439. [Google Scholar] [CrossRef]
- Fan, G.; Pan, K.; Canova, M.; Marcicki, J.; Yang, X.G. Modeling of Li-Ion Cells for Fast Simulation of High C-Rate and Low Temperature Operations. J. Electrochem. Soc. 2016, 163, A666. [Google Scholar] [CrossRef]
- Ecker, M.; Gerschler, J.B.; Vogel, J.; Käbitz, S.; Hust, F.; Dechent, P.; Sauer, D.U. Development of a lifetime prediction model for lithium-ion batteries based on extended accelerated aging test data. J. Power Sources 2012, 215, 248–257. [Google Scholar] [CrossRef]
- Hales, A.; Diaz, L.B.; Marzook, M.W.; Zhao, Y.; Patel, Y.; Offer, G. The Cell Cooling Coefficient: A Standard to Define Heat Rejection from Lithium-Ion Batteries. J. Electrochem. Soc. 2019, 166, A2383–A2395. [Google Scholar] [CrossRef]
- Sharma, A.; Fathy, H.K. Fisher identifiability analysis for a periodically-excited equivalent-circuit lithium-ion battery model. In Proceedings of the American Control Conference, Portland, OR, USA, 4–6 June 2014. [Google Scholar]
- Jiang, J.; Ruan, H.; Sun, B.; Zhang, W.; Gao, W.; Wang, L.Y.; Zhang, L. A reduced low-temperature electro-thermal coupled model for lithium-ion batteries. Appl. Energy 2016, 177, 804–816. [Google Scholar] [CrossRef]
- Lüders, C.V.; Zinth, V.; Erhard, S.V.; Osswald, P.J.; Hofmann, M.; Gilles, R.; Jossen, A. Lithium plating in lithium-ion batteries investigated by voltage relaxation and in situ neutron diffraction. J. Power Sources 2017, 342, 17–23. [Google Scholar] [CrossRef]
- Keil, P.; Schuster, S.; Lüders, C.; Hesse, H.; Arunachala, R.; Jossen, A. Lifetime Analyses of Lithium-Ion EV Batteries. In Proceedings of the 3rd Electromobility Challenging Issues Conference (ECI), Singapore, 1–4 December 2015. [Google Scholar]
- Min, H.; Zhang, Z.; Sun, W.; Min, Z.; Yu, Y.; Wang, B. A thermal management system control strategy for electric vehicles under low-temperature driving conditions considering battery lifetime. Appl. Therm. Eng. 2020, 181, 115944. [Google Scholar] [CrossRef]
- Pesaran, A.A. Battery Thermal Management in EVs and HEVs: Issues and Solutions. In Proceedings of the Advanced Automotive Battery Conference, Las Vegas, NV, USA, 5–8 February 2001. [Google Scholar]
- Broussely, M.; Biensan, P.; Bonhomme, F.; Blanchard, P.; Herreyre, S.; Nechev, K.; Staniewicz, R. Main aging mechanisms in Li ion batteries. J. Power Sources 2005, 146, 90–96. [Google Scholar] [CrossRef]
- Schuster, S.F.; Bach, T.; Fleder, E.; Müller, J.; Brand, M.; Sextl, G.; Jossen, A. Nonlinear aging characteristics of lithium-ion cells under different operational conditions. J. Energy Storage 2015, 1, 44–53. [Google Scholar] [CrossRef]
- Stetzel, K.D.; Aldrich, L.L.; Trimboli, M.S.; Plett, G.L. Electrochemical state and internal variables estimation using a reduced-order physics-based model of a lithium-ion cell and an extended Kalman filter. J. Power Sources 2015, 278, 490–505. [Google Scholar] [CrossRef]
- Thomas, E.; Bloom, I.; Christophersen, J.P.; Battaglia, V. Statistical methodology for predicting the life of lithium-ion cells via accelerated degradation testing. J. Power Sources 2008, 184, 312–317. [Google Scholar] [CrossRef]
- Tippmann, S.; Walper, D.; Balboa, L.; Spier, B.; Bessler, W.G. Low-temperature charging of lithium-ion cells part I: Electrochemical modeling and experimental investigation of degradation behavior. J. Power Sources 2014, 252, 305–316. [Google Scholar] [CrossRef]
- Vidal, C.; Gross, O.; Gu, R.; Kollmeyer, P.; Emadi, A. xEV Li-Ion Battery Low-Temperature Effects—Review. IEEE Trans. Veh. Technol. 2019, 68, 4560–4572. [Google Scholar] [CrossRef]
- Zhang, G.; Cao, L.; Ge, S.; Wang, C.-Y.; Shaffer, C.E.; Rahn, C.D. In Situ Measurement of Radial Temperature Distributions in Cylindrical Li-Ion Cells. J. Electrochem. Soc. 2014, 161, A1499. [Google Scholar] [CrossRef]
- Yang, X.-G.; Wang, C.-Y. Understanding the trilemma of fast charging, energy density and cycle life of lithium-ion batteries. J. Power Sources 2018, 402, 489–498. [Google Scholar] [CrossRef]
- Plötz, P.; Moll, C.; Li, Y.; Bieker, G.; Mock, P. Real-World Usage of Plug-In Hybrid Electric Vehicles: Fuel Consumption, Electric Driving, and CO2 Emissions; The International Council on Clean Transportation: Berlin, Germany, 2020. [Google Scholar]
- Gyenes, B.; Stevens, D.A.; Chevrier, V.L.; Dahn, J.R. Understanding Anomalous Behavior in Coulombic Efficiency Measurements on Li-Ion Batteries. J. Electrochem. Soc. 2015, 162, A278. [Google Scholar] [CrossRef]
- Li, Z.; Zhang, J.; Wu, B.; Huang, J.; Nie, Z.; Sun, Y.; An, F.; Wu, N. Examining temporal and spatial variations of internal temperature in large-format laminated battery with embedded thermocouples. J. Power Sources 2013, 241, 536–553. [Google Scholar] [CrossRef]
- Mutyala, M.S.K.; Zhao, J.; Li, J.; Pan, H.; Yuan, C.; Li, X. In-situ temperature measurement in lithium ion battery by transferable flexible thin film thermocouples. J. Power Sources 2014, 260, 43–49. [Google Scholar] [CrossRef]
- Reyes, J.; Parsons, R.; Hoemsen, R. Winter happens: The effect of ambient temperature on the travel range of electric vehicles. IEEE Trans. Veh. Technol. 2016, 65, 4016–4022. [Google Scholar] [CrossRef]
- Yuksel, T.; Michalek, J. Effects of regional temperature on electric vehicle efficiency, range and emissions in the United States. Environ. Sci. Technol. 2015, 49, 3974–3980. [Google Scholar] [CrossRef] [PubMed]
- Wang, Q.; Jiang, B.; Li, B.; Yan, Y. A critical review of thermal management models and solutions of lithium-ion batteries for the development of pure electric vehicles. Renew. Sustain. Energy Rev. 2016, 64, 106–128. [Google Scholar] [CrossRef]
- Darcovich, K.; MacNeil, D.; Recoskie, S.; Cadic, Q.; Ilinca, F. Comparison of cooling plate configurations for automotive battery pack thermal management. Appl. Therm. Eng. 2019, 155, 185–195. [Google Scholar] [CrossRef]
- Petzl, M.; Kasper, M.; Danzer, M.A. Lithium plating in a commercial lithium-ion battery—A low temperature study. J. Power Sources 2015, 275, 799–807. [Google Scholar] [CrossRef]
- Vetter, J.; Novák, P.; Wagner, M.; Veit, C.; Möller, K.-C.; Besenhard, J.; Winter, M.; Wohlfahrt-Mehrens, M.; Vogler, C.; Hammouche, A. Ageing mechanisms in lithium-ion batteries. J. Power Sources 2005, 147, 269–281. [Google Scholar] [CrossRef]
- Bugga, R.V.; Smart, M.C. Lithium Plating Behavior in Lithium-ion Cells. ECS Trans. 2010, 25, 241–252. [Google Scholar] [CrossRef]
- Peled, E. Film Forming Reaction at the Lithium/Electrolyte Interface. J. Power Sources 1983, 9, 253–266. [Google Scholar] [CrossRef]
- Darcovich, K.; Recoskie, S.; Fattal, F. Fast operational mode switching effects on battery degradation. J. Appl. Electrochem. 2020, 1, 111–124. [Google Scholar] [CrossRef]
- Darcovich, K.; Recoskie, S.; Michelet, C.; Ribberink, H. The Impact of V2X Service under Local Climatic Conditions within Canada on EV Durability. eTransportation 2021, 9, 100124. [Google Scholar] [CrossRef]
- Darcovich, K.; Recoskie, S.; MacNeil, D.; Darcovich, A. Operational intra-cycle temporal and current mode effects on battery capacity loss. eTransportation 2022, 13, 100185. [Google Scholar] [CrossRef]
- Darcovich, K.; Ribberink, H.; Michelet, C.; Lombard, K.; Ghorab, M. The Feasibility of Electric Vehicles as Taxis in a Canadian Context. In Proceedings of the 2019 Electric Vehicles International Conference (EV), Bucharest, Romania, 3–4 October 2019; pp. 1–6. [Google Scholar]
- Darcovich, K.; Ribberink, H.; Qiu, K.; Soufflet, E. Battery Pack Prospects for Long-Haul Transport Trucks Considering Electrified Highways and Megawatt Charging. World Electr. Veh. J. 2023, 14, 60. [Google Scholar] [CrossRef]
- Carnovale, A.; Li, X. A modeling and experimental study of capacity fade for lithium-ion batteries. Energy AI 2020, 2, 100032. [Google Scholar] [CrossRef]
- Landini, S.; O’Donovan, T.S. Experimental investigation of lithium-ion cells ageing under isothermal conditions for optimal lifetime performance. J. Energy Storage 2022, 48, 103680. [Google Scholar] [CrossRef]
- Landini, S.; O’Donovan, T. Novel experimental approach for the characterisation of Lithium-Ion cells performance in isothermal conditions. Energy 2021, 214, 118965. [Google Scholar] [CrossRef]
- Wu, W.; Wu, W.; Qiu, X.; Wang, S. Low-temperature reversible capacity loss and aging mechanism in lithium-ion batteries for different discharge profiles. Int. J. Energy Res. 2019, 43, 243–253. [Google Scholar] [CrossRef]
- Alipour, M.; Ziebert, C.; Conte, F.V.; Kizilel, R. A Review on Temperature-Dependent Electrochemical Properties, Aging, and Performance of Lithium-Ion Cells. Batteries 2020, 6, 35. [Google Scholar] [CrossRef]
- Xia, G.; Cao, L.; Bi, G. A review on battery thermal management in electric vehicle application. J. Power Sources 2017, 367, 90–105. [Google Scholar] [CrossRef]
- Peng, X.; Ma, C.; Garg, A.; Bao, N.; Liao, X. Thermal performance investigation of an air-cooled lithium-ion battery pack considering the inconsistency of battery cells. Appl. Therm. Eng. 2019, 153, 596–603. [Google Scholar] [CrossRef]
- Kim, J.; Oh, J.; Lee, H. Review on battery thermal management system for electric vehicles. Appl. Therm. Eng. 2019, 149, 192–212. [Google Scholar] [CrossRef]
- Lu, Z.; Yu, X.; Wei, L.; Cao, F.; Zhang, L.; Meng, X.; Jin, L. A comprehensive experimental study on temperature-dependent performance of lithium-ion battery. Appl. Therm. Eng. 2019, 158, 113800. [Google Scholar] [CrossRef]
- Darcovich, K.; Recoskie, S.; Hazaz, Y.; Ribberink, H. Cooling Regimes for Electric Vehicle Battery Packs in Vehicle-to-Grid Scenarios. In Proceedings of the 5th International Conference on Sustainable Energy Engineering and Application, Jakarta, Indonesia, 23–24 October 2017. [Google Scholar]
- Liu, L.; Park, J.; Lin, X.; Sastry, A.; Lu, W. A thermal-electrochemical model that gives spatial-dependent growth of solid electrolyte interphase in a Li-ion battery. J. Power Sources 2014, 90, 482–490. [Google Scholar] [CrossRef]
- Zhang, G.; Wei, X.; Han, G.; Dai, H.; Zhu, J.; Wang, X.; Tang, X.; Ye, J. Lithium plating on the anode for lithium-ion batteries during long-term low temperature cycling. J. Power Source 2021, 484, 229312. [Google Scholar] [CrossRef]


| EV Type | PHEV (Plug-in Hybrid Electric Vehicle) | HEV (Conventional Hybrid Electric Vehicle) | BEV (Pure Battery Electric Vehicle) | |||||||||
|---|---|---|---|---|---|---|---|---|---|---|---|---|
| Vehicle make | Chevrolet Volt | Toyota Prius | Nissan Leaf | |||||||||
| Model year | 2013 | 2013 | 2014 | |||||||||
| OEM battery thermal management system | Indirect liquid | Forced air | Passive + resistive heating | |||||||||
| Past usage history | Cells were extracted from EVs with less than 2000 km traveled and stored outdoors in a shipping container in Ottawa, Canada, for 3 years. | |||||||||||
| Cell format | Pouch | Prismatic | Pouch | |||||||||
| Cell mass (g) | 445 | 721 | 900 | |||||||||
| Cell surface to volume ratio (cm−1) | 378 | 106 | 298 | |||||||||
| Principle chemistry (anode/cathode) | Graphite/ NMC (1:1:1): LiMnO4 (60:40) blend | Graphite/ NMC (1:1:1) | Graphite/ NMC (6:2:1): LiMnO4 (40:60) blend | |||||||||
| Rated discharge capacity (Ah) | 15 | 21.5 | 33 | |||||||||
| Voltage limits 1 (V) | 3.0–4.15 | 3.0–4.15 | 2.5–4.2 | |||||||||
| Charge/discharge current (C-rate) | C/40 | C/4 | C/2 | 1C | C/40 | C/4 | C/2 | 1C | C/40 | C/4 | C/2 | 1C |
| Charge/discharge current (A) | 0.375 | 3.75 | 7.5 | 15 | 0.538 | 5.38 | 10.75 | 21.5 | 0.825 | 8.25 | 16.5 | 33 |
| Environment temperatures (°C) | For each cell and each C-rate | |||||||||||
| −15 | −5 | 5 | 15 | 25 | 35 | 45 | ||||||
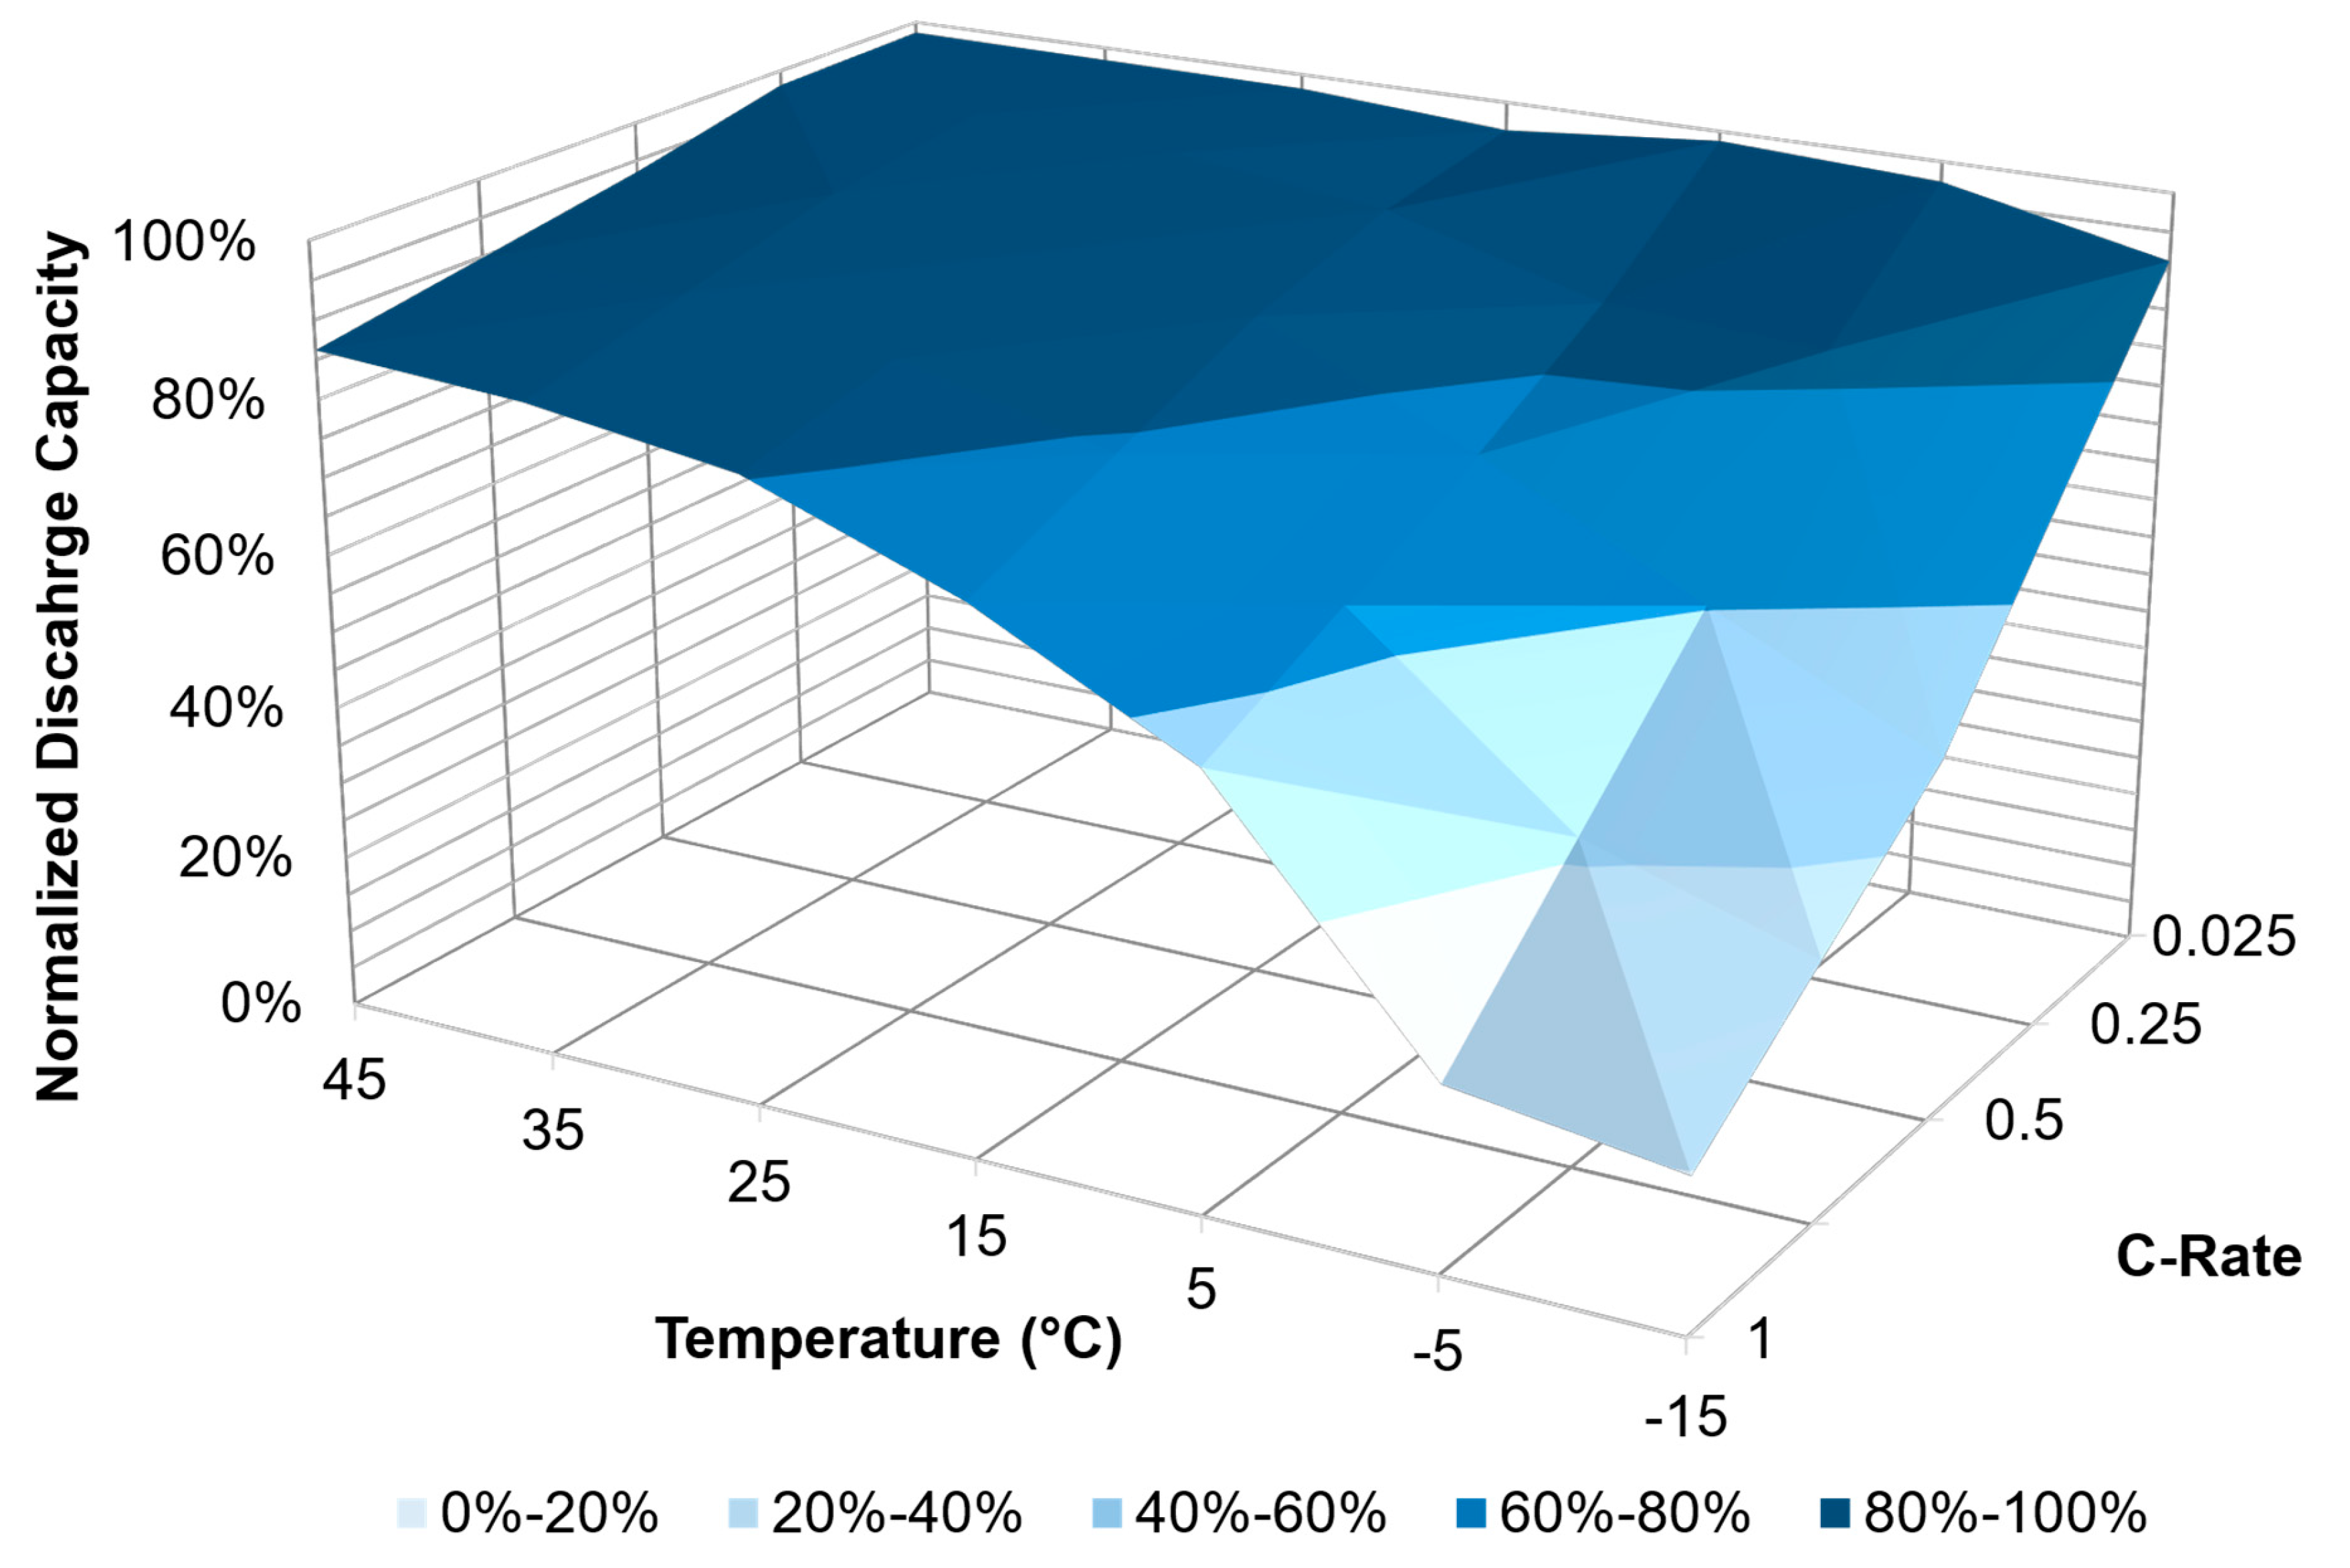
| Cell Type | C-Rate | Temperatures (°C) | ||||||
|---|---|---|---|---|---|---|---|---|
| −15 | −5 | 5 | 15 | 25 | 35 | 45 | ||
| PHEV | C/40 | 90% | 95% | 97% | 100% | 100% | 100% | 100% |
| C/4 | 63% | 72% | 84% | 91% | 88% | 96% | 98% | |
| C/2 | 46% | 72% | 68% | 84% | 88% | 93% | 94% | |
| 1C | 0% | 12% | 49% | 68% | 79% | 88% | 88% | |
| HEV | C/40 | 92% | 94% | 94% | 95% | 96% | 96% | 96% |
| C/4 | 82% | 87% | 91% | 93% | 95% | 95% | 96% | |
| C/2 | 75% | 84% | 88% | 92% | 93% | 94% | 94% | |
| 1C | 65% | 70% | 79% | 88% | 87% | 86% | 93% | |
| BEV | C/40 | 91% | 97% | 99% | 96% | 98% | 98% | 99% |
| C/4 | 69% | 84% | 85% | 93% | 97% | 98% | 98% | |
| C/2 | 47% | 60% | 74% | 87% | 91% | 95% | 93% | |
| 1C | 20% | 24% | 56% | 70% | 80% | 84% | 86% | |
| Type | C-Rate | Temperatures (°C) | ||||||
|---|---|---|---|---|---|---|---|---|
| −15 | −5 | 5 | 15 | 25 | 35 | 45 | ||
| PHEV | C/4 | 59% | 71% | 84% | 88% | 88% | 85% | 69% |
| C/2 | 37% | 72% | 67% | 82% | 85% | 85% | 73% | |
| 1C | 0% | 5% | 49% | 68% | 75% | 83% | 65% | |
| HEV | C/4 | 71% | 83% | 86% | 87% | 88% | 86% | 83% |
| C/2 | 60% | 70% | 83% | 87% | 77% | 87% | 85% | |
| 1C | 52% | 59% | 73% | 82% | 77% | 68% | 85% | |
| BEV | C/4 | 68% | 83% | 85% | 86% | 88% | 85% | 68% |
| C/2 | 46% | 48% | 70% | 78% | 82% | 81% | 67% | |
| 1C | 15% | 12% | 51% | 51% | 65% | 70% | 69% | |
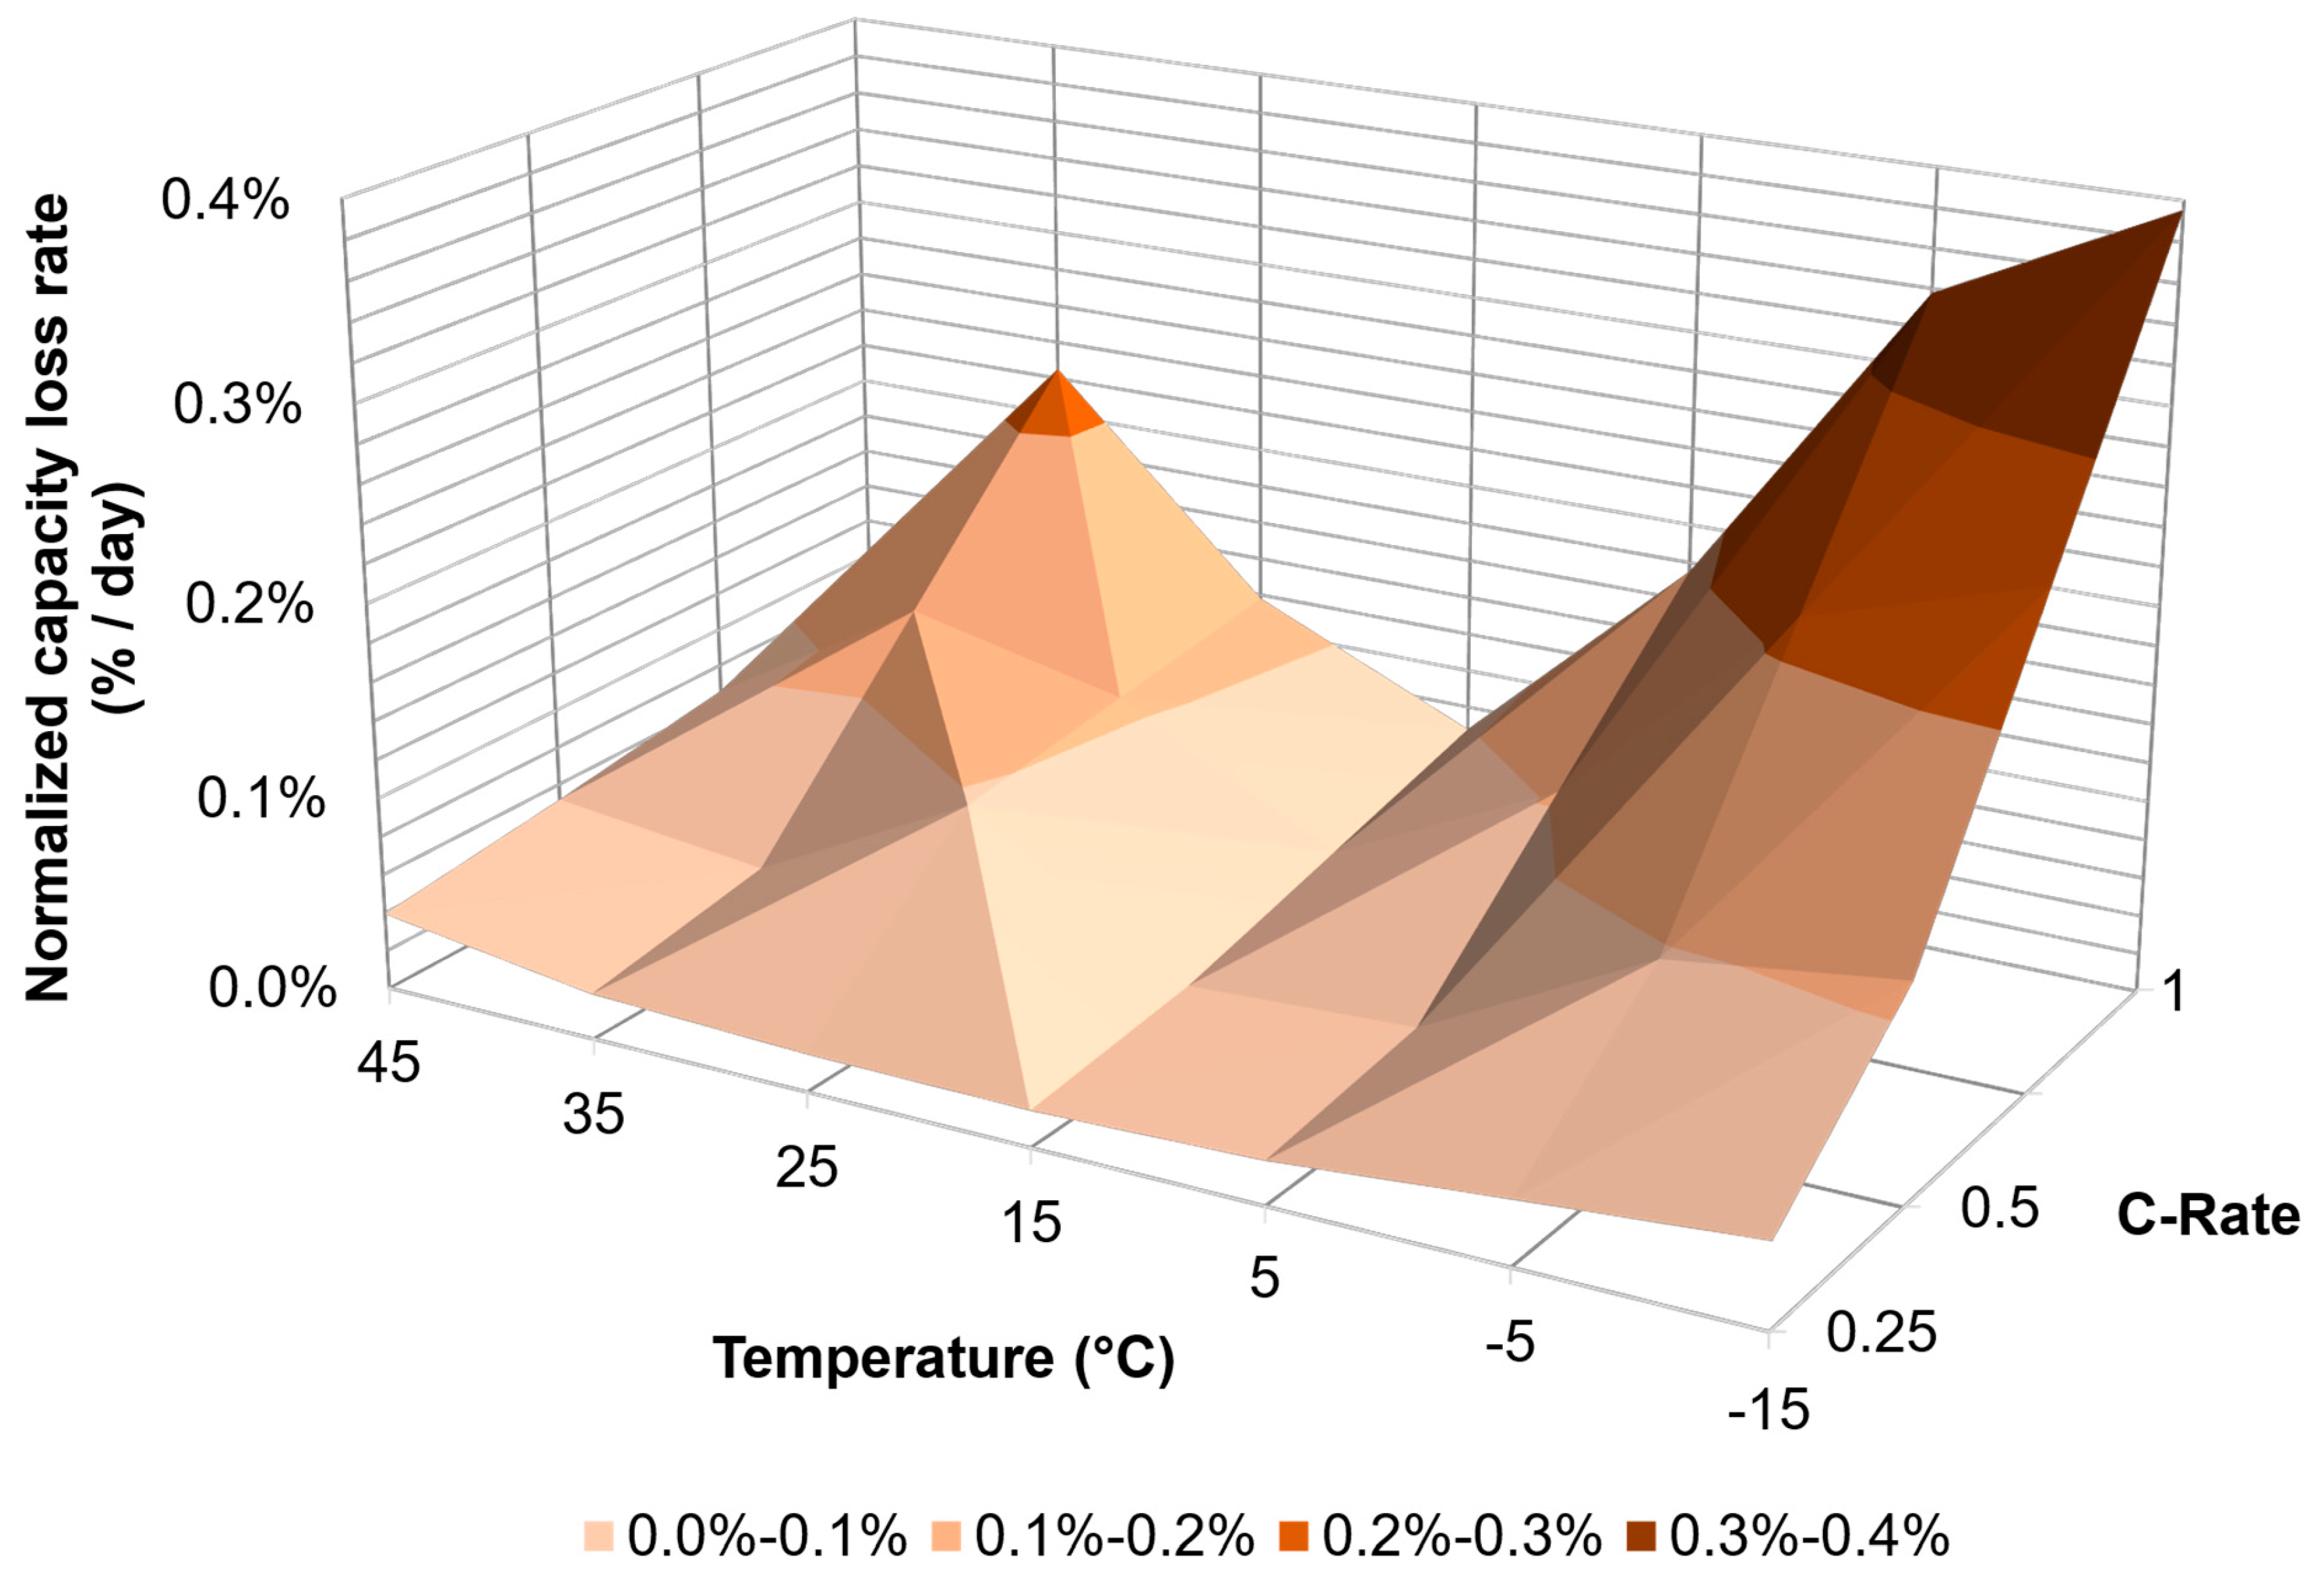
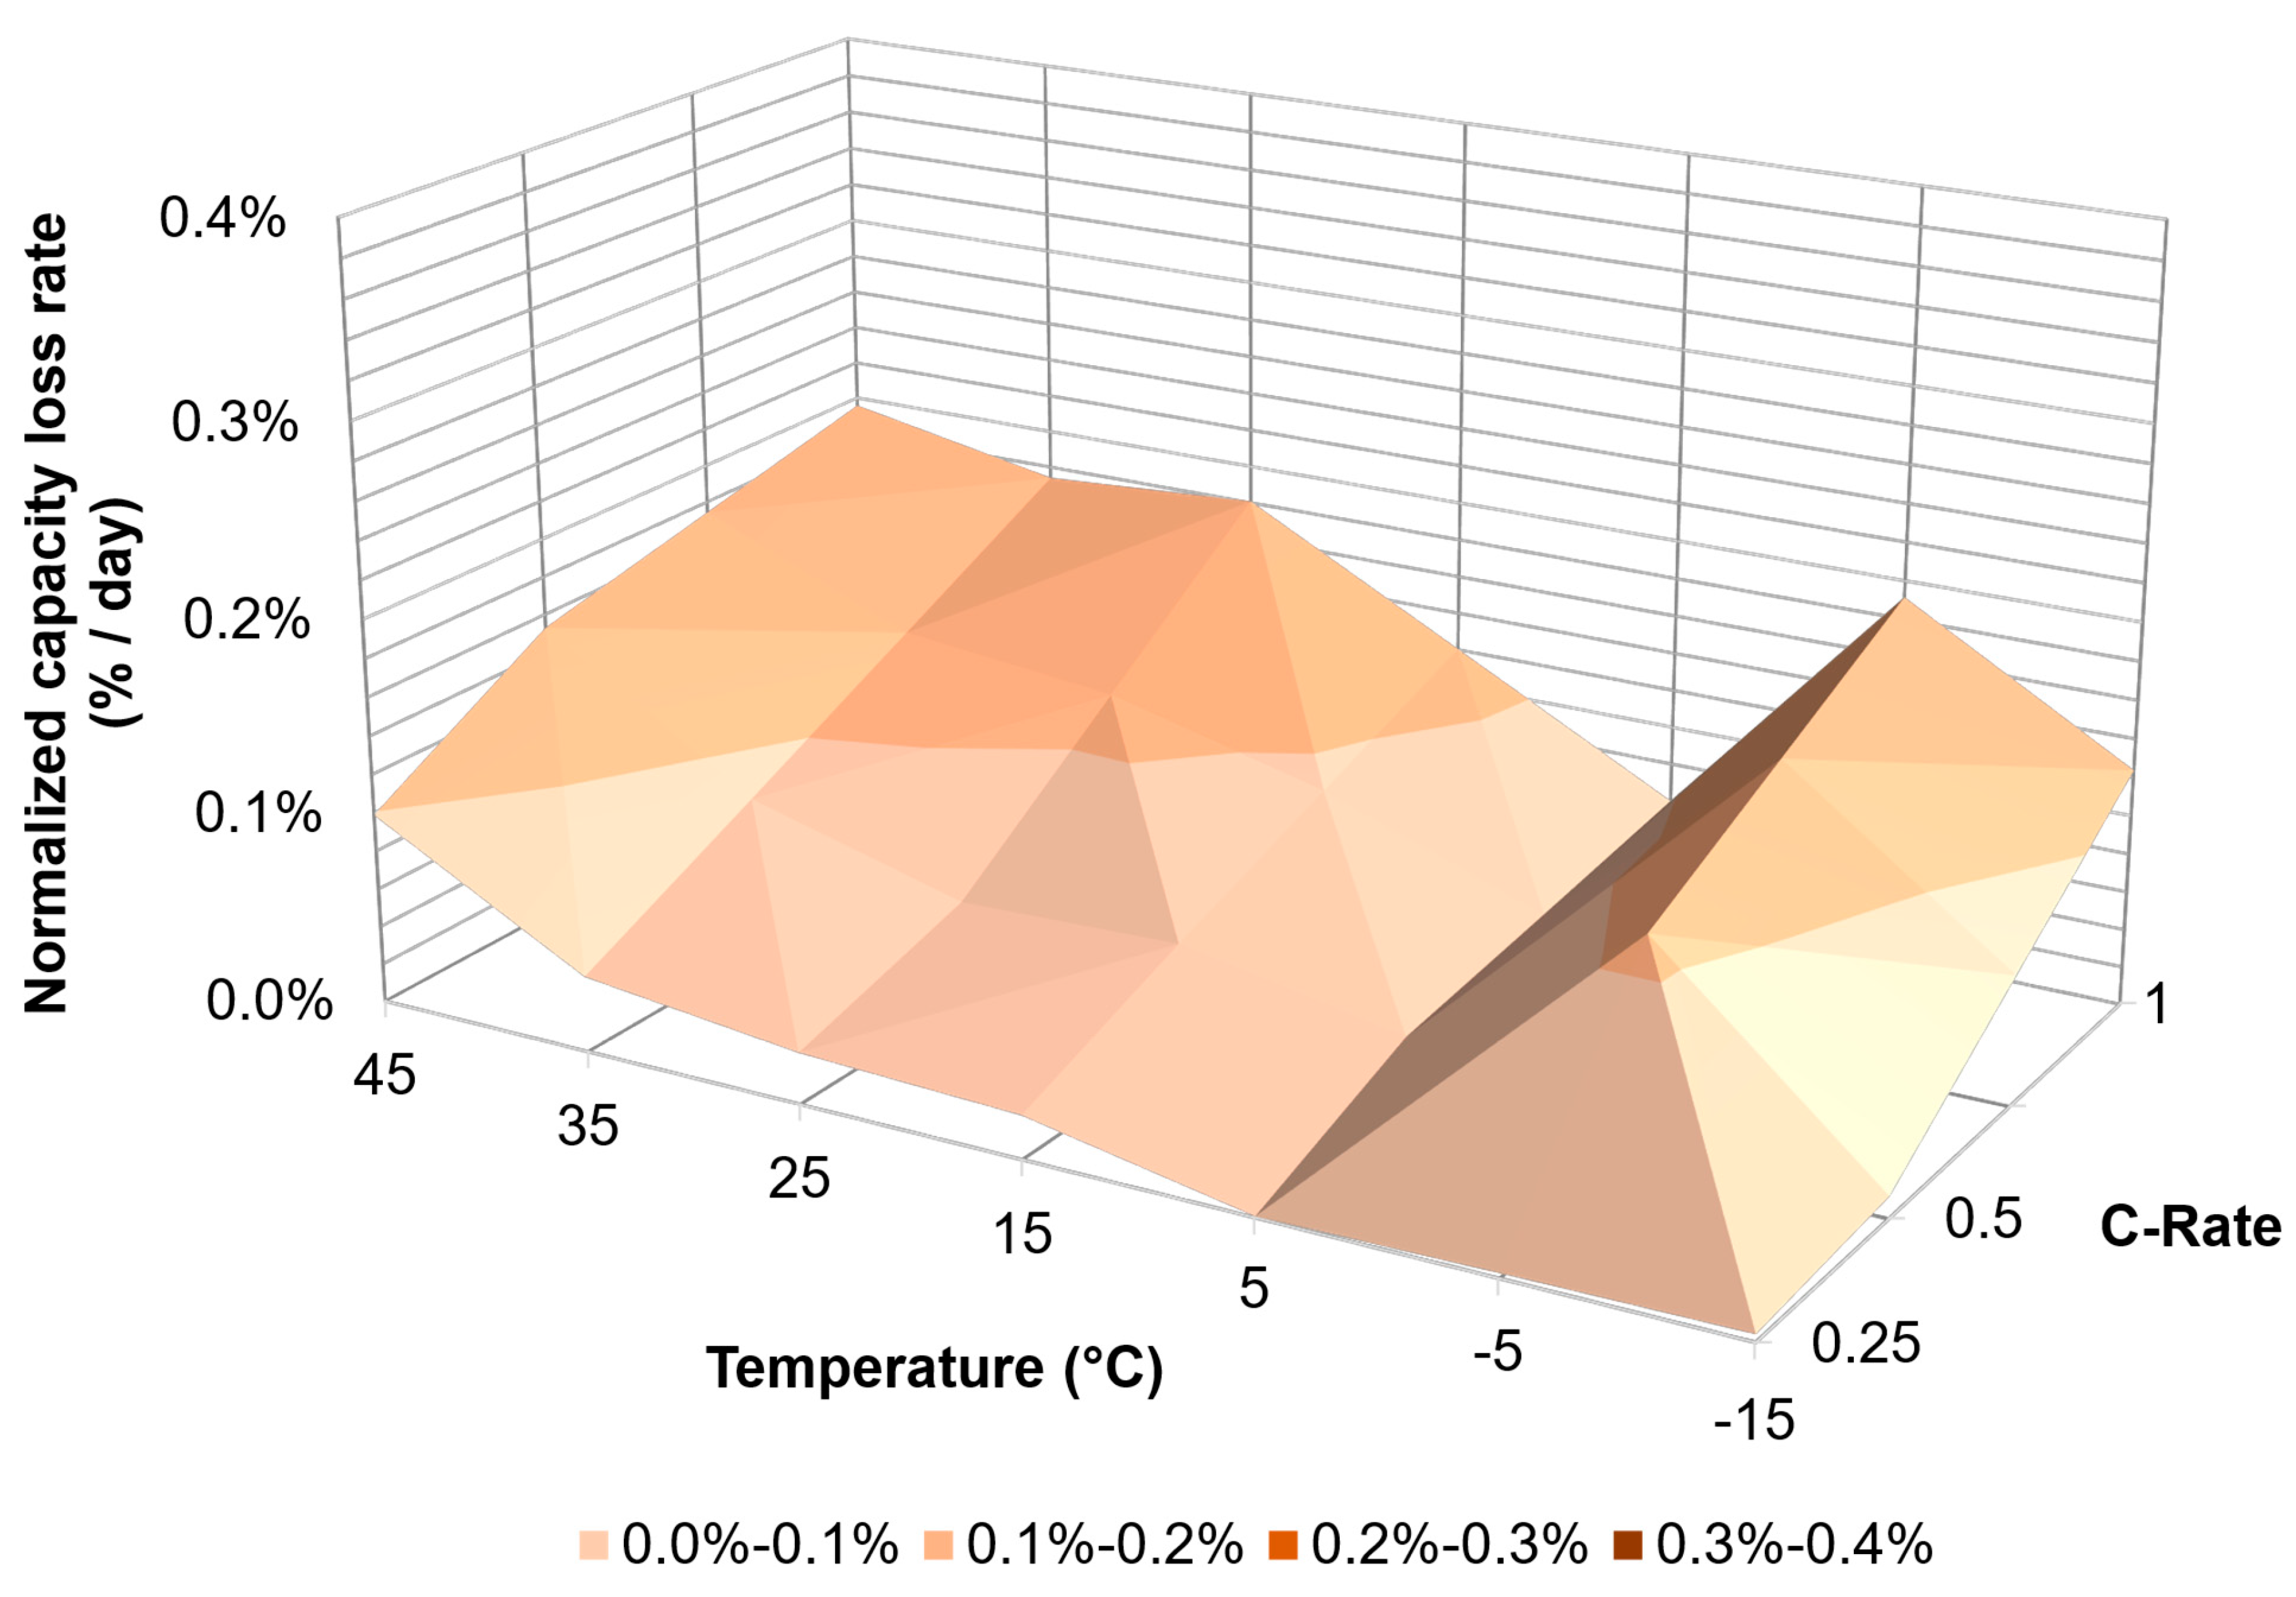
| Type | C-Rate | Temperatures (°C) | ||||||
|---|---|---|---|---|---|---|---|---|
| −15 | −5 | 5 | 15 | 25 | 35 | 45 | ||
| PHEV | C/4 | 0.02% | <0.01% | <0.01% | 0.01% | 0.02% | 0.04% | 0.09% |
| C/2 | 0.11% | <0.01% | <0.01% | <0.01% | 0.02% | 0.05% | 0.13% | |
| 1C | INF | 0.28% | <0.01% | <0.01% | 0.05% | 0.05% | 0.27% | |
| HEV | C/4 | 0.04% | 0.03% | 0.02% | 0.02% | 0.02% | 0.02% | 0.04% |
| C/2 | 0.11% | 0.09% | 0.03% | 0.03% | 0.10% | 0.04% | 0.05% | |
| 1C | 0.40% | 0.34% | 0.18% | 0.07% | 0.12% | 0.23% | 0.08% | |
| BEV | C/4 | <0.01% | <0.01% | <0.01% | 0.02% | 0.03% | 0.04% | 0.10% |
| C/2 | 0.01% | 0.11% | 0.04% | 0.06% | 0.05% | 0.08% | 0.15% | |
| 1C | 0.12% | 0.19% | 0.06% | 0.12% | 0.18% | 0.17% | 0.20% | |
| Type | C-Rate | Final Normalized Discharge Capacities at −15 °C | Post-Test Normalized Discharge Capacities at 25 °C | Normalized Capacity Recovered | Final Normalized Discharge Capacities at −5 °C | Post-Test Normalized Discharge Capacities at 25 °C | Normalized Capacity Recovered |
|---|---|---|---|---|---|---|---|
| PHEV | C/4 | 59% | No data | No data | 71% | 87% | +16% |
| 1C | 0% | 80% | +80% | 5% | 65% | +60% | |
| HEV | C/4 | 71% | No data | No data | 83% | 87% | +4% |
| 1C | 52% | 60% | +8% | 59% | 68% | +9% | |
| BEV | C/4 | 68% | No data | No data | 83% | 97% | +14% |
| 1C | 15% | 76% | +61% | 12% | 74% | +62% |
Disclaimer/Publisher’s Note: The statements, opinions and data contained in all publications are solely those of the individual author(s) and contributor(s) and not of MDPI and/or the editor(s). MDPI and/or the editor(s) disclaim responsibility for any injury to people or property resulting from any ideas, methods, instructions or products referred to in the content. |
© 2025 by His Majesty the King in Right of Canada as represented by the National Research Council. Licensee MDPI, Basel, Switzerland. This article is an open access article distributed under the terms and conditions of the Creative Commons Attribution (CC BY) license (https://creativecommons.org/licenses/by/4.0/).
Share and Cite
Recoskie, S.; MacNeil, D.D.; Darcovich, K.; Perron, J.; Pedroso, S. Low-Temperature Performance and Durability of Electric Vehicle Battery Cells Under Isothermal Conditions. Energies 2025, 18, 2028. https://doi.org/10.3390/en18082028
Recoskie S, MacNeil DD, Darcovich K, Perron J, Pedroso S. Low-Temperature Performance and Durability of Electric Vehicle Battery Cells Under Isothermal Conditions. Energies. 2025; 18(8):2028. https://doi.org/10.3390/en18082028
Chicago/Turabian StyleRecoskie, Steven, Dean D. MacNeil, Ken Darcovich, Joel Perron, and Samuel Pedroso. 2025. "Low-Temperature Performance and Durability of Electric Vehicle Battery Cells Under Isothermal Conditions" Energies 18, no. 8: 2028. https://doi.org/10.3390/en18082028
APA StyleRecoskie, S., MacNeil, D. D., Darcovich, K., Perron, J., & Pedroso, S. (2025). Low-Temperature Performance and Durability of Electric Vehicle Battery Cells Under Isothermal Conditions. Energies, 18(8), 2028. https://doi.org/10.3390/en18082028