Article

Techno-Probabilistic Flexibility Assessment of EV2G Based on Chargers’ Historical Records

1
Department of Electronics Engineering, Kangwon National University, Chuncheon 24314, Republic of Korea
2
Research Institute for Solar and Sustainable Energies, Gwangju Institute of Science and Technology, Gwangju 61005, Republic of Korea
3
Department of Electrical Engineering, Chosun University, Gwangju 61452, Republic of Korea
*
Author to whom correspondence should be addressed.
Energies 2025, 18(8), 2031; https://doi.org/10.3390/en18082031
Submission received: 28 March 2025 / Revised: 13 April 2025 / Accepted: 15 April 2025 / Published: 16 April 2025
(This article belongs to the Section E: Electric Vehicles)

Abstract

:
As the proportion of renewable energy is rapidly increasing under the commitment to carbon neutrality, technical research and demonstrations regarding electric vehicle-to-grid (EV2G) charging are in progress. Meanwhile, commercialization of EV2G in the power system should be preceded by a quantitative assessment of EV2G flexibility based on practical data analysis. In this paper, we propose a framework to evaluate the technical flexibility of EV2G using the accumulated historical records of chargers. The framework consists of a charger profile generation model that derives a probabilistic state profile of each segmented charger group and a virtual EV2G flexibility model that derives flexibility through optimal operation of a virtual EV2G. The experiment was conducted based on islanded grid and charger data. The experimental results validated the economic and environmental contribution effects of EV2G flexibility. The proposed framework can contribute to stakeholders’ decision-making on the utilization of EV2G as a flexible resource based on reliable analysis results.

1. Introduction

Given the current carbon-neutral society, energy transformation at the national level is accelerating in order to adapt to the new international economic regimes that consider environmental issues. For example, the Paris Agreement, which is a legally binding international treaty on climate change, was adopted, and the COP26 summit brought parties to accelerate action toward the goals of the Paris Agreement and the UN framework Convention on Climate Change [1,2]. Companies worldwide are shifting their investments where they are most needed for environmentally sustainable economic activity under the EU Taxonomy [3]. In order to meet the aforementioned commitments, the replacement of fossil fuels with renewable energy is rapidly spreading, and the national energy mix is changing accordingly. Contrary to these economic and environmental purposes, renewable energy resources such as wind and solar energy are characterized by fluctuations in power generation. Their unpredictable generation reduces the actually available supply and creates a mismatch between supply and demand. In addition, for the reliability of the power system, the excess planning of the system grid and reserve power sources is enforced. The expansion plan of the power generation and transmission infrastructure cannot keep up with the increasing pace of renewable energy. For example, 20% of the electricity generation capacity is invested and maintained to meet the peak load occurring at 5% within the time period [4]. To alleviate the aforementioned situations, resource investigation, technical research, and operational demonstration on both sides of generation and demand are being challenged.
In terms of power generation, responsive resources for renewable energy include pumped storage hydropower generators (PSHs), energy storage systems (ESS), and LNG generators (LNGs). Typically, they can reach their rated capacity in seconds to minutes, and these ramp characteristics enable them to quickly respond to supply fluctuations [5,6,7,8]. However, PSHs and ESS have economic disadvantages as their facility investment costs are high at $2000/kW and $2500/kW, respectively, and their construction periods are long at 10 years per generator [9,10,11,12]. LNGs feature 0.012 kg/MWh per PM2.5 units due to the use of fossil fuels, which hinders the greenhouse gas reduction target [13].
Demand response (DR) is a typical demand-side responsive resource and is defined as changes in electricity usage by end customers from their normal consumption patterns in response to changes in the price of electricity over time, or to incentive payments designed to induce lower electricity use at times of high wholesale market prices or when system reliability is jeopardized [14]. With the energy sector integration and electrification, the diversification of DR resources is progressing further from the use of traditional load demand, which is classified as residential, commercial, and industrial loads. In particular, the electric vehicle (EV) is discovered as an emerging valuable resource. EVs are eco-friendly and economical transportation resources and are expanding naturally or through promotion by governments and companies [15]. Since large capital for facility investment is not required and there are few conflicts of interest between stakeholders, technical research and demonstrations of EV-to-grid (EV2G) contribution are in progress for the usage as a DR resource.
On the other hand, the contribution effect of EV2G on the changing power system must be verified before commercialization. Recently, research has been conducted on the correlation between renewable energy penetration and the utilization of EVs, as well as the participation of voluntary EVs in energy markets to contribute to demand uncertainty [16,17,18,19]. In addition, a study estimating demand flexibility, which is defined as the resources that are used for stable operation in a power system through dynamic demand change, including increases and decreases, can be considered [20]. The harsh environment of the system at hand is caused by the occurrence of an uncontrollable base supply due to the high proportion of renewable energy sources and significant deviations in the net load such as the duck curve phenomenon [21]. Therefore, a quantitative evaluation of the technical flexibility that EV2G can guarantee to the system is required. The evaluation should be made based on the analysis of practical data generated from EVs and chargers. However, EV data are not disclosed to protect manufacturers’ trade secrets or user privacy. Under the limited data conditions, simulations of virtual EV2G operation including EVs and fuel cell EVs have been studied [22,23,24,25,26,27,28]. The studies targeted specific locations such as parking lots, households, and smart cities. Optimal operation was performed for VPP utilization and energy management, but the assumption of vehicle state based on probability distribution was premised.
Furthermore, to the authors’ best knowledge, no research has been found on assessing the valuation of EV2G based on a stochastic robust analysis of empirically accumulated data of chargers, with the exception of the few studies for the purpose of EV charging behavior [29,30,31,32,33,34,35]. In [29,33], EV charging behaviors were predicted based on machine learning and reinforcement learning, respectively. The studies in [30,31,32] analyzed the behaviors through the clustering methodology. They focused on the acquisition and analysis of EV data and did not specify a purpose. To improve the deficiency, we propose a new framework to evaluate the technical flexibility of EV2G in a probabilistic approach by analyzing unidentifiable data detected and stored in chargers. Since data analysis algorithms evolve and diversify according to their application purpose, this study contributes to addressing the inevitable problem of upcoming power systems through a new framework.
In view of the above, the main objectives and contributions of this study are as follows:
-
A new probabilistic representative charger state profile derivation model is proposed. The robustness of the segmented charger groups’ profile derivation process is improved through the analysis of the multi-probability model, which consists of the real-time charger state occurrence probability and the state transition probability between each unit time.
-
The proposed framework quantitatively estimates flexibility through the well-structured virtual EV2G optimal operation model. Based on the model, technical EV2G flexibility is confirmed to contribute to the system in time periods for supply–demand stabilization according to data-based statistical state-of-charge (SoC) scenarios.
-
The results of the technical flexibility assessment validate the EV2G contribution effect within a microgrid unit in a multi-perspective manner.
The rest of this article is organized as follows. In Section 2, a description of the proposed framework is presented and, subsequently, associated mathematical models are proposed. This is followed by a description of the test system and case study assumptions in Section 3. Section 4 discusses the results to interpret the effectiveness of the proposed framework. Conclusions are drawn in Section 5.

2. Proposed Framework

In this study, EV chargers are defined as demand resources that can contribute to the improvement of power system reliability by utilizing EV batteries being coupled. It is assumed that chargers participate in market regulations similarly to the economic DR program only during the time period when demand-side management is required. The energy aggregated by the DR operator or charger operator can be traded. During the 24 h period, sections requiring demand increase and decrease are defined as the ramp-up period and the ramp-down period, respectively. Each period is set based on the net load deviation rate of the power system. If a charger is coupled with an EV, there is an opportunity for the charger to perform charging, idling, and discharging. Due to the characteristics of EV2G resources similar to ESS, the customer baseline load of the charger for the settlement of energy participating in the DR market is always assumed to be zero. Since the assessment framework is designed for estimating the physical flexibility level in the typical power system and market environment, the advancement of the system and market design to maximize the economic effect, or the modification of EV2G operation criteria in pursuit of the participants’ interests, are excluded.
Figure 1 presents an overall schematic diagram of the proposed framework, which consists of two models, namely the charger profile generation model (CPGM) and the virtual EV2G flexibility model (VEFM). In the CPGM, a robust probabilistic state profile is derived for each charger cluster. The historical event records of a charger, including information on the coupling/decoupling time and charging capacity, are converted into time series triadic states, namely, decoupling, idling, and charging. Then, charger clustering is performed based on the chargers’ state probability profiles. A unified representative state profile of each cluster is estimated by reflecting the continuation and switch probability of the state between time intervals using the overall time series event dataset of the clustered chargers. In the VEFM, the optimal flexibility is calculated through the virtual operation of EV2G based on the representative state profile of the clustered chargers. The representative SoC scenario of EVs coupled to the charger is assumed according to the confidence interval of SoC distribution statistically calculated from the anonymous EVs coupled to the chargers in each cluster.

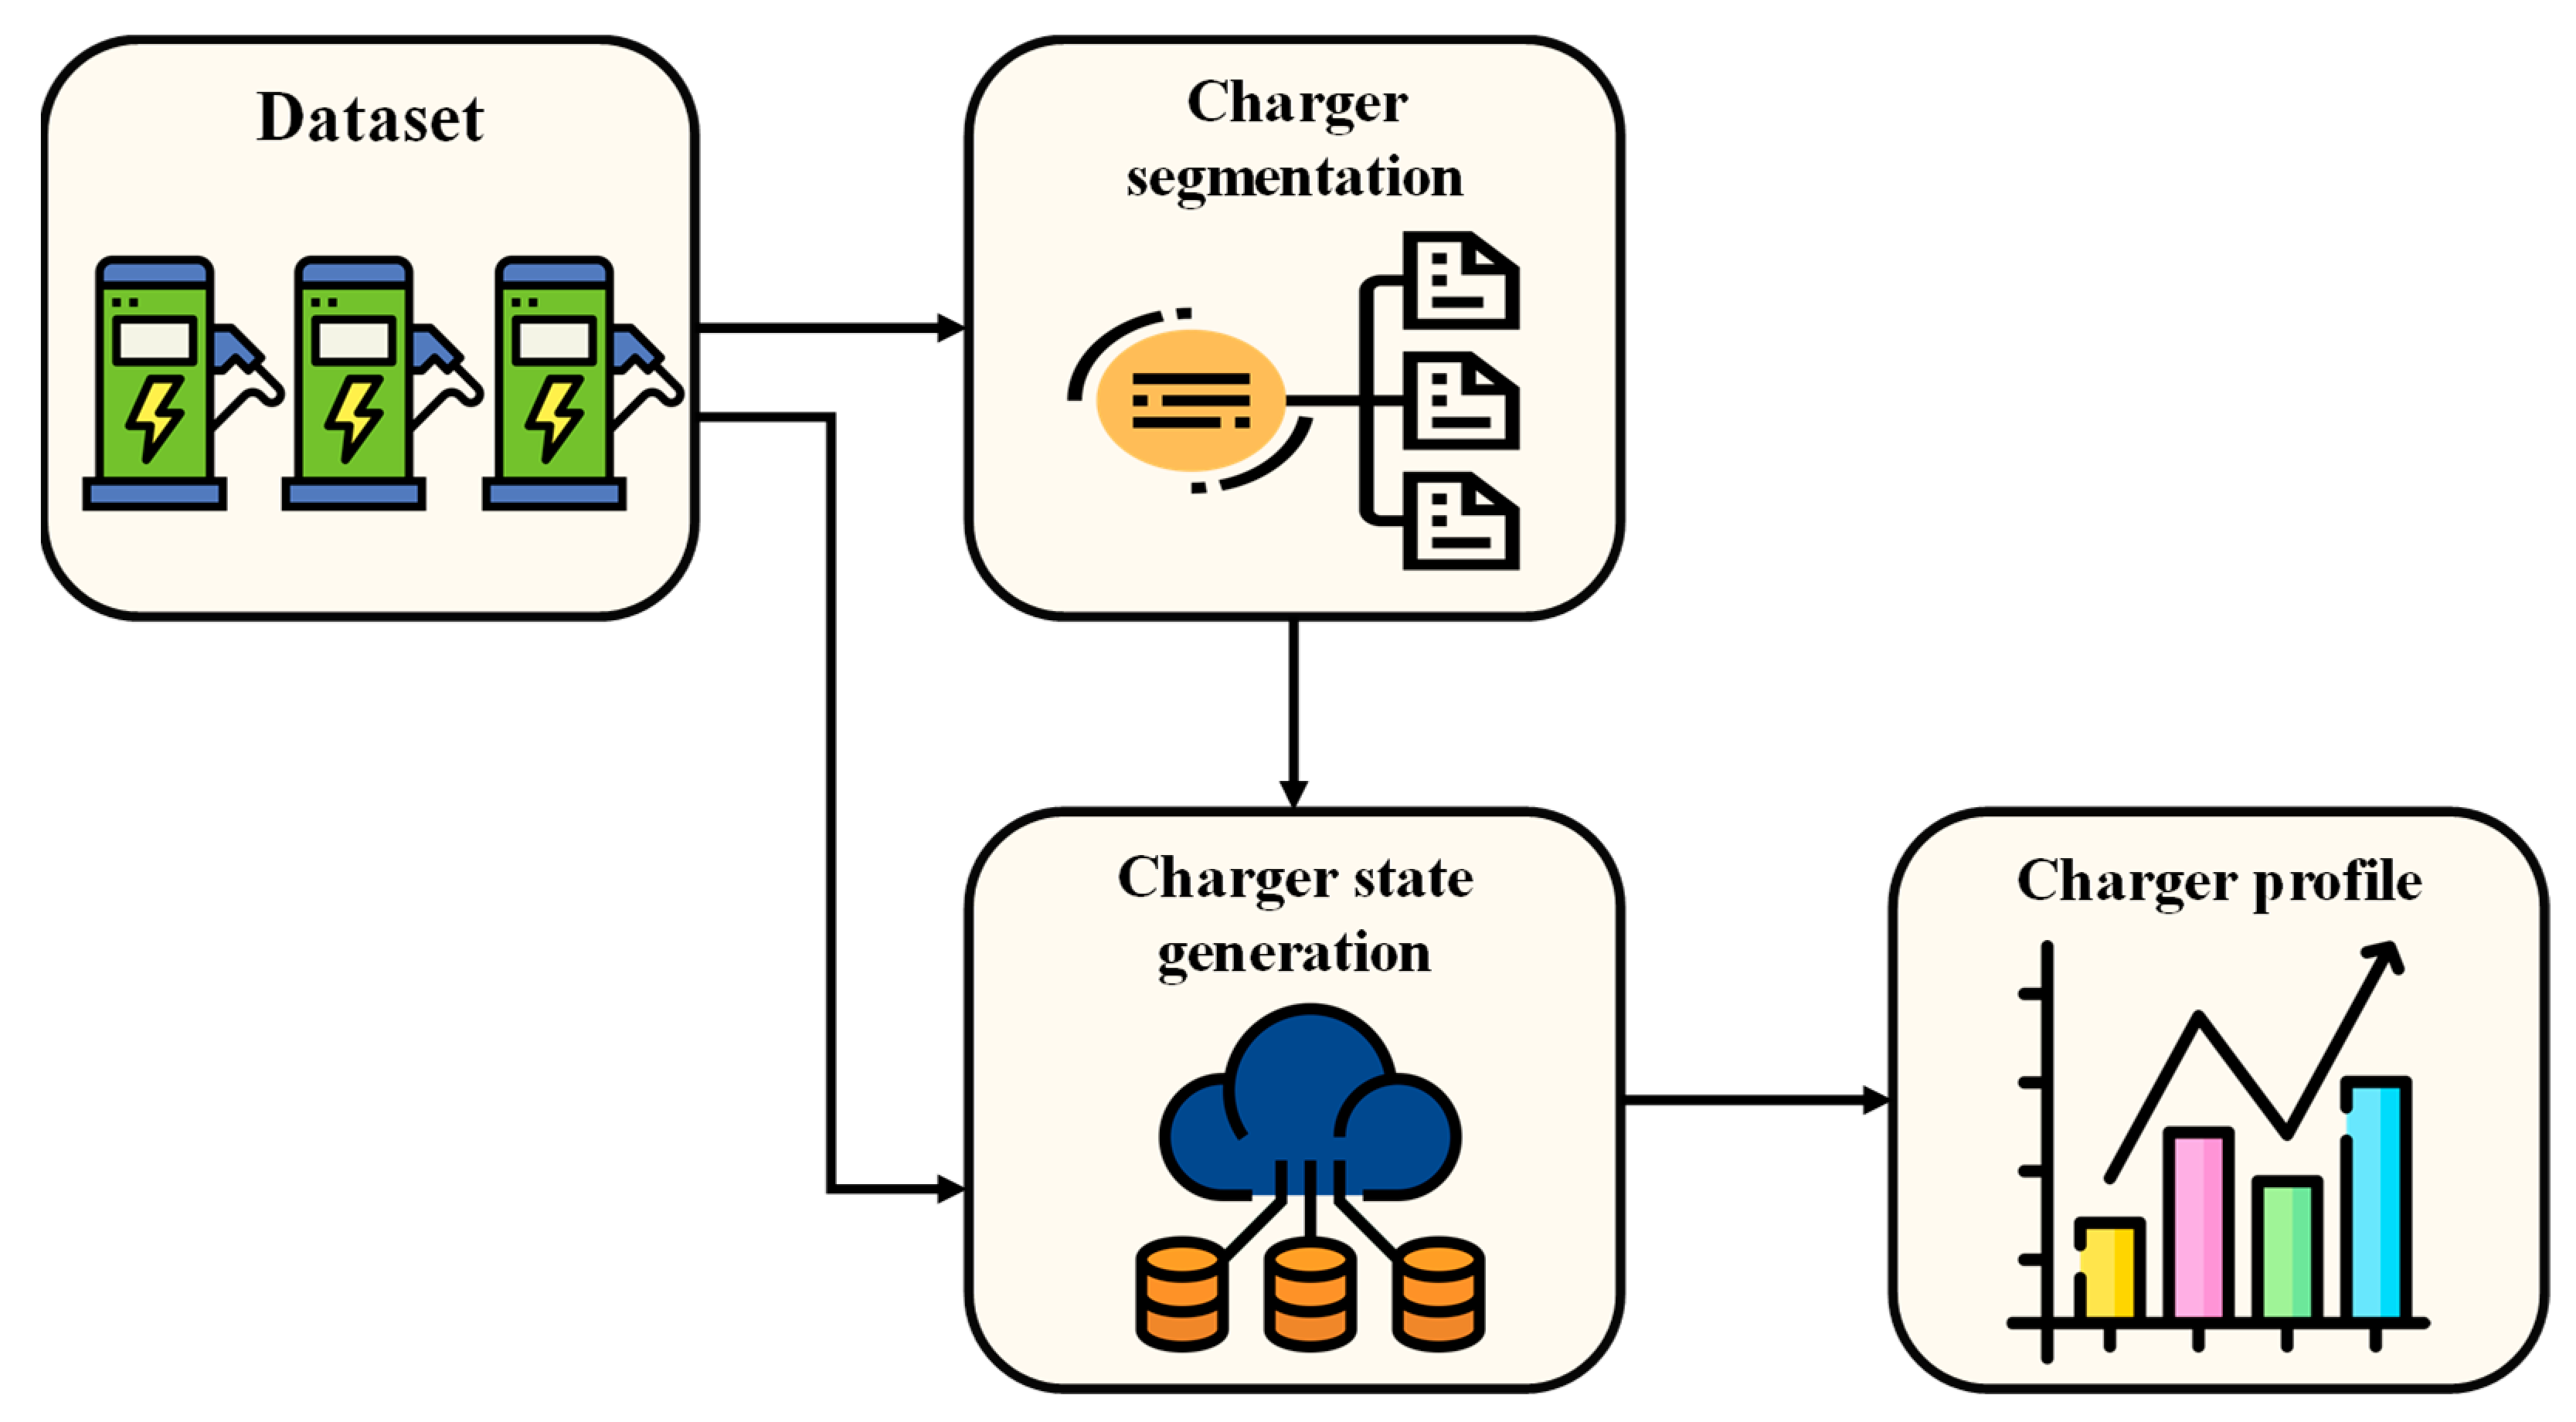
2.1. Charger Profile Generation Model (CPGM)

Since EV chargers’ availability and capacity as resources are determined by their coupling and charging characteristics, a reasonable analysis design of the characteristics is required. In the CPGM, representative state profiles of the chargers’ historical records are stochastically generated through data conversion, clustering, and probabilistic analysis. As shown in Figure 2, the CPGM consists of two processes: EV charger segmentation and time-varying-Markov-chain (TVMC)-based state generation.

2.1.1. EV Charger Segmentation

Clustering is a methodology for classifying objects with similar features in the absence of criteria for classification [36]. This method requires robustness of feature specification and quantization since the features of objects determine the similarity between them. Therefore, in this model, features are extracted based on the probability of state occurrence for EV charger segmentation.
Before extraction, abnormal record data, including the information that does not establish causality over time, are removed. Cleansed data are reorganized into 15 min time series data including three states, namely, charging, idling, and decoupling.
For charger segmentation, the triadic state occurrence probability of each charger per unit time interval is considered a feature based on preprocessed data. The state probability of the charger is calculated by accumulating the number of state events at each time interval, and the chargers are segmented based on the profile similarity of the state probability feature.

2.1.2. TVMC-Based State Generation

In the numerical data clustering process, centroid data represent cluster characteristics. However, time series information of EV chargers, classified as categorical data, estimates representative profiles based on a probabilistic approach. Accordingly, the model proposed a TVMC-based approach for representative state profile generation of EV charger groups.
As shown in Figure 3, the approach improves robustness by reflecting state transition uncertainty between time intervals. The occurrence probability of the current state varies at each time and is affected by the probability of the state occurrence at a previous time interval.
The transition probability ( P m , t , j , k ) from the previous ( t 1 ) to the current time interval ( t ) for each group ( m ) is formulated in (1), and it is estimated based on the probability of being in the state of j at the previous time ( S m , t 1 , j ) and being in the state of k at the current time ( S m , t , k ). The transition probability is composed of a three-dimensional ( N t , N s , N s , where N t and N s indicate the total number of time intervals and states, respectively) transition matrix. Additionally, the representative state profile of each cluster is stochastically derived based on the Monte Carlo simulation. The clusters’ initial states are defined randomly as formulated in (2).
P m , t , j , k = P r o b S m , t , k S m , t 1 , j t T ,     j , k [ c h a r g i n g ,   i d l i n g ,   d e c o u p l i n g ]
P m , 1 , j = P r o b S m , 1 , j   j [ c h a r g i n g ,   i d l i n g ,   d e c o u p l i n g )
As a result, the state profiles are generated with three state information types, which involve charging, idling, and decoupling. Since the condition of the chargers’ EV2G participation availability is determined by the coupling condition of chargers, the profile is finally derived by reducing the state to coupling, which includes charging and idling, and decoupling.

2.2. Virtual EV2G Flexibility Model (VEFM)

Subsequently, in the VEFM, optimal EV battery scheduling is derived under the analyzed state conditions of the represented charger profiles in each cluster.

2.2.1. Ramp-Up/Down Periods and Ramp Score Setting

Ramp-up and ramp-down periods ( T r u / T r d ) refer to the net load estimation results of the test system, which was proposed in [37]. In order to optimize EV2G flexibility in the ramp-up/down period while excluding the economic effect, a ramp score ( s t r a m p ), which is differentiated according to the net load increase/decrease rate, is applied as shown in Figure 4.

2.2.2. Objective Function

Accordingly, in the proposed algorithm, the objective function involves maximizing the net ramp score obtained from EV2G participation in the ramp-up period and the ramp-down period. The score is calculated as an expected value proportional to the weight ( γ c ) of each cluster. The objective function is formulated as given in (3). EV2G flexibility potential ( p c , t E V 2 G ) at each cluster ( c ) and time interval ( t ) involves the amount of EV battery charge/discharge ( p c , t c h g / p c , t d c h g ) in the ramp-up/down period, respectively, as given in (4).
J = max c C t T p c , t E V 2 G · s t r a m p · γ c
p c , t E V 2 G = p c , t c h g t T r u p c , t d c h g t T r d 0 o t h e r w i s e

2.2.3. SoC Management Constraints

The battery charging/discharging speed ( v c , t c h g / v c , t d c h g ) is a variable that can be changed for each unit time interval for optimal operation. The maximum speed ( v b a t t ) is based on the usual specification of the charger. The battery efficiency ( η b a t t ) is a constant and equally applies to each time interval. The charging/discharging speed changes exponentially based on the SoC sensed by the charger’s inherent voltage–current control function. The efficiency of charging/discharging also needs to consider the deterioration that varies with the number of battery utilization cycles. However, in this study, the aforementioned consideration was omitted for the sake of simplification of calculation and the absence of deidentified EV battery information. The unit time interval is set to 15 min, which indicates the minimum event duration to prevent simultaneous charging and discharging, and u c , t c h g and u c , t d c h g indicate binary decision variables of charging/discharging. The formulations of SoC management to estimate the charging/discharging amount of coupled EV batteries are shown in (5)–(9).
p c , t c h g = v c , t c h g · η b a t t           t T ,   c C
p c , t d c h g = v c , t c h g · η b a t t         t T ,   c C
u c , t c h g v c , t c h g v b a t t 0         t T ,   c C
u c , t d c h g v c , t d c h g v b a t t 0         t T ,   c C
u c , t c h g + u c , t d c h g 1           t T ,   c C
According to (10), the battery SoC management system operates within a minimum (0%) and maximum (100%) SoC limit. In general, EVs maintain between 20–80% of the SoC for stable battery operation. Thus, there is a difference between the SoC identified in the display panel of the EV/charger and the SoC of the actual battery. This study applies the SoC identified by the participants, which presupposes that there is no issue with the battery operation stability.
0 s o c c , t 100           t T ,   c C
The parameters of the initial SoC ( s o c c i n i ) are created based on the statistical SoC distribution of EVs that have used chargers in each case, as shown in Table 1. The initial SoC was classified into three cases based on the mean ( μ ) and standard deviation ( σ ). The desired SoC was applied at 100% to remove the disadvantages for EV users due to EV2G. Coupling and decoupling times ( t c c p l / t c d c p l ) are defined based on each charger state profile of the cluster. Coupled EV’s SoC always meets the initial SoC and 100% of the SoC ( s o c m a x ) at the coupling and decoupling time, respectively, as formulated in (11) and (12).
s o c t c c p l = s o c c i n i           t T ,   c C
s o c t c d c p l = s o c m a x           t T ,   c C
Equation (13) refers to a constraint of time series SoC ( s o c c , t ) continuity. The present SoC is derived from the SoC of the previous time interval and the amount of charging/discharging at the present time interval.
s o c c , t = s o c c , t 1 + p c , t c h g p c , t d c h g       t T ,   c C
Due to deterioration of the battery performance, a single cycle of charging/discharging was only allowed per day, as shown in (14) and (15).
t T p c , t c h s o c m a x           c C  
t T p c , t d c h s o c m a x           c C

3. Test System and Assumptions

In this study, the test system comprised empirical data on EV chargers and an islanded power system environment in Jeju, South Korea. Chargers’ historical records were randomly sampled from chargers located in residential and public areas. For a reasonable EV2G flexibility assessment, the following assumptions were made:
-
Charger records included all events within the period from 1 January 2019 to 31 December 2019. It was assumed that the EV users’ coupling behaviors for charging were independent of the season and weather influence. In addition, it was assumed that the sampled chargers could be representative of all the chargers installed in the whole grid of Jeju. The data were provided by the Korea Electric Power Company and included the usage history of 196 chargers in residential areas and 199 chargers in public areas. Information included the charger type, connection start time, connection end time, and charge amount.
-
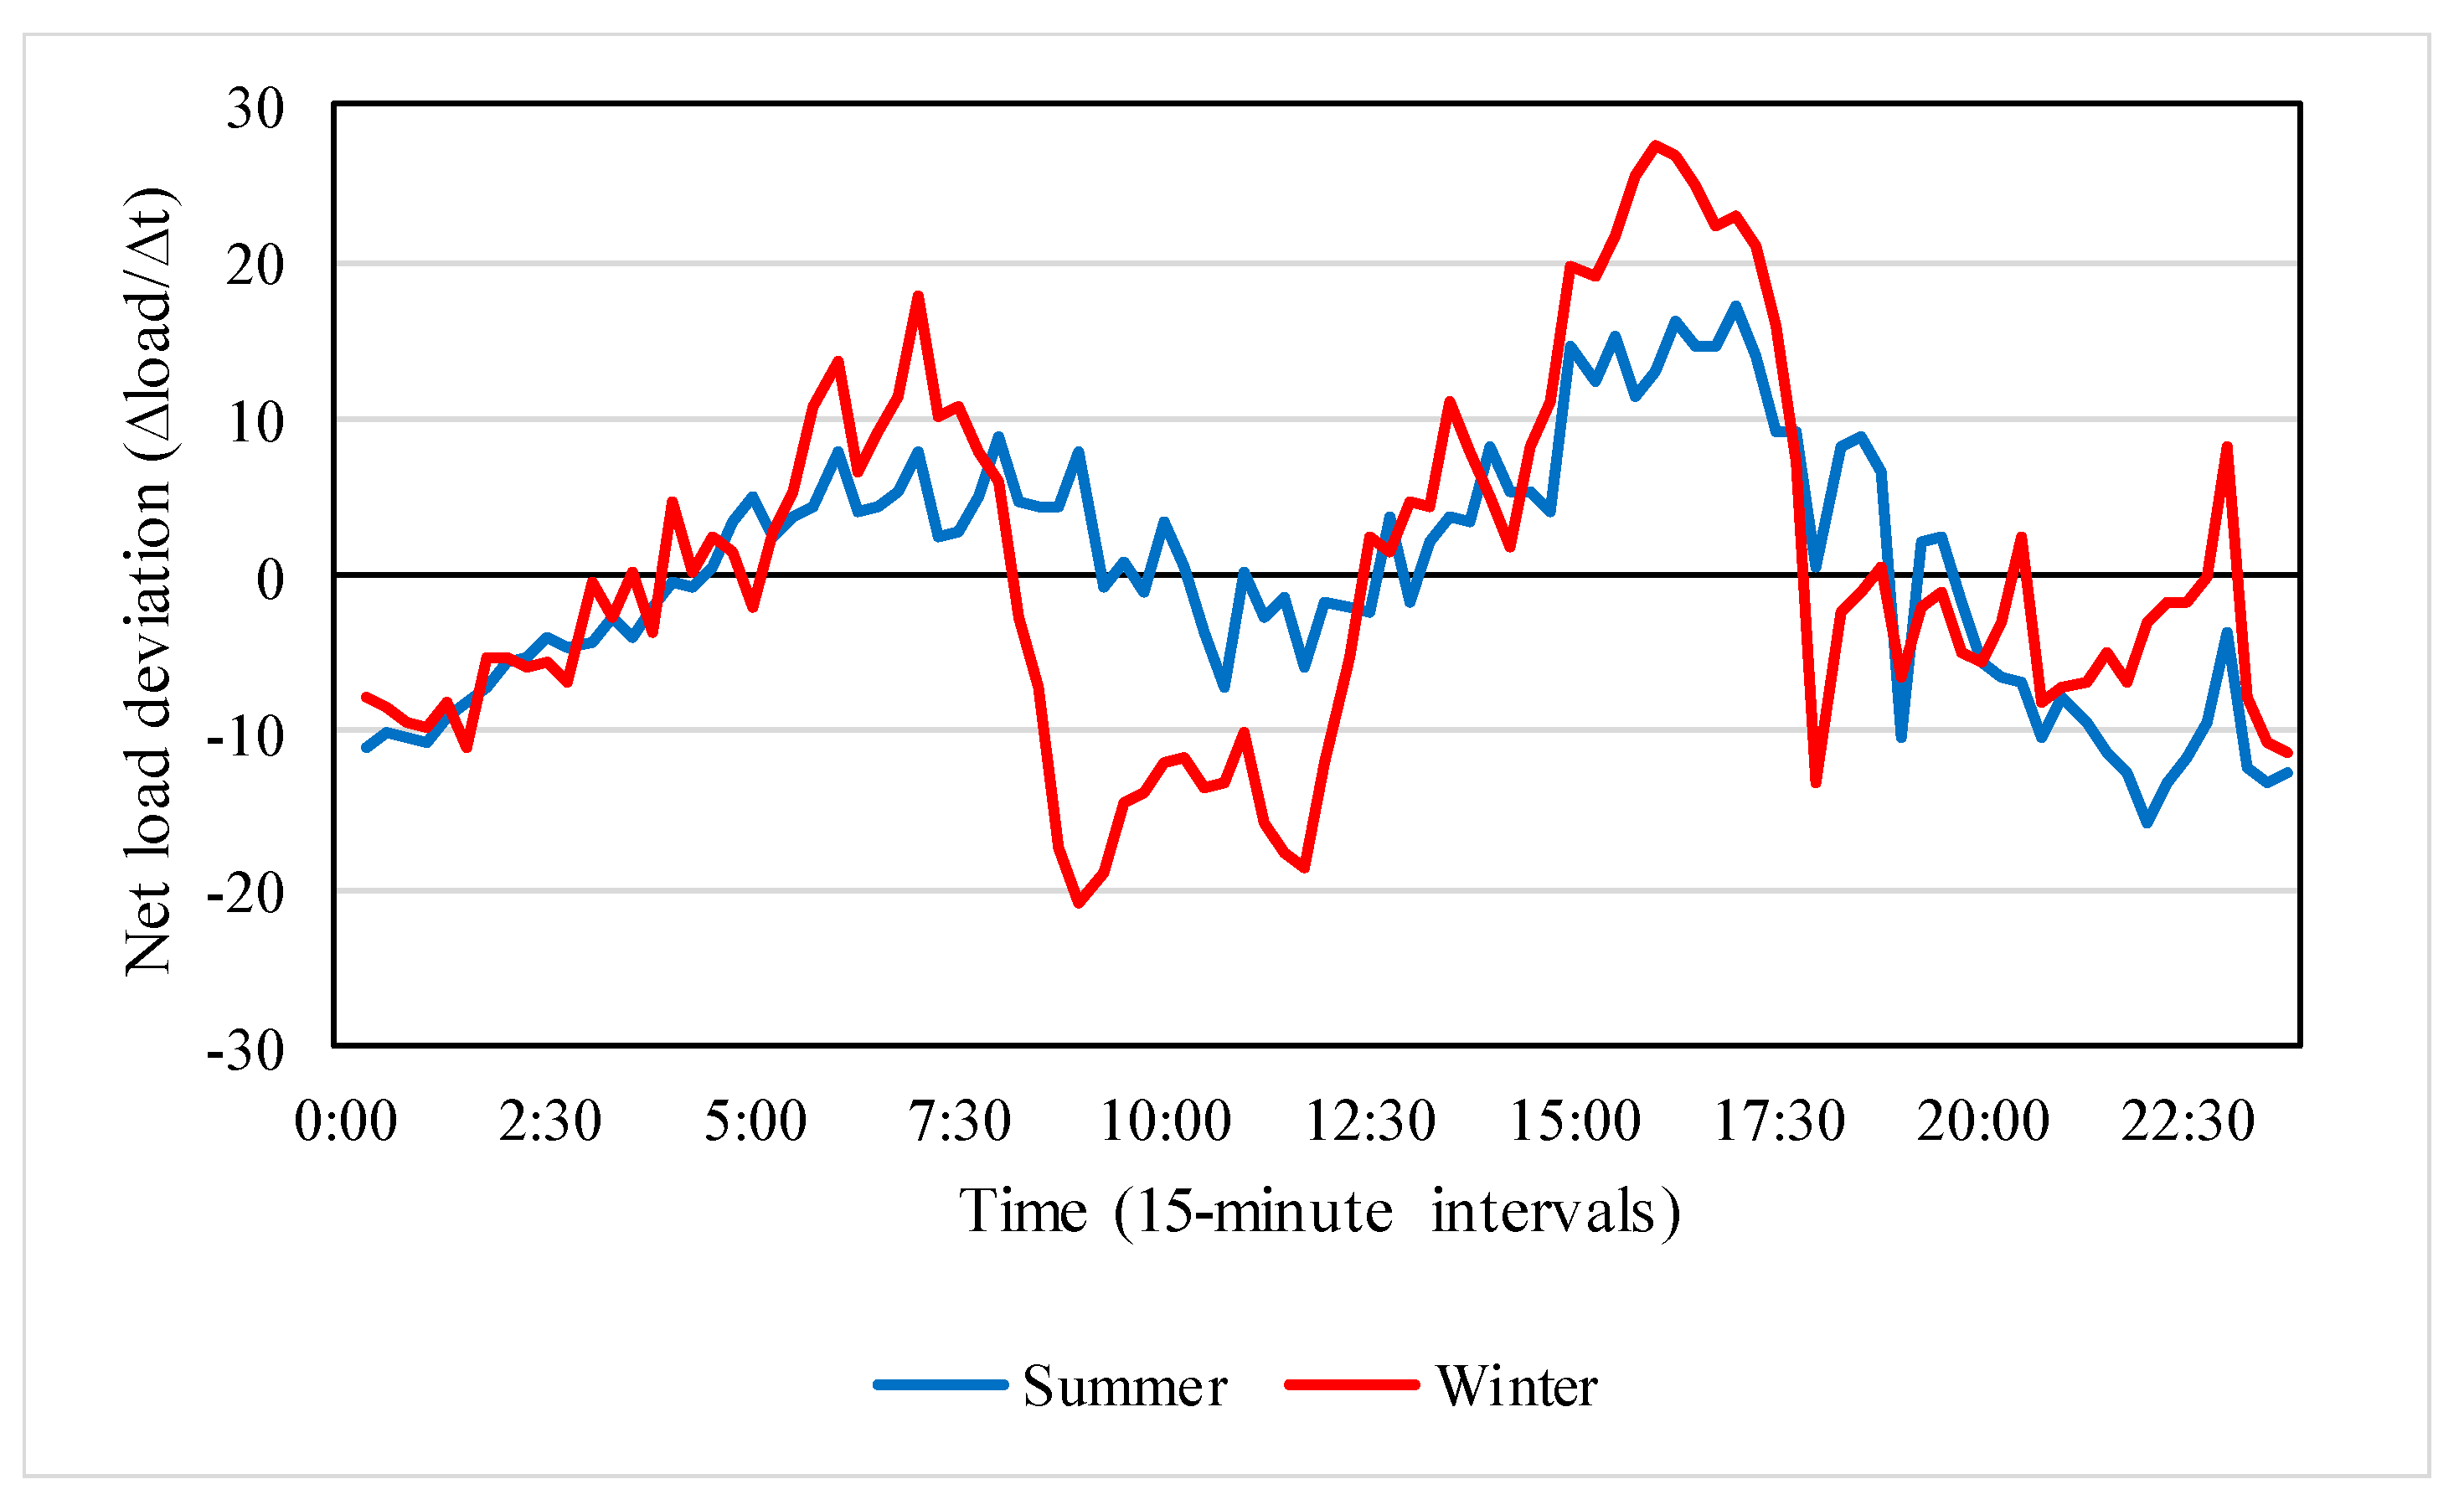
The entire system net load data of Jeju, which was measured in 2021, was applied to set the ramp-up/down periods. The net load was calculated as the difference between system demand and renewable energy generation for summer and winter. It was assumed that the same net load pattern for each time period was shown even during the data-driven charger–EV coupling events.
-
In the TVMC analysis for charger state profile generation, the reference time for the initial state occurrence was fixed at the first time interval. It was assumed that a converged single profile was derived regardless of the setting change of the initial state occurrence time through repeated simulations with a very large number.
-
To solve the optimization problem in the VEFM, mixed integer linear programming was applied. The calculation was performed using MATLAB 2024a with the Gurobi optimizer solver.

4. Results and Discussions

4.1. Technical Flexibility Assessment Results
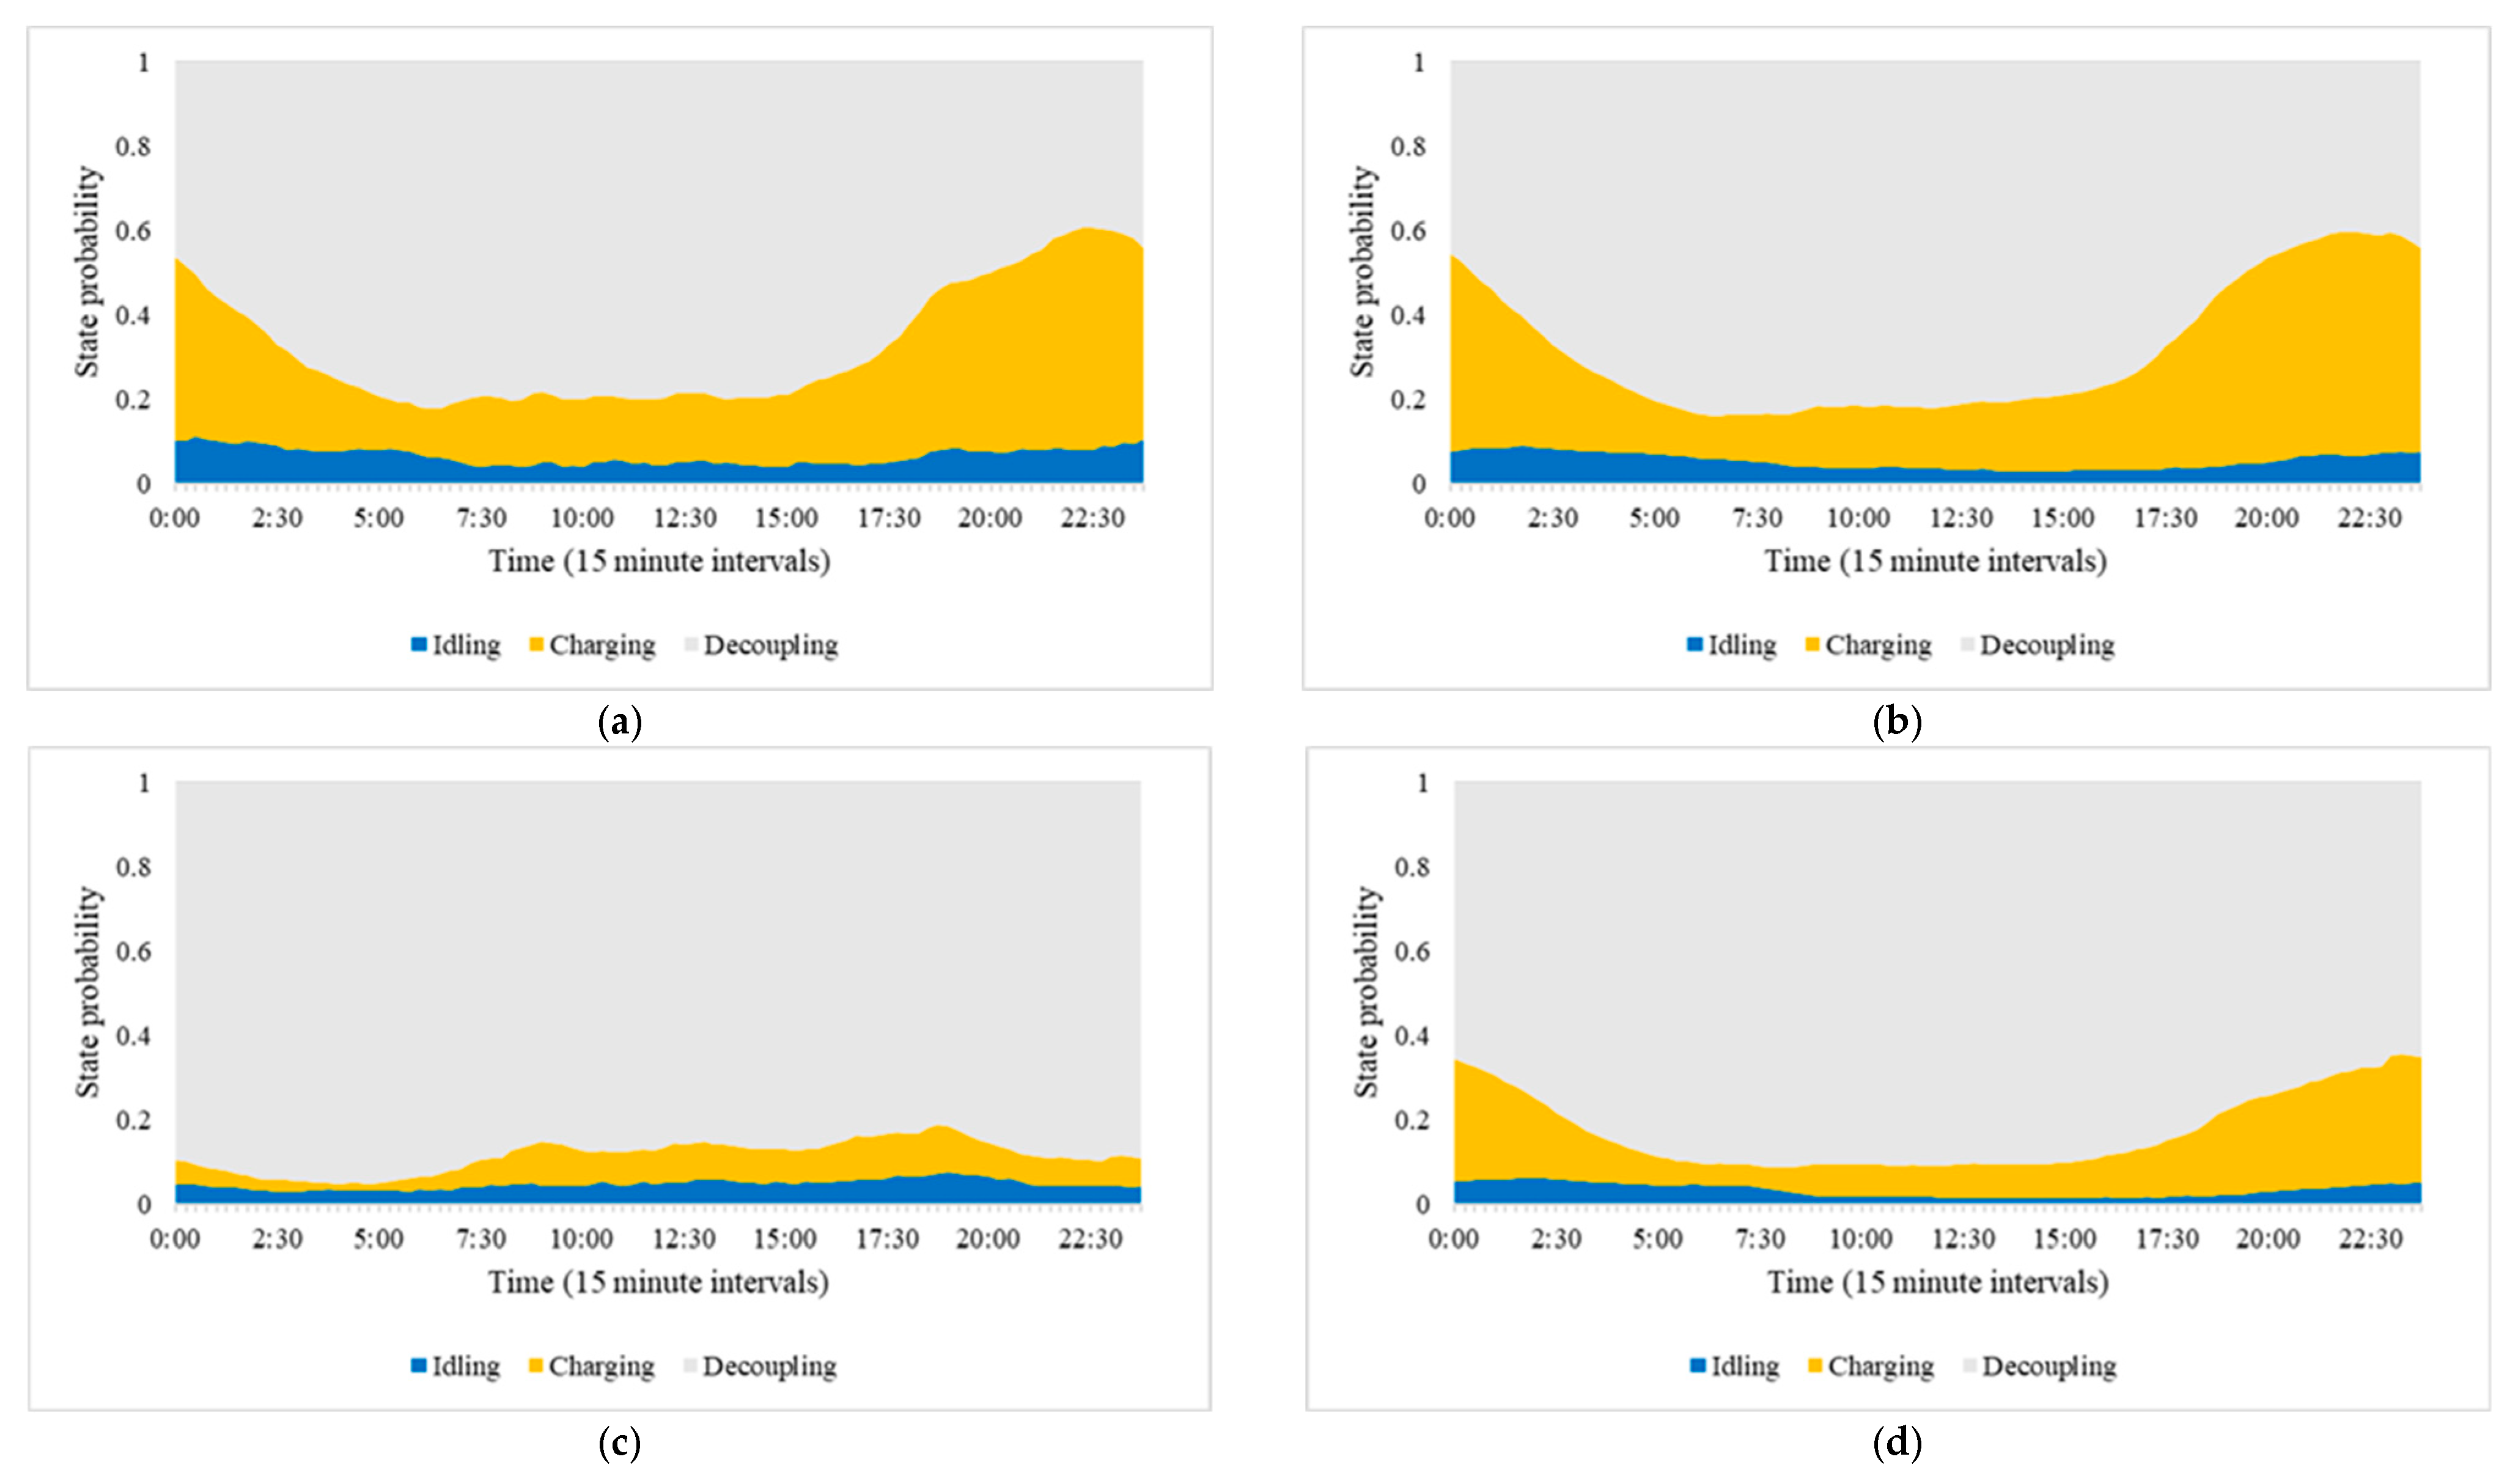
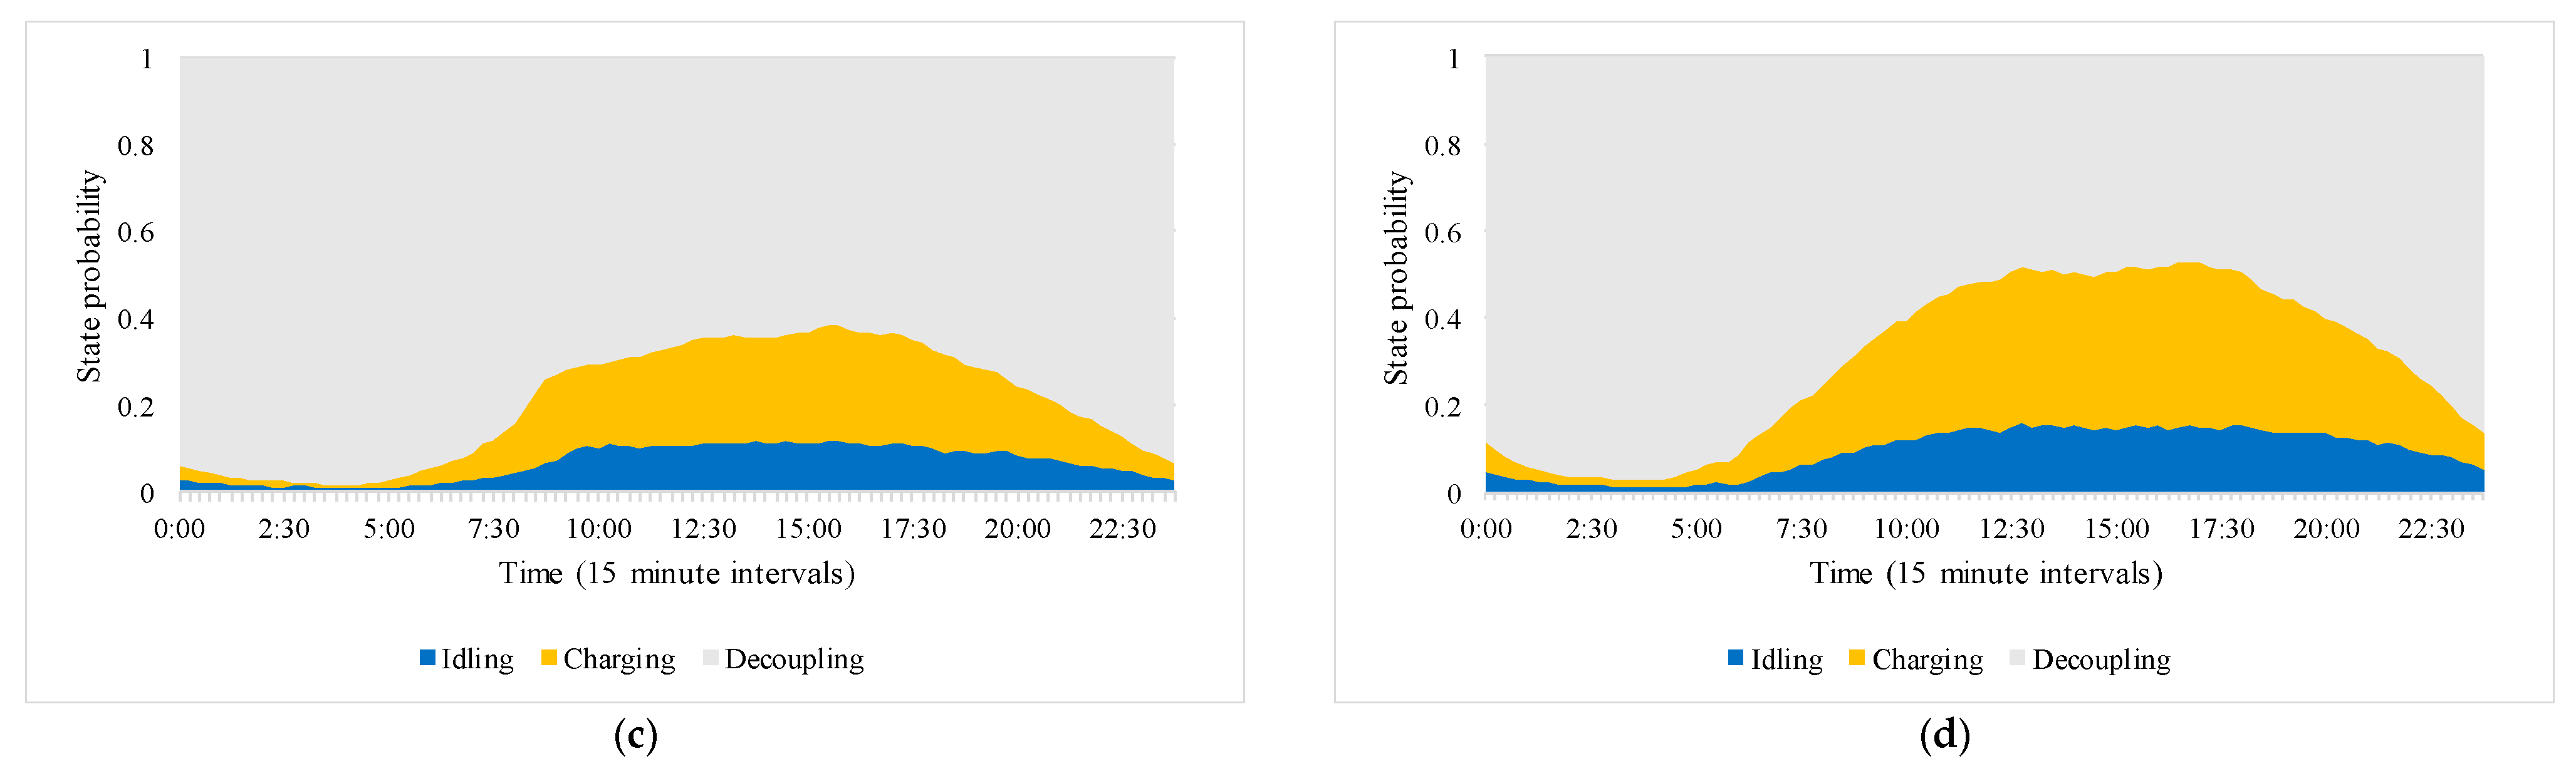
4.1.1. CPGM Results

Firstly, the data were classified based on the installation locations divided into residential and public areas. The number of charger groups in each area was 196 and 119, respectively, and 188 and 113 remaining datasets were used for analysis after preprocessing.
Table 2 shows the information on the charger group according to the charger segmentation. As shown in Figure 5 and Figure 6, in the residential areas, state probability profiles of clusters (a) and (b) clearly revealed late-night coupling patterns. Conversely, the chargers of cluster (a) in the public area were identified as a pattern with a high probability of daytime coupling. Other clusters had significantly lower coupling rates regardless of installation location, and they were excluded from resources for EV2G flexibility evaluation.
Based on the state probability in Figure 5 and Figure 6, the representative state profile of the cluster was generated as shown in Figure 7. Considering the ramp-up/down period, the coupling pattern of the residential areas did not help to secure demand flexibility. Therefore, the chargers of cluster (a) in the public areas were confirmed to be able to participate in market and system environments requiring flexibility in this study and were evaluated through the VEFM.

4.1.2. VEFM Results

In the VEFM, the optimal demand flexibility of charger resources was derived by applying the ramp scores of summer and winter, respectively. In addition, the results of each case based on the initial SoC of Table 1 were confirmed.
As shown in Figure 8, the flexibility secured through the charging/discharging operation was derived based on the initial SoC. It was confirmed that there was a slight difference in securing time period and potential, but the patterns were quite similar.
Figure 9 shows the results of the flexibility assessment based on the ramp scores. It was confirmed that flexibility was appropriately secured to mitigate fluctuation in response to changes in the system net load deviation. The flexibility was calculated with an excellent performance using the optimal operation algorithm of the VEFM considering the net load deviation rate compared to the result of the reference model, in which the same score was applied to the ramp-up/down period. Accordingly, the proposed framework, including the VEFM, was confirmed to improve the reliability of the technical flexibility assessment.

4.2. Interpretation of EV2G Flexibility Contribution Effect by Perspectives

4.2.1. Technical Perspective

About 25,000 chargers are currently installed in Jeju, and the number of chargers is expected to double by 2030 through national promotion. By applying the representative state pattern of the charger cluster selected through the experiment to the same type of chargers in the Jeju system, the effect of decreasing net load fluctuation was analyzed visually.
As shown in Figure 10, the impact of EV2G utilization on net load was analyzed, and it was confirmed that the assessed flexibility can provide the demand flexibility potential of 450–750 MW by replacing the reserve generators in the Jeju system. In addition, by confirming that the operation considering the deviation rate of the system net load softens the system duck curve, the net load alleviation effect from rapid changes over time can be expected.

4.2.2. Economic Perspective

Through the assessment of quantitative flexibility, the economic effect of EV2G systems replacing demand-responsive distributed generators in the distribution system was analyzed. The cost of a diesel generator with a rated capacity of 1000 kW, which is typically utilized for distributed generators, was considered to be $92,000, and the cost of its installation and maintenance was considered to be the same as that for EV2G systems. As a result, it was intuitively confirmed that the economic substitution effect of $414–690 M can be expected, excluding fuel costs. This effect was similar even when substituting generators that contribute to power transmission systems, such as ESS.

4.2.3. Environmental Perspective

In an isolated system, distributed generators are operated dependently to stabilize the power distribution systems. Distributed generators use fossil fuels, and the resulting greenhouse gas emission costs amount to approximately 760 kg CO2 eq/MWh based on LNGs (the lowest) [38]. By operating EV2G systems 250 days a year, carbon dioxide reduction of 85,500–142,250 metric tons can be expected, which greatly contributes to achieving the international goal of carbon neutrality with environmentally responsive energy systems.

5. Conclusions

This study proposed a novel EV2G assessment framework that contributes to the mitigation of power system network problems such as supply–demand imbalance and system net load fluctuation. Accumulated historical records of chargers were analyzed stochastically, and a quantitative assessment of EV2G flexibility was performed via operational optimization based on power system net load information. The experiment was conducted based on the islanded power system and EV charger data in Jeju, South Korea. The results were discussed technically, and their economic and environmental contribution effects were validated. The proposed assessment framework can contribute to stakeholders’ decision-making on the utilization of EV2G systems as a flexible resource based on reliable analysis. Furthermore, for the advancement of the proposed framework, classification and sampling according to the installation location in the charger information dataset are required before analysis, and the improvement of analytic reliability considering bias and deficiencies should be dealt with in a further study.

Author Contributions

methodology, K.K.; supervision, K.B.; validation, E.L.; writing—original draft preparation, K.K., E.L. and K.B.; writing—review and editing, E.L. and K.B. All authors have read and agreed to the published version of the manuscript.

Funding

This study was supported by a research fund from Chosun University, 2024.

Data Availability Statement

The original contributions presented in the study are included in the article, further inquiries can be directed to the corresponding author.

Conflicts of Interest

The authors declare no conflicts of interest.

References

  1. The Paris Agreement. Available online: https://unfccc.int/process-and-meetings/the-paris-agreement/the-paris-agreement (accessed on 27 March 2025).
  2. COP26: What Happened, What Does This Mean, and What Happens Next? Available online: https://www.chathamhouse.org/sites/default/files/2021-11/2021-11-15-COP26-what-happened-summary-Aberg-et-al.pdf (accessed on 27 March 2025).
  3. EU Taxonomy for Sustainable Activities. Available online: https://ec.europa.eu/info/business-economy-euro/banking-and-finance/sustainable-finance/eu-taxonomy-sustainable-activities_en (accessed on 27 March 2025).
  4. Strbac, G. Demand side management Benefits and challenges. Energy Policy 2008, 36, 4419–4426. [Google Scholar] [CrossRef]
  5. Breeze, P. Power Generation Technologies, 3rd ed.; Newnes; Elsevier Ltd.: Amsterdam, The Netherlands, 2019; pp. 219–250. [Google Scholar]
  6. Innovation Operation of Pumped Hydropower Storage: Innovation Landscape Brief. Available online: https://www.irena.org/-/media/Files/IRENA/Agency/Publication/2020/Jul/IRENA_Innovative_PHS_operation_2020.pdf (accessed on 27 March 2025).
  7. Flexibility in Conventional Power Plant: Innovation Landscape Brief. Available online: https://www.irena.org/-/media/Files/IRENA/Agency/Publication/2019/Sep/IRENA_Flexibility_in_CPPs_2019.pdf?la=en&hash=AF60106EA083E492638D8FA9ADF7FD099259F5A1 (accessed on 27 March 2025).
  8. Gharehpetian, G.B.; Mousavi, M. Distributed Generation Systems: Design, Operation and Grid Integration, 1st ed.; Butterworth-Heinemann: Oxford, UK, 2017; pp. 333–368. [Google Scholar]
  9. Kong, Y.; Kong, Z.; Liu, Z.; Wei, C.; Zhang, J.; An, G. Pumped storage power stations in China: The past, the present, and the future. Ren. Sustain. Energy Rev. 2017, 71, 720–731. [Google Scholar] [CrossRef]
  10. Pumped Storage Hydropower: Benefits for Grid Reliability and Integration of Variable Renewable Energy. Available online: https://publications.anl.gov/anlpubs/2014/12/106380.pdf (accessed on 27 March 2025).
  11. Lee, H.G.; Kim, G.-G.; Bhang, B.G.; Kim, D.K.; Park, N.; Ahn, H.-K. Design Algorithm for Optimum Capacity of ESS Connected With PVs Under the RPS Program. IEEE Access 2018, 6, 45899–45906. [Google Scholar] [CrossRef]
  12. Sun, Y. Advances in Power and Energy Engineering: Proceedings of the 8th Asia-Pacific Power and Energy Engineering Conference; CRC Press: Suzhou, China, 2016; pp. 91–96. [Google Scholar]
  13. Karkour, S.; Ichisugi, Y.; Abeynayaka, A.; Itsubo, N. External-Cost Estimation of Electricity Generation in G20 Countries: Case Study Using a Global Life-Cycle Impact-Assessment Method. Sustainability 2020, 12, 2002. [Google Scholar] [CrossRef]
  14. Benefits of Demand Response in Electricity Markets and Recommendations for Achieving Them. Available online: https://www.energy.gov/sites/prod/files/oeprod/DocumentsandMedia/DOE_Benefits_of_Demand_Response_in_Electricity_Markets_and_Recommendations_for_Achieving_Them_Report_to_Congress.pdf (accessed on 27 March 2025).
  15. Micari, S.; Napoli, G. Electric Vehicles for a flexible energy system: Challenges and opportunities. Energies 2024, 17, 5614. [Google Scholar] [CrossRef]
  16. Secchi, M.; Barchi, G.; Macii, D.; Petri, D. Smart electric vehicles charging with centralised vehicle-to-grid capability for net-load variance minimisation under increasing EV and PV penetration levels. Sustain. Energy Grids Netw. 2023, 35, 101120. [Google Scholar] [CrossRef]
  17. Fachrizal, R.; Ramadhani, U.H.; Munkhammar, J.; Widén, J. Combined PV–EV hosting capacity assessment for a residential LV distribution grid with smart EV charging and PV curtailment. Sustain. Energy Grids Netw. 2021, 26, 100445. [Google Scholar] [CrossRef]
  18. Demirci, A.; Tercan, S.M.; Ahmed, E.E.; Cali, U.; Nakir, I. A novel electric vehicle charging management with dynamic active power curtailment framework for PV-rich prosumers. IEEE Access 2024, 12, 120239–120249. [Google Scholar] [CrossRef]
  19. Lei, X.; Yu, H.; Zhong, J.; Jia, Y.; Shao, Z.; Jian, L. Exploring electric vehicle’s potential as capacity reservation through V2G operation to compensate load deviation in distribution systems. J. Clean. Prod. 2024, 451, 141997. [Google Scholar] [CrossRef]
  20. Demand-Side Flexibility for Power Sector Transformation. Available online: https://www.irena.org/-/media/Files/IRENA/Agency/Publication/2019/Dec/IRENA_Demand-side_flexibility_2019.pdf (accessed on 27 March 2025).
  21. Howlader, H.O.R.; Sediqi, M.M.; Ibrahimi, A.M.; Senjyu, T. Optimal Thermal Unit Commitment for Solving Duck Curve Problem by Introducing CSP, PSH and Demand Response. IEEE Access 2018, 6, 4834–4844. [Google Scholar] [CrossRef]
  22. Lotfi, M.; Almeida, T.; Javadi, M.; Osório, G.J.; Catalão, J.P. Coordinated operation of electric vehicle parking lots and smart homes as a virtual power plant. In Proceedings of the 2020 IEEE International Conference on EEEIC/I&CPS Europe, Madrid, Spain, 9–12 June 2020; pp. 1–6. [Google Scholar]
  23. Almeida, T.; Lotfi, M.; Javadi, M.; Osório, G.J.; Catalão, J.P. Economic Analysis of Coordinating Electric Vehicle Parking Lots and Home Energy Management Systems. In Proceedings of the 2020 IEEE International Conference on EEEIC/I&CPS Europe, Madrid, Spain, 9–12 June 2020; pp. 1–6. [Google Scholar]
  24. MansourLakouraj, M.; Shams, M.H.; Niaz, H.; Liu, J.J.; Javadi, M.S.; Catalão, J.P. Optimal Coordination of Hydrogen Vehicle Stations and Flexible Resources in Microgrids. In Proceedings of the 2021 IEEE International Conference on EEEIC/I&CPS Europe, Bari, Italy, 7–10 September 2021; pp. 1–6. [Google Scholar]
  25. Lotfi, M.; Almeida, T.; Javadi, M.S.; Osório, G.J.; Monteiro, C.; Catalão, J.P. Coordinating energy management systems in smart cities with electric vehicles. Appl. Energy 2022, 307, 118241. [Google Scholar] [CrossRef]
  26. Jordehi, A.R.; Javadi, M.S.; Catalão, J.P. Day-ahead scheduling of energy hubs with parking lots for electric vehicles considering uncertainties. Energy 2021, 229, 120709. [Google Scholar] [CrossRef]
  27. Osório, G.J.; Lotfi, M.; Gough, M.; Javadi, M.; Espassandim, H.M.; Shafie-khah, M.; Catalão, J.P. Modeling an electric vehicle parking lot with solar rooftop participating in the reserve market and in ancillary services provision. J. Clean. Prod. 2021, 318, 128503. [Google Scholar] [CrossRef]
  28. Lee, H.; Kim, H.; Kim, H.; Kim, H. Optimal Vehicle-to-Grid Charge Scheduling for Electric Vehicles Based on Dynamic Programming. Energies 2025, 18, 1109. [Google Scholar] [CrossRef]
  29. Shahriar, S.; Al-Ali, A.R.; Osman, A.H.; Dhou, S.; Nijim, M. Prediction of EV Charging Behavior Using Machine Learning. IEEE Access 2021, 9, 111576–111586. [Google Scholar] [CrossRef]
  30. Flammini, M.G.; Prettico, G.; Julea, A.; Fulli, G.; Mazza, A.; Chicco, G. Statistical characterisation of the real transaction data gathered from electric vehicle charging stations. Elec. Power Syst. Res. 2019, 166, 136–150. [Google Scholar] [CrossRef]
  31. Sadeghianpourhamami, N.; Refa, N.; Strobbe, M.; Develder, C. Quantitive analysis of electric vehicle flexibility: A data-driven approach. Int. J. Electr. Power Energy Syst. 2018, 95, 451–462. [Google Scholar] [CrossRef]
  32. Chen, Z.; Zhang, Z.; Zhao, J.; Wu, B.; Huang, X. An analysis of the charging characteristics of electric vehicles based on measured data and its application. IEEE Access 2018, 6, 24475–24487. [Google Scholar] [CrossRef]
  33. Zhang, X.; Chan, K.W.; Li, H.; Wang, H.; Qiu, J.; Wang, G. Deep-learning-based probabilistic forecasting of electric vehicle charging load with a novel queuing model. IEEE Trans. Cybern. 2020, 51, 3157–3170. [Google Scholar] [CrossRef]
  34. Nyamayoka, L.T.E.; Masisi, L.; Dorrell, D.; Wang, S. Techno-Economic Feasibility and Optimal Design Approach of Grid-Connected Hybrid Power Generation Systems for Electric Vehicles Battery Swapping Station. Energies 2025, 18, 1208. [Google Scholar] [CrossRef]
  35. Lami, B.; Alsolami, M.; Alferidi, A.; Slama, S.B. A Smart Microgrid Platform Integrating AI and Deep Reinforcement Learning for Sustainable Energy Management. Energies 2025, 18, 1157. [Google Scholar] [CrossRef]
  36. Aghabozorgi, S.; Shirkhorshidi, A.S.; Wah, T.Y. Time-series clustering—A decade review. Inf. Syst. 2015, 53, 16–38. [Google Scholar] [CrossRef]
  37. Baek, K.; Kim, S.; Lee, E.; Cho, Y.; Kim, J. Data-driven demand flexibility of segmented electric vehicle chargers in the Korean residential sector. Energies 2021, 14, 866. [Google Scholar] [CrossRef]
  38. Baek, K.; Lee, E.; Kim, J. Resident behavior detection model for environment responsive demand response. IEEE Trans. Smart Grid 2021, 12, 3980–3989. [Google Scholar] [CrossRef]
Figure 1. Overall schematic diagram of the proposed framework.
Energies 18 02031 g001
Figure 2. CPGM structure.
Energies 18 02031 g002
Figure 3. Flowchart of TVMC-based state generation.
Energies 18 02031 g003
Figure 4. Ramp score for time in summer and winter.
Energies 18 02031 g004
Figure 5. State probability profiles of clusters for time (residential area, (a) cluster 1, (b) cluster 2, (c) cluster 3, (d) cluster 4).
Energies 18 02031 g005
Figure 6. State probability profiles of clusters for time (public area, (a) cluster 1, (b) cluster 2, (c) cluster 3, (d) cluster 4).
Energies 18 02031 g006aEnergies 18 02031 g006b
Figure 7. Representative state profile for each cluster ((a) residential area (1), (b) residential area (2), (c) public areas).
Energies 18 02031 g007
Figure 8. Flexibility assessment results based on the initial SoC ((a): summer, reference, (b): summer, ramp score, (c): winter, reference, (d): winter, ramp score).
Energies 18 02031 g008
Figure 9. Flexibility assessment results based on the ramp score ((a): summer, (b): winter).
Energies 18 02031 g009
Figure 10. Technical EV2G effect to mitigate the system net load fluctuation.
Energies 18 02031 g010
Table 1. The values of the initial SoC for each case.
Installation LocationCaseInitial SoC
Residential area (1) μ σ 57.9
Μ 73.9
μ + σ 90.71
Residential area (2) μ σ 61.15
Μ 76.85
μ + σ 92.55
Public areas μ σ 62.45
Μ 77.54
μ + σ 92.63
Table 2. The number of chargers for each cluster.
Installation AreaNumber of Clusters
Residential areas(a)6
(b)36
(c)109
(d)20
Public areas(a)5
(b)54
(c)33
(d)21
Disclaimer/Publisher’s Note: The statements, opinions and data contained in all publications are solely those of the individual author(s) and contributor(s) and not of MDPI and/or the editor(s). MDPI and/or the editor(s) disclaim responsibility for any injury to people or property resulting from any ideas, methods, instructions or products referred to in the content.

