Article

Selecting an Installation Site for MW-Scale Water Electrolysis Systems Based on Grid Voltage Stability

1
New Energy Technologies Laboratory, Korea Electric Power Corp, Research Institute, Naju 58277, Republic of Korea
2
Department of Electrical Engineering, Korea University, Seoul 32000, Republic of Korea
*
Authors to whom correspondence should be addressed.
These authors contributed equally to this work.
Energies 2025, 18(8), 2037; https://doi.org/10.3390/en18082037
Submission received: 13 March 2025 / Revised: 8 April 2025 / Accepted: 10 April 2025 / Published: 16 April 2025
(This article belongs to the Section A5: Hydrogen Energy)

Abstract

:
Worldwide, efforts are underway to produce hydrogen from water electrolysis, moving beyond the traditional reforming of fossil fuels. Renewable energy-powered hydrogen production is possible, but the use of grid power is also being considered for large-scale production. Additionally, some demonstration projects aim to utilize electrolysis systems as auxiliary service resources to enhance stability in the grid, given the rising share of renewable energy. This study proposes a method for connecting electrolysis facilities to the grid based on voltage stability analysis. The method involves analyzing the grid power parameters required by the electrolyzer and fault scenarios where low voltage could cause system shutdowns, as observed in actual case studies. By conducting voltage stability analysis simulations that incorporate these fault scenarios, the method identifies locations where the electrolyzer can operate stably within power grids. This approach aims to ensure the stable operation of electrolysis facilities even under conditions of renewable energy loss and low-voltage occurrences in the distribution system due to potential transmission system failures.

1. Introduction

The development of modern industry was made possible through the use of fossil fuels such as coal, petroleum, and natural gas, which possess high energy density (volumetric density, kWh/L or MJ/L) [1,2,3]. However, this reliance on fossil fuels has led to the emission of greenhouse gases, notably carbon dioxide, resulting in a severe climate crisis [4,5]. Consequently, the energy transition has become an unavoidable imperative. Yet, given that most energy infrastructure is based on fossil fuels, it remains uncertain what specific implementation plans are required and how much substantial funding should be allocated to achieve this transition. To minimize the risk of substantial cost investment, it is challenging to identify various implementation plans tailored to each country’s unique energy environment. A systematic approach is crucial, encompassing the development and validation of diverse business models for energy transition, as well as the execution of large-scale projects [6,7,8]. Additionally, it is vital for each country and organization to share essential information related to energy transition and establish a cooperative framework [9,10]. This collaborative effort is necessary because addressing the climate crisis is not the responsibility of a single country or organization, but a global challenge that requires a united response [11].
Hydrogen is gaining attention as a next-generation energy source because it does not emit greenhouse gases when combusted. According to International Energy Agency (IEA) statistics, approximately 175 to 420 GW of electrolysis capacity is expected to be built worldwide by 2030 [12]. The capacity of electrolysis stacks ranges from hundreds of kW to several MW, depending on the type of electrolysis and the mass production capacity of the manufacturer. To supply the power required for such large-scale systems, it may be necessary to construct infrastructure that directly links electrolysis units to renewable energy generation on a corresponding scale. However, simultaneously building power sources and electrolysis infrastructure on a large scale entails an astronomical investment burden. Therefore, to reduce the burden of facility investment, utilizing grid power for electrolysis may be considered to maximize the use of existing infrastructure.
Due to the nature of electricity, its production and consumption must be balanced. Traditionally, power systems have followed demand and regulated supply to maintain stable operation. Power generation and transmission systems based on alternating current (AC) have managed power supply by controlling the output of AC generators. However, the increasing share of renewable energy, which is variable and intermittent, in the electricity mix can lead to imbalances in electricity demand and supply [13]. This may result in increased uncertainty, overproduction, and low inertia in the future power system. To ensure the stability of the power system, securing flexible resources becomes crucial. Energy storage systems (ESSs) are needed as backup facilities for renewable energy within the power system [14]. ESSs can be classified according to their storage capacity and cycle (backup time). Short-cycle energy storage devices, such as supercapacitors or batteries, can respond to variability, such as frequency maintenance and real-time supply–demand balancing [15]. Long-cycle ESSs, such as pumped storage hydropower (PSH), can address oversupply issues, such as load leveling [16]. Additionally, power-to-gas (P2G) technology, which uses electricity to produce usable gas via electrolysis, is gaining attention as a long-term energy storage solution [17]. Electrolysis in the power grid could help improve power quality and reduce power losses [18].
Recently, projects have been initiated to use electrolysis for auxiliary grid services. For example, a study on the dynamic modeling and effectiveness of electrolyzer systems was conducted using real-time simulations [19]. Power grid auxiliary service projects utilizing electrolysis are being carried out in many countries. In these projects, electrolysis provides 63% grid balancing services and 37% frequency control services [20]. For example, it enables participation in the electricity market through frequency control services that leverage the short response time of polymer electrolyte membrane (PEM) electrolysis, as well as the capability to provide grid balancing services as reserve resources, such as Frequency Containment Reserves (FCRs) and Frequency Restoration Reserves (FRRs) [20,21]. Frequency Containment Reserves (FCRs) and Frequency Restoration Reserves (FRRs) are essential ancillary services designed to maintain frequency stability in power systems, primarily implemented within the European electricity grid. The Frequency Containment Reserve (FCR) is the primary reserve that automatically detects and immediately compensates for sudden frequency deviations in the power system to stabilize the frequency. It activates within seconds by adjusting power generation or consumption to counteract frequency fluctuations. This service is essential for maintaining the grid’s balance and preventing potential disruptions. Following the initial stabilization by the FCR, the Frequency Restoration Reserve (FRR) serves as the secondary reserve to restore the system frequency to its nominal value and maintain it.
Conventional studies suggest that water electrolysis systems are effective as facilities for providing ancillary power services, but they do not present methodologies for the stable operation of such systems. To enable stable large-scale hydrogen production, a reliable power supply is essential. Maximizing the utilization rate and efficiency of electrolysis facilities, which require significant investment, is crucial for ensuring long-term business viability. An unexpected power outage that halts electrolysis operations can not only disrupt hydrogen production, negatively impacting business viability, but also cause failures in electrolysis stacks or the Balance of Plant (BOP). Operating a water electrolysis system below the reaction voltage can cause damage to the electrolysis stack. Higher Heating Value (HHV) refers to the total amount of energy released when hydrogen is combusted, including the latent heat from condensing the produced water vapor. In water electrolysis reaction, the voltage corresponding to the HHV is approximately 1.48 V. Lower Heating Value (LHV) refers to the usable energy from hydrogen combustion, excluding the latent heat of vapor condensation. In the water electrolysis reaction, the voltage corresponding to the LHV is approximately 1.23 V. Low-temperature electrolysis stacks such as PEM or alkaline pose safety or failure-related issues if hydrogen production is suddenly stopped after being performed at voltages higher than the Higher Heating Value (HHV, 1.48 V) [22,23,24]. This can lead to a decrease in the concentration of produced hydrogen or oxygen, deterioration of the stack components, and a shortened stack lifespan. After a sudden stop, the residual hydrogen and oxygen inside the stack may cause the voltage to drop below the Lower Heating Value (LHV, 1.23 V), which may cause irreversible damage to the electrolyte membrane when the electrolysis voltage drops to about 0.7 V [25]. This includes membrane thinning and pin-hole formation, resulting from the reaction between oxygen radicals promoted by metal ions and the PFSA polymer chain [25,26]. Furthermore, in alkaline systems, the flow of the high-concentration aqueous KOH electrolyte solution may stagnate, leading to blockages due to precipitation [27,28].
Auxiliary power sources such as an uninterruptible power supply (UPS) system can serve as a preventive measure against abnormal interruptions in electrolysis. This involves securing two or more power sources and temporarily switching to an alternative power source when a problem occurs. More fundamentally, it is essential to install electrolysis systems in grid locations with excellent power quality to ensure reliable input power. Electrolysis systems require a stable voltage for optimal stack and system operation; significant voltage fluctuations can deteriorate the efficiency and stability of the system. From a power system perspective, installing electrolysis systems in locations with stable power quality can support their continuous operation. Therefore, this study suggests a method for selecting locations with optimal connection for electrolysis systems based on voltage stability analysis. This method aims to secure stable operation of electrolysis facilities under conditions of renewable energy loss and low-voltage occurrences in the distribution system due to potential transmission system failures. The method suggests optimal connection points for electrolysis systems by analyzing the operability of the system and voltage stabilities of each bus in the power grid under grid fault conditions. The expected effects include improved operational efficiency and longevity of electrolysis equipment, as well as enhanced resilience of the power grid.

2. Considerations to Select Optimal Electrolysis Connection Locations

Four key factors were considered in selecting the optimal grid connection location to ensure the stable operation of the water electrolysis system: Section 2.1 the conditions under which the water electrolysis system might shut down, Section 2.2 transmission system faults that could lead to low voltage in the distribution system, Section 2.3 the voltage stability of the distribution system, and Section 2.4 the connectable power margin based on both the voltage stability and the power supply margin of the distribution system.

2.1. Required Specifications for the Electrolysis System Operation

The shutdown conditions for water electrolysis are defined as the cessation of operation due to faults in the power system. They were derived based on the electrical input specifications required by the major components of the water electrolysis system. The components of the water electrolysis system can be broadly divided into three categories: stack, Electrical Balance of Plant (E-BOP), and Mechanical Balance of Plant (M-BOP). Balance of Plant (BOP) refers to all auxiliary systems excluding the stack in the water electrolysis system. It plays a critical role in ensuring the stability of the entire system by managing the power supply, water supply, cooling, gas treatment, control, and safety function.

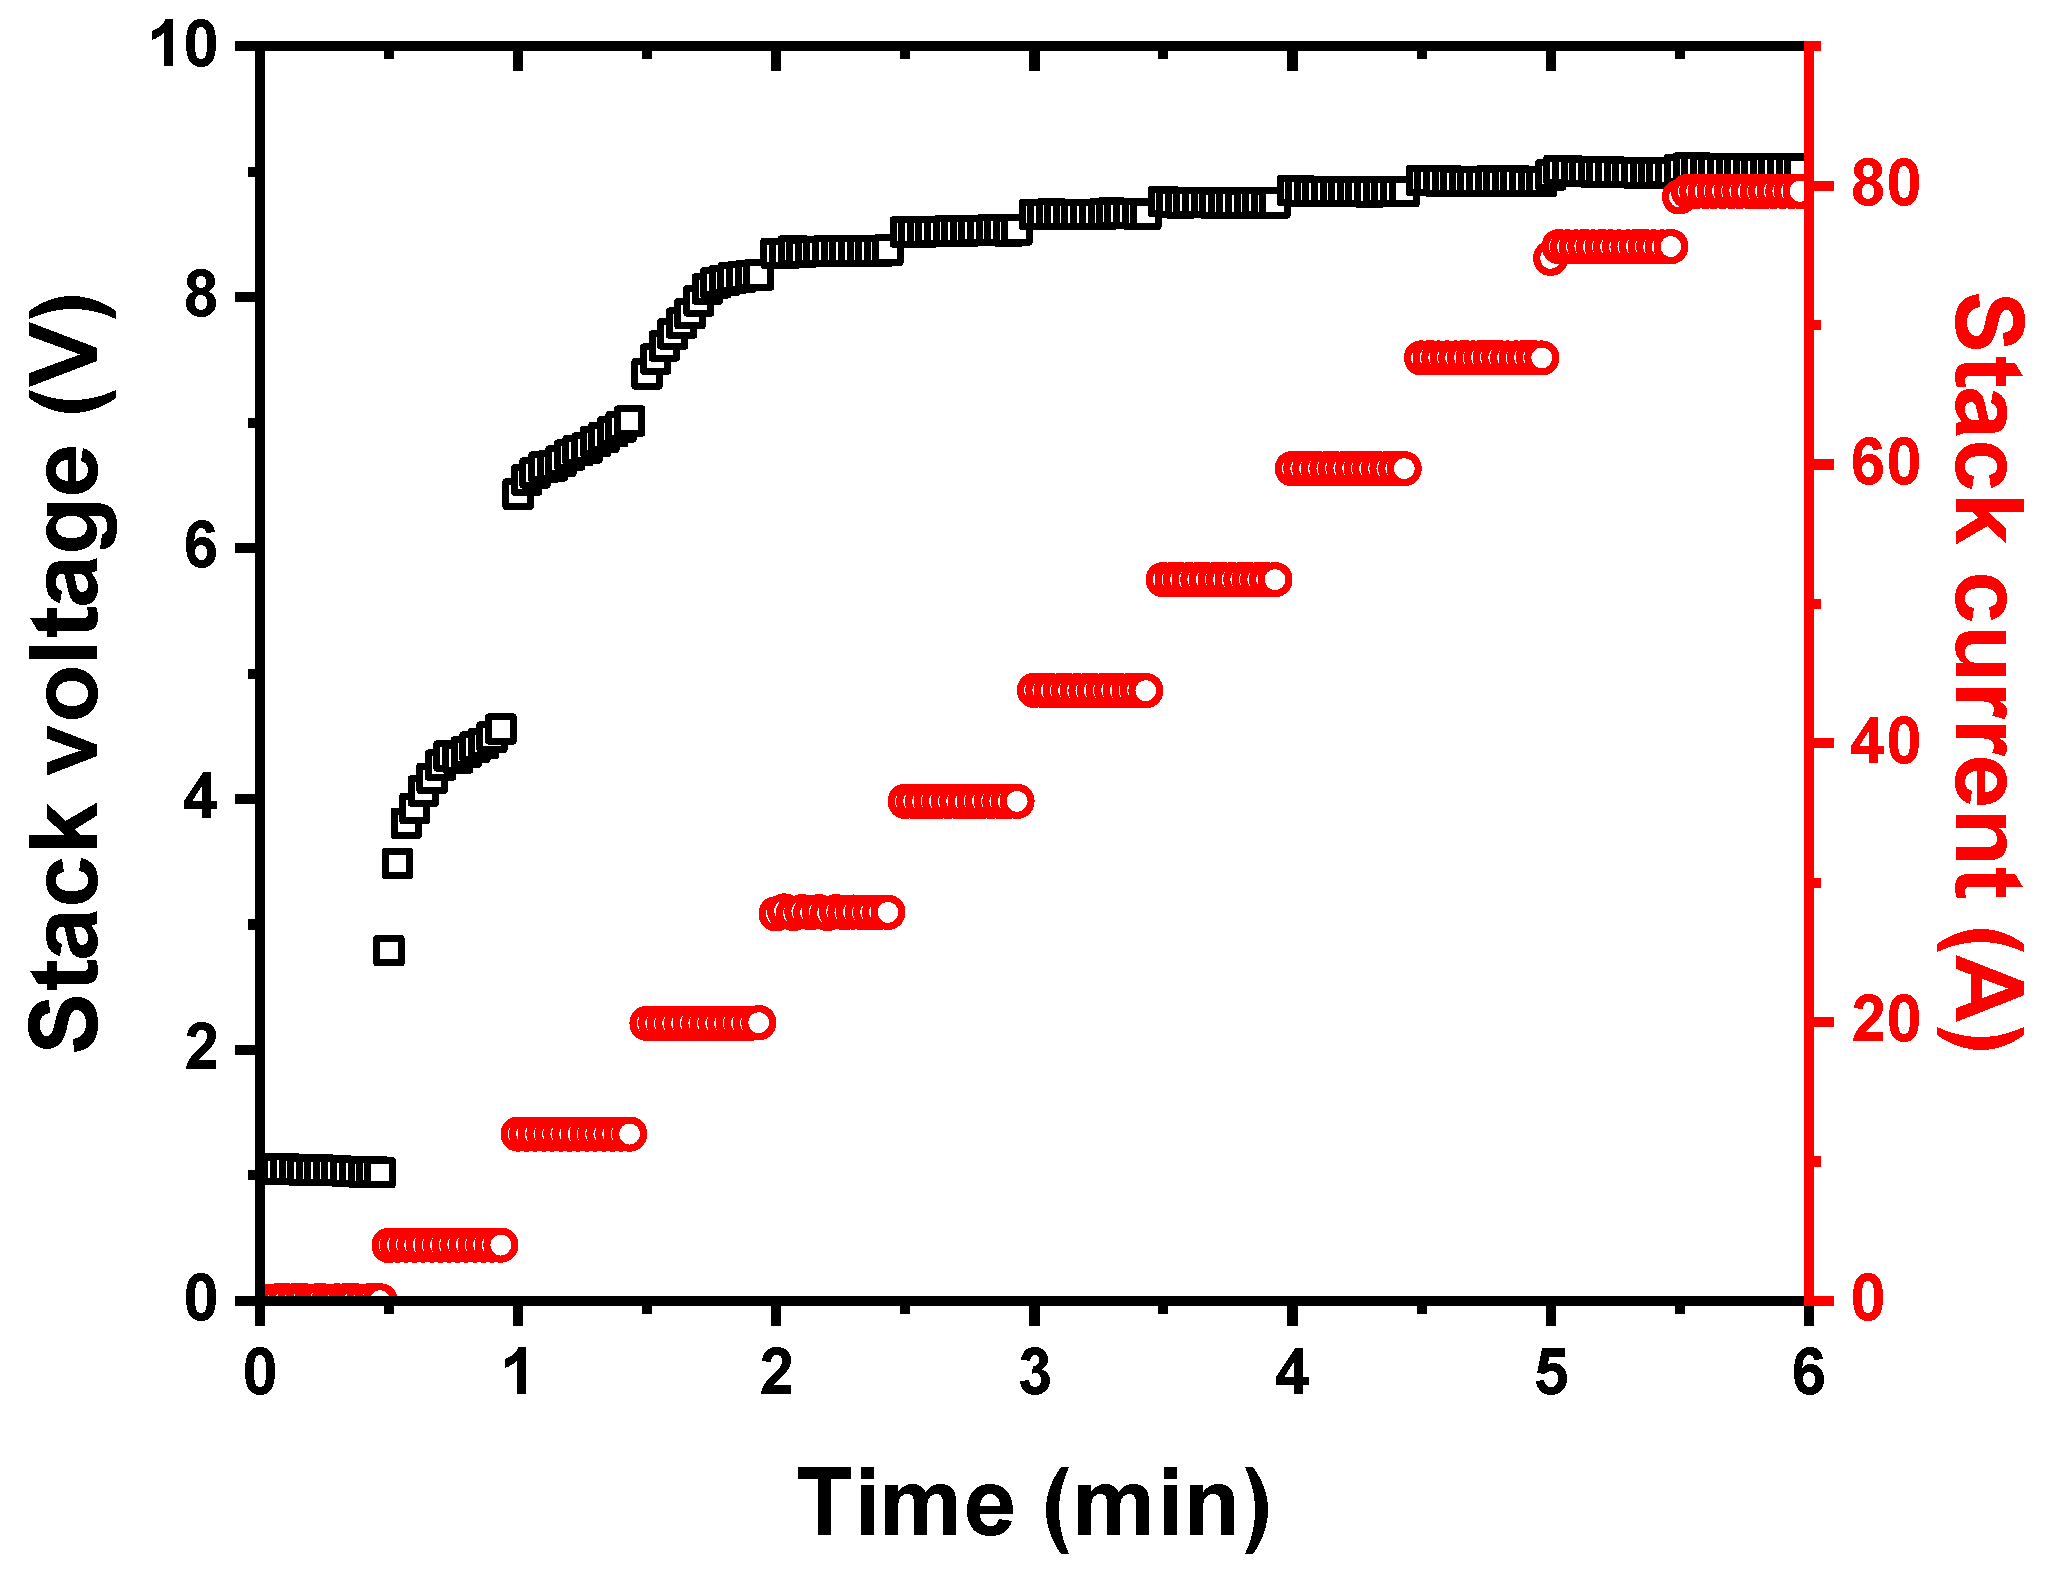
2.1.1. Electrolyzer Stack

The stack is the core component of a water electrolysis system, responsible for electrochemical water splitting into hydrogen and oxygen using electrical energy. Figure 1 presents experimental data from an alkaline water electrolysis stack. The performance curves were measured using a kW-class alkaline stack consisting of five unit cells. Circular nickel foams with a diameter of 16 cm were used as hydrogen and oxygen evolution electrodes. A porous separator with a thickness of 500 μm (Zirfon Perl UTP 500, AGFA, Belgium) was employed, and the stack current density was designed to be 400 mA/cm2 at 1.8 V per cell. A 30 wt% KOH aqueous solution served as the electrolyte. The evaluations were conducted using an alkaline electrolyzer testing station from CNL Energy, with the power supply set to 20 V and 76 A. In Figure 1, it can be observed that the operational characteristics of the water electrolysis change around a voltage of approximately 1.6 V. In the voltage region below approximately 1.6 V, it is observed that the voltage increases under a constant current condition and further increases as the current magnitude rises. Equation (1) provides the mathematical definition of a capacitor, indicating that the capacitor voltage is the integral of the current flowing into the capacitor. This implies that in the voltage region below approximately 1.6 V, the water electrolysis cell operates as a capacitor due to the electric double layer of the electrode before the reduction reaction is activated.
V c = 1 C i d t
In the voltage region above approximately 1.6 V in Figure 1, it is observed that the water electrolysis voltage remains constant with the applied current. Equation (2) represents Ohm’s Law, which shows that the voltage applied across a resistor is linearly proportional to the current flowing through the resistor. Therefore, this indicates that in the voltage region above approximately 1.6 V, where the reduction reaction is activated, the water electrolysis cell behaves electrically as a passive resistor.
V R = I R R
The water electrolysis stack responds passively to the DC power supply within its operating range. This means that the stack’s normal operation or sudden shutdown within the water electrolysis system’s operating range is entirely dependent on the Electrical Balance of Plant, which supplies DC power to the stack, and the Mechanical Balance of Plant, which circulates gas and fluid within the stack. Therefore, the stack is not a direct reason for the shutdown of the water electrolysis process caused by faults in the power system.

2.1.2. Electrical Balance of Plant

The Electrical Balance of Plant is a power supply unit that provides DC power to the stack. In a large-scale water electrolysis system, commercial AC grid power is converted to supply DC power to the stack. Key factors are analyzed for the operational shutdown of the Electrical Balance of Plant in a 1 MW alkaline water electrolysis system installed in Naju, Republic of Korea.
Table 1 shows the Electrical Balance of Plant’s electrical specifications in the water electrolysis system. In Table 1, the rated specifications on the AC side as input for the Electrical Balance of Plant refer to the amount of electricity supplied through the AC power system when it is operating at its rated condition. The power for the 1MW water electrolysis system is supplied by connecting two 0.6 MVA Electrical Balance of Plant units in parallel, as shown in Table 1. The operating specifications refer to the supply conditions required by the AC grid for the operation of the Electrical Balance of Plant. The output specifications indicate the electrical impact of the Electrical Balance of Plant’s operation on the quality of the AC power system.
In the shutdown operating conditions of Electrical Balance of Plant, the key parameters are the operating voltage and frequency. Frequency variations are affected by a supply–demand energy balance in the power grid system rather than specific locations. In an AC grid system, when demand exceeds supply, the AC grid frequency slows down, and when supply exceeds demand, the AC grid frequency speeds up. Therefore, AC grid frequency is not a suitable factor for selecting optimal connection locations for electrolysis operations within the grid system. AC grid voltage is inversely proportional to AC distribution line impedance within the grid system. The longer the distribution line, the lower the voltage at that location. Moreover, short circuits and ground faults in transmission lines are major causes of low grid voltage in the connected distribution lines. Due to faults in the transmission system, the system voltage varies at different locations within the distribution system, allowing suitable locations to be selected based on the operating voltage range of the Electrical Balance of Plant. Thus, this study has selected an operating voltage range within ±10% of the rated voltage as a critical shutdown condition for Electrical Balance of Plant to select the optimal location of electrolysis systems.

2.1.3. Mechanical Balance of Plant

In an alkaline water electrolysis system, the Mechanical Balance of Plant generally consists of pumps (motors), thermal equipment for freeze protection, and sensors for operational monitoring. The pumps account for approximately 70%, while the remaining 30% is made up of other components. The power source specifications required by the Mechanical Balance of Plant can be determined by analyzing the power source requirements of the inverters (power conversion equipment) used for pump control and the protective relays needed to safeguard sensors and thermal equipment.
Table 2 shows the electrical specifications of the inverter used for KOH pump control in the alkaline water electrolysis system. The inverter requires a three-phase 380~480 V AC voltage, with an operating range of +10% to −15%. Table 3 shows the electrical specifications of the power supply for the protective Solid-State Relay (SSR). According to Table 3, the power supply has a permissible voltage range of ±10% relative to the nominal voltage (110 V or 220 V). When selecting the more sensitive voltage range of the two, an operating voltage range within ±10% of the nominal voltage was chosen as a critical shutdown condition for the Mechanical Balance of Plant.

2.2. Fault in the Power Transmission System

A scenario was designed in which a water electrolysis facility is disconnected from the power system, based on actual events. In Australia, on 28 September 2016, from 3:00 p.m., one hour before the blackout, the output volatility of wind turbines deteriorated rapidly, and many transmission facilities were repeatedly experiencing minor outages and recoveries even before the blackout occurred. Due to tornadoes that occurred simultaneously in two regions, multiple faults occurred on the 275 kV transmission line spanning 170 km, leading to a prolonged low-voltage condition that caused a sharp drop in wind turbine output. As a result, 850,000 customers across Adelaide, South Australia, experienced power outages [29].
This paper considers a scenario for selecting the optimal connection location for a water electrolysis system, based on the case of South Australia. It examines the disconnection of the water electrolysis system due to low voltage in the distribution system caused by a fault in the transmission line. To ensure continuous power supply even if there is one line fault of one transmission line, the power distribution system is supplied by a second transmission line. As the fault of both lines would lead to a power outage in the distribution system, a fault in the transmission system is defined as the fault of one of the two lines.

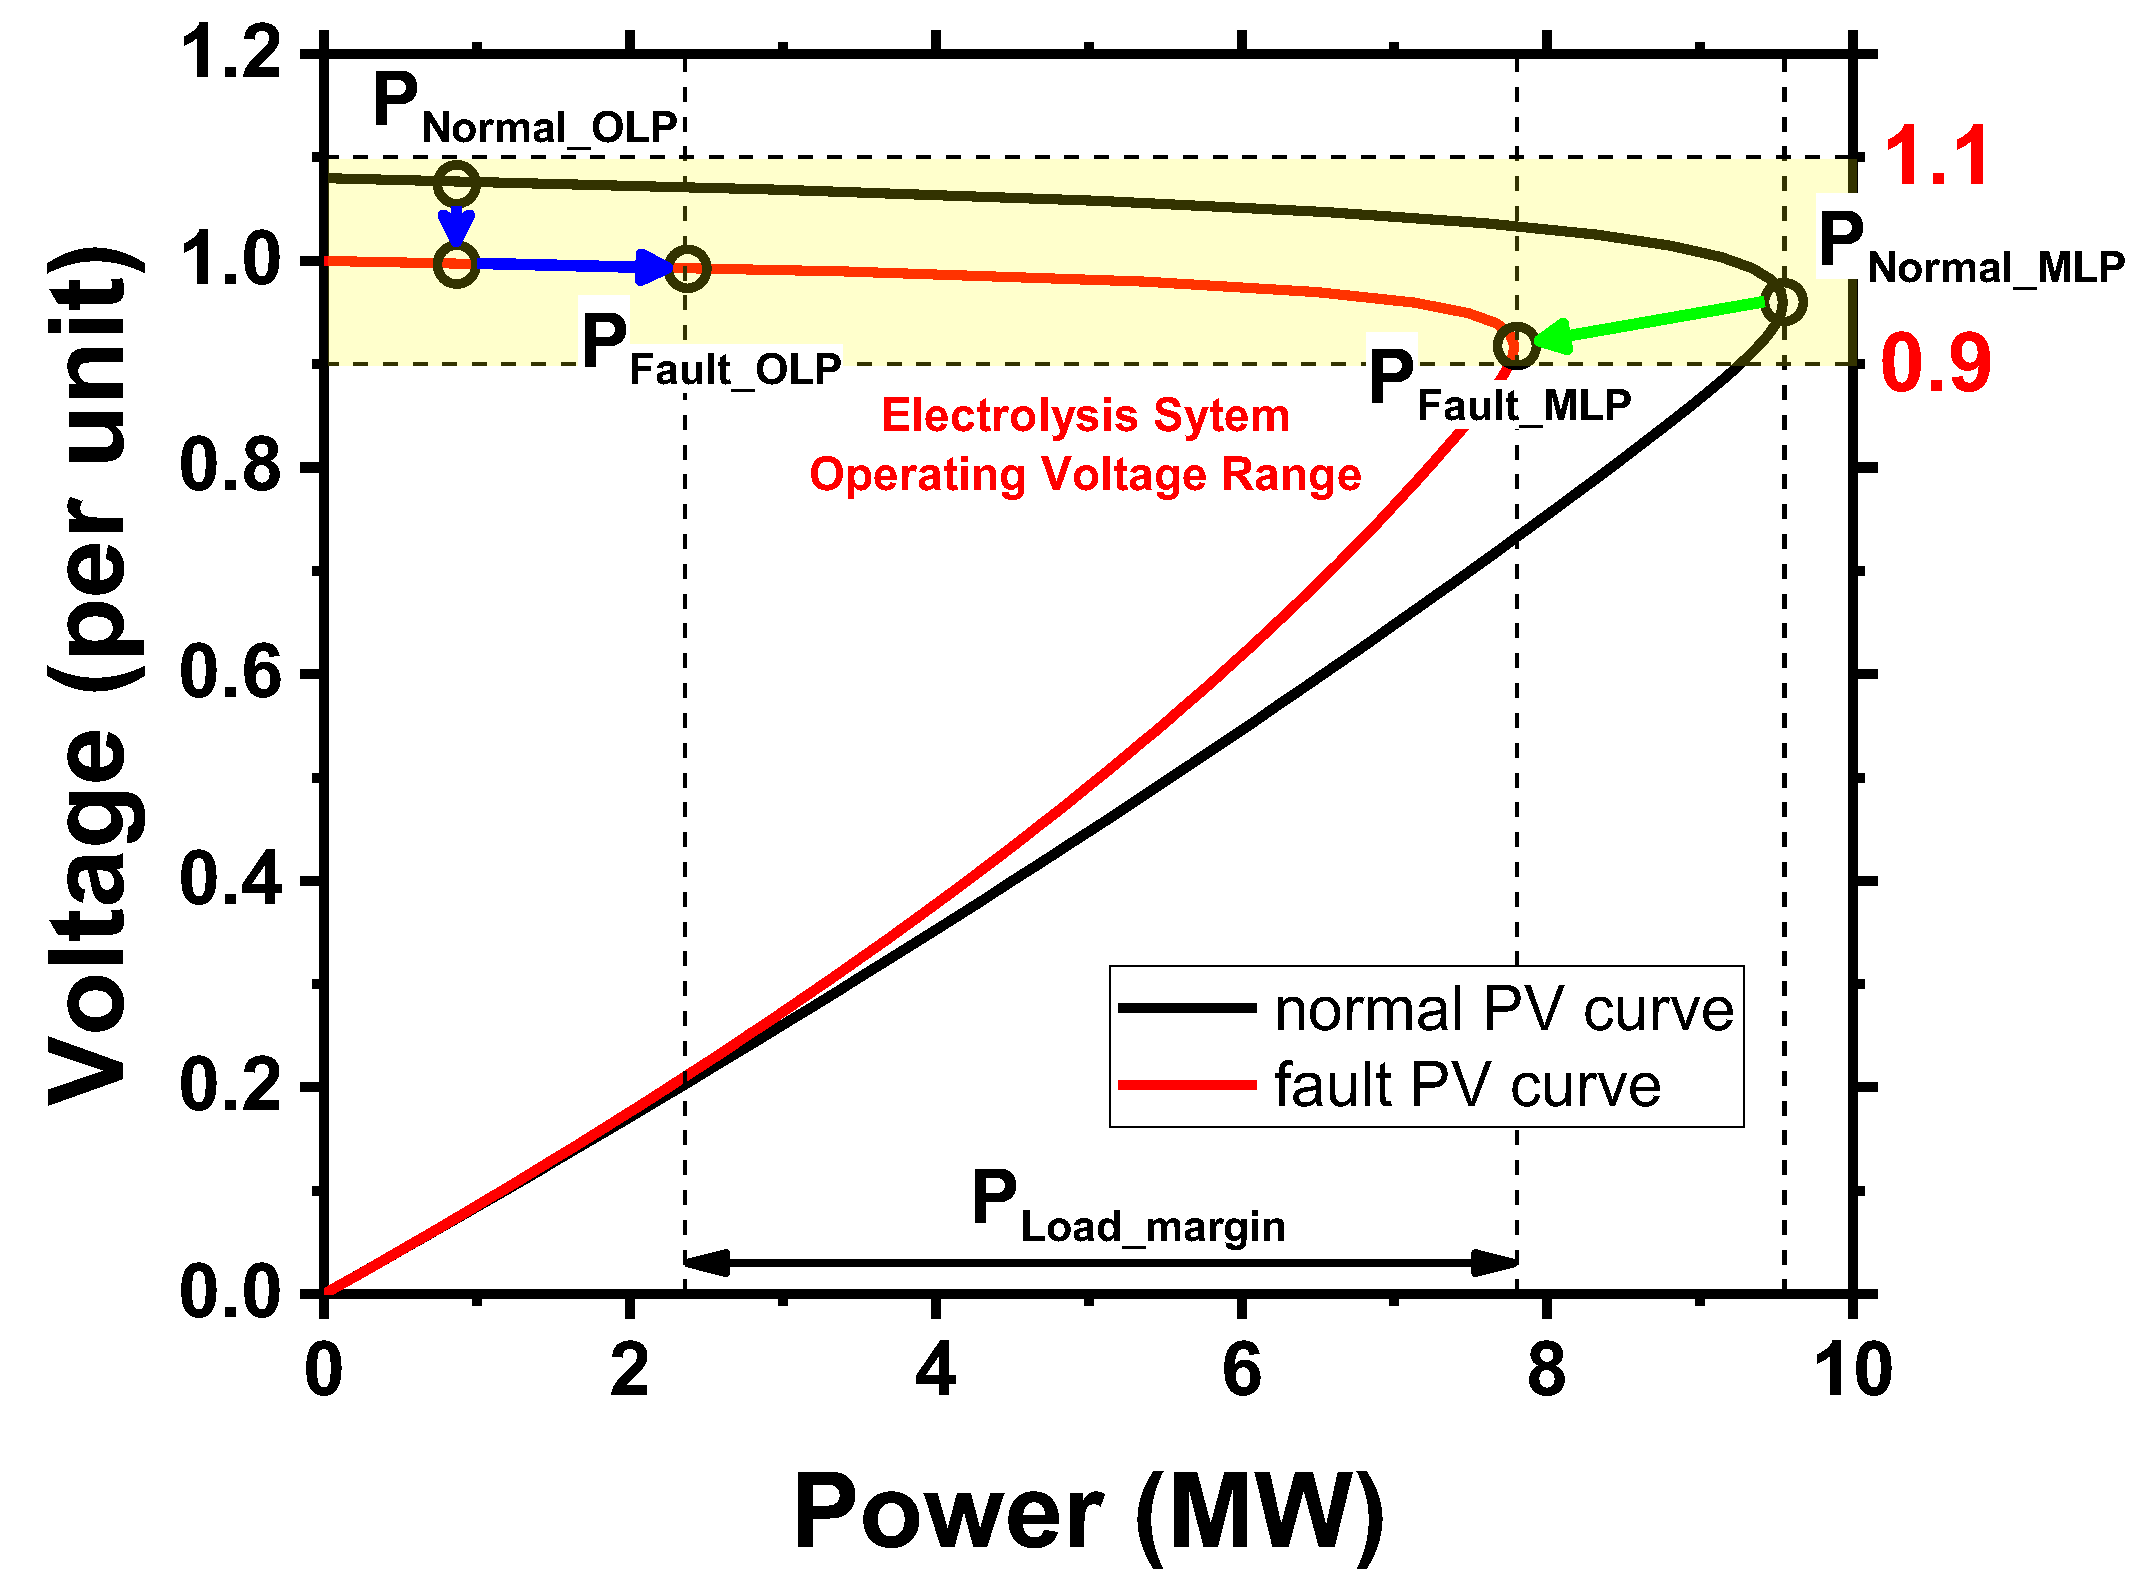
2.3. Calcutate the Power Load Margin in Voltage Stability to Maintain the Operation of the Electrolysis System

Voltage stability refers to the power system’s ability to maintain voltages steadily as close to the nominal value as possible at all buses. When the load in a power system reaches a critical level, adding more load can cause a significant drop in the load bus voltage, potentially leading to voltage collapse. At this point, the total load power that the system can sustain is referred to as the voltage stability limit, which serves as an indicator of the system’s voltage stability [30].
Following a single-line fault in the transmission system, the buses from which renewable energy sources are disconnected are identified. Then, candidate buses that satisfy the operating voltage range of the electrolysis system are selected. By analyzing the continuous power flows of these selected buses, the power load margin of each bus is derived, in consideration of both the operating voltage range of the electrolysis system and maximum load point based on voltage stability.
Figure 2 shows the concept of calculating the margin of load capacity based on voltage stability criteria when the voltage at the voltage stability limit point meets the normal operating voltage range for the electrolysis system under a single-line transmission line fault condition. The PV curve in Figure 2 shows the relationship between the system load’s real power and system voltage, based on a continuous power flow analysis. In the PV curve, the region where the system load’s real power and system voltage are inversely proportional indicates that voltage is being supplied steadily to all loads in the system, while the region where they are proportional can only be interpreted mathematically and is irrelevant in voltage stability analysis. The black line in Figure 2 represents the PV curve under normal operating conditions with two transmission lines. The red line represents the PV curve under the condition of a single-line transmission line fault. It shows that the maximum load capacity the system can handle decreases due to the single-line fault. The drop in system voltage due to the single-line fault can cause renewable energy to drop out of the system, which leads to an increase in the net load of the system under the single-line fault condition compared to the system under normal transmission line conditions. When the voltage at the voltage stability limit point under a single-line fault condition meets the normal operating voltage range for the electrolysis system, the power load margin of the power system based on the voltage stability criteria is defined as the power difference between the operating point and the voltage stability limit point of the power system under the single-line fault, as shown in Equation (3).
P L o a d _ M a r g i n = P F a u l t _ M L P P F a u l t _ O L P
  • P L o a d _ M a r g i n : load margin based on voltage stability.
  • P F a u l t _ M L P : maximum load point after renewable energy is disconnected in the grid system.
  • P F a u l t _ O L P : operating load oint after renewable energy is disconnected in the grid system.
Figure 3 shows the concept of calculating the power load margin of the power system based on voltage stability criteria when the voltage at the voltage stability limit point is below the normal operating voltage range for the electrolysis system under a single-line transmission line fault condition. In Figure 3, the black line represents the PV curve under normal operating conditions with two transmission lines. The pink line represents the PV curve under the condition of a single-line transmission line fault. Due to the dropout of renewable energy caused by a single-line transmission fault, the power and voltage at the voltage stability limit point decrease, and the net load power at the operating point increases while the voltage decreases. When the voltage at the voltage stability limit point under a single-line fault condition is below the normal operating voltage range for the electrolysis system, the power load margin based on the voltage stability criteria is defined as the power difference in between an operating point of the power system under the single-line fault and the lower voltage limit (0.9 p.u.) of the normal operating voltage range for the electrolysis system, as shown in Equation (4).
P L o a d _ M a r g i n = P F a u l t _ 0.9 ( p . u . ) _ v o l t P F a u l t _ O L P
P F a u l t _ 0.9 ( p . u . ) _ v o l t : power value at 0.9 (p.u.) and voltage after renewable energy is disconnected in the grid system.

2.4. Calculate the Connectable Power Margin in the Power Load Margin and Power Supply Margin of the Distribution System

The power supply margin of the distribution system is defined as the difference between the line’s permissible power and the total load power of the distribution system, as shown in Equation (5).
P S u p p l y _ M a r g i n = P L i n e _ p e r m i s s i o n P D L _ T o t a l _ L o a d
  • P S u p p l y _ M a r g i n : power supply margin.
  • P L i n e _ p e r m i s s i o n : permissible power of power cable line.
  • P D L _ T o t a l _ L o a d : total load power of a feeder line in a power distribution system.
The connectable power margin of each bus in the distribution system, by comparison between the feasible load capacity and the load margin based on voltage stability under a one-line fault in the transmission line is calculated as shown in Equation (6). Therefore, the optimal connection location for the new electrolysis system can be defined as the bus with the highest connectable power margin.
i f   P S u p p l y M a r g i n > P L o a d M a r g i n , P C o n n e c t a b l e M a r g i n = P L o a d _ M a r g i n i f   P S u p p l y M a r g i n < P L o a d M a r g i n , P C o n n e c t a b l e _ M a r g i n = P S u p p l y _ M a r g i n
P C o n n e c t a b l e _ M a r g i n : connectable power margin of a feeder line in a power distribution system.

3. Simulation of the Proposed Optimal Location Selection Method for Electrolysis System

3.1. Simulation Model

A simulation was conducted to test the proposed method for selecting an electrolysis system location. A load model for an electrolysis system and grid models for a transmission power system and a distribution power system were developed for voltage stability analyses in the simulation.

3.1.1. Load Model for the Electrolysis System

The power system model consists of all buses within the system, generators and loads connected to the buses, and the lines connecting the buses to each other. The flow analysis to derive the power system’s PV curve for voltage stability analysis requires the active and reactive power of each bus. Therefore, to analyze the voltage stability of a power system with water electrolysis, it is necessary to model the electrolysis system as a power load. Generally, the load models used in power systems are constant impedance (Z) loads, constant current (I) loads, and constant power (P) loads.
Based on the actual hardware composition of existing water electrolysis systems, a load model for a megawatt-scale alkaline water electrolysis system is to be established. Constant impedance (Z) loads maintain a constant internal impedance, causing the current to decrease proportionally and linearly as the voltage drops. Constant current (I) loads consume a constant amount of current regardless of voltage fluctuations, and as the voltage decreases, power consumption decreases proportionally. Constant power (P) loads consume a constant amount of power regardless of voltage changes, with typical examples including inverters, air conditioners, and electric motors. The previous analysis shows that the main loads of the electrolysis system, Electrical Balance of Plant and Mechanical Balance of Plant, consume a constant amount of power regardless of voltage changes within ±10% of the nominal voltage. Therefore, it is evident that the load model for the electrolysis system is suitably represented by the constant power (P) model in the ZIP model framework.
Table 4 shows the load model based on the power consumption analysis for a 1MW alkaline water electrolysis system installed in Naju, Republic of Korea.

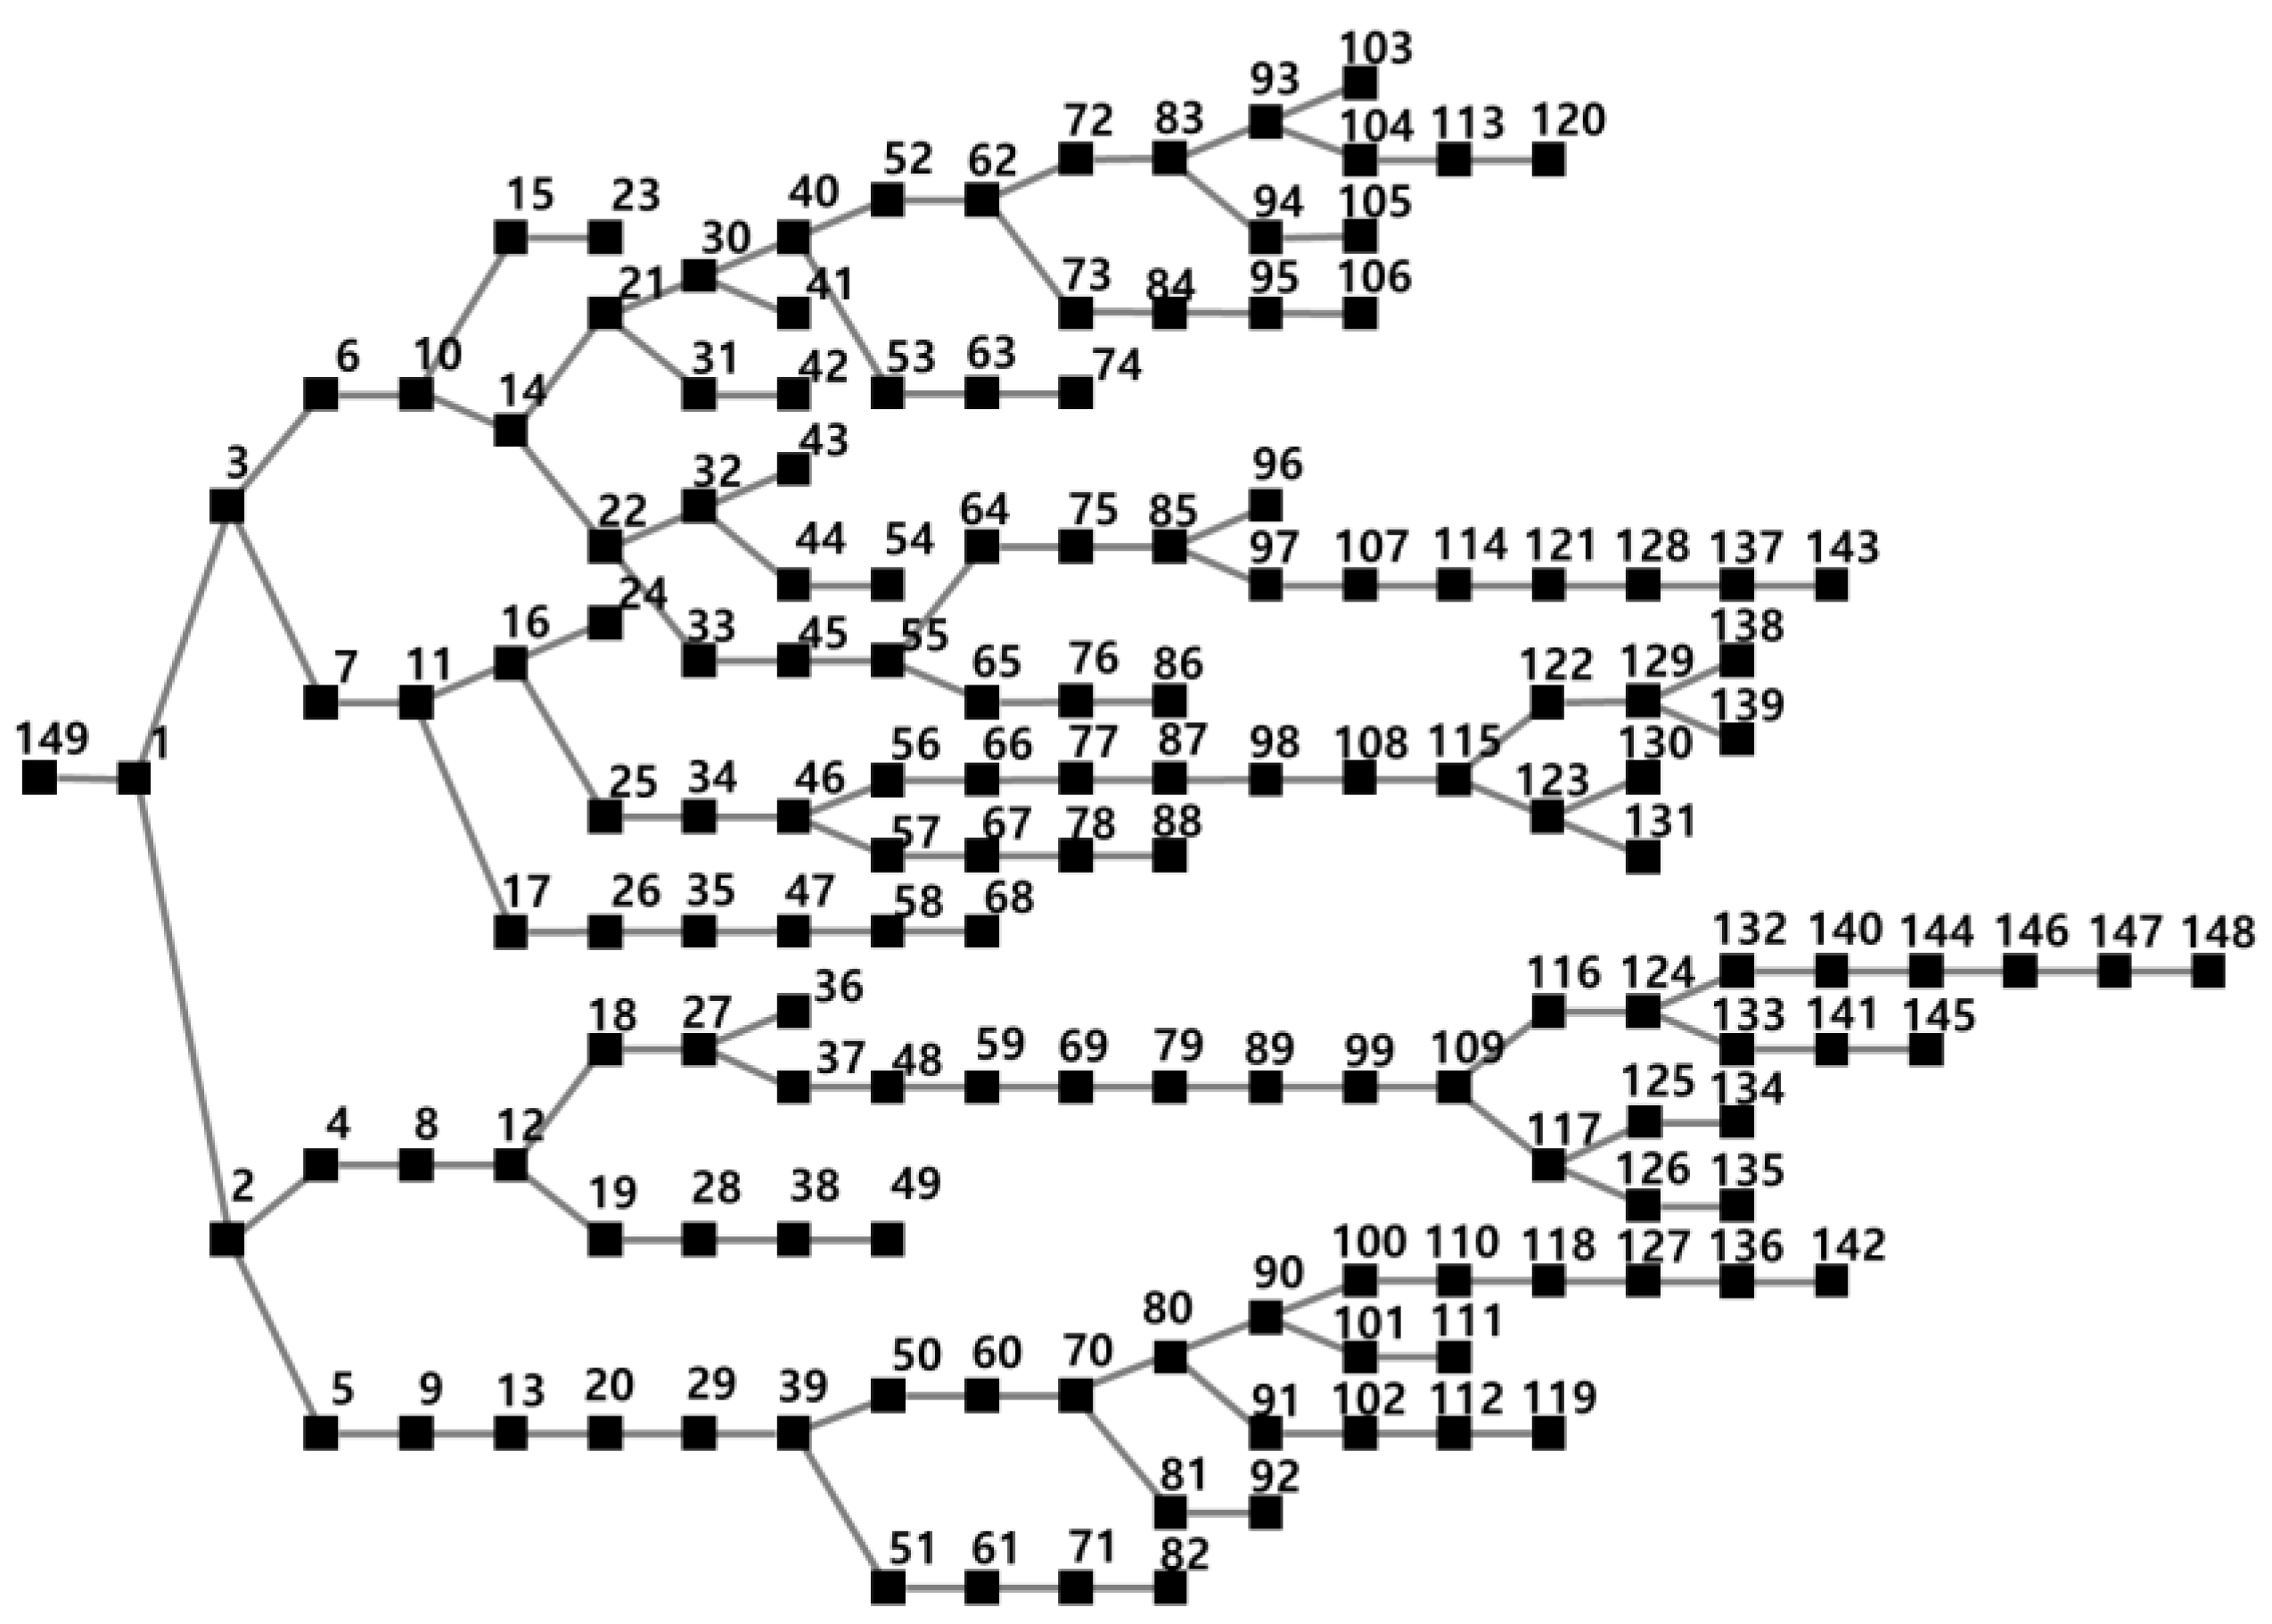
3.1.2. Power Distribution System Model

The KEPCO 148-bus system based on a portion of an actual power system is selected as the distribution power system [31]. As shown in Figure 4 for the KEPCO 148-bus system, the system has four feeders, with 4, 5, 6, and 7 buses corresponding to the feeders of each distribution line (namely DL#3, DL#4, DL#1, and DL#2). The total load is 44.29 MW and 21.51 MVAR. To ensure that the integration of a simulated 1 MW water electrolysis system does not exceed 7000 kVA, the load on each feeder was adjusted to remain within 6000 kVA without modifying the original structure of the KEPCO 148-bus system. Meanwhile, line impedances have the same values as in [31]. The total connected load in the system includes an active power (P) of 19,805.62 kW, reactive power (Q) of 9588.85 kVAR, and apparent power (S) of 22,005.64 kVA. Table 5 shows the total loads of each distribution line (DL#) for the KEPCO system. To simulate the scenario where renewable energy sources and already-installed water electrolysis systems are disconnected due to low-voltage faults in the distribution system caused by a single-line fault in the transmission system, additional solar power generations and water electrolysis loads from Table 6 were applied in the KEPCO system. A total solar power generation of 10 MVA was assumed in the simulation of the bus system, with each solar power generation rated at 1.25 MVA. One simulated 1 MVA water electrolysis unit was installed on each feeder. The installation locations of the simulated solar power generation and electrolysis systems were selected arbitrarily.

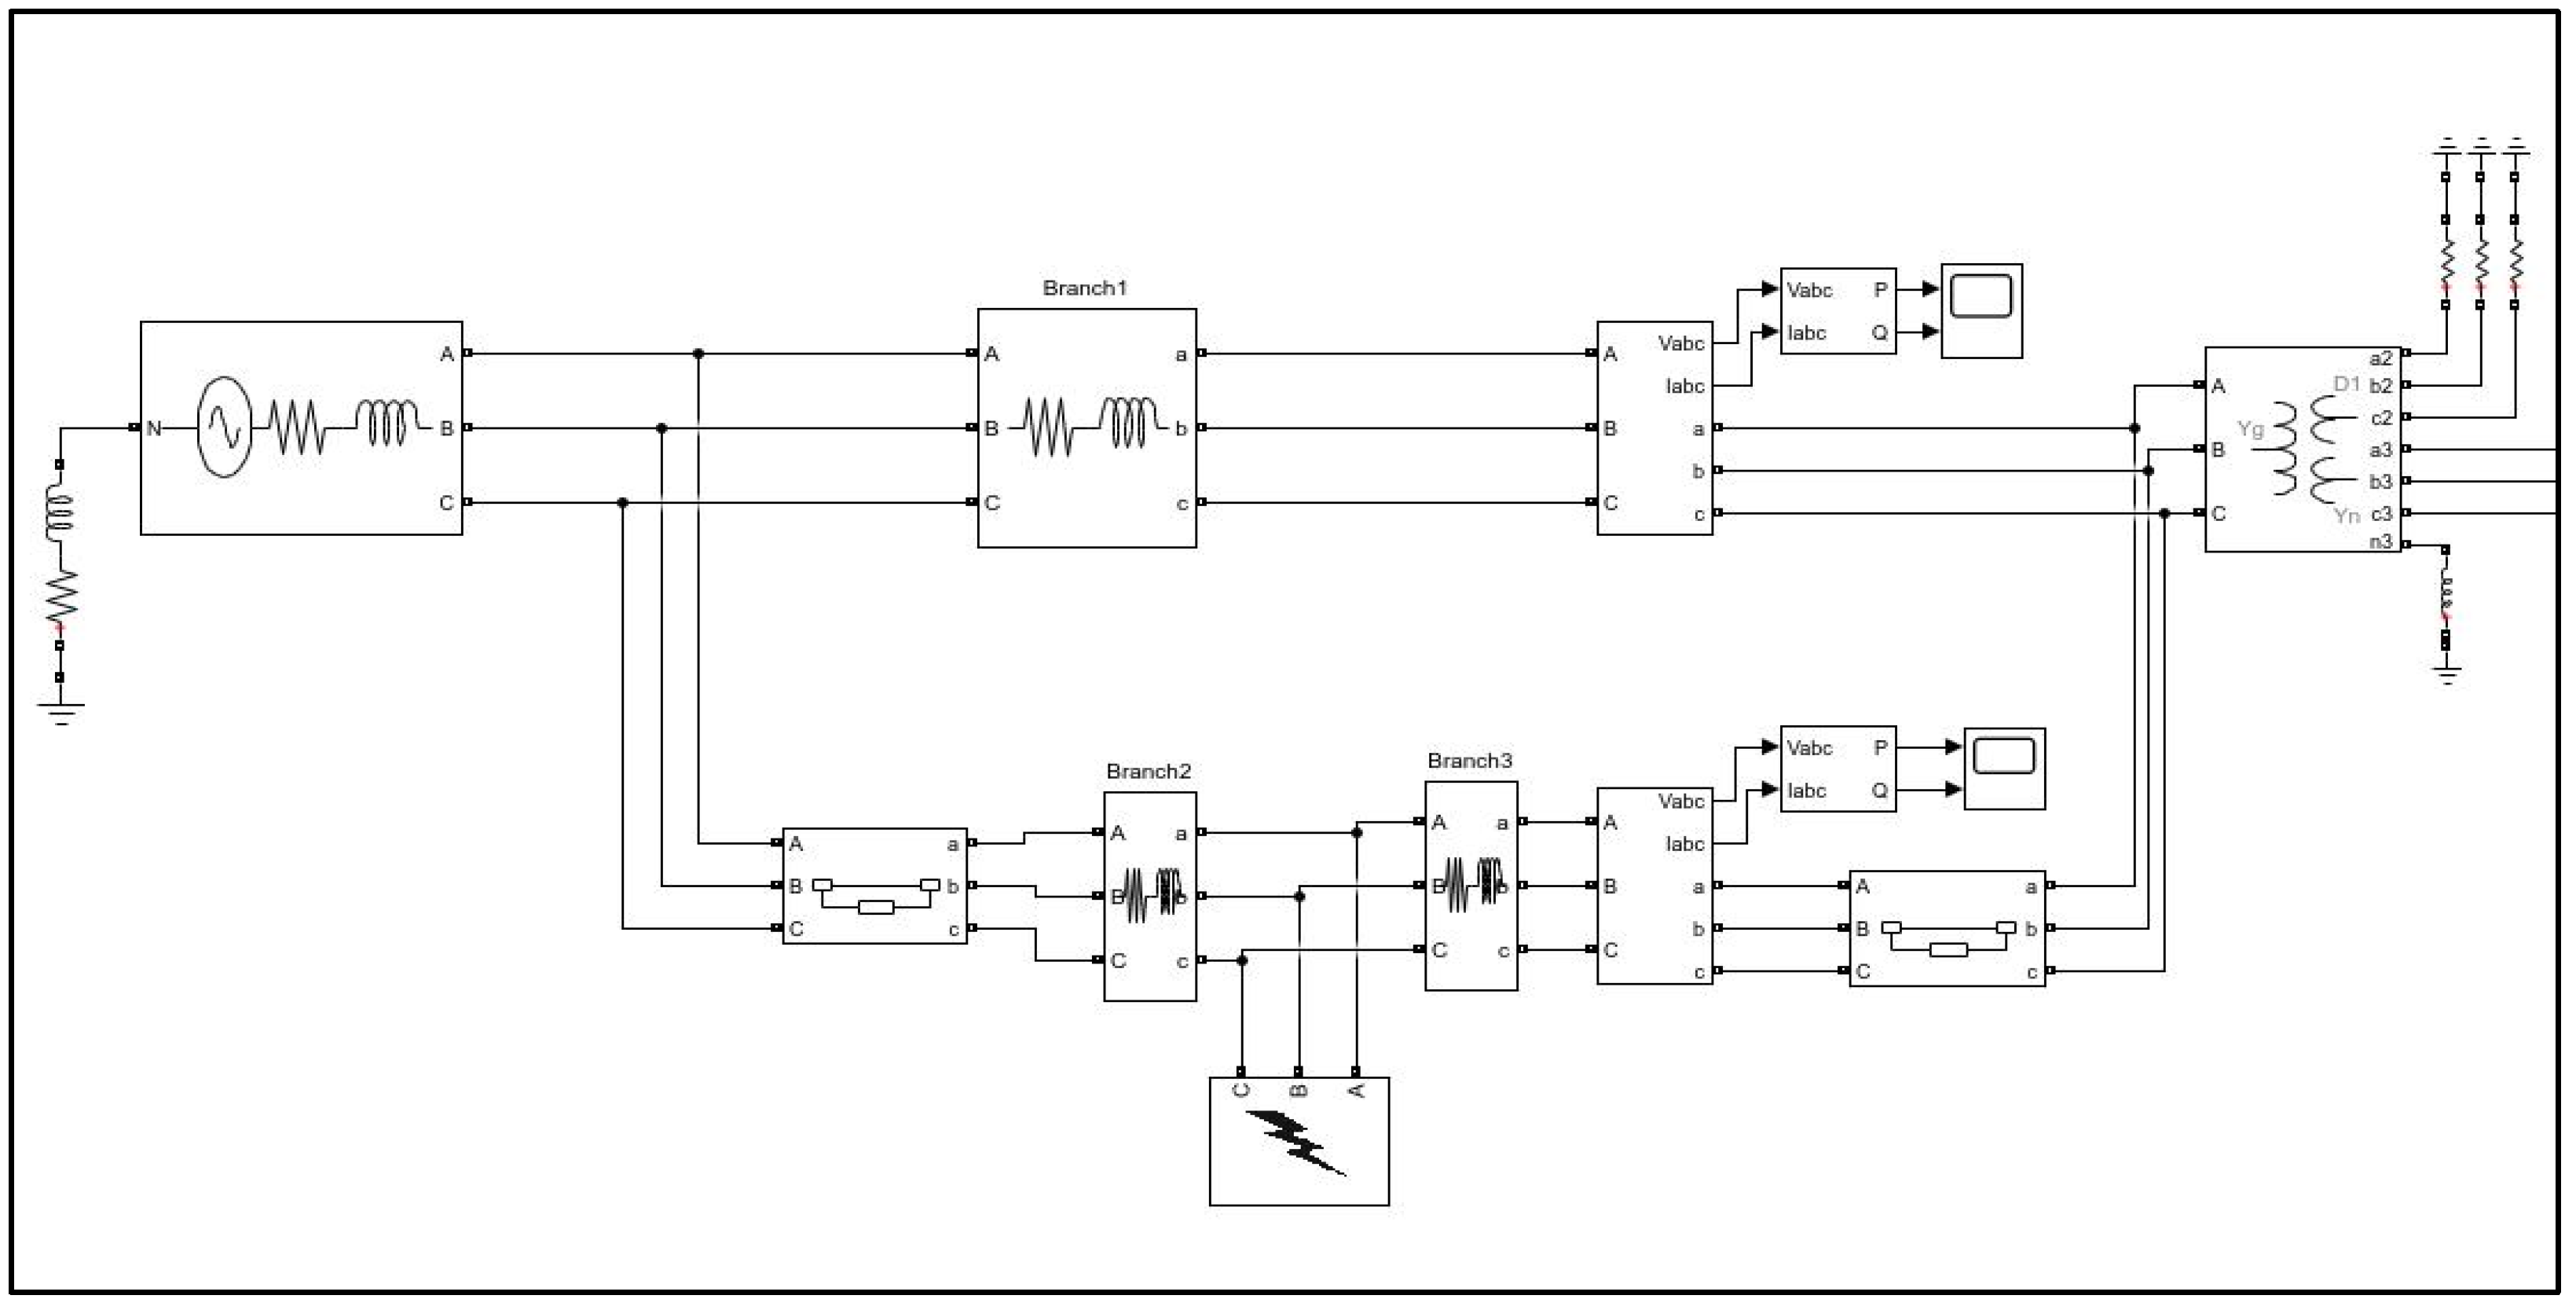
3.1.3. Power Transmission System Model

As a fault scenario for selecting the optimal location of the water electrolysis system, a single-line transmission line fault was defined as the primary cause of the scenario. To select the fault type suitable for the fault scenario among various single-line fault types, four fault types (high-impedance single-line-to-ground fault, single-line-to-ground fault, line-to-line fault, and three-phase fault) and the operating voltage range of the water electrolysis system were considered. The power transmission system was modeled by incorporating the impedance of the transmission line and the upstream network. Figure 5 shows a simulation model for a power transmission system with a single-line fault of both lines. The KEPCO system as a power distribution system is connected to the end of Figure 5.
Figure 6 presents the bus voltage profiles under four types of faults; single-line-to-ground fault, high-impedance single-line-to-ground fault, line-to-line fault, and three-phase fault. The analysis reveals that for all faults except the high-impedance single-line-to-ground fault, the bus voltages fall below 0.9 p.u., indicating that the water electrolysis system would be uniformly disconnected across all buses under the single-line-to-ground fault, line-to-line fault, and three-phase fault. As a result, these fault types do not provide meaningful insights for location analysis based on voltage stability. In contrast, under the high-impedance single-line-to-ground fault, some buses maintain voltages that satisfy the operational requirements of the electrolysis system, even during the fault. Therefore, this study focuses on the high-impedance single-line-to-ground fault to evaluate voltage stability and determine the appropriate location for the water electrolysis system.

3.2. Simulation Results

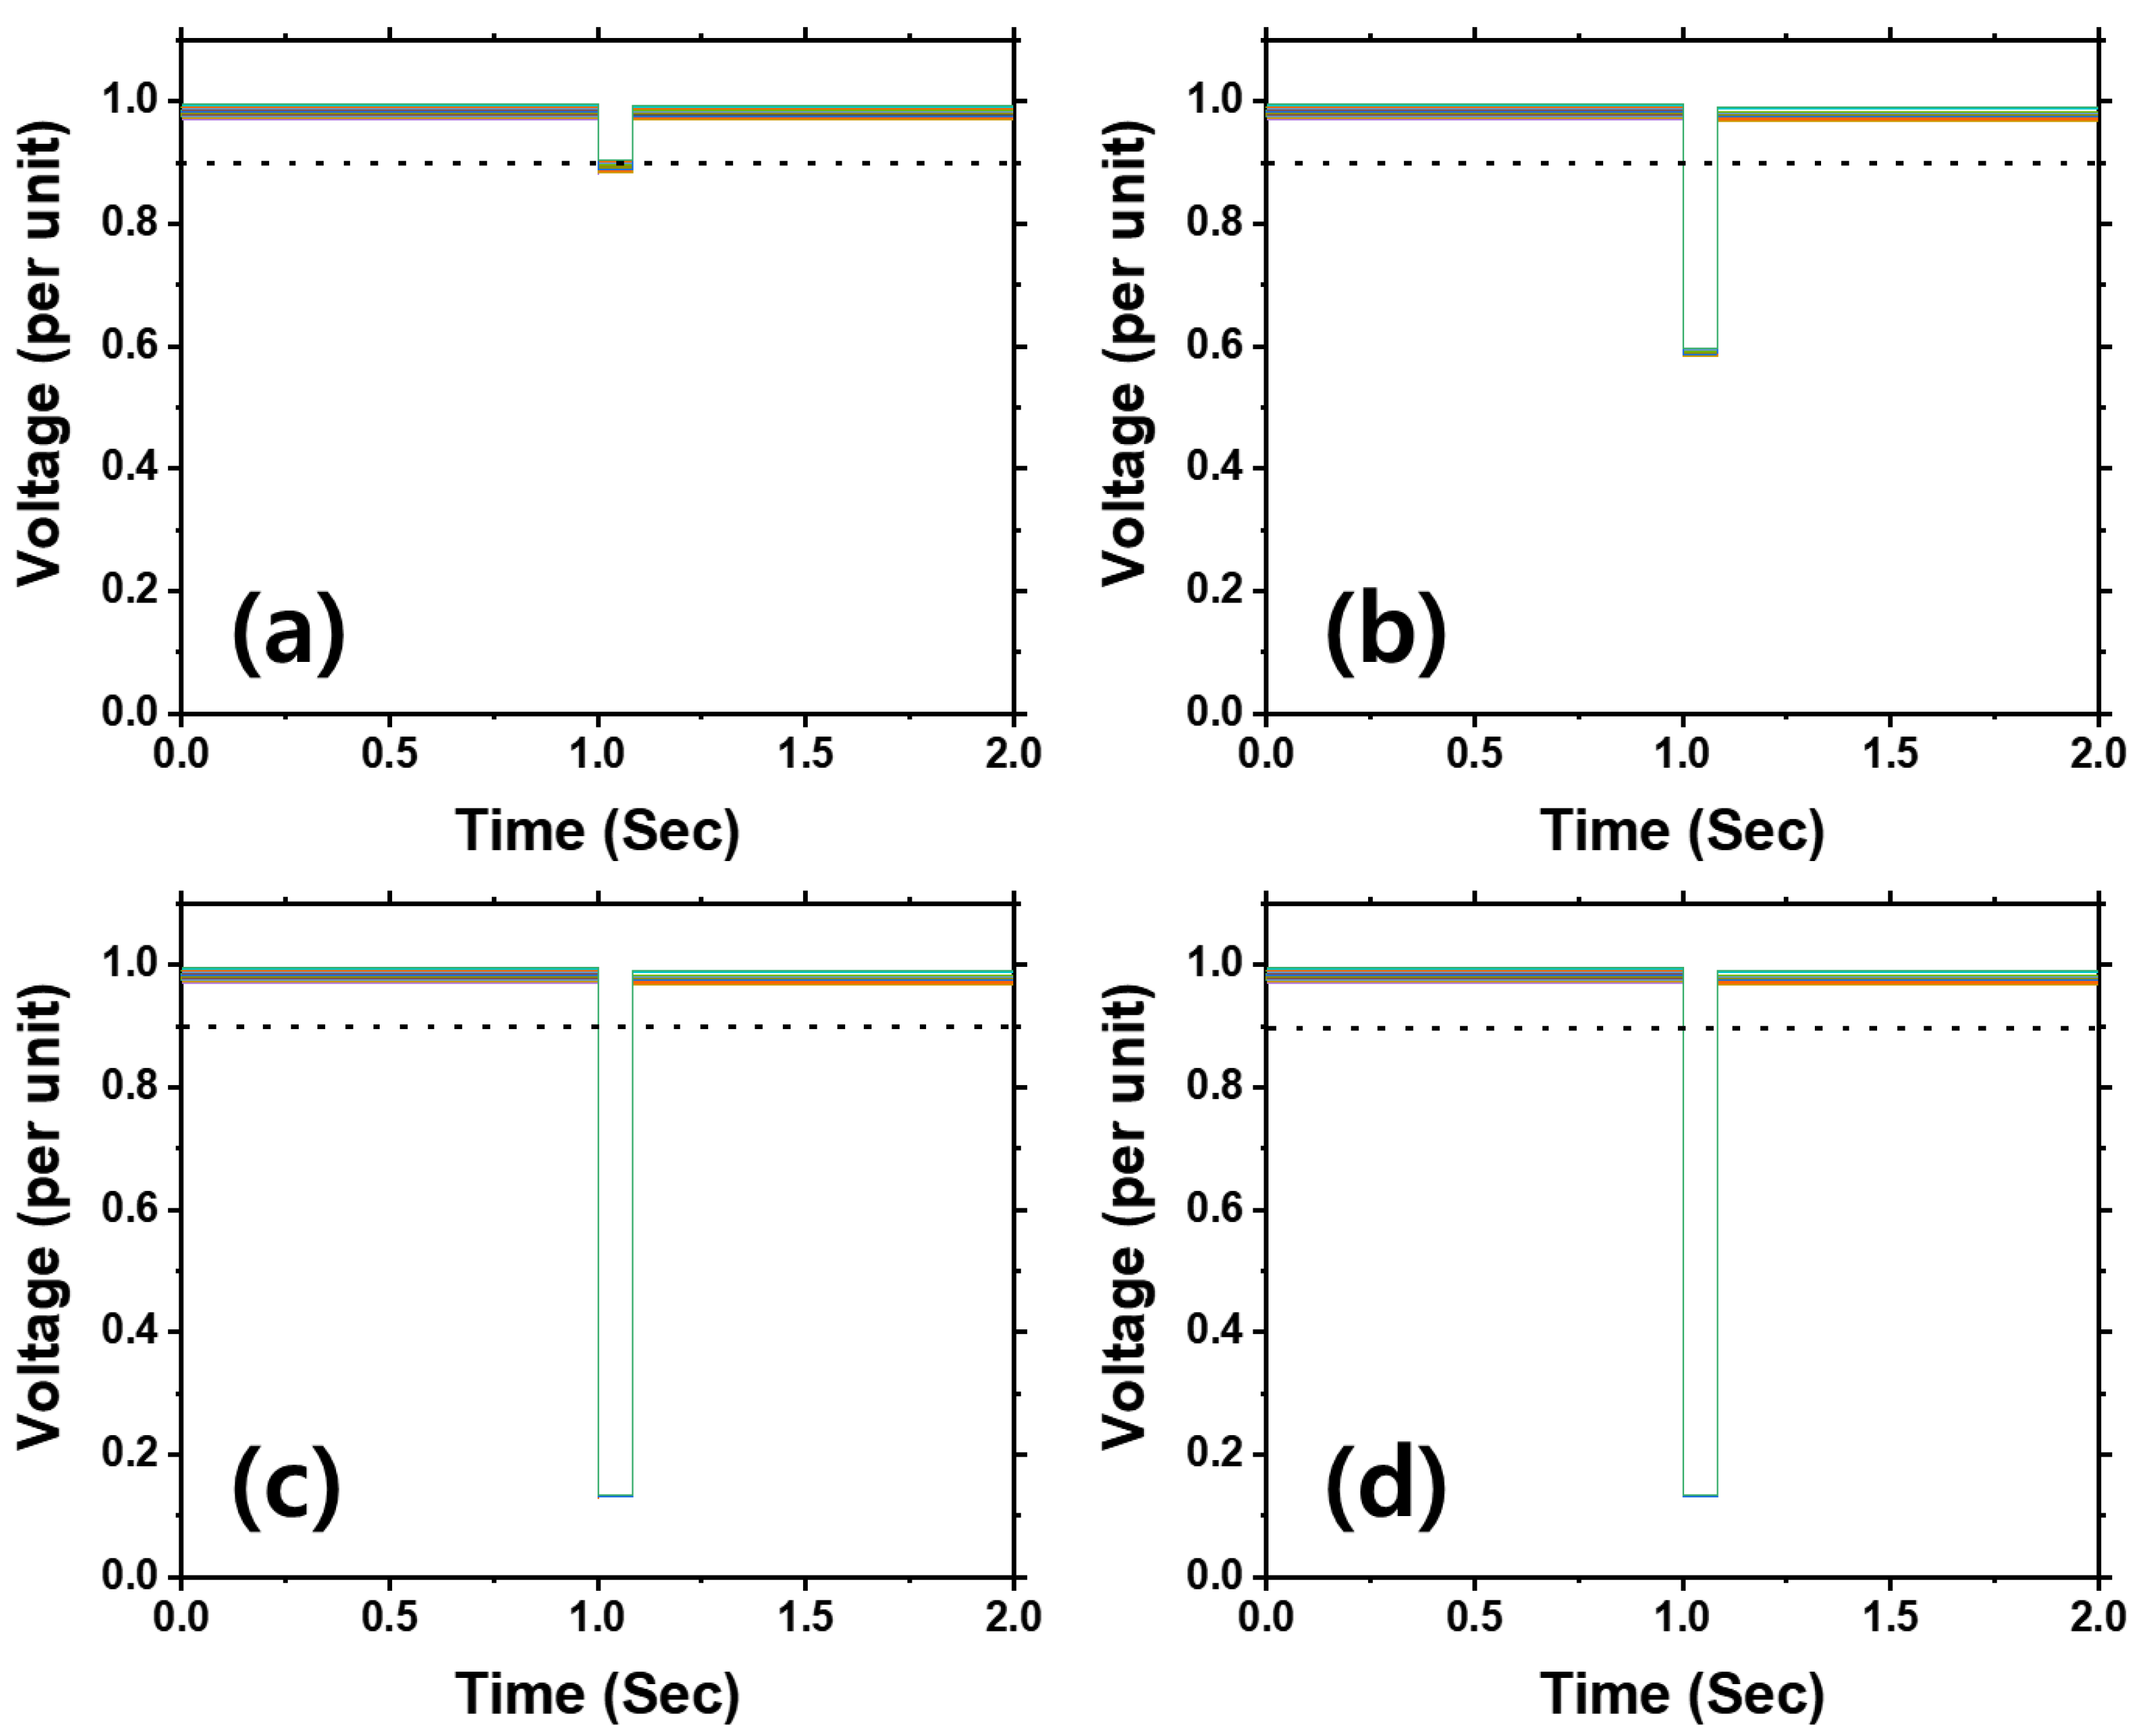
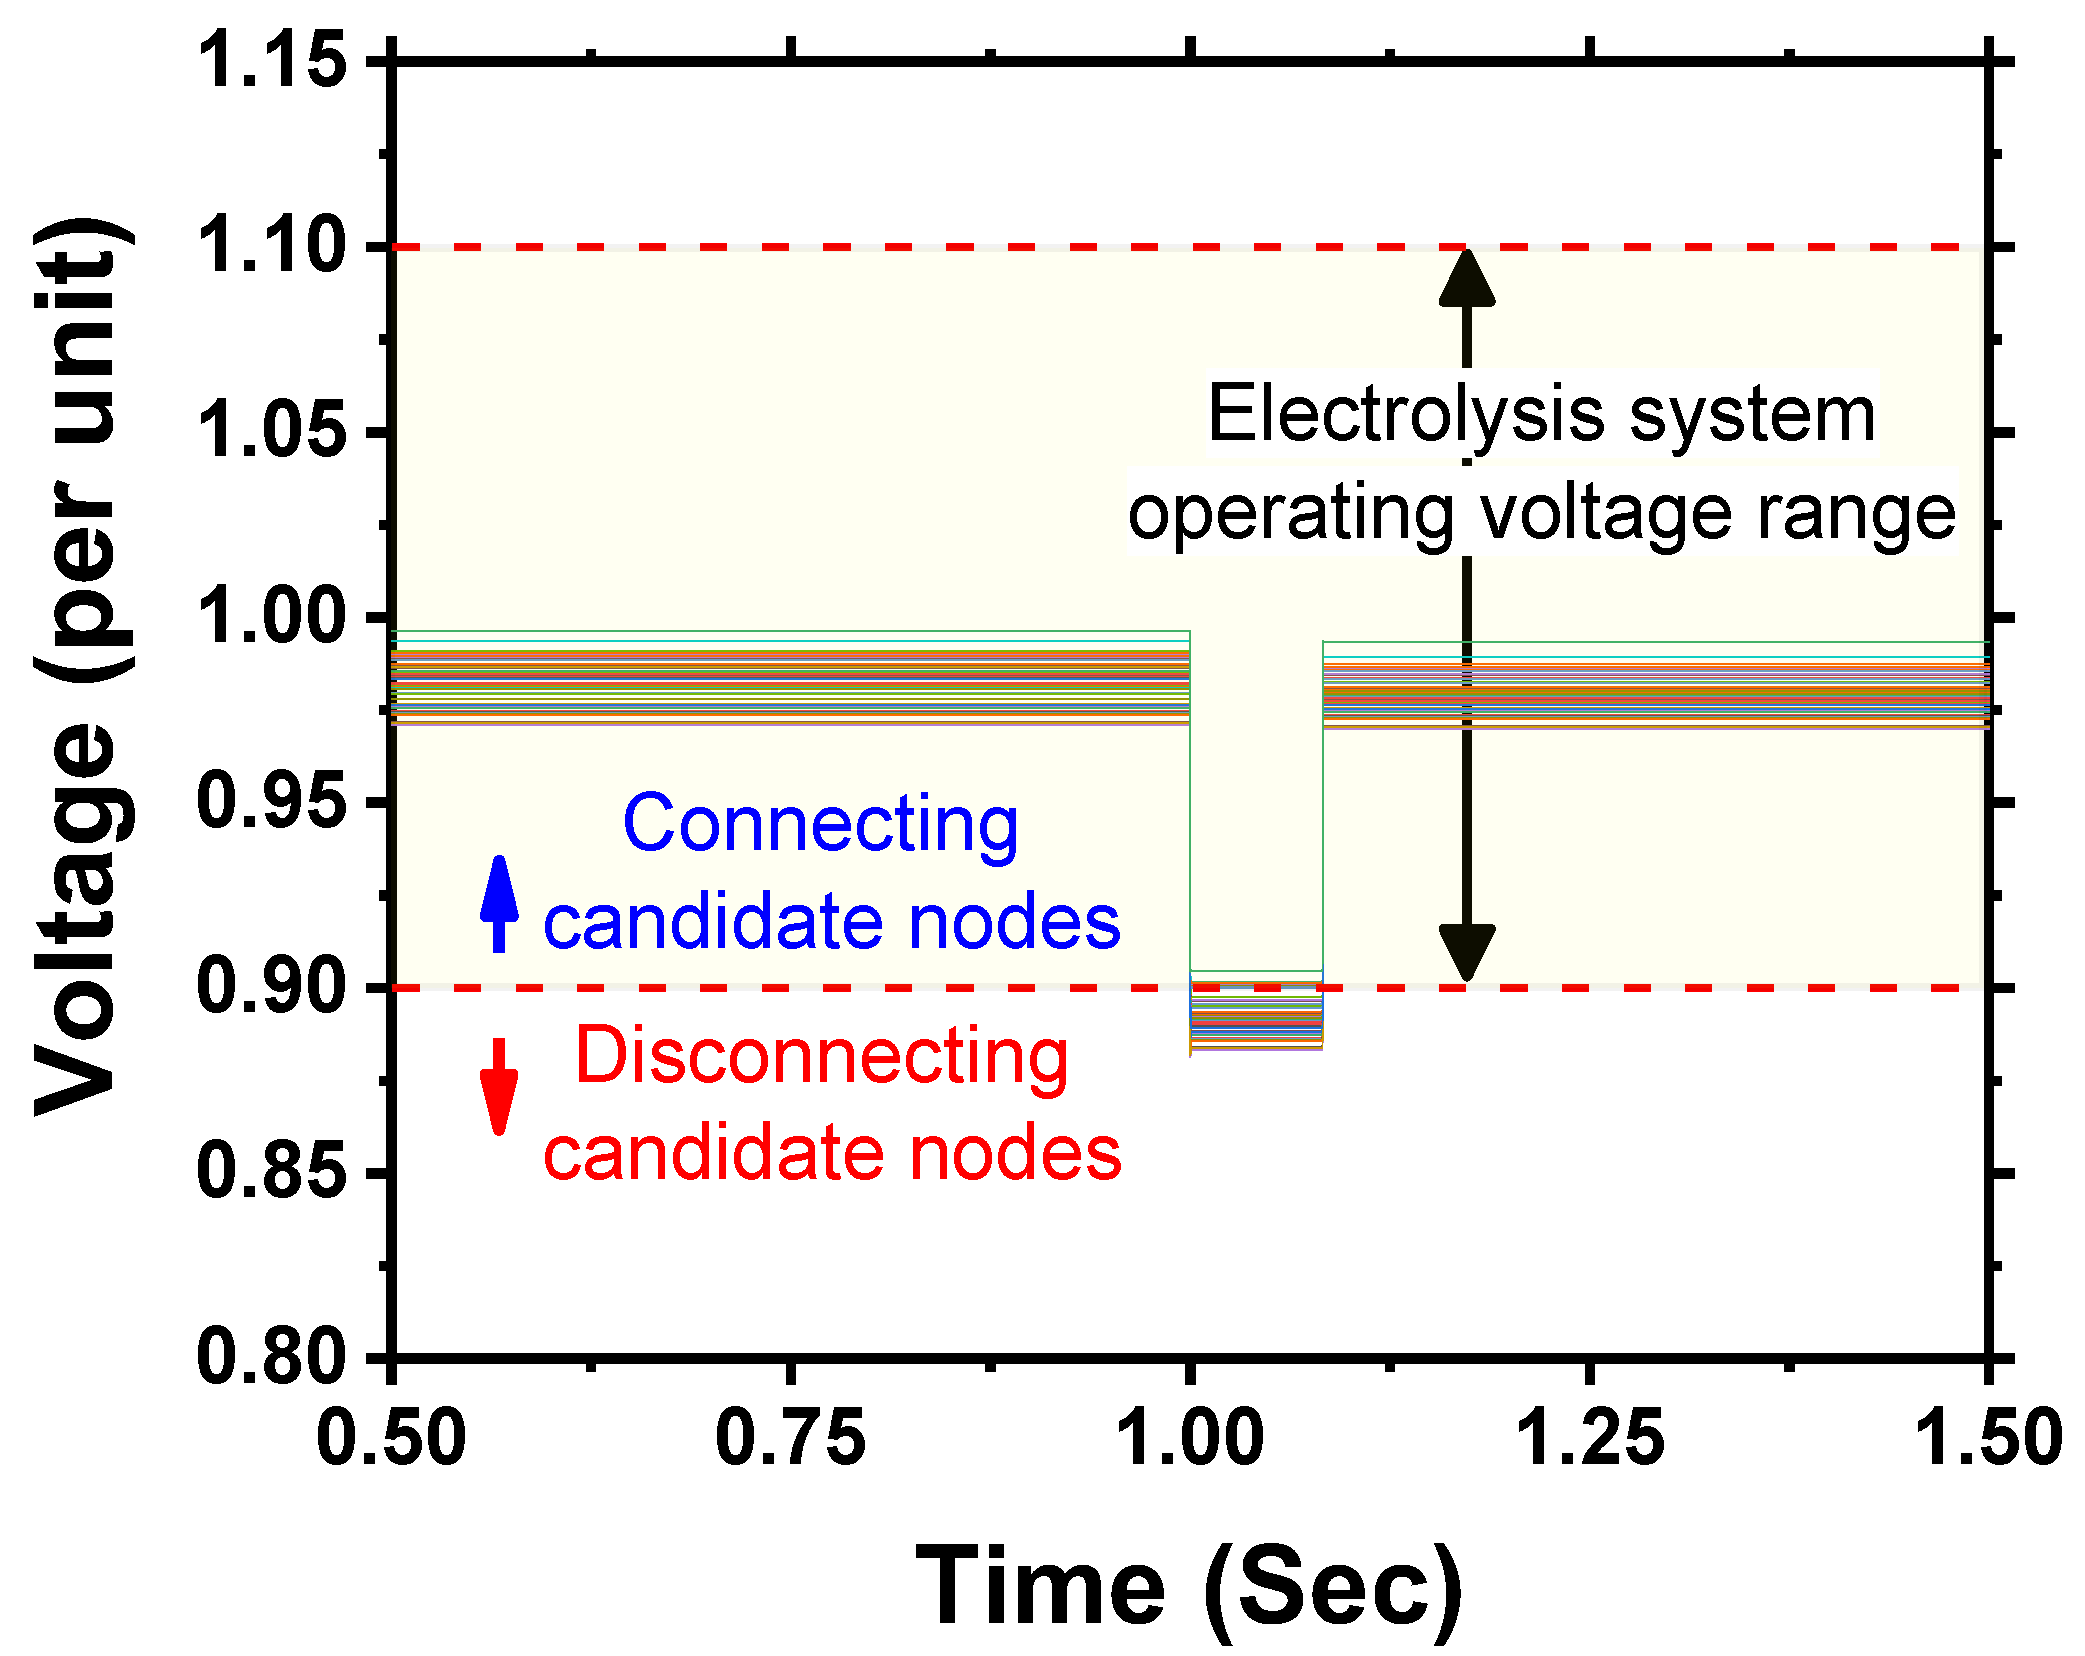
3.2.1. Low-Voltage Occurrence of the Distribution System by a Transmission System Fault

Figure 7 shows the voltage profiles of all buses in the distribution system caused by a single-line-to-earth fault in one transmission line. Table 7 represents the minimum voltage values at all buses in Figure 7. From Table 7, buses with a voltage below 0.9 p.u. are excluded from candidate locations to ensure the stable operation of the electrolysis system, even with the transmission system fault.

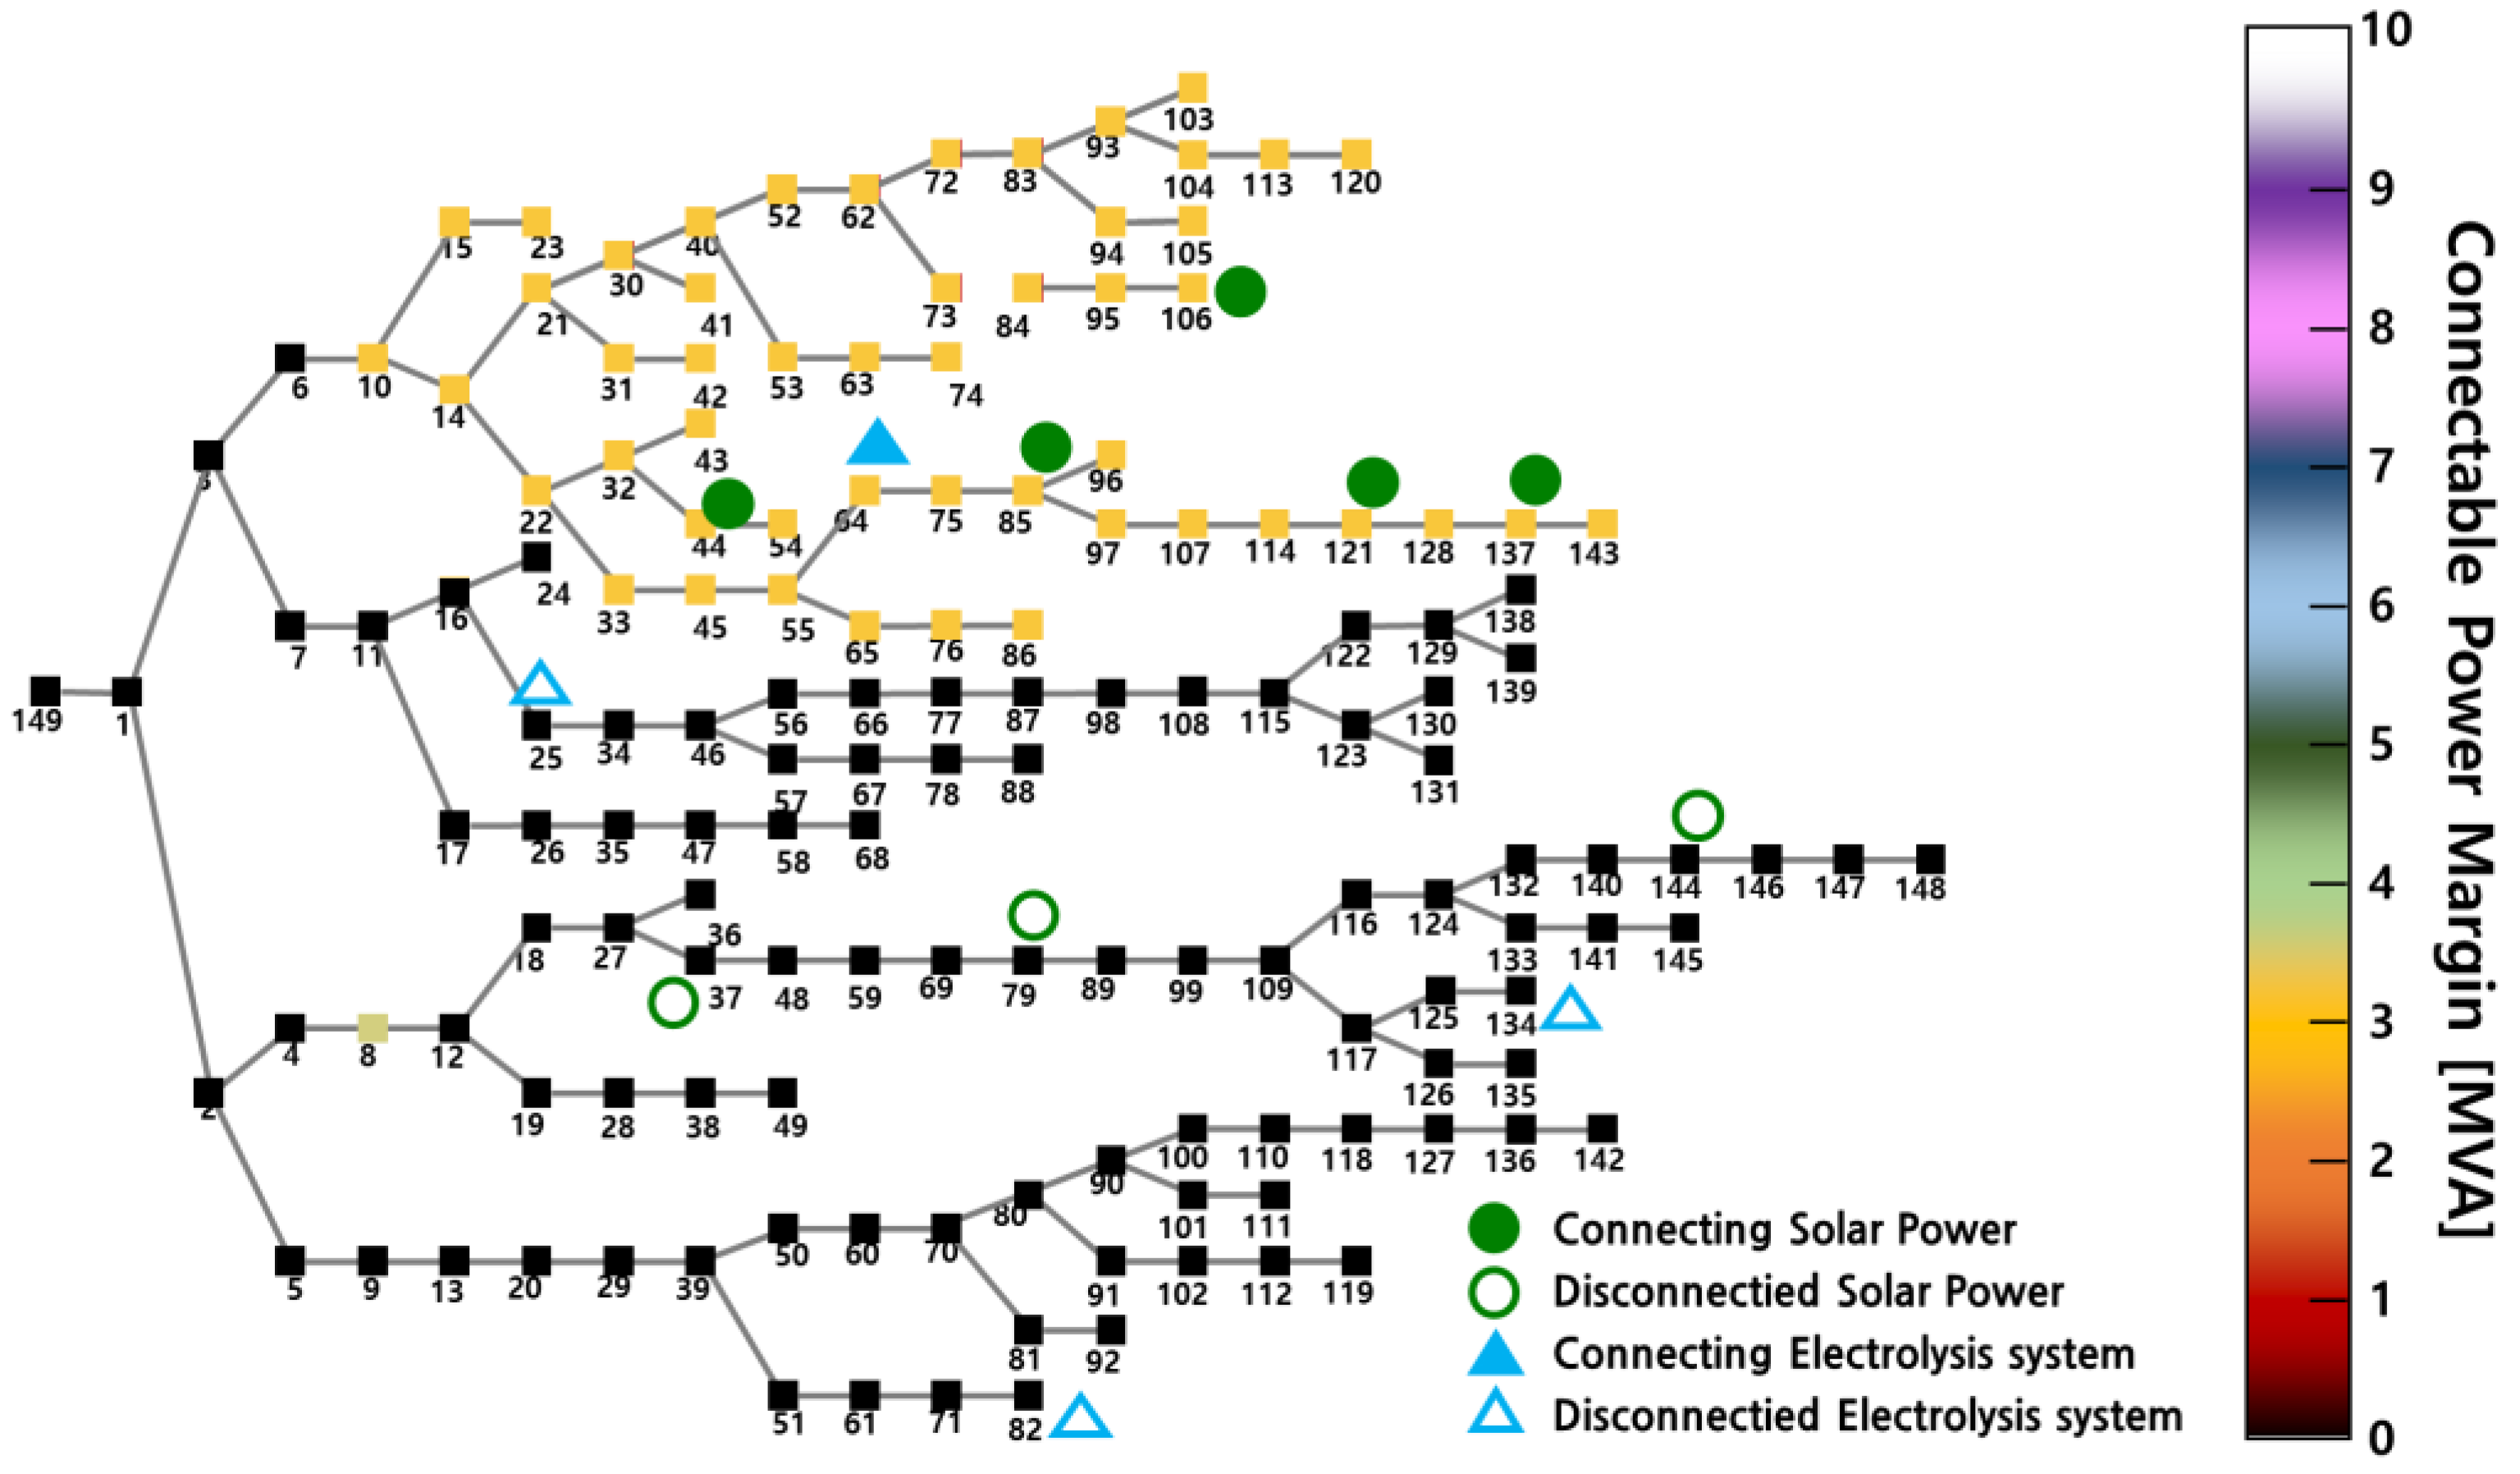
3.2.2. Calculation of Connectable Power Margin

Table 8 shows the power load margins of candidate buses calculated using Equations (3) and (4). In Table 8, the installation candidate buses for the electrolysis system are in DL#1 and DL#3. Equations (7) and (8) indicate power supply margins, meaning voltage stability, for DL#1 and DL#3. Since the voltage stability load margin of Table 8 is always greater than the supply power margin in Equations (7) and (8), the connectable power margins for installing the electrolysis system are the same as the power supply margins in DL#1 and DL#3 of the KEPCO system.
P c o n n e c a b l e _ M a r g i n _ # D L 1 = P s u p p l y _ M a r g i n _ # D L 1 = 10   M V A 5.52   M V A + 1.12   M V A = 3.36   MVA
P c o n n e c a b l e _ M a r g i n _ # D L 3 = P s u p p l y _ M a r g i n _ # D L 3 = 10   M V A 5.31   M V A + 1.12   M V A =   3.57 MVA

3.2.3. Optimal Connection Selection Results for the Electrolysis System

Figure 8 displays the optimal candidate locations for electrolysis facilities within the KEPCO 148 system as proposed. In Figure 8, ● marks indicate solar power facilities maintaining connection, ◯ marks denote solar power facilities that have been disconnected, ▲ marks represent pre-installed electrolysis maintaining connection, and △ marks indicate pre-installed electrolysis that has been disconnected. The gradient bar on the right defines the connection capacity based on the line’s allowable capacity using colors. Black buses represent buses where the voltage has dropped below 0.9 p.u. due to a transmission system fault, raising concerns about electrolysis disconnection, while red buses indicate the potential capacity available for new electrolysis connections, as previously analyzed. Also, Table 8 provides a priority order for connection locations based on the highest-voltage-stability load margins.

4. Conclusions

Low-carbon hydrogen produced through electrolysis is being recognized as a key energy source for net-zero emissions. This paper proposes a method for selecting the optimal connection locations for stable operation of electrolysis facilities. The proposed method identifies locations where stable operation of electrolysis facilities is feasible under low-voltage conditions that may cause renewable energy dropout within the distribution system due to faults in the transmission system by applying the actual operating requirements of electrolysis facilities. Additionally, the method calculates the connection capacity for each bus by analyzing the available supply capacity and voltage stability load margin for the optimal connection locations for electrolysis. The proposed method ensures the stable operation of electrolysis facilities by suggesting the optimal connection locations based on the operability of the electrolysis system and the voltage stability of the power system. The proposed method for selecting optimal electrolysis connection locations can be applied for installing AWE- or SOEC-type electrolysis, requiring stable power supply, and can also be used to select installation locations for PEM-type electrolysis facilities for rapid-response grid auxiliary services and low-carbon hydrogen production.

Author Contributions

Conceptualization and writing—review and editing, Y.-J.K.; methodology, M.K.; investigation, H.-T.K. and H.K.; supervision, S.C.; writing—review and editing, B.-B.C. All authors have read and agreed to the published version of the manuscript.

Funding

This work was financially supported by the Korea Electric Power Corp. (R23EA02, R23EO02).

Data Availability Statement

The data presented in this study are available on request from the corresponding author.

Conflicts of Interest

Authors Yong-Jung Kim, Moonho Kang, Hyun-Tae Kim and Baeck-Bum Choi were employed by the company Korea Electric Power Corp Research Institute. The remaining authors declare that the research was conducted in the absence of any commercial or financial relationships that could be construed as a potential conflict of interest.

References

  1. Züttel, A. Materials for Hydrogen Storage. Mater. Today 2003, 6, 24–33. [Google Scholar] [CrossRef]
  2. Eberle, U.; Felderhoff, M.; Schüth, F. Chemical and Physical Solutions for Hydrogen Storage. Angew. Chem. Int. Ed. 2009, 48, 6608–6630. [Google Scholar] [CrossRef]
  3. Barthelemy, H.; Weber, M.; Barbier, F. Hydrogen Storage: Recent Improvements and Industrial Perspectives. Int. J. Hydrogen Energy 2017, 42, 7254–7262. [Google Scholar] [CrossRef]
  4. Masson-Delmotte, V.; Zhai, P.; Pirani, A.; Connors, S.L.; Péan, C.; Berger, S.; Caud, N.; Chen, Y.; Goldfarb, L.; Gomis, M.I.; et al. Climate Change 2021: The Physical Science Basis; The Working Group I Contribution to the Sixth Assessment Report; IPCC: Geneva, Switzerland, 2021; Volume 2, p. 2391.
  5. Stott, P.A.; Christidis, N.; Otto, F.E.L.; Sun, Y.; Vanderlinden, J.-P.; van Oldenborgh, G.J.; Vautard, R.; von Storch, H.; Walton, P.; Yiou, P.; et al. Attribution of Extreme Weather and Climate-Related Events. WIREs Clim. Change 2016, 7, 23–41. [Google Scholar] [CrossRef] [PubMed]
  6. Loock, M. Unlocking the Value of Digitalization for the European Energy Transition: A Typology of Innovative Business Models. Energy Res. Soc. Sci. 2020, 69, 101740. [Google Scholar] [CrossRef]
  7. Vernay, A.-L.; Sebi, C.; Arroyo, F. Energy Community Business Models and Their Impact on the Energy Transition: Lessons Learnt from France. Energy Policy 2023, 175, 113473. [Google Scholar] [CrossRef]
  8. Bryant, S.T.; Straker, K.; Wrigley, C. The Discourses of Power—Governmental Approaches to Business Models in the Renewable Energy Transition. Energy Policy 2019, 130, 41–59. [Google Scholar] [CrossRef]
  9. Carley, S.; Konisky, D.M. The Justice and Equity Implications of the Clean Energy Transition. Nat. Energy 2020, 5, 569–577. [Google Scholar] [CrossRef]
  10. Carley, S.; Evans, T.P.; Graff, M.; Konisky, D.M. A Framework for Evaluating Geographic Disparities in Energy Transition Vulnerability. Nat. Energy 2018, 3, 621–627. [Google Scholar] [CrossRef]
  11. Meinshausen, M.; Lewis, J.; McGlade, C.; Gütschow, J.; Nicholls, Z.; Burdon, R.; Cozzi, L.; Hackmann, B. Realization of Paris Agreement Pledges May Limit Warming Just below 2 °C. Nature 2022, 604, 304–309. [Google Scholar] [CrossRef]
  12. International Energy Agency. Global Hydrogen Review 2022; International Energy Agency: Paris, France, 2022.
  13. Gan, L.; Jiang, P.; Lev, B.; Zhou, X. Balancing of Supply and Demand of Renewable Energy Power System: A Review and Bibliometric Analysis. Sustain. Futur. 2020, 2, 100013. [Google Scholar] [CrossRef]
  14. Mohamad, F.; Teh, J.; Lai, C.-M. Optimum Allocation of Battery Energy Storage Systems for Power Grid Enhanced with Solar Energy. Energy 2021, 223, 120105. [Google Scholar] [CrossRef]
  15. El-Bidairi, K.S.; Nguyen, H.D.; Mahmoud, T.S.; Jayasinghe, S.D.G.; Guerrero, J.M. Optimal Sizing of Battery Energy Storage Systems for Dynamic Frequency Control in an Islanded Microgrid: A Case Study of Flinders Island, Australia. Energy 2020, 195, 117059. [Google Scholar] [CrossRef]
  16. Immendoerfer, A.; Tietze, I.; Hottenroth, H.; Viere, T. Life-Cycle Impacts of Pumped Hydropower Storage and Battery Storage. Int. J. Energy Environ. Eng. 2017, 8, 231–245. [Google Scholar] [CrossRef]
  17. Mayyas, A.; Wei, M.; Levis, G. Hydrogen as a Long-Term, Large-Scale Energy Storage Solution When Coupled with Renewable Energy Sources or Grids with Dynamic Electricity Pricing Schemes. Int. J. Hydrogen Energy 2020, 45, 16311–16325. [Google Scholar] [CrossRef]
  18. Pijarski, P.; Kacejko, P. Voltage Optimization in MV Network with Distributed Generation Using Power Consumption Control in Electrolysis Installations. Energies 2021, 14, 993. [Google Scholar] [CrossRef]
  19. Idaho National Laboratory. Dynamic Modeling and Validation of Electrolyzers in Real Time Grid Simulation; Idaho National Laboratory: Idaho Falls, ID, USA, 2016.
  20. Cozzolino, R.; Bella, G. A Review of Electrolyzer-Based Systems Providing Grid Ancillary Services: Current Status, Market, Challenges and Future Directions. Front. Energy Res. 2024, 12, 1358333. [Google Scholar] [CrossRef]
  21. Petrollese, M.; Concas, G.; Lonis, F.; Cocco, D. Techno-Economic Assessment of Green Hydrogen Valley Providing Multiple End-Users. Int. J. Hydrogen Energy 2022, 47, 24121–24135. [Google Scholar] [CrossRef]
  22. Tsukase, N.; Araki, T.; Haleem, A.A.; Nagasawa, K.; Kuroda, Y.; Mitsushima, S. Numerical Simulation of the Distribution of Reverse Currents in a Practical Alkaline Water Electrolysis Stack Immediately after Electrolysis. Int. J. Hydrogen Energy 2024, 49, 701–712. [Google Scholar] [CrossRef]
  23. Abdel Haleem, A.; Huyan, J.; Nagasawa, K.; Kuroda, Y.; Nishiki, Y.; Kato, A.; Nakai, T.; Araki, T.; Mitsushima, S. Effects of Operation and Shutdown Parameters and Electrode Materials on the Reverse Current Phenomenon in Alkaline Water Analyzers. J. Power Sources 2022, 535, 231454. [Google Scholar] [CrossRef]
  24. Norazahar, N.; Khan, F.; Rahmani, N.; Ahmad, A. Degradation Modelling and Reliability Analysis of PEM Electrolyzer. Int. J. Hydrogen Energy 2024, 50, 842–856. [Google Scholar] [CrossRef]
  25. Kuhnert, E.; Hacker, V.; Bodner, M. A Review of Accelerated Stress Tests for Enhancing MEA Durability in PEM Water Electrolysis Cells. Int. J. Energy Res. 2023, 2023, 3183108. [Google Scholar] [CrossRef]
  26. Liu, C.; Wrubel, J.; Padgett, E.; Bender, G. The Impacts of Membrane Pinholes on PEM Water Electrolysis. J. Power Sources 2023, 581, 233507. [Google Scholar] [CrossRef]
  27. Liu, T.; Wang, X.; Jiang, X.; Deng, C.; Niu, S.; Mao, J.; Zeng, W.; Liu, M.; Liao, H. Mechanism of Corrosion and Sedimentation of Nickel Electrodes for Alkaline Water Electrolysis. Mater. Chem. Phys. 2023, 303, 127806. [Google Scholar] [CrossRef]
  28. Leng, Y.; Chen, G.; Mendoza, A.J.; Tighe, T.B.; Hickner, M.A.; Wang, C.-Y. Solid-State Water Electrolysis with an Alkaline Membrane. J. Am. Chem. Soc. 2012, 134, 9054–9057. [Google Scholar] [CrossRef]
  29. Operator, A.E.M. Black System Event in South Australia on 28 September 2016; AEMO: Melbourne, Australia, 2017. [Google Scholar]
  30. Meng, X.; Pian, Z. Chapter 4—Derivation of Distribution Network Vulnerability Indicators Based on Voltage Stability. In Intelligent Coordinated Control of Complex Uncertain Systems for Power Distribution Network Reliability; Meng, X., Pian, Z., Eds.; Elsevier: Oxford, UK, 2016; pp. 65–89. ISBN 978-0-12-849896-5. [Google Scholar]
  31. Shin, J.-R.; Kim, B.-S.; Park, J.-B.; Lee, K.Y. A New Optimal Routing Algorithm for Loss Minimization and Voltage Stability Improvement in Radial Power Systems. IEEE Trans. Power Syst. 2007, 22, 648–657. [Google Scholar] [CrossRef]
Figure 1. Time-dependent applied stack current and stack voltage profiles of a 1 kW alkaline stack.
Energies 18 02037 g001
Figure 2. A conceptual diagram for the load margin when a maximum load point voltage by continuous power flow analysis meets the operating voltage range of the electrolysis systems.
Energies 18 02037 g002
Figure 3. A conceptual diagram for the load margin when a maximum load point voltage by continuous power flow analysis is under the operating voltage range of the electrolysis systems.
Energies 18 02037 g003
Figure 4. The KEPCO 148-bus system.
Energies 18 02037 g004
Figure 5. Simulation model for power transmission system with single-line fault of both lines.
Energies 18 02037 g005
Figure 6. The bus voltage profile according to the four types of single-line fault; (a) high-impedance single-line-to-ground fault, (b) single-line-to-ground fault, (c) line-to-line fault, and (d) three-phase fault.
Energies 18 02037 g006
Figure 7. The voltage profiles of all buses in the distribution system caused by a single-line-to-earth fault in one transmission line.
Energies 18 02037 g007
Figure 8. The optimal candidate locations for the electrolysis system within the KEPCO 148 distribution system.
Energies 18 02037 g008
Table 1. AC-side electrical specifications of Electrical Balance of Plant in the electrolysis system.
Rated AC Power (kVA)600
Rated AC Voltage (V)440 (3-Phase, 3-Wire)
Rated AC Current (A)787.3
Rated Grid Frequency (Hz)60
Grid Voltage
operation range (V)
396~484
(90~110% of rated voltage)
Grid Frequency
operation range (Hz)
60 ± 0.2
Table 2. Electrical specifications of the inverter used for KOH pump control in the alkaline water electrolysis system.
Input Rated Voltage (VAC)380~480
(+10%~−15%, 3-Phase)
Input Rated Frequency (Hz)50~60
Table 3. Electrical specifications of the power supply for the protective Solid-State Relay (SSR).
Input Rated voltage (VAC)100~120, 200~240
Input Rated Frequency (Hz)50~60
Table 4. Power consumption analysis for a 1 MW alkaline water electrolysis system installed in Naju, Republic of Korea.
Active Power (kW)Reactive Power (kVar)
Electrical Balance of Plant (included with tack)1015.2245.44
Mechanical Balance of Plant99.3145.88
Total1114.5491.32
Table 5. Total loads of each distribution line (DL#) for the KEPCO 148-bus system.
Active Power
(kW)
Reactive Power
(kVAR)
Apparent Power
(kVA)
DL#14974.2882400.2885523.489
DL#25271.8432550.3945855.512
DL#34774.2662318.7785308.010
DL#44786.2232319.3905318.624
Table 6. Information for solar power generations and water electrolysis loads added in the KEPCO 148-bus system.
Bus No.Power (MW)DL
Solar371.25#3
Solar441.25#1
Solar791.25#3
Solar851.25#1
Solar1061.25#1
Solar1211.25#1
Solar1371.25#1
Solar1441.25#3
Water Electrolyzer251#1
Water Electrolyzer641#2
Water Electrolyzer821#3
Water Electrolyzer1341#4
Table 7. Minimum voltage values at all buses in Figure 7.
BusMin. VoltageBusMin. VoltageBusMin. VoltageBusMin. Voltage
10.905380.898750.9011120.891
20.905390.892760.9001130.900
30.905400.901770.8861140.901
40.905410.901780.8871150.885
50.905420.901790.8931160.890
60.905430.901800.8911170.890
70.905440.901810.8911180.891
80.901450.901820.8911190.891
90.896460.887830.9001200.900
100.901470.891840.9011210.901
110.891480.895850.9011220.883
120.898490.898860.9001230.885
130.895500.892870.8851240.890
140.901510.892880.8871250.890
150.901520.900890.8921260.890
160.890530.900900.8911270.891
170.891540.901910.8911280.901
180.897550.900920.8911290.883
190.898560.887930.9001300.885
200.894570.887940.9001310.884
210.901580.891950.9011320.890
220.901590.894960.9011330.890
230.901600.891970.9011340.890
240.890610.892980.8851350.890
250.890620.900990.8911360.891
260.891630.9001000.8911370.902
270.896640.9001010.8911380.882
280.898650.9001020.8911390.882
290.892660.8861030.9001400.890
300.901670.8871040.9001410.890
310.901680.8911050.9001420.891
320.901690.8931060.9011430.901
330.901700.8911070.9011440.890
340.888710.8911080.8851450.890
350.891720.9001090.8901460.889
360.896730.9001100.8911470.889
370.895740.9001110.8911480.889
Table 8. The candidate buses for installation of the electrolysis system.
DLBus P L o a d _ M a r g i n (MVA)DLBus P L o a d _ M a r g i n (MVA)
#38217.67#172108.21
#110126.76#133107.92
#115126.67#183107.42
#123126.65#194107.26
#114114.37#193107.04
#121113.48#1104106.83
#131113.37#1103106.66
#142113.28#1105106.61
#130112.29#145106.38
#141112.27#155103.39
#140110.69#165103.07
#153110.58#164102.98
#163110.45#176102.98
#174110.29#186102.95
#152109.69#175102.66
#122109.44#185101.69
#132109.35#196101.29
#143109.30#197101.06
#144109.23#1107100.84
#154109.18#1114100.56
#1106109.14#1121100.22
#195109.06#1128100.08
#184109.04#113799.90
#162109.01#114399.54
#173109.01
Disclaimer/Publisher’s Note: The statements, opinions and data contained in all publications are solely those of the individual author(s) and contributor(s) and not of MDPI and/or the editor(s). MDPI and/or the editor(s) disclaim responsibility for any injury to people or property resulting from any ideas, methods, instructions or products referred to in the content.

