Article

Leveraging System Dynamics to Predict the Commercialization Success of Emerging Energy Technologies: Lessons from Wind Energy

by
Svetlana Lawrence
1,2,*,
Daniel R. Herber
2 and
Kamran Eftekhari Shahroudi
2
1
Idaho National Laboratory, 1955 Fremont Ave., Idaho Falls, ID 83415, USA
2
Department of Systems Engineering, Walter Scott, Jr. College of Engineering, Colorado State University, Fort Collins, CO 80523, USA
*
Author to whom correspondence should be addressed.
Energies 2025, 18(8), 2048; https://doi.org/10.3390/en18082048
Submission received: 4 March 2025 / Revised: 9 April 2025 / Accepted: 11 April 2025 / Published: 16 April 2025
(This article belongs to the Special Issue Energy Economics, Finance and Policy Towards Sustainable Energy)

Abstract

:
The United States urgently needs to tackle the climate crisis while enhancing energy security and resiliency. The complexity of the U.S. energy system, with its interconnected elements, makes predicting future states challenging, especially with the introduction of novel energy systems like wind, solar, clean hydrogen, and advanced nuclear technologies. Modern systems engineering methods and tools can provide deeper insights into these dynamics and future behaviors. This research aims to develop a comprehensive model that captures the main elements and behaviors of new energy technologies within the existing energy system. We hypothesized that the market uptake of novel energy systems is influenced by multiple diverse factors, such as technological learning, availability of resources, and economic incentives; examined the history of electricity generation using land-based wind technologies; and developed a system dynamics model to investigate the relationships between capacity growth and influencing factors, both internal and external. The developed model yielded outcomes that confirmed the hypothesized dynamics of wind energy system diffusion through a quantitative comparison of installed capacity and highlighted the significant influence of resource availability, federal incentives (production tax credits), and technological learning on capacity growth and cost reduction. This research aims to support informed decision-making for investments in novel energy systems and aid in developing effective policies for technology deployment.

1. Introduction

The United States is facing an urgent need to address the climate crisis alongside an unprecedented challenge to strengthen the nation’s energy security and resiliency. The U.S. energy system is very complex due to multiple interconnected elements that dynamically affect each other, which complicates predictions of future states of energy systems. It is especially hard to predict energy system behaviors when novel energy technologies are introduced (e.g., renewable electricity generation, clean hydrogen, or advanced nuclear). Modern systems engineering methods and tools can support a deeper understanding of system dynamics and future behaviors.
Wind energy has been growing in popularity in the United States since the 1980s, and solar since the late 2000s. As of today, wind energy has reached high technical maturity and has been widely commercialized thanks to costs low enough to compete with incumbent primary electricity generation sources based on fossil fuels. Wind technology is still developing in terms of increased efficiencies and lowering costs [1,2,3], which increases its attractiveness. Wind energy is getting closer to reaching the level of maturity where it is self-sustained for further commercialization, especially when supported by federal and state policies [4]. Solar energy technology is slightly behind wind energy, but it is rapidly catching up, with an exponential increase in installed capacity since 2010. Costs are rapidly declining, technology is quickly maturing, and solar energy is very near becoming a self-sustainable commercialized energy solution.
Other novel energy technologies, however, are in the early commercialization stage. These include clean hydrogen generation, synthetic fuels, and advanced nuclear technologies. The commercial success of new energy technologies within existing energy systems is highly uncertain due to numerous factors. Yet, we can draw some parallels from recently commercialized technologies, like wind and solar, to better understand the dynamics and future states of new energy systems.
The purpose of this research is to understand the factors affecting the deployment of a new energy technology in order to inform policy or support decision-making. Some technologies are very novel and still developing, like clean hydrogen, with large uncertainties about future market uptake scenarios. The diffusion of developing technologies is very dynamic and highly uncertain due to many factors that could influence the integration of these technologies into the overall energy system. To understand the general trajectory of commercializing novel energy systems, we can examine the experiences of already mature technologies that have penetrated the energy market, specifically onshore wind and solar photovoltaic, and apply insights about the factors influencing their diffusion to still-maturing technologies to better understand their potential for successful commercialization.
The proposed model addresses the stakeholder need for a deeper understanding of factors that potentially affect technology diffusion to allow better-informed decision-making. While multiple methodologies and tools are available to analyze energy transition, none of them specifically focus on understanding holistic energy system dynamics to make better decisions and predictions. The model developed in this research is unique compared to other system dynamics or technology transition models, as it provides stakeholders with a clear and intuitive understanding of novel energy system behaviors within established energy systems.
Wind energy is used as a case study to draw lessons from the commercialization of that technology. This research aims to utilize modern systems engineering methods and tools to better understand the dynamics and future behaviors of energy systems. By analyzing the growth and development of wind energy, which has reached high technical maturity and widespread commercialization, we can gain insights into the factors contributing to its success. This research developed a model that captures the key elements and behaviors of a novel energy technology within the established energy system, using historical data from wind-based electricity generation. The model aims to provide a framework that can be applied to other emerging energy technologies, such as electrolysis-based hydrogen, synthetic fuels, and advanced nuclear technologies, to predict their potential for commercial success and integration into the existing energy system.
This paper is organized as follows. Section 2 provides a brief overview of the overall energy system in the United States and the factors affecting the behaviors of energy systems. Section 3 outlines the approaches currently used to model energy systems and introduces appropriate systems engineering principles and tools to assist with the understanding and modeling of complex systems, including energy systems. Section 4 introduces the dynamics of novel technology diffusion and commercialization via a qualitative system dynamics model. Section 5 describes the development of a quantitative system dynamics model for wind technology commercialization. Lastly, Section 6 summarizes the findings of this research and suggests opportunities for future research.

2. Background on Energy Systems

This section provides a brief overview of a large-scale national energy system, as well as the basic factors affecting the integration of a novel energy technology into the overall energy system.

2.1. Description of an Energy System

National, regional, and local energy systems form a complex enterprise comprising many elements and their interconnections. Figure 1 shows a schematic of the overall U.S. energy system. The elements of these systems belong to the following general categories:
  • Sources of Electricity: In the United States, as of 2023, most electricity is generated from fossil fuels, specifically natural gas and coal [5]. Fossil fuel-based energy sources are associated with heavy carbon dioxide (CO2) emissions, leading to a large push for the transition to zero- or low-emission sources for electricity generation, such as renewable and nuclear energy. Renewable energy sources include solar- and wind-based power generation, as well as hydropower and smaller sources such as geothermal and wave energy.
  • Energy Sources Other than Electricity: Large industrial processes rely on energy sources other than electricity (e.g., steam). The energy sources for the industrial processes in the United States are also mainly fossil fuels (i.e., natural gas, coal, and oil). Many industrial processes also require feedstock other than energy to produce their products (e.g., hydrogen and oxygen). For example, the steel manufacturing industry uses large amounts of hydrogen and oxygen, both generated mostly from fossil fuel-based feedstock using processes with heavy CO2 emissions. These areas are illustrated under “Process Energy Sources” and “Sources of Hydrogen” in Figure 1.
  • Energy Consumption: Energy consumers rely on electricity and nonelectrical energy sources. Many industrial processes and the transportation sector primarily use fossil fuels. These hard-to-electrify industries drive the need to develop breakthrough clean energy solutions beyond electricity.
  • Energy Economy: The energy transition is significantly influenced by the energy economy, which encompasses the production, distribution, and consumption of energy. The interplay between energy markets, federal policies, and projected energy demands shapes the trajectory of this transition.
Energy prices of incumbent technologies, such as natural gas-based electricity generation, play a pivotal role. When natural gas prices are low, they can hinder the adoption of renewable energy sources, as natural gas becomes a more economically attractive option [6]. Conversely, high natural gas prices can accelerate the shift toward renewables by making them more competitive in terms of cost [7]. Additionally, fluctuations in global oil prices can impact the broader energy market. High oil prices can drive investments in alternative energy sources, while low oil prices can reduce the economic incentive to invest in clean energy technologies, slowing the transition [8,9].
U.S. federal policies are also crucial in shaping the energy transition. Climate change policies aimed at reducing greenhouse gas emissions, such as the implementation of carbon pricing or emissions trading systems, can incentivize the adoption of clean energy [10,11,12]. Investments in research and development for renewable energy technologies and energy efficiency measures are critical components of climate change policy [13].
In terms of energy security, reducing dependence on imported fossil fuels by diversifying energy sources enhances national security and stabilizes energy prices. Additionally, diversifying energy sources can make the energy sector more resilient to disruptions, such as natural disasters or geopolitical conflicts [13,14].
Projected energy demands, both short-term and long-term, also impact the energy transition. In the short term, energy demand is influenced by economic conditions, weather patterns, and technological advancements. Long-term energy demand projections consider factors such as population growth, urbanization, and economic development [6]. Sustainable growth requires a significant increase in clean energy capacity to meet rising demand while reducing carbon emissions [15].
Given the complexity of the energy system, the current paradigm demands comprehensive energy planning to maximize the energy system’s performance. The optimal planning, design, and operation of such energy systems, which efficiently integrate different energy sources and fluctuating demands, inherently represent a multi-disciplinary complex problem. While this research does not address the planning and optimization of the overall energy system, numerous studies exist, e.g., [16,17,18,19,20]. In addition, multiple novel methodologies and tools are now available that focus on the planning and optimization of the overall energy system. We review some of the most prominent tools in Section 3.2.
It is important to note that the energy system description presented above potentially overlooks some elements or dynamics. However, the presented information provides a clear understanding that the U.S. energy system is influenced by the interplay of energy market dynamics, federal policies, and projected energy demands. The evolving landscape of energy prices, driven by both incumbent and alternative technologies, along with supportive governmental policies and an increasing focus on sustainability, is a key factor that determines the pace and success of the transition to clean energy.

2.2. Dynamics of Novel Energy System Diffusion

The energy system transition is influenced by a complex interplay of factors, including technological advancements, government policies, economic considerations, social acceptance, geopolitical dynamics, environmental concerns, and resource availability [21,22,23,24,25,26]. Changes in technologies, market forces, regulations, public opinion, and international relations all play a role in driving the shift toward new energy sources and systems.
This multifaceted process involves not only the development and adoption of novel energy technologies but also the transformation of existing infrastructure, market structures, and regulatory frameworks. As nations and industries strive to balance economic growth with environmental sustainability, the energy transition is becoming a central focus of global efforts to combat climate change and ensure energy security for future generations. The key factors affecting the energy system transition are as follows:
  • Policy and Regulation: Government policies, subsidies, tax incentives, and regulations play a crucial role in encouraging or hindering the energy transition, as supportive policies can significantly accelerate the adoption of novel energy technologies.
  • Technological Advancements: Technological innovations improve efficiency and reduce costs, making them more competitive with incumbent fossil-fuel-based energy solutions. Cost reductions due to technological advancements have been observed in wind and solar electricity generation and storage technologies [1,2,27].
  • Economic Factors: The cost of new energy technologies versus incumbent ones, the availability of financing, and the overall economic climate influence investment decisions for the energy sector.
  • Environmental Concerns: Growing awareness of climate change drives the demand for cleaner energy solutions. International agreements like the Paris Agreement also pressure countries to reduce greenhouse gas emissions, given that the electricity sector is the primary contributor of CO2 emissions.
  • Energy Security: Diversifying energy sources can enhance national energy security by reducing reliance on imported fuels and mitigating the risks associated with geopolitical tensions.
  • Market Dynamics: The energy market’s structure, including energy prices, market competition, and the extent to which markets are open to new entrants, affects the pace and nature of the energy transition.
  • Availability of Resources: The availability of the resources required for a novel energy technology is a key factor influencing the success of that technology’s commercialization. Resource constraints, either real or perceived, add significant uncertainties to the overall success of the technology’s commercialization, which may preclude willingness to invest in those technologies (e.g., access to fuel and land resources needed for renewable installations).
  • Public Perception and Social Acceptance: Public awareness and support for novel energy projects can influence their deployment. Social acceptance is crucial for the successful implementation of large-scale projects and the eventual nationwide diffusion of the technology.
  • Infrastructure and Grid Capability: The existing energy infrastructure’s ability to integrate renewable energy sources, including grid capacity and storage solutions, affects the energy transition process.
  • Research and Development: Investment in research and development (R&D) for new energy technologies and improvements in existing ones can significantly impact the speed and efficiency of the energy transition.
  • International Cooperation: Cross-border collaboration on technology transfer, funding, and policy alignment can facilitate an efficient and widespread energy transition.
These factors interact in complex ways, and addressing them holistically is essential for any model that aims to describe or predict energy transition.

3. Literature Review

There are multiple approaches supported by modeling and simulation tools focused on modeling energy system transition. The most commonly used approaches are summarized in this section.

3.1. Existing Approaches to Modeling Energy Systems and Energy Transition

System dynamics (SD) models use feedback loops and stock-flow diagrams to simulate the dynamic behavior of energy systems over time [21,28,29,30,31,32,33,34]. These models capture the interactions between different components, such as technology, policy, economics, and social factors, making them particularly useful for understanding long-term trends, feedback effects, and complex interdependencies. Agent-based models simulate the actions and interactions of individual agents, such as households, firms, and policymakers, to understand how their behaviors contribute to the overall system dynamics [35,36,37,38]. These models are effective for studying market dynamics, adoption behaviors, and the social diffusion of technologies, capturing heterogeneity and individual decision-making processes. Optimization models aim to find the optimal configuration of the energy system based on criteria like cost minimization, emissions reduction, or energy efficiency [39,40,41,42,43,44]. The optimization could be performed using other models, e.g., agent-based models, as the core part to find optimal solutions. Optimization models are well suited for planning and designing energy systems, making investment decisions, and identifying least-cost pathways. Integrated assessment models combine insights from multiple disciplines, including economics, environmental science, and technology, to assess the interactions between human and natural systems [45,46,47,48]. Integrated assessment models are often used to evaluate the long-term impacts of climate policies, offering a comprehensive and multidisciplinary perspective. Lifecycle assessment (LCA) models evaluate the environmental impact associated with all stages of a product’s life, from raw material extraction through production, use, and disposal [49,50,51,52]. LCAs provide detailed environmental impact assessments, making them useful for comparing different energy technologies in terms of their environmental impact and identifying areas for improvement. Hybrid models combine elements from different modeling approaches to leverage their respective strengths. For instance, a hybrid model might integrate system dynamics for long-term trends with agent-based models for individual behavior analysis. This approach offers a more comprehensive and nuanced analysis by addressing complex, multifaceted research questions.
The approaches and models described above are well suited for their applications. However, the models are complex, requiring experts to both develop them and interpret the results. On the other hand, decision-makers desire something that describes the problem in sufficient detail yet simply provides a clearer understanding of underlying issues and potential solutions. In order to make better-informed decisions, the stakeholders must also understand the behaviors of the system, both expected and emergent, to develop solutions that have built-in mitigation strategies for unwanted dynamics. As such, an SD modeling approach was chosen for this research as it is best suited for the purpose of providing an understanding of the dynamics of novel energy systems diffusion within the established energy systems.

3.2. Systems Engineering Principles and Tools to Enhance Decision-Making for Energy Systems

As discussed in Section 2.1, the energy system is a very complex system with multiple interconnected elements. Systems engineering is a discipline developed to deal with this type of problem that addresses the challenges of complex, multidiscipline systems. Therefore, SE is used in this research to guide the formulation of the problem by modeling the factors affecting the deployment of a new energy technology.
Systems thinking is the foundation of SE—it is the discipline that relies on the holistic approach capable of “connecting and contextualizing systems, system elements, and their environment to understand difficult-to-explain patterns of organized complexity” [53]. This capability to understand complex systems is imperative in decision-making for complex systems, which is the reason systems thinking is seen as the foundational methodology to build the decision-support model being researched here.

Model-Based Systems Engineering

The study presented in [54] describes MBSE as “an emerging paradigm for improving the efficiency and effectiveness of systems engineering through the pervasive use of integrated descriptive representations of the system to capture knowledge about the system for the benefit of all stakeholders”. The INCOSE handbook [53] discusses the benefits of MBSE compared to the traditional, document-based practice, including improved communications between stakeholders, a better capability to manage system complexity, improved product quality, and enhanced knowledge capture and transfer. Therefore, SE processes can be further improved by implementing a model-based systems engineering (MBSE) approach.
A system dynamics (SD) model is an MBSE tool that leverages feedback loops and stock–flow relationships to examine the intricate interactions within an energy system. The key components of an SD model include the following [55]:
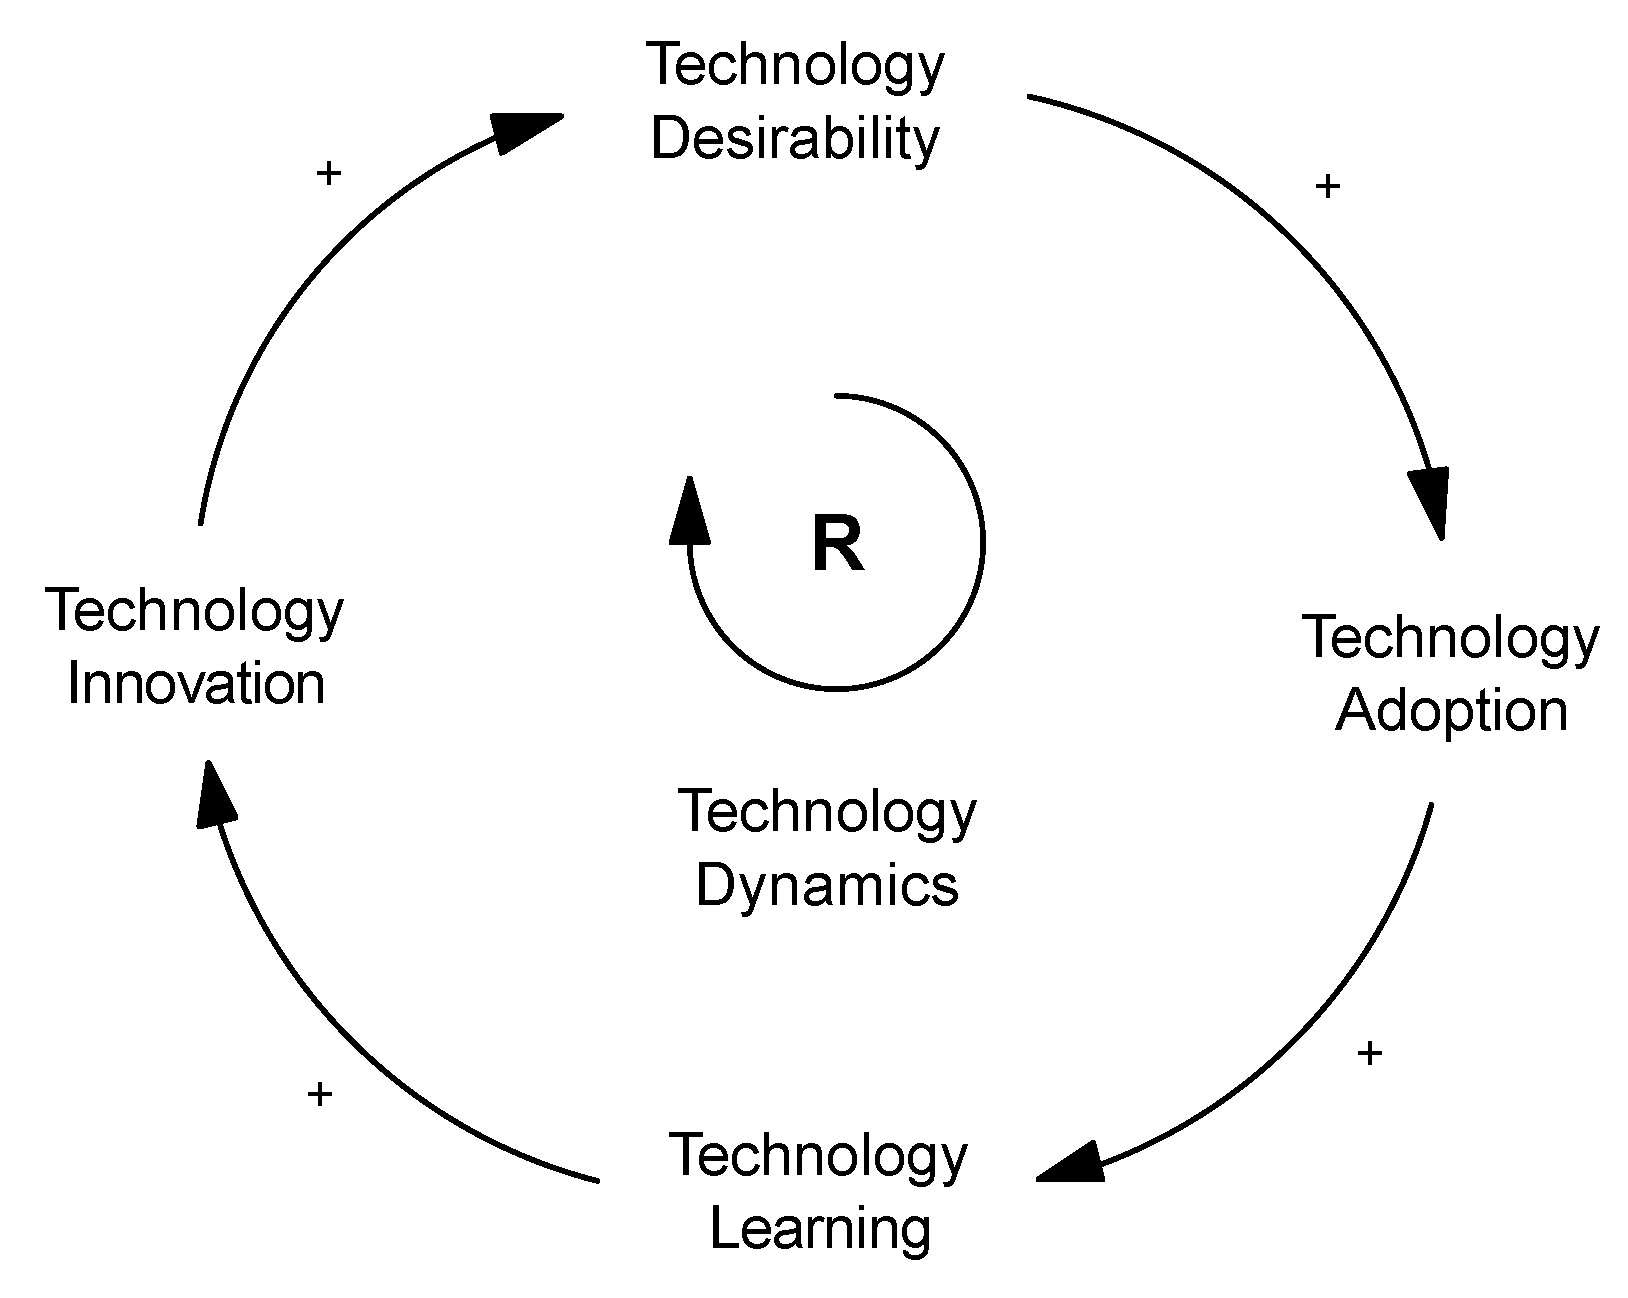
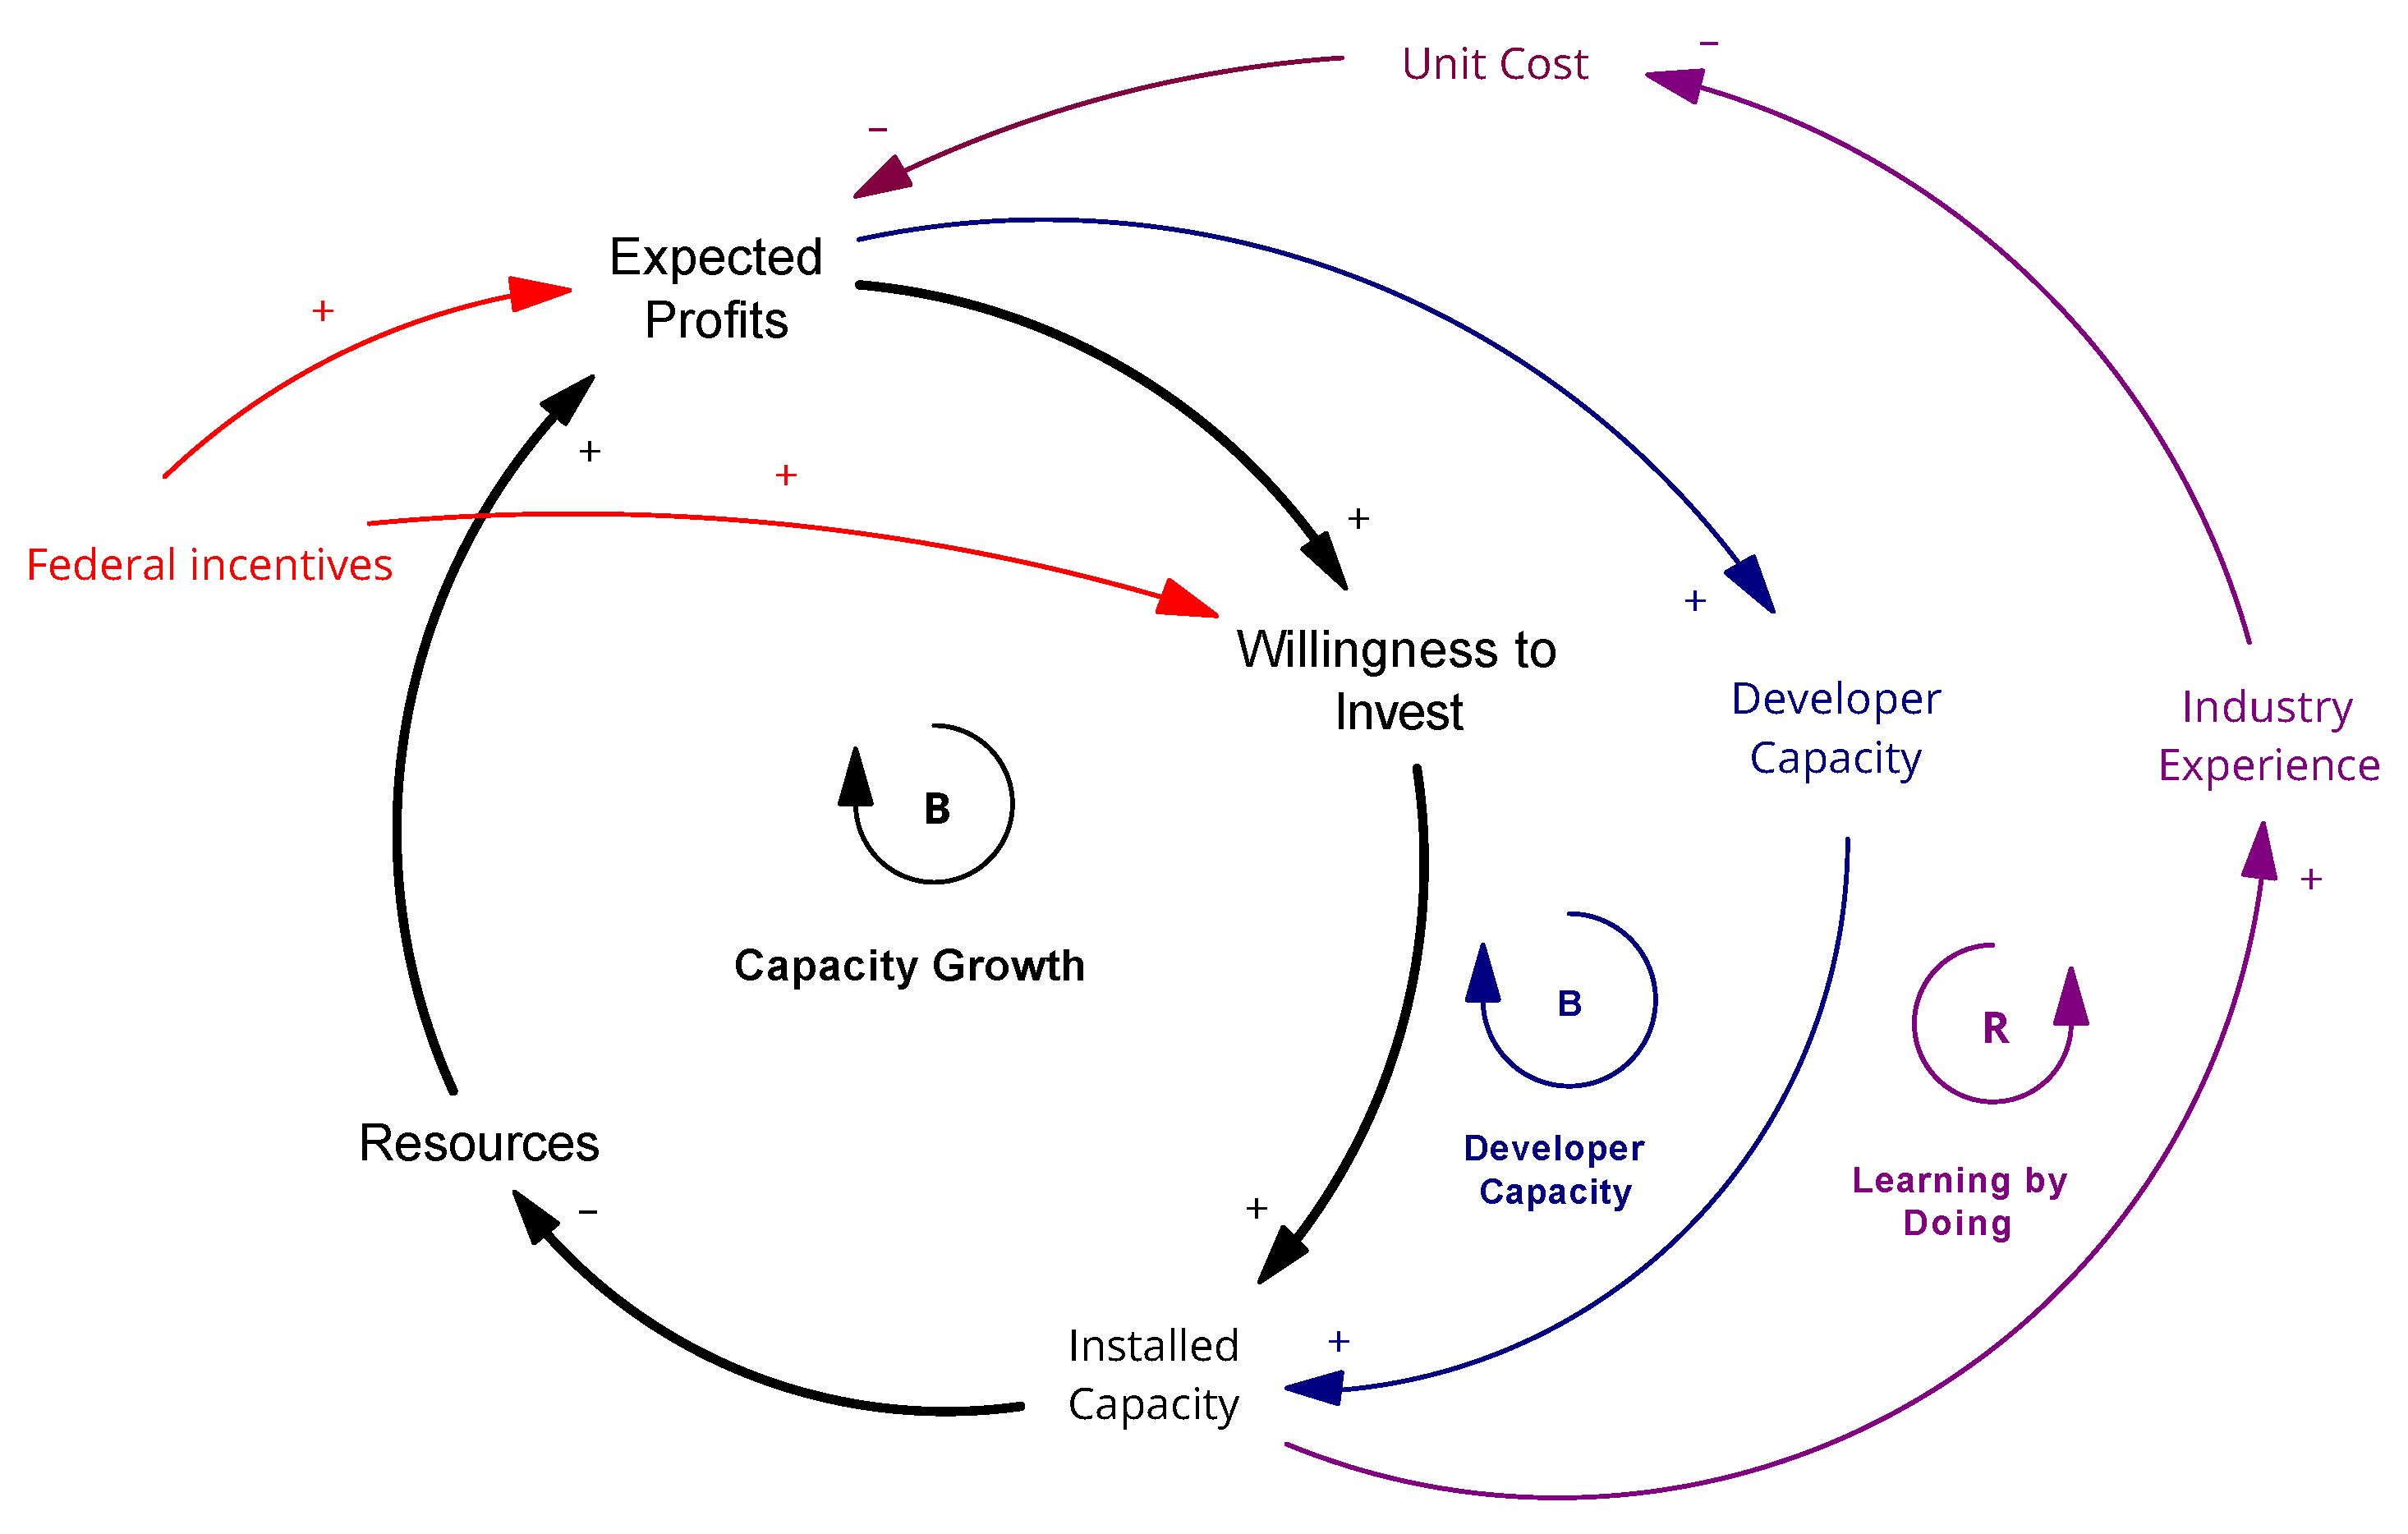
  • Feedback loops, or causal-loop diagrams (CLD)s, which illustrate the interconnected relationships between different components, such as how a decrease in costs can drive an increase in technology installations and the increase in installations, further driving down costs.
  • Stocks, which represent accumulated quantities, such as installed capacity.
  • Flows, which indicate the rates of change within the system, such as the rate of incremental capacity additions.
Software tools like Vensim [56], Stella [57], and Powersim [58] are commonly used for this purpose. SD models are employed to support the understanding of the diffusion of a novel energy system due to their ability to take into account multiple interdisciplinary factors, such as technology adoption, policy changes, economic impacts, and social behavior over time, enabling the simulation and evaluation of different transition pathways and policy scenarios. In addition, the specific benefit of SD models is their unique capability to demonstrate the feedback effects between model elements, which helps in understanding long-term system behaviors resulting from such dynamics.

4. Qualitative Modeling of Energy System Commercialization Dynamics

Technology diffusion is the process of adopting and spreading a new technology across markets and societies involving various stakeholders such as developers, manufacturers, users, policymakers, and regulators. This process unfolds in several phases [11].
In the introduction phase, the technology is brought to market and adopted by early enthusiasts. During this phase, feedback from these early users leads to refinements in design and functionality. As improvements are made, the technology enters the growth phase and becomes more attractive to a broader audience. Adoption rates increase, production scales up, costs decrease, and significant investments in marketing and infrastructure become common. As the technology reaches peak adoption during the maturity phase, the market becomes saturated, and the rate of new adopters slows down. The focus then shifts to incremental innovations, cost optimization, and the enhancement of the user experience. Eventually, newer technologies may emerge, leading to a decline in the adoption of the existing technology and prompting companies to pivot to the next wave of innovation.
Positive feedback loops are critical in technology diffusion. As more users adopt the technology, more data and feedback are generated, which is invaluable for further innovation and refinement, making the technology even more desirable and driving more adoption, thereby perpetuating the cycle of improvement and diffusion, as shown in Figure 2 (adapted from [59]).
However, diffusion is not without its challenges. Large-scale sociotechnical systems, such as energy generation, involve numerous interdependent components and subsystems that have intricate and dynamic relationships with each other and with external elements. Understanding and leveraging these dynamics is crucial for successfully introducing and scaling new technologies, especially within complex sociotechnical systems like energy generation. The system dynamics (SD) model developed in this research aims to address these interactive dynamics.

4.1. Modeling Methods: Causal-Loop Diagram

The key dynamics of new technology diffusion affected by innovation are presented in Figure 2 [59]. The trajectory of technology commercialization can be modeled using two basic types of models: capacity growth and technology diffusion. The capacity growth model focuses primarily on economic factors as the main influences on the adoption of a product or technology. The technology diffusion model replicates social contagion as the main factor influencing adoption. The basic Bass model [60] of diffusion is well known and widely used in marketing, and many SD studies are based on this model [55,61,62,63]. These two types of models are often combined to include consideration of both the economic and social factors influencing technology adoption [29,59]. This approach is well suited to analyzing energy systems’ commercialization, and several studies have developed integrated SD models, as described in this section.
A few widely used models [64,65,66] are much broader, with their scope focused on the overall electricity market, either regional or at a national scale, with a large set of endogenous and exogenous variables. These models target scenario assessments focusing on a specific outcome (e.g., minimizing costs, minimizing carbon emissions, or assessing the effect of policies on electricity markets).
Our research focuses on the dynamics of novel energy technology adoption and uses a capacity growth model as the basis, with the addition of multiple variables affecting energy system adoption. The model formulation is discussed below.

4.2. Model of Dynamics of Novel Energy Systems

The dynamics of energy system adoption are presented via a CLD, as shown in Figure 3. Model loops are shown in bold text and variables are shown in italicized text.
The capacity growth loop represents the key behavior in energy technology market uptake. Expected profits positively affect the willingness to invest, which, in turn, positively affects the installed capacity. However, for resource-dependent energy systems, the availability of limited resources could constrain growth. Wind and solar energy are dependent on the availability of land for installing large-scale projects. Other energy technologies may be dependent on fuel resources, such as natural gas for combined-cycle power plants or uranium for nuclear power plants. For resource-dependent systems, the increasing installed capacity depletes available resources. This is negative feedback, or a constraining factor, in the capacity growth loop.
As discussed earlier, positive feedback is depicted with a “+” sign and negative feedback with a “−” sign. Similar to the multiplication rule, where multiplying two negatives results in a positive, an even number of negative relationships in a causal loop results in a positive loop, also known as a reinforcing loop (marked as R), while an odd number of negative relationships makes the loop negative, also known as a balancing loop (marked as B). Given that the capacity growth loop has three positive relationships and one negative, it is a balancing loop that is identified with a “B” and a circular arrow showing the direction of the loop’s dynamics.
The “learning-by-doing” concept is the most common approach to projecting technology cost reduction trends [67,68]. It illustrates the relationship between cumulative production output and unit cost reduction. This principle suggests that, as companies increase their production, they gain experience and insights, leading to more efficient manufacturing processes. Consequently, production costs decrease as a direct function of cumulative output. This phenomenon is quantitatively described by the learning rate [69,70,71], which measures the percentage reduction in cost for each doubling of cumulative production output. As firms continue to produce more, they discover ways to streamline processes and operations, reduce waste, and improve overall efficiency, thereby lowering the unit cost even further. A similar concept is called “learning by research”, in which the technology improves due to investments in R&D, which results in improved technology efficiency, improved reliability, and the utilization of more appropriate materials, ultimately decreasing costs. Many analyses use a two-factor learning curve that considers both learning-by-doing and learning-by-research contributions to the declining costs of technologies [72,73]. Many studies have also used system dynamics to explore learning curves within the dynamics of technology development [74,75,76,77]. This research considers technological learning to be an essential part of energy technology adoption.
The learning-by-doing loop is an extension of the capacity growth loop, where the expected profits are directly affected by the unit cost. The unit cost can be expressed as the cost of a technology unit (e.g., cost of a wind turbine or a solar panel) or it can represent the unit cost of energy expressed as levelized cost of energy (LCOE) measured in dollars per unit of electricity, USD/MWh. The growing installed capacity increases industry experience (positive feedback), which decreases unit cost (negative feedback). The lower unit cost makes the expected profits larger (negative feedback) with the willingness to invest completing the learning-by-doing loop, which is a reinforcing loop.
The learning-by-research loop is connected to the rest of the dynamics through the unit cost and expected profit variables—the increasing expected profits allow for larger investment in R&D (positive feedback), which, in turn, increases technology maturation (positive feedback), resulting in decreasing unit cost (negative feedback). The negative feedback between the unit cost and expected profits completes the learning-by-research-loop, which is a reinforcing loop.
Technology adoption depends heavily on industry readiness to install projects (represented by the developer capacity loop) and to supply necessary parts (represented by the manufacturing capacity loop). The developer capacity loop is a balancing loop in which increasing expected profits increases developer capacity, which, in turn, increases installed capacity, both positive feedbacks. The loop completes through the resources and expected profits variables. The manufacturing capacity loop is very similar to the developer capacity loop and is a balancing loop.
The competition loop represents the industry dynamic where the spike in demand results in supply chain shortages, which allows manufacturers to increase markup on the components. The dynamic is reversed when manufacturing capacity increases to satisfy the demand and increased competition between suppliers results in lower markups and, therefore, decreased unit cost, which is negative feedback. The competition loop completes through the expected profits variable and is a reinforcing loop.
The demand-driven capacity growth loop represents the energy market push or resistance to producing more electricity. The needed electricity generation capacity is affected by several exogenous variables, namely expected energy demand (dependent on national economic growth) and available electricity generation capacity, represented by the other technologies’ capacity and retiring capacity exogenous variables. The difference between expected demand and currently available capacity is represented by the needed capacity gap variable, which will decrease when the installed capacity is increasing (negative feedback). A larger needed capacity gap would increase the demand for additional electricity generation capacity, including the demand for the specific technology being modeled. This is represented by the demand-pushed added capacity, and its increase will increase the installed capacity (positive feedback), closing the balancing demand-driven capacity growth loop.
Other Variables—The variables in the causal loops are endogenous or internal to the system. These variables have a direct effect on system behavior, while the system also affects these variables. There are also multiple exogenous variables that affect the system, but these influencing factors come from “outside” the system and are discussed below.
The needed capacity gap is affected by the expected energy demand (usually a function of national economic growth), the capacity of other technologies (i.e., all electricity-generating technologies capable of meeting electricity demand), and the retiring capacity (all technologies). The Federal or State Mandates for Technology Choices variable represents the preference for a certain technology by the federal or local government. The renewable portfolio standard (RPS) is an example of such a preference where the push is toward renewable energy technologies to reduce carbon emissions in the electricity sector. The RPS mandates increase the demand for clean technology and decrease the demand for fossil-based technology.
Willingness to invest is affected by several economic, technical, and social factors. In a broader sense, the willingness of investors to invest in a new technology is directly influenced by the level of uncertainty of such an investment. The uncertainties are dependent on government support, represented by federal incentives—the stronger the support in terms of the incentive’s scale and duration, the greater the willingness to invest. Another economic variable is the competition price, in which the attractiveness of a certain technology is measured against its competitors. In addition, the cost of energy generated by the new technology is affected by access to existing infrastructure (e.g., electrical grid for wind energy). The cost of the connection to the existing grid depends on the site’s location and how much it would cost to connect the new site to the existing electrical grid, including new transmission lines and other infrastructure, permitting right-of-way rights, and other associated costs.
Social factors can be summarized as public acceptance where a given technology could experience either public support (e.g., recent strong support for clean technologies) or resistance (e.g., public resistance to nuclear energy after the Three Mile Island accident).
There are also some technical factors that could influence the attractiveness of a technology to investors. These are typically performance parameters like capacity factors or reliability, but these are considered endogenous to technological progress. However, supporting technologies, such as energy storage technologies for solar and wind generation, could either expedite or hinder the adoption of the technology of interest. This is represented by the complementary technologies variable.
Lastly, federal R&D investment is an exogenous variable supporting the learning-by-research loop, in which, in addition to the endogenous progress made by the industry by allocating a portion of their profit to R&D, the federal government provides additional external support, expediting technology maturation.
It is often the case in energy systems that the same variables could be considered either endogenous or exogenous depending on the selected system boundary. For example, in the case of the national electricity generation model, federal incentives would be an endogenous element, whereas here, this variable is exogenous.

4.3. Results of Model-Based Qualitative Assessments

As discussed previously, energy systems are very complex, with highly heterogeneous elements interconnected with each other. Yet, the model-based representation using CLDs, as shown in Figure 3, offers an intuitive, easy-to-understand way in graphical format for depicting complex interactions between system elements. In addition, the model-based system representation allows for additional benefits like traceability and automatic updates, which become increasingly important for larger models with dozens of feedbacks and hundreds of variables. For example, loops can be easily displayed, as presented in Figure 4, using a “causal chain” function, which helps communicate system behaviors to stakeholders. In this example, the learning-by-doing loop is automatically highlighted by the model.
Another traceability option is to identify all influencing parameters for the variable of interest, either through a tree diagram or an N2 matrix. Figure 5 shows all variables that influence the installed capacity.
These capabilities become extremely important in supporting the decision-making process in a more straightforward, graphical manner, especially when systems are very large with hundreds of elements, thereby supporting scalability.

5. Quantitative Modeling of Energy System Commercialization Dynamics

While a qualitative depiction of energy system relationships and dynamics is valuable, it is not sufficient to support decision-making. For informed decision-making, understanding which parameters are the most influential is of critical importance. This understanding enables gauging levels of uncertainty and corresponding risks to the selected solutions, as well as developing strategies to best manage resources to increase the success of technology diffusion. As such, a qualitative approach is expanded to include a quantitative approach for energy system diffusion modeling, as discussed in the following subsections. The variables of the model, along with the data sources, are presented in Table 1.

5.1. Model Boundaries and Key Assumptions

An important step in modeling is problem articulation [55]. The purpose of the model is as follows: To provide an understanding of factors affecting the trajectory of a new energy technology’s commercialization to inform decision-making. This purpose statement helps define the model’s boundaries. Figure 3 demonstrates the key dynamics of a novel energy system, but the actual model should be as simple as possible to serve the purpose (i.e., provide valuable insights for the problem being examined). As such, we remove some of the dynamics from the detailed model to focus on the factors with the greatest influence on the energy system’s market integration. The reason for model simplification is discussed below.
The importance of electricity demand to the success of novel energy technology integration is obvious. However, when the new technology is not expected to replace the incumbent technologies completely but rather take a somewhat smaller portion of the market, the overall electricity or energy demand is an exogenous variable that indirectly affects technology diffusion. This indirect effect is mostly related to market uncertainties in terms of the additional energy needs and whether such needs can be satisfied by the new technology.
In the current energy system landscape, novel energy technologies still represent a smaller portion of the market [90]. Fossil fuels account for approximately 60% of electricity generation, with nuclear energy providing 18% and all renewable sources contributing 21%. The share of renewable electricity generation has significantly increased over the past few decades, nearly doubling between 1990 and 2024. Nevertheless, individual novel technologies, such as utility-scale wind and solar, contribute only about 10% and 4%, respectively [90].
Given the substantial market demand relative to the small market share occupied by individual novel technologies, national electricity demand is not the key factor affecting technology diffusion. Consequently, the demand-driven capacity growth loop is excluded from the system dynamics model.
Multiple researchers have argued the need for better-defined learning curve models, specifically advocating for two-factor learning curves that account for both the effect of experience (i.e., “learning-by-doing” concept) and the impact of R&D (i.e., “learning by research” concept) [72,73,77,91,92]. Others have called for multifactor learning curves that include parameters beyond learning by doing and learning by research to enhance the understanding of technology cost reduction rates via multiple factors influencing them [93,94,95,96]. Results from studies on two-factor and multifactor learning curves indicate that installed capacity is the most influential factor in technological cost reduction, with the impact of R&D being the second. These studies also highlight the challenges in precisely estimating the contributions of learning by doing versus learning by research due to the integrated dynamics of these two processes. Furthermore, researchers have noted difficulties related to data availability for estimating the R&D contribution to overall technology cost reduction and warned that additional learning curve parameters may lead to overfitting, resulting in poor forecasts [97].
Given that the focus of this study is on technology commercialization rather than the specific factors driving cost reduction, it is reasonable to employ a simpler, single-factor learning curve in which cumulative installation is the primary driver of technology unit cost reduction. As such, the learning-by-research loop is not considered an individual driving factor, and cost reduction through experience is used as the cumulative learning factor.
Two balancing loops (the developer capacity and manufacturing capacity loops) are very similar—either or both can limit capacity growth due to restricted resources or uncertainties in the future energy market that dampen the desire to grow. The manufacturing sector, also referred to as the supply chain, has additional dynamics where competition can significantly affect component costs, which, in turn, directly impact the unit cost. The study described in [59] suggested that both developer and manufacturing capacities are crucial for the market uptake of novel energy systems and incorporated both dynamics into their model. Conversely, the study described in [28,29] included a single industry capacity factor, namely the “capacity of wind turbines construction industry”, which aligns with the developer capacity concept in this study.
While there is agreement that both developer and manufacturer capabilities are vital for the diffusion of novel energy systems, it is unclear which is more significant for the adoption of an energy system within a specific context, such as a nation’s electricity system. The ability to install utility-scale power plants is certainly dependent on domestic capabilities, whereas manufacturing capacity is a global factor since many manufacturers of novel technologies supply components globally. In fact, North American manufacturers represent a relatively small proportion of the total global manufacturers of wind components [98,99,100]. The U.S. share in solar energy component manufacturing is even smaller [101,102].
Several research studies [59,103] and industry assessments [104,105,106] have indicated that component costs are influenced by supply chain availability: increased backlog in orders typically drives up component markups, thereby increasing overall costs. However, establishing a clear correlation between individual manufacturing company order backlogs and price increases is complex due to limited access to company business information, variability in market strategies that affect pricing and markups, and multiple manufacturers in the market. Additionally, due to similar data limitations, the growth capability of manufacturing companies is difficult to predict since their growth is affected by local markets, policies, and individual business plans. Therefore, we excluded the manufacturing capacity loop from the system dynamics model for this study, and industry capacity growth is represented by the developer capacity loop.
Some of the exogenous variables shown in Figure 3 are integrated into endogenous variables in the model. Specifically, grid integration cost and competition price are accounted for as part of the available profitable resources concept, which is explained in Section 5.2. The public acceptance and complementary technologies variables are not included in the model since they are considered less important to technology diffusion; however, they could be incorporated into a more detailed model later.
The revised CLD is presented in Figure 6, representing the boundary of the system dynamics model built for this study, as described in Section 5.2.

5.2. System Dynamics: Model Input Specification and Calibration

The model is built for onshore wind electricity generation technology with parameters and corresponding historical data. The core model consists of four submodels:
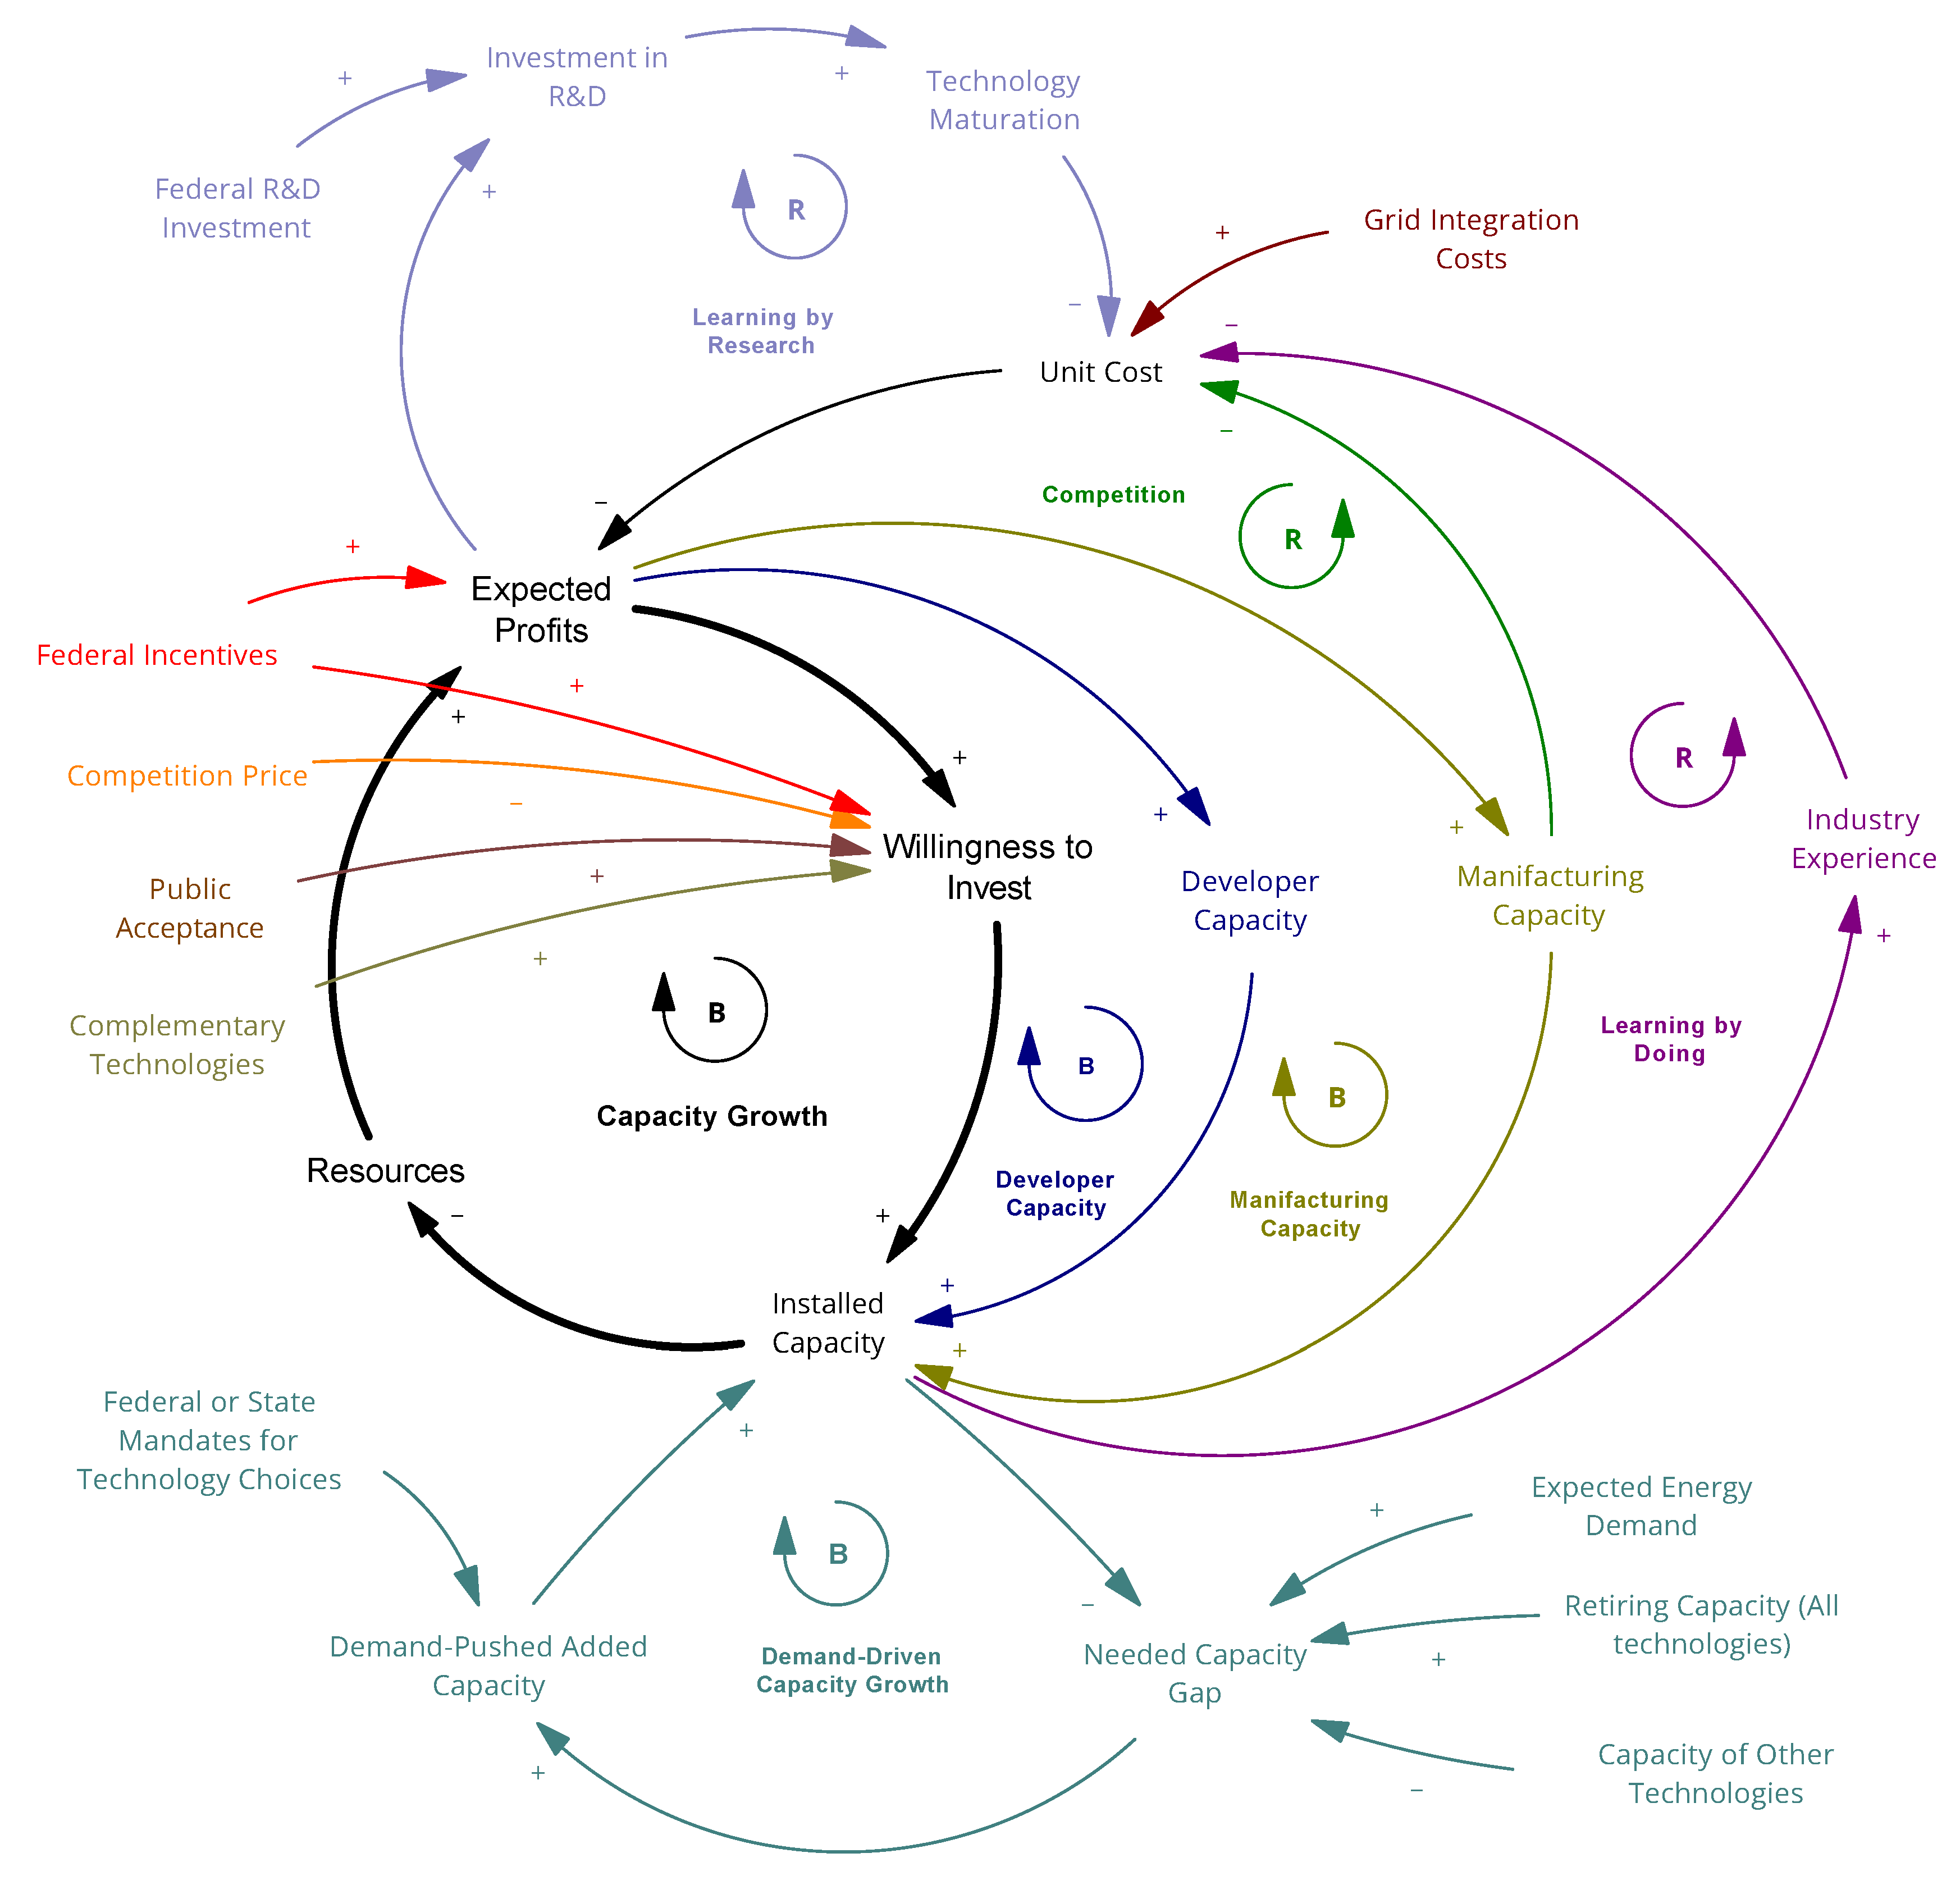
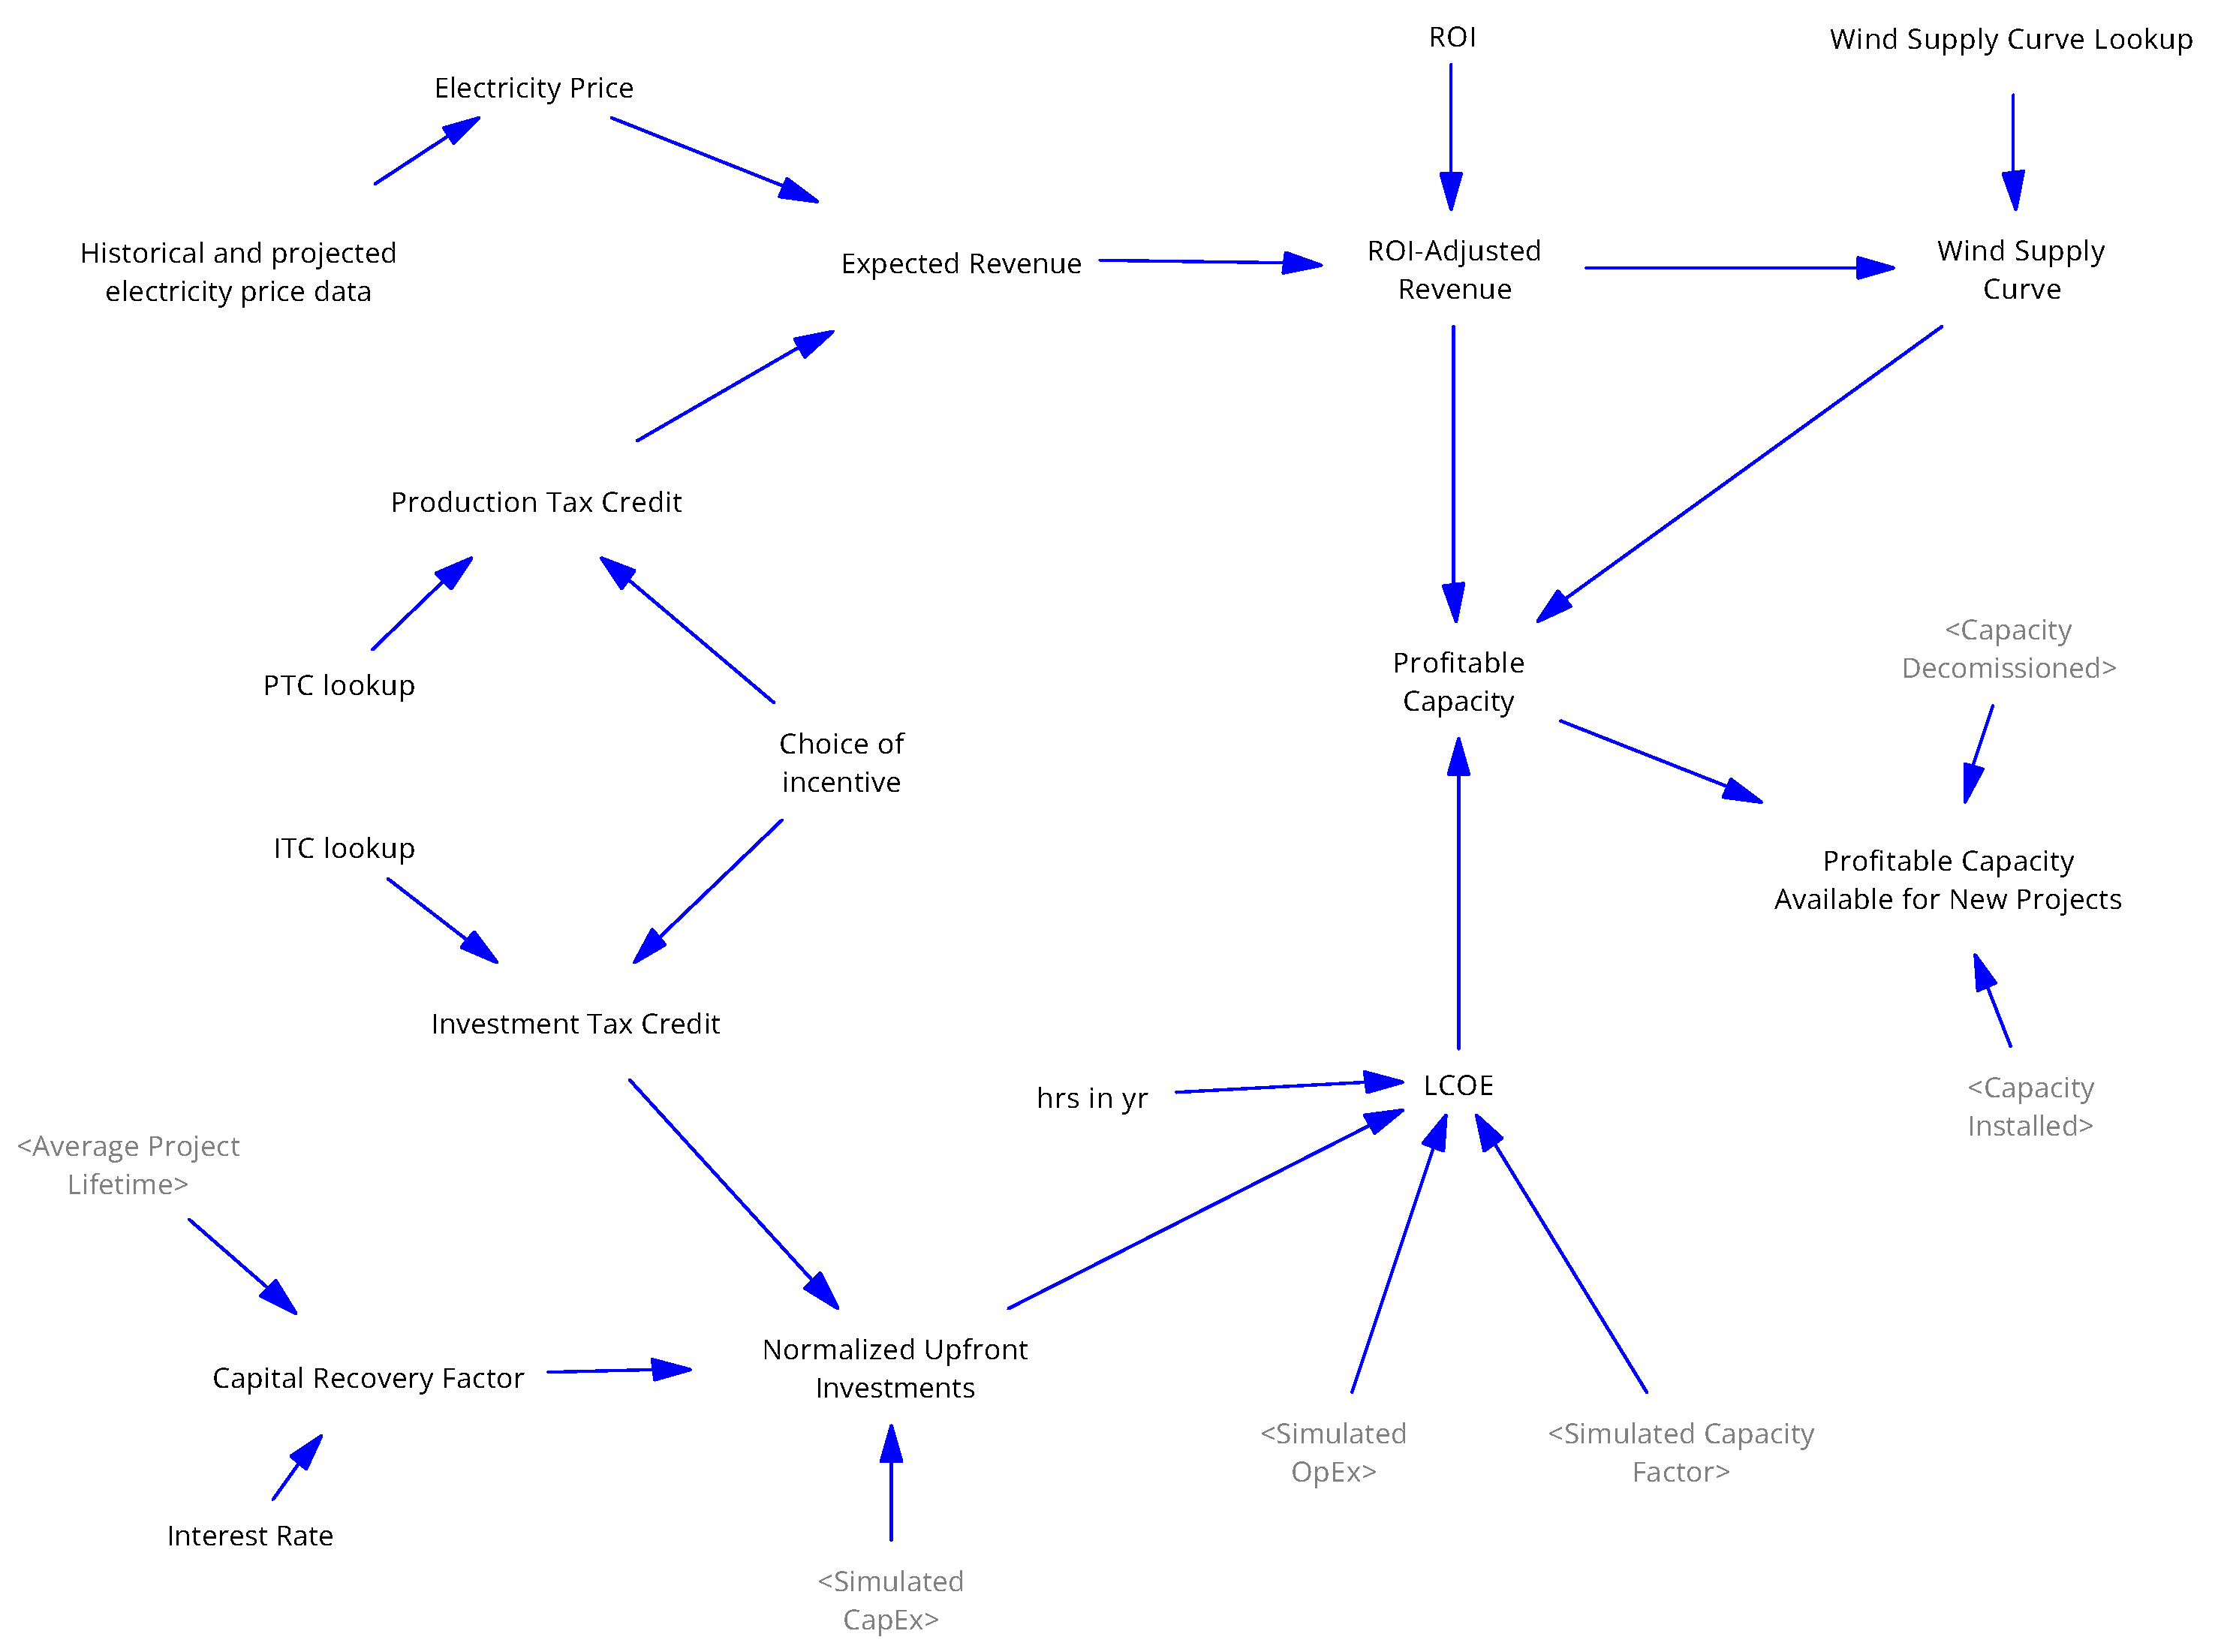
  • Profitable capacity models resources suitable for new energy system installations based on the total available resources, their portion available for installations, and a smaller portion of the available resources that is considered profitable;
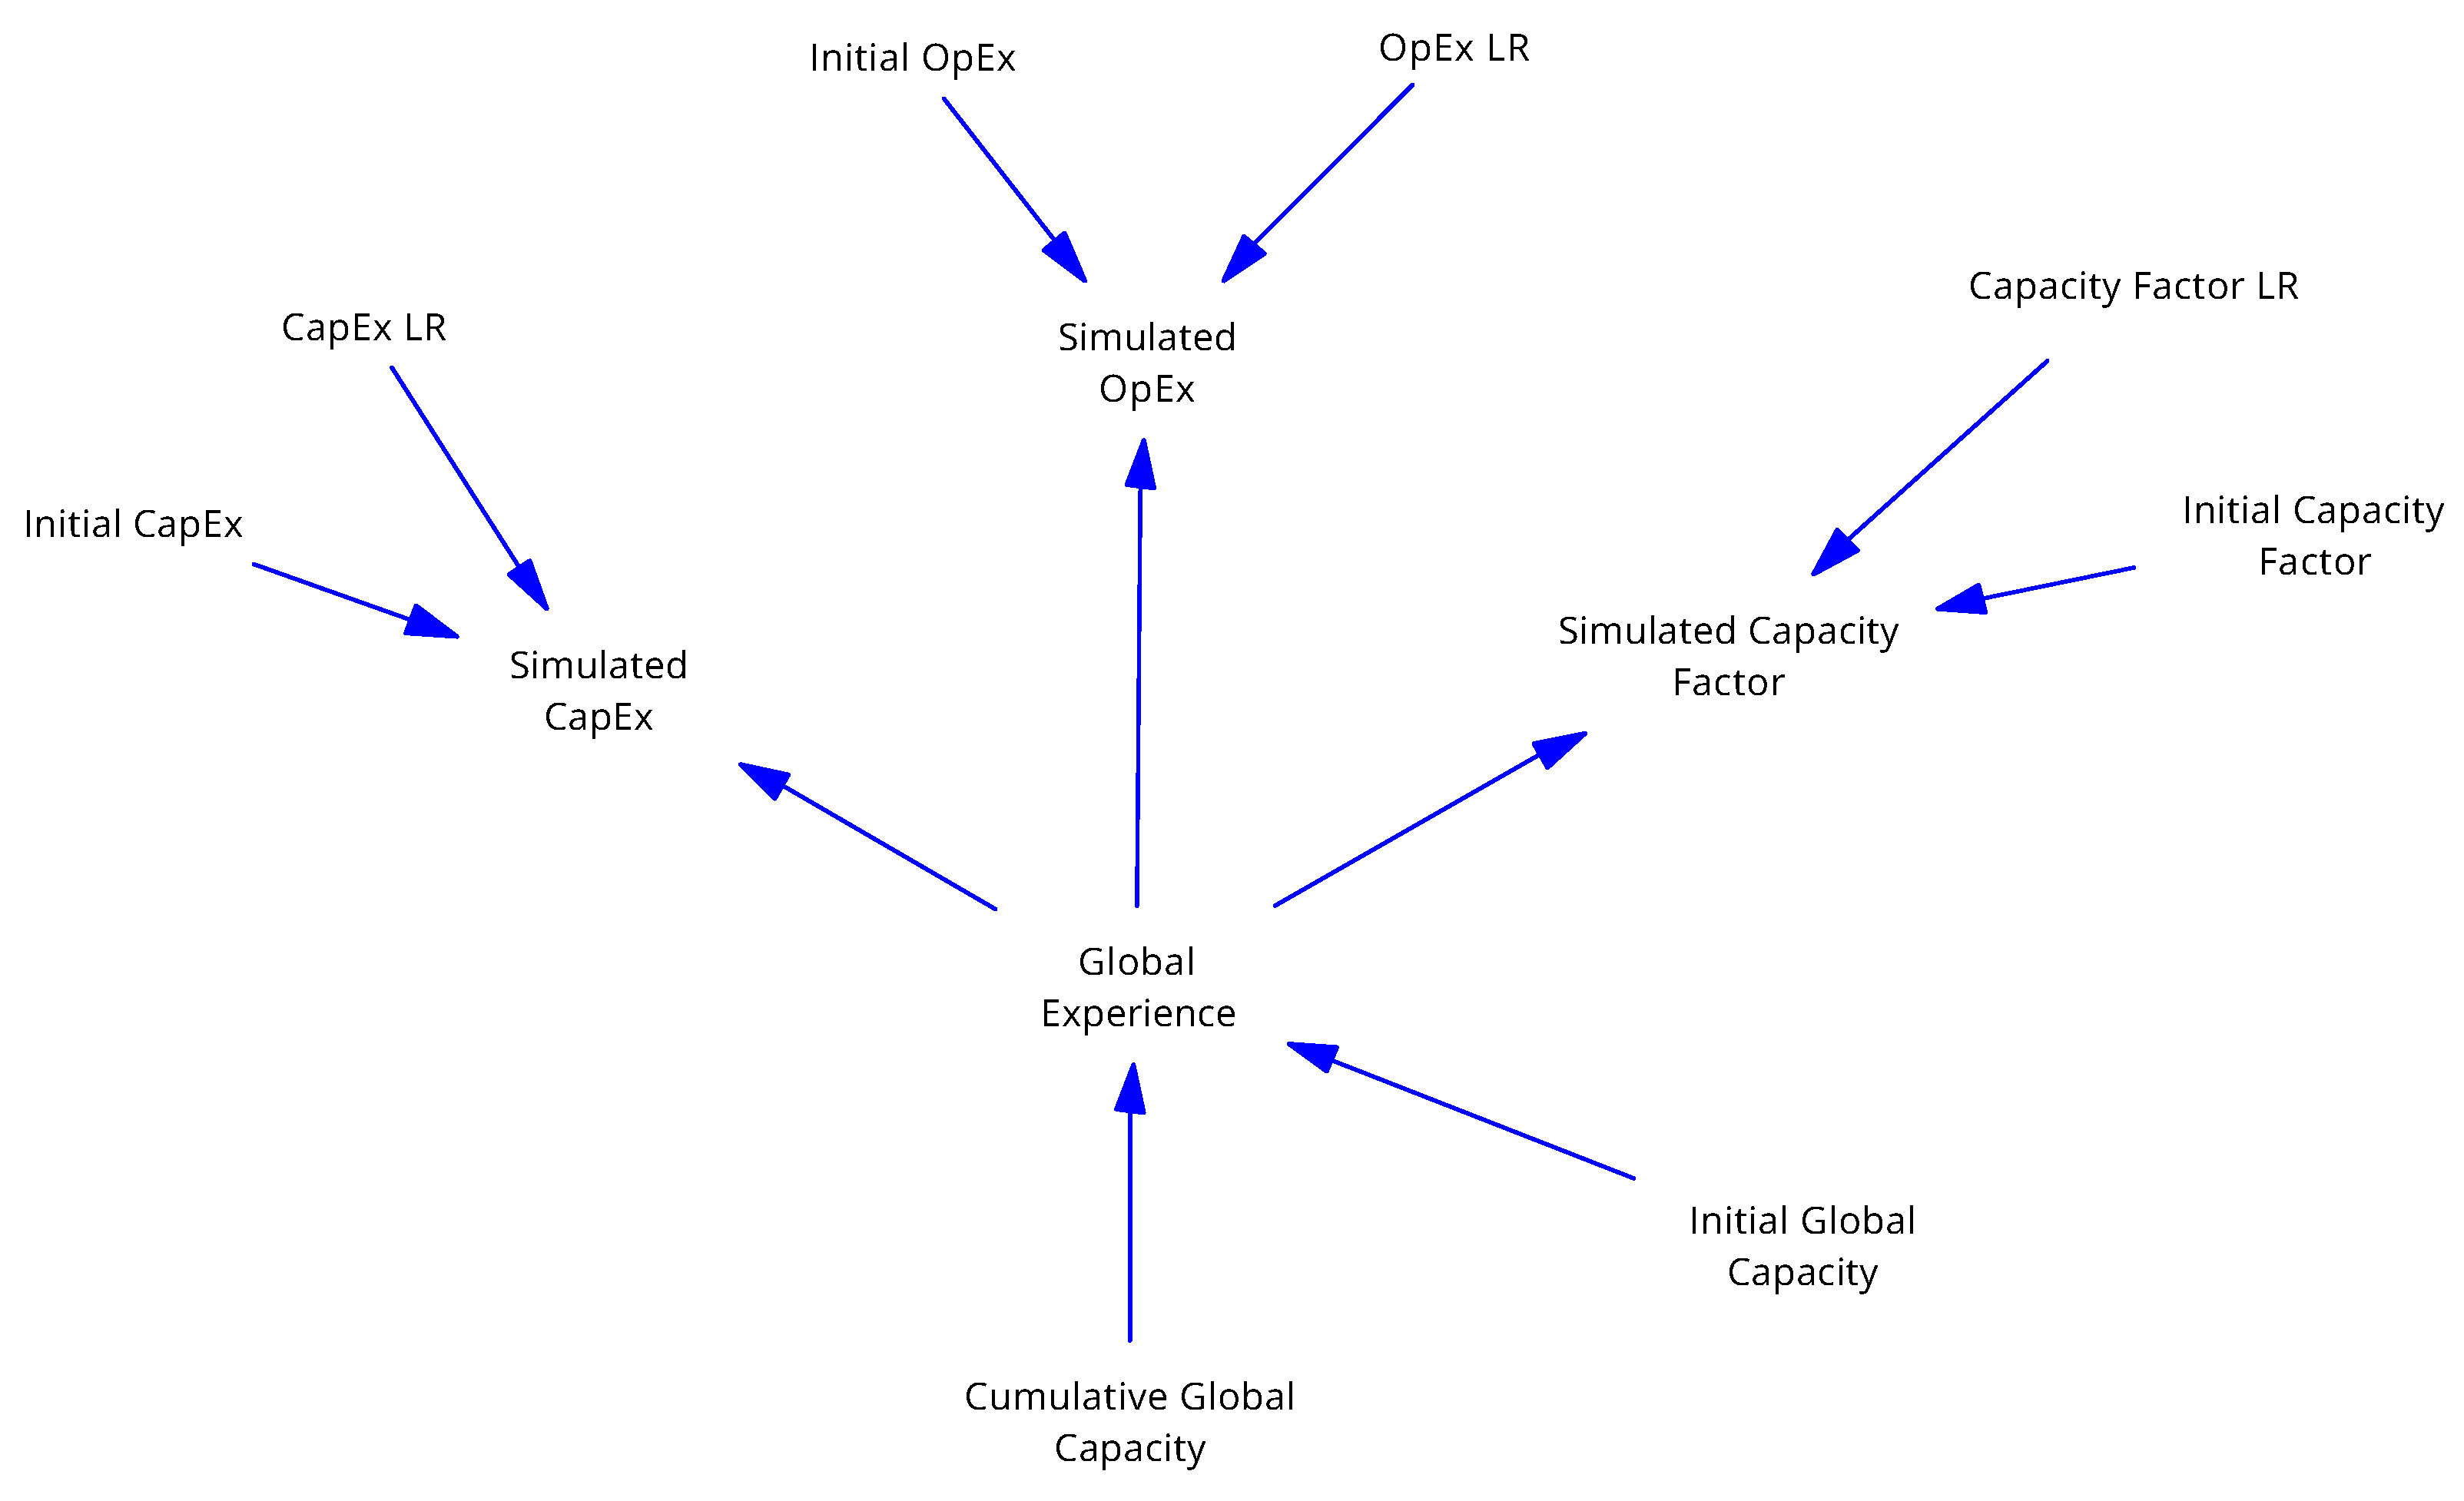
  • Technological learning models improvements in performance and decline in cost as a function of cumulative installations;
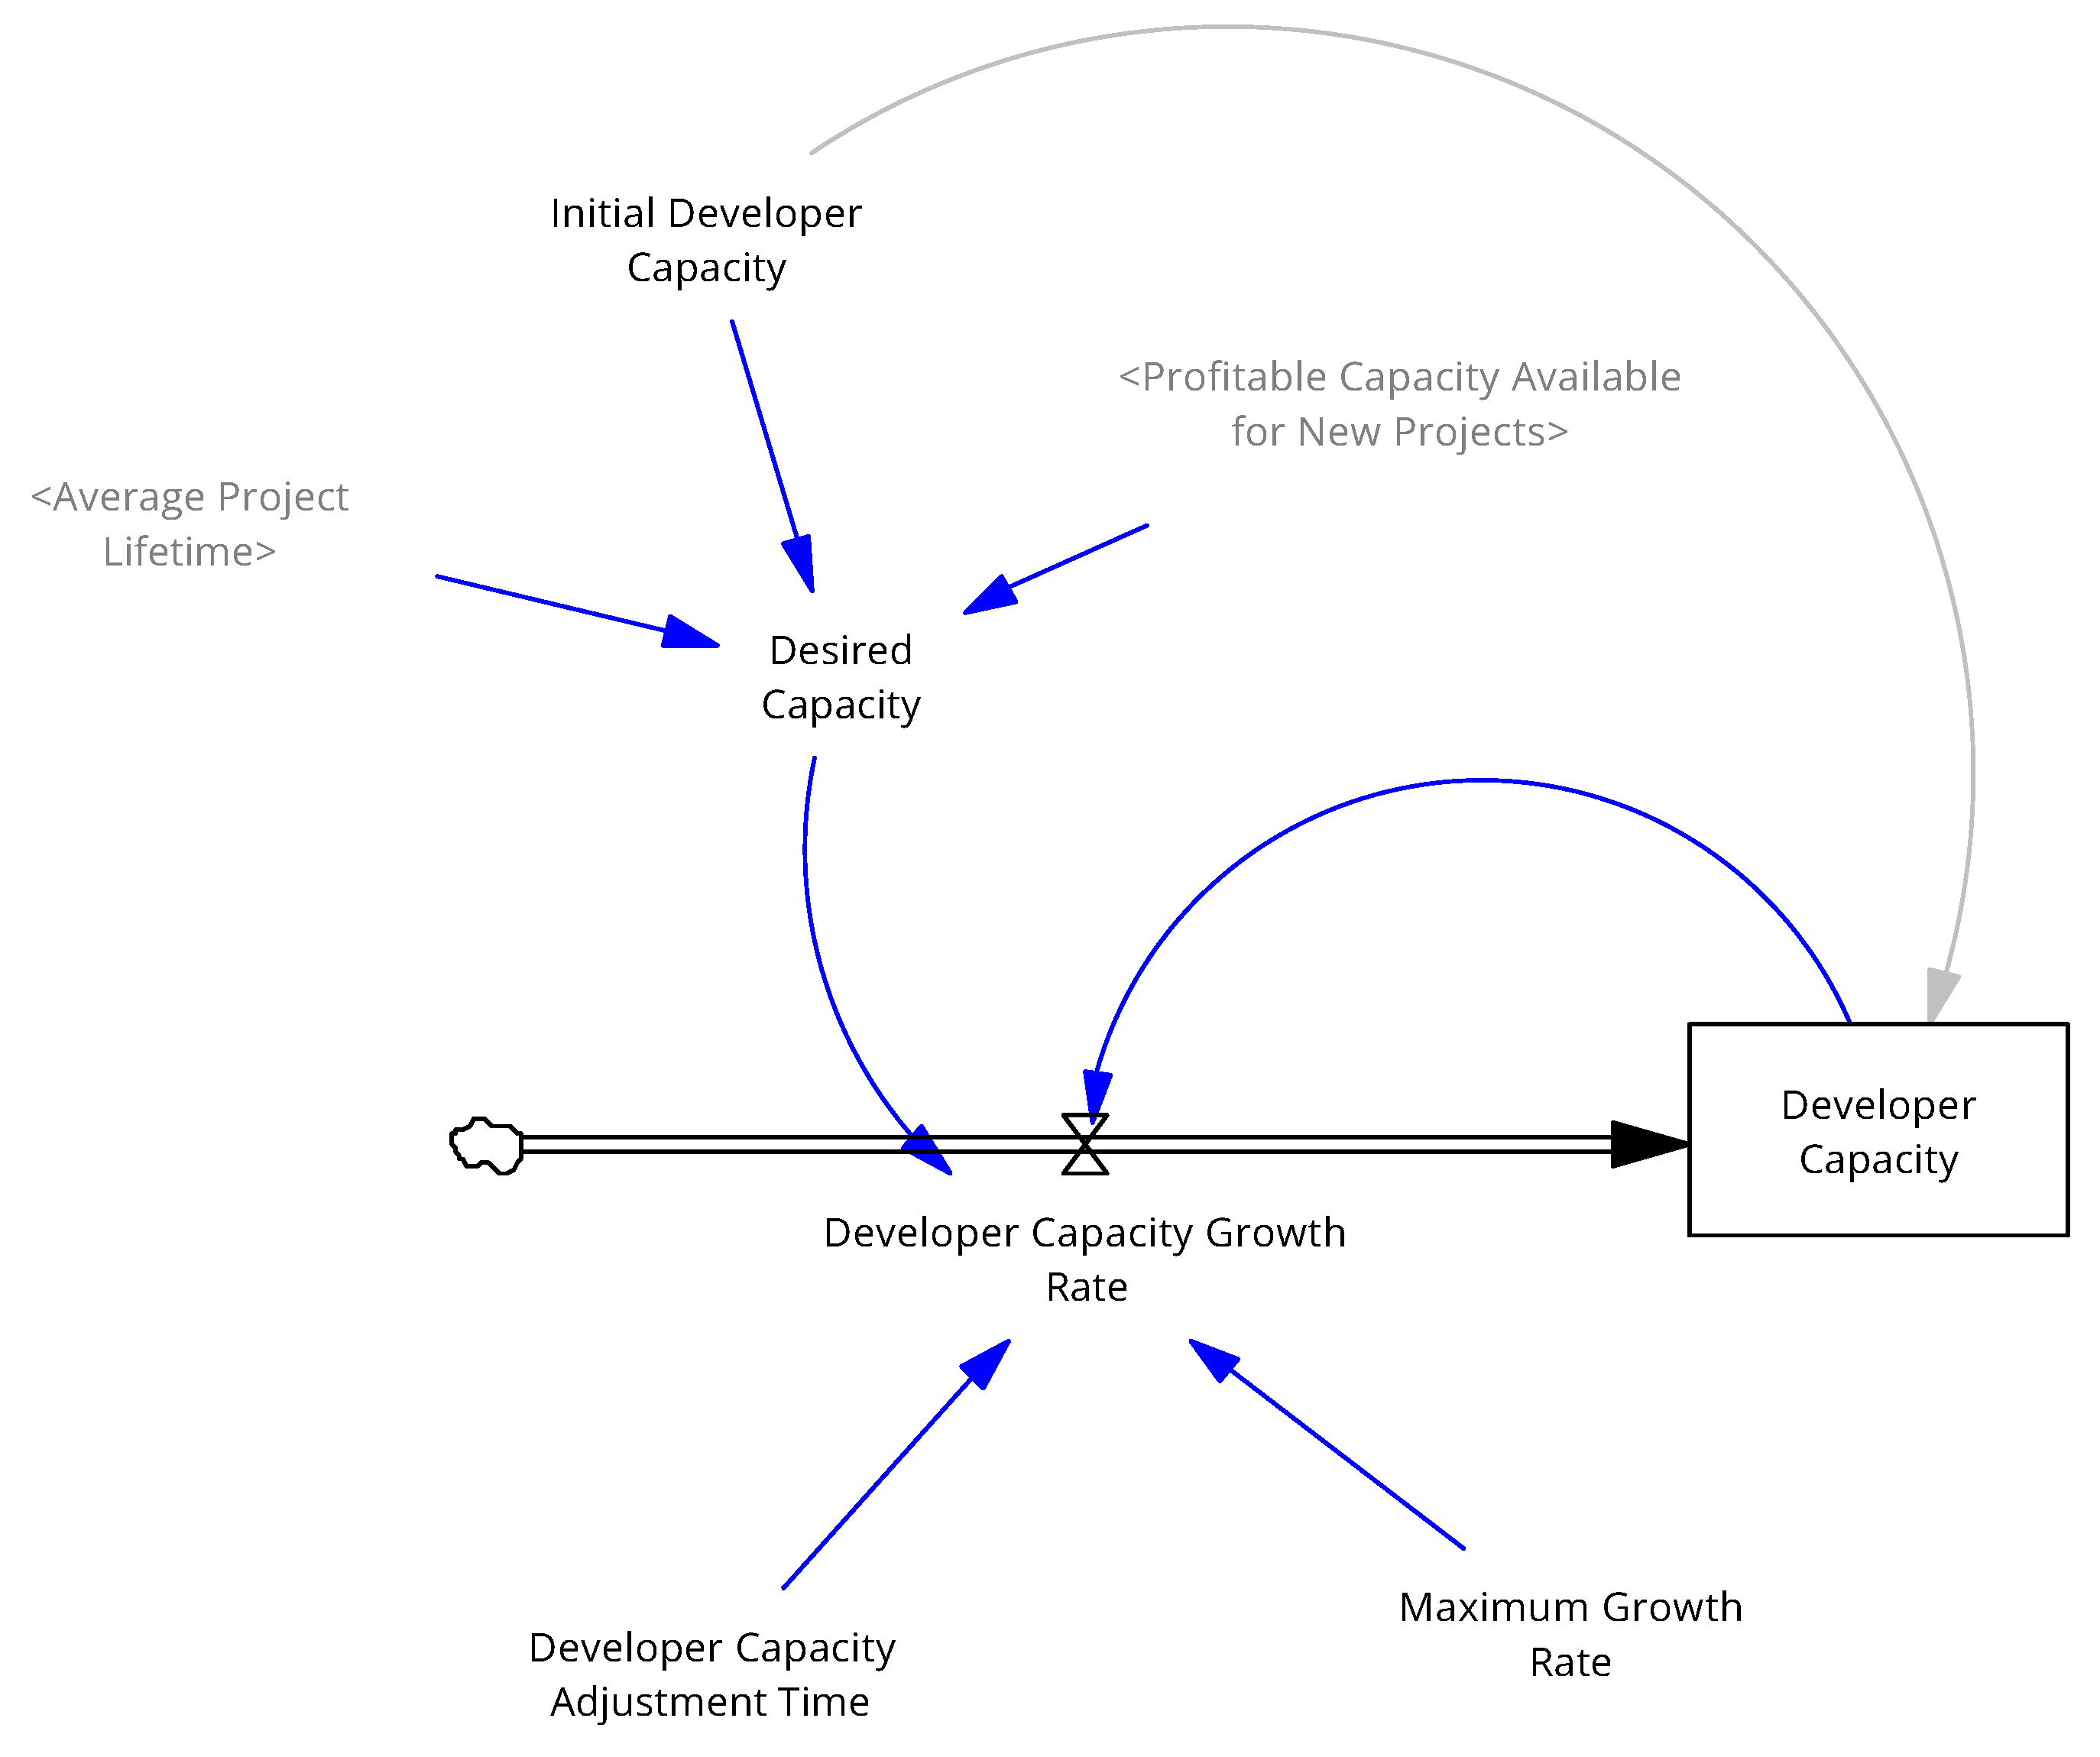
  • Developer capacity growth describes factors that affect the industry’s capability to scale and install the growing number of projects;
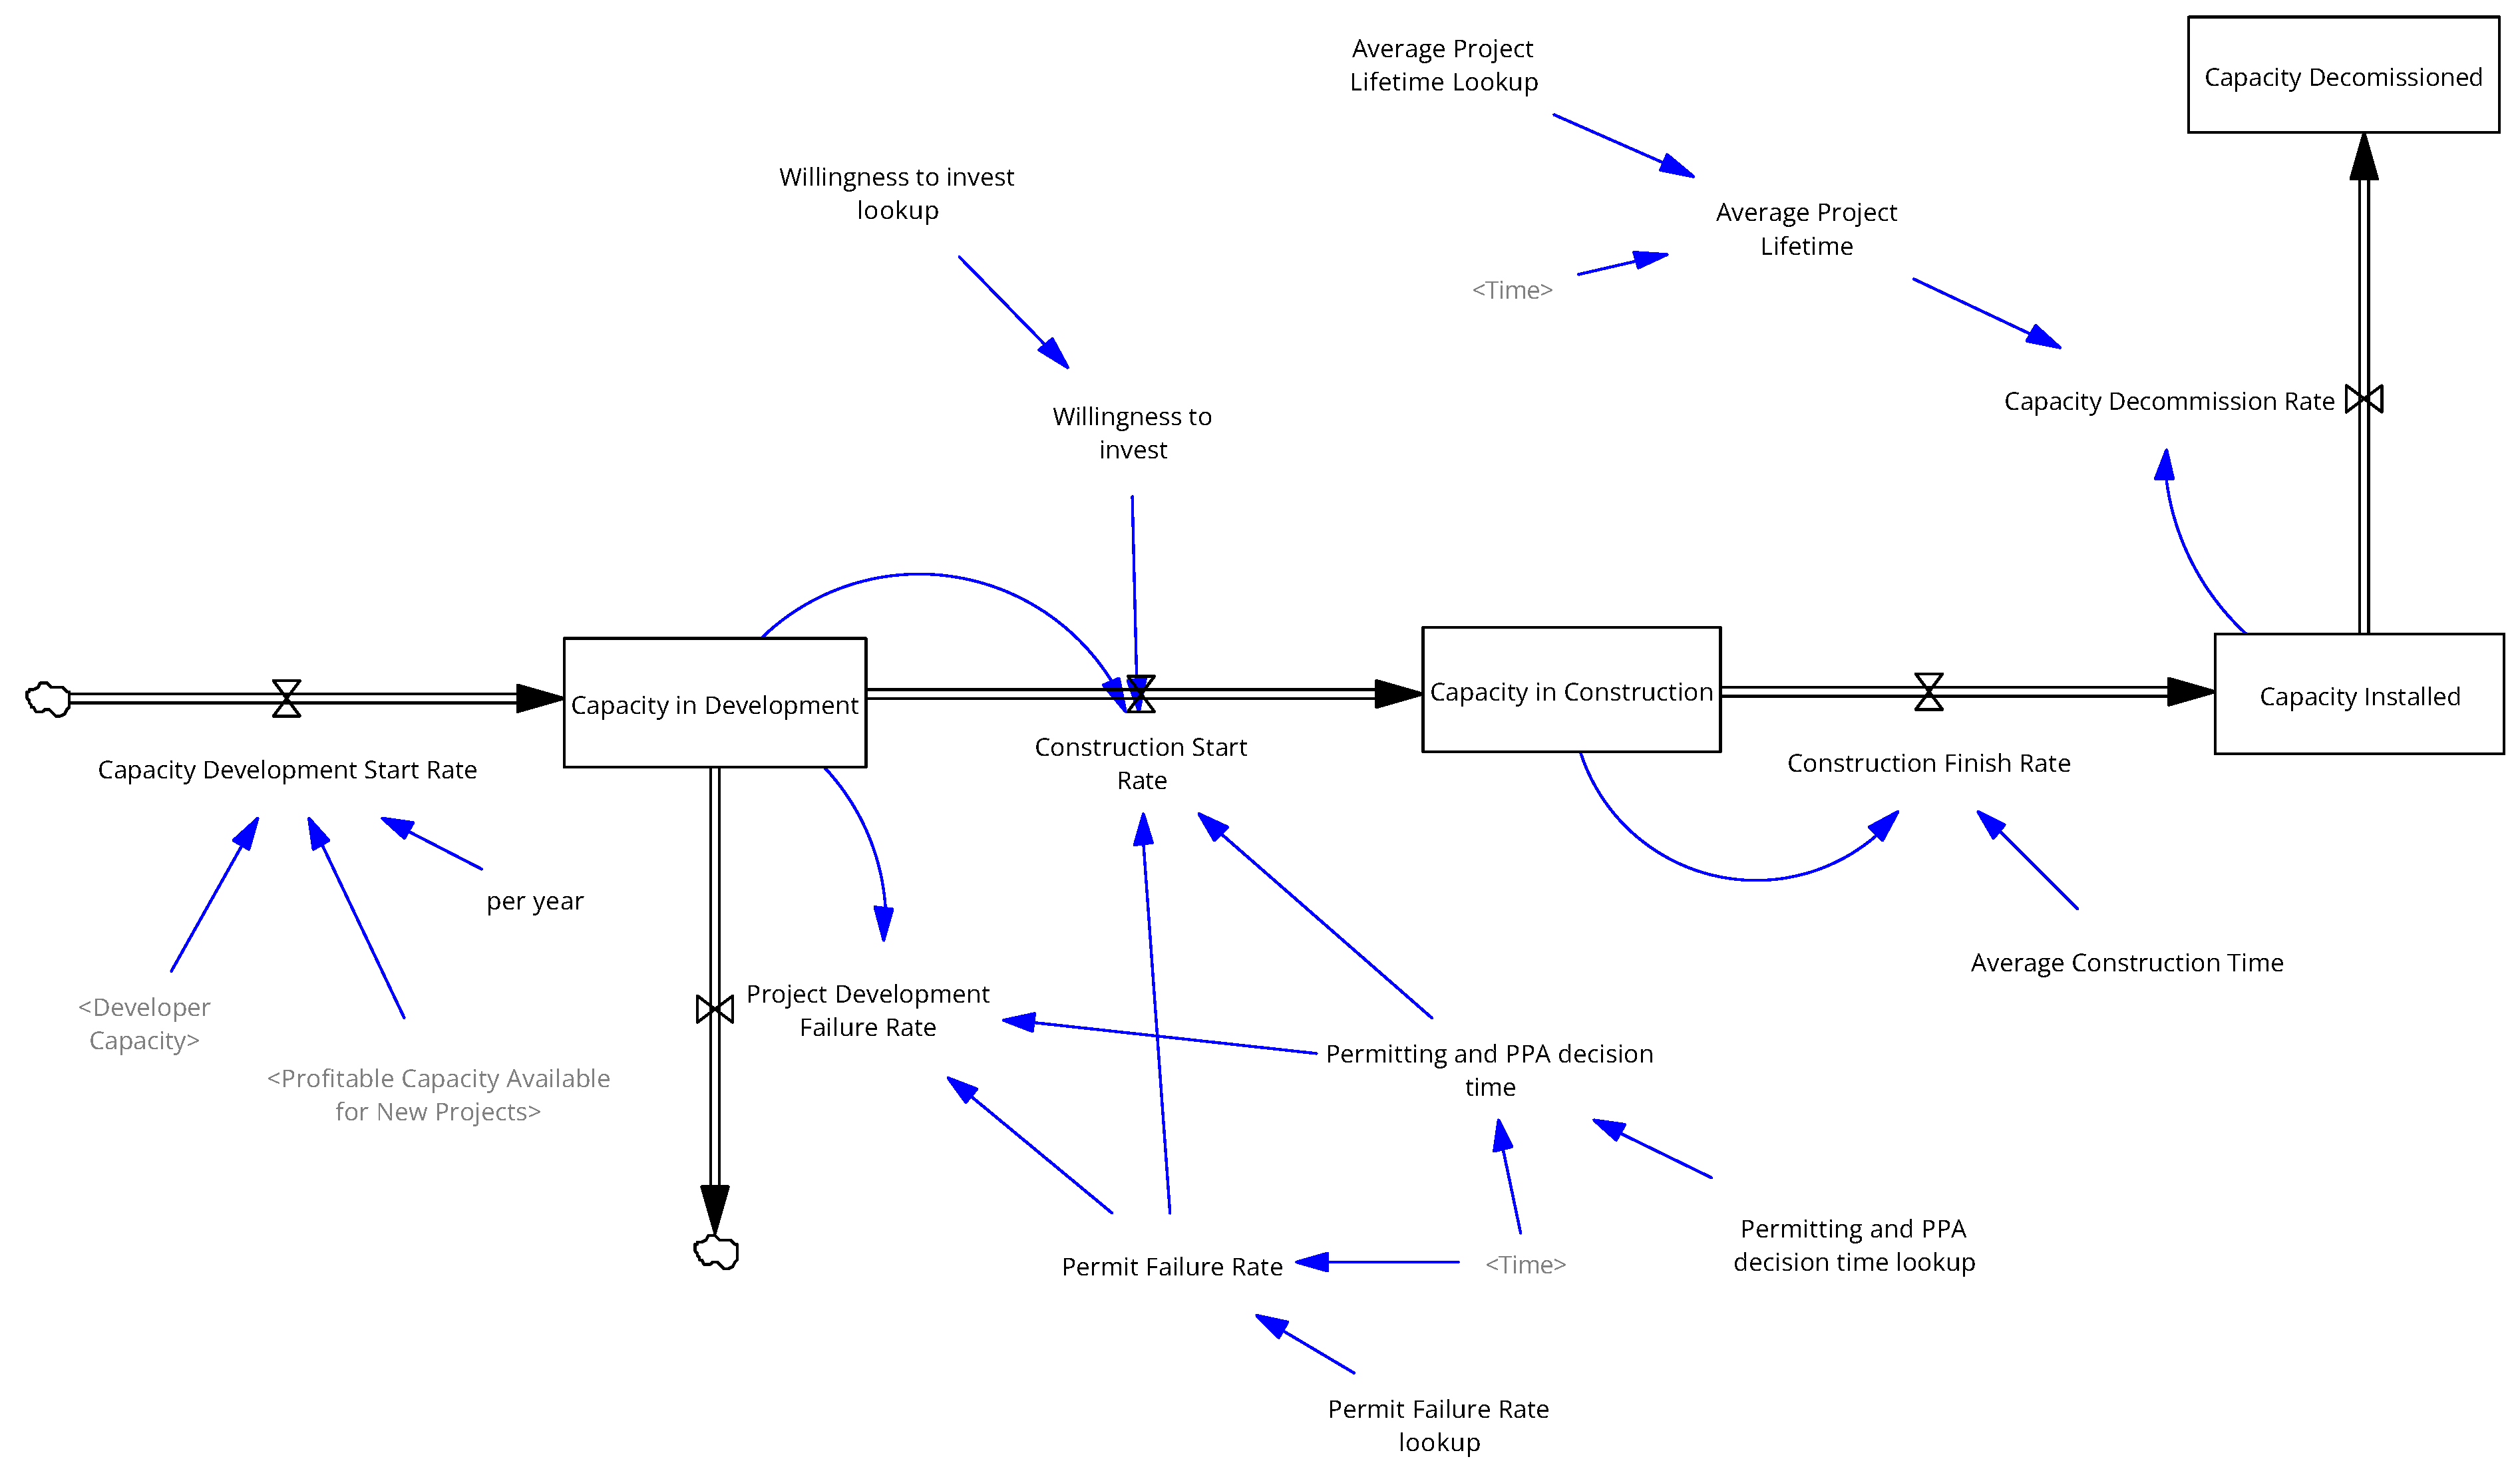
  • Capacity growth models the project’s progress from the initial consideration to completion, including multiple factors that affect the process.
In this section, we describe each of the submodel structures, variables, and formulas. The model is built using Vensim Professional, version 10.2.2 [56], from Ventana Systems, Inc. It allows users to create graphical models with feedback loops, stocks and flows, and causal links, facilitating the exploration of how different variables in a system interact with each other. This software is often utilized in fields such as business, environmental science, public policy, and engineering for tasks like policy analysis, strategic planning, and resource management and has been used to model the dynamics of energy systems [59,65,77,107].
The diagrams in Figure 6, Figure 7, Figure 8, Figure 9 and Figure 10 come directly from the Vensim model. The submodels and model variables (shown in italicized text) are described in the following subsections. The data sources for the model variables are shown in Table 1. Model inputs shown as <Variable> are modeled in submodel(s) other than the one depicted in the figure.

5.2.1. Profitable Capacity

For wind energy, the resource is the land available for installing wind projects. The most attractive sites are those with better wind quality (i.e., higher wind speeds and more frequent wind days). Developers first consider sites with the highest wind potential and sites closest to electrical grid infrastructure, as these sites are the most profitable. With increased installations, less profitable sites are considered next until no more profitable available land remains. The model calculates project expenses, expressed as levelized cost of energy (LCOE), and project revenue. The projects where the expected revenue exceeds estimated costs are considered profitable, and developers will be willing to proceed with installations. The submodel is presented in Figure 7.
The expected revenue is calculated as the sum of the electricity price and production tax credit. The electricity price is a value obtained from the historical and projected electricity price data for the corresponding modeled year.
The choice of incentive enables selecting the federal incentive, which is none, PTC, or investment tax credit (ITC). For the wind energy model, the PTC incentive is used, as this is the historically used incentive for wind projects in lieu of ITCs.
The ROI-adjusted revenue is the expected revenue considering a minimum return on investment (ROI) desired by the investors.
The wind supply curve represents the wind resource potential. Understanding the resource potential is fundamental to energy system modeling where cumulative deployment is resource-limited. We model the resource potential using the methodology developed by the National Renewable Energy Laboratory (NREL) [108]. This study evaluated the technical potential of onshore wind in terms of capacity, cost, performance characteristics, and grid interconnection costs. The combined metric, the LCOE, represents the overall project costs, including levelized transmission and plant costs.
The dataset for the wind supply curve for various siting regimes is available on the NREL Wind Supply Curve website [83], and data for the limited access siting regime was used in our model. The NREL wind supply curve data were translated into a supply curve with available wind capacity (measured in MW) for various levelized cost of energy (LCOE) (measured in USD/kWh) ranges. The land is considered profitable if the expected revenue is higher than the LCOE calculated for that land.
The LCOE is calculated using the same approach used in the NREL Simple Levelized Cost of Energy Calculator [109], using Equation (1):
LCOE = Overnight   Capital   Cost CRF + Fixed   O & M   Cost 8760 Capacity   Factor + Fuel   Cost Heat   Rate + Variable   O & M   Cost
where the overnight capital cost, also referred to as the normalized upfront investment, is measured in dollars per installed kilowatt (USD/kW); capital recovery factor (CRF) is the ratio of a constant annuity to the present value of receiving that annuity for a given length of time (dimensionless); the fixed operation and maintenance (O&M) cost is measured in dollars per kilowatt-year (USD/kW-year); the variable O&M costs are expressed in dollars per kilowatt-hour (USD/kWh); the capacity factor is a fraction between 0 and 1, representing the actual power being generated compared to the nominal installed full capacity (dimensionless); 8760 is the number of hours in a year; the fuel cost is expressed in dollars per million British thermal units (USD/MMBtu); and the heat rate is measured in British thermal units per kilowatt-hour (Btu/kWh) (the fuel cost is optional since some generating technologies like solar and wind do not have fuel costs).
The fixed and variable O&M costs are usually reported as all-in O&M costs, where variable costs reported in USD/kWh are converted to fixed costs based on capacity factors [87]. The fuel cost does not apply to wind energy technologies and is removed. These manipulations result in a shorter Equation (2), which is used by the model to calculate the LCOE:
LCOE = Overnight Capital Cost CRF +   O & M   Cost 8760 Capacity Factor
The CRF is calculated based on the interest rate using Equation (3):
CRF = i ( 1 + i ) n ( 1 + i ) n 1
The profitable capacity variable looks up the available capacity from the wind resource data wind supply curve when the ROI-adjusted revenue is greater than the LCOE; otherwise, the project is considered not profitable and the profitable capacity is set to zero.
Lastly, the profitable capacity available for new projects is calculated using Equation (4), accounting for the already installed capacity and decommissioned capacity becoming available for new installations:
Profitable Capacity Available for New Projects = Profitable Capacity Capacity Installed + Capacity Decommissioned

5.2.2. Technological Learning

As discussed in Section 4, technological learning and innovation represent a key reinforcing feedback loop affecting energy technology uptake by the market. This dynamic is modeled as a learning-by-doing loop, as shown in Figure 6. Gained experience results in cost reductions, including upfront investments for purchasing and installing equipment, referred to as capital expenses or CapEx, as well as O&M expenses, referred to as OpEx. In addition, technological improvements and innovations lead to improved technology performance through improved reliability, improved availability, and increased energy output. For wind energy, increased turbine size, rotor diameter, and hub height result in a significant increase in energy outputs from a single unit. These performance improvements can be cumulatively described via a capacity factor, which is the ratio of the actual energy generated to the installed capacity. The technological learning submodel is presented in Figure 8.
The capacity factor is a complex, aggregated parameter influenced by multiple contributing factors. The most significant contributor is the wind resource quality at the site selected for the wind project. Technological advancements, particularly increased hub height and larger rotor diameter, also substantially impact the power output from wind turbines [1,59,110] and, consequently, the capacity factor. With the proliferation of wind installations, technological innovations and learning have led to increased capacity factors. However, the quality of wind resources is gradually declining, as the best sites were utilized first, leaving sites with lower wind quality for subsequent projects. This creates a dichotomy—while technological improvements drive an increase in the capacity factor, diminishing resource quality exerts a negative influence. Despite this, the overall trend in the capacity factor is upward, as reported in the Land-Based Wind Market Report [1], indicating that technological advancements are outpacing the decline in wind resource quality.
A detailed analysis of the dynamics affecting the capacity factor could involve modeling individual contributors, such as rotor diameter, hub height, and wind resource quality. However, this study opts to use an aggregate capacity factor as a variable. This approach aligns with the research focus on higher-level factors, such as the capacity factor itself, which influence technology adoption, rather than on the specifics of technological improvements.
The model employs a standard learning curve formulation [70] to describe the reduction in CapEx and OpEx, as well as improvements in the capacity factor. The learning rate is the rate at which the system improves (in the case of capacity factors) or reduces costs (in the case of CapEx and OpEx) as a function of cumulative experience. Historical data are used to estimate learning rates through Excel’s Goal Seek function to minimize the sum of least-squared errors. The model uses the ratio of total global capacity installation experience to the capacity installed globally in 1998. Since learning is a global process, focusing solely on the U.S. experience would underestimate technology scaling and cost reductions. Therefore, global cumulative capacity is used as an exogenous input to the model.

5.2.3. Developer Capacity Growth

As discussed in Section 4, the deployment and diffusion of novel energy systems could be limited by the capabilities of developers to install energy projects. This factor is modeled as a developer capacity loop, as shown in Figure 6. The developer capacity growth submodel is presented in Figure 9.
The developer capacity is modeled as a stock variable, where capacity growth is increased at a rate equal to the developer capacity growth rate. It is assumed in this model that the gained developer capacity does not reduce, so there is no outflow from the stock. The developer capacity growth rate is calculated using Equation (5):
Developer Capacity Growth Rate = min [ # 1 , # 2 ] # 1 = Desired Capacity Developer Capacity Developer Capacity Adjustment Time # 2 = Developer Capacity ( 1 + Maximum Growth Rate )
where the desired capacity is calculated using Equation (6):
Desired Capacity = max [ # 3 , # 4 ] # 3 = Initial Developer Capacity # 4 = Profitable Capacity Available for New Projects Average Project Lifetime

5.2.4. Capacity Growth

As discussed in Section 4 and shown in Figure 6, capacity growth is the key dynamic of technology diffusion and adoption.
Energy project developers are the main drivers of the diffusion of energy technology since they, with the support of investors, decide how many projects are feasible to build given the market conditions and developers’ resources. Energy-generating plant development follows a standard process, including site and plant development, construction, and commissioning [59]. After the plant lifetime ends, the capacity is either decommissioned or refurbished and placed back into operation (which is not modeled). The capacity growth submodel is presented in Figure 10.
The capacity development start rate is the smaller value of either the profitable capacity available for new projects or the developer capacity. The capacity in development is a stock variable representing how many projects are in development. The development stage includes project site selection, power plant design, the permitting process, and securing a power purchase agreement (PPA). The capacity in development is calculated as the integral between the inflow rate (i.e., capacity development start rate) and the outflow rates (i.e., construction start rate and project development failure rate).
The project development failure rate is calculated using Equation (7):
Project Development Failure Rate = Capacity in Development Permit Failure Rate Permitting and PPA Decision Time
The permit failure rate is 75% for wind projects (i.e., every three out of four wind projects fail) [59]. Projects can fail because of environmental or other permit issues, public pushback from communities unwilling to have wind projects installed (i.e., a not-in-my-backyard situation) or because they fail to secure a PPA. It is assumed that failure rates for very early wind projects had a much lower failure rate due to the urgency of wind installations driven by the oil crisis in the 1980s and an overall easier permitting process since environmental concerns and public pushback were not prominent issues at the time; however, failure rates rose to 75% by 2000. It is also assumed that this rate will likely remain the same moving forward.
The permitting and PPA decision time is estimated to be about 4.5 years today (in 2024) according to the American Clean Power fact sheet [88], an increase from 4 years in the 2000s [59]. It is expected that the permitting time will gradually increase to 5 years by 2050 and is modeled accordingly.
The construction start rate is calculated by taking the portion of not failed projects and adjusting it by the willingness to invest factor. Factors such as willingness to invest, perceived value, satisfaction, or attractiveness are so-called soft variables, and they are the most complicated to model since they are typically an aggregate of multiple contributing factors and data are either unavailable or extremely sparse [111,112,113]. However, despite the difficulties, soft variables should be included in the model if they are important for the dynamics of the system. As Sterman pointed out, “data are not only numerical data, that ‘soft’ (unmeasured) variables should be included in our models if they are important to the purpose” [113].
Willingness to invest is an important parameter in the diffusion and market uptake of a novel energy system. A similar parameter, expressed as the willingness of investors, investors’ investment strategies, or relative attractiveness investment capacity, has been included in multiple studies of energy system dynamics [29,77,114].
The adoption of wind energy in the United States has been significantly impacted by government support policies, namely PTC incentives. Dykes and Sterman [30] pointed out that inconsistent policies have resulted in large volatilities, so-called boom-and-bust cycles. More recently, Frazier et al. explored the impact of PTCs and ITCs on wind and solar deployment [10]. The study found that policy uncertainty created a volatile market characterized by boom-and-bust cycles in wind deployment. Several independent organizations and researchers have pointed out the significance of federal incentives to the success of U.S. wind energy deployment [4,115,116,117]. Figure 11 shows a timeline correlation between PTCs and incremental wind capacity additions.
Every time the PTC expired, industry dramatically reduced wind project development, choosing to wait until the credit was renewed. The tax credit incentives created a unique investment opportunity for companies with large tax obligations, allowing a high ROI due to tax credits. The investors had much less interest in investing in energy projects when the incentives were under threat of being removed.
Besides federal incentives, several states have implemented their own initiatives to boost renewable energy production. These initiatives, known as renewable portfolio standards (RPSs), mandate that retail electricity providers source a certain percentage or quantity of their electricity from eligible renewable sources. Although RPS programs aim to increase the proportion of renewable energy, there is still a lack of consistent empirical evidence regarding their effectiveness and whether they actually drive investments in renewable capacity [118].
Research by Deschenes et al. [118] revealed that states with RPSs had higher average levels of wind and solar capacity installed by 1990 compared to those without RPSs, but these differences were not statistically significant. The study also indicated that while RPS policies increased investment in wind generation capacity within these states, they had no effect on investments in solar generation. In summary, although RPS programs influence the deployment of renewable energy sources, their impact is much smaller compared to federal incentives. As such, the model does not explicitly include RPSs as a variable.
In our study, we model willingness to invest as a coefficient based on the availability of PTCs, both historical and projected.
The capacity in construction represents the amount of capacity in the construction stage, modeled as a stock variable and calculated as an integral between the inflow and outflow rates—the construction start rate and construction finish rate, respectively.
The construction finish rate is calculated by dividing the capacity in construction by the average construction time, which is set at 1 year based on recent industry experience, with construction taking between 6 and 18 months on average.
The installed capacity represents the amount of commissioned capacity after the plant is constructed and connected to the grid. It is modeled as a stock variable and calculated as an integral between the construction finish rate and the capacity decommission rate, with the initial installed capacity being the total installed capacity in the United States in 1998 [1].
The capacity decommission rate is calculated by dividing the installed capacity by the average project lifetime. The wind project lifetime has increased from 20 years in the early 2000s to 25 years in the mid-2010s and to 30 years more recently [89], which is how it is modeled in our study.
Lastly, the capacity decommissioned, which is also a stock variable, is calculated as an integral of the capacity decommission rate.

5.3. Results of Model-Based Quantitative Assessment

The outcome of this research is a model that simulates the trajectory of the wind energy system’s capacity growth based on multiple factors that affect system deployment. The model also informs the user about potential scenarios of the system’s behavior given the potential variations in the variables, as well as the sensitivity of a given parameter to the input variables.
To demonstrate the validity of the model, the simulated installed capacity based on the SD model from the previous section was compared to the historical installed wind capacity in the United States [1] and the projected wind capacity [6]. Figure 12 shows this comparison. The SD model-simulated installed capacity shows a reasonable fit with both the historical data (1998–2023) and projected capacity (2024–2050). Focusing on the initial historical portion, the final installed capacity values are nearly the same at 160 GW, with a GW/yr rate of about 9.1. However, the initial capacity growth from 2000 to 2006 was slower in the SD model. For future projections, a similar increasing trend was observed between [6] and the SD model’s results, including capturing a key inflection point around 2034. However, the forecasted results from the SD model follow two fairly linear segments, which start to show more significant deviations toward the end of the explored timeline. These differences warrant further exploration to support specific claims regarding the level of fidelity of the model beyond capturing important features. Still, the overall general agreement in shape and magnitude demonstrates that the SD model captures the important features driving the dynamics of this energy technology’s development.

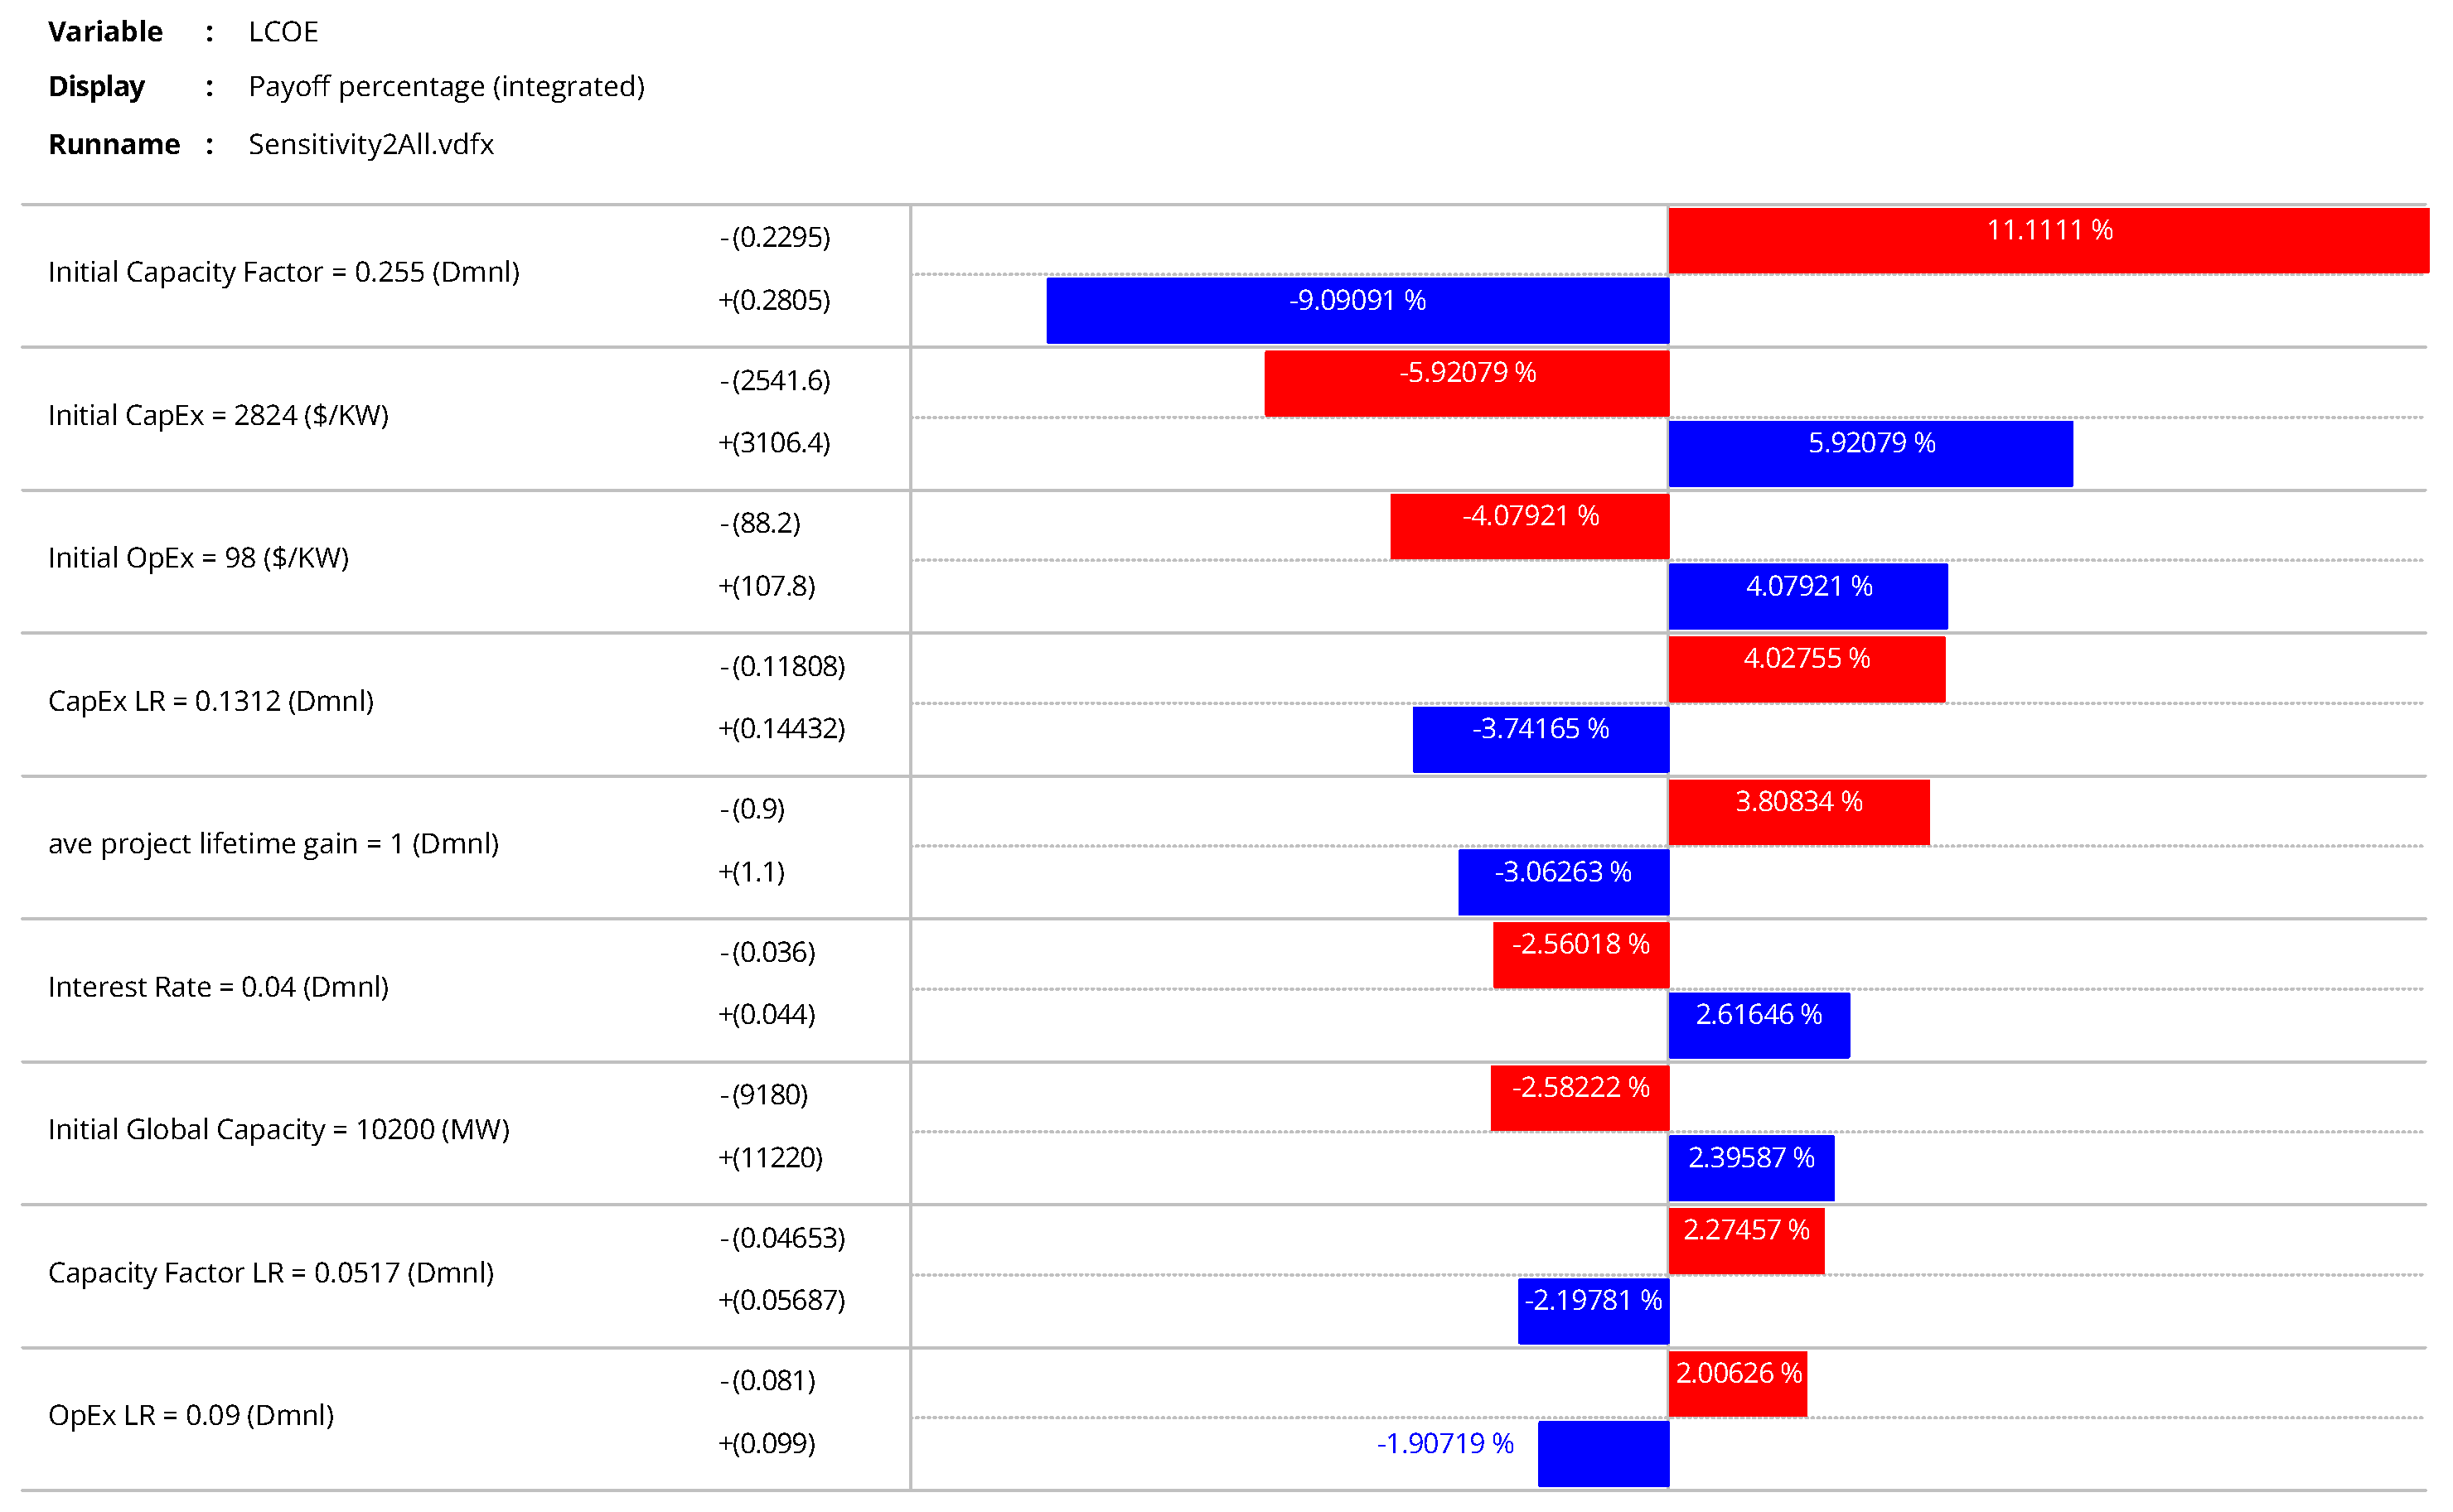
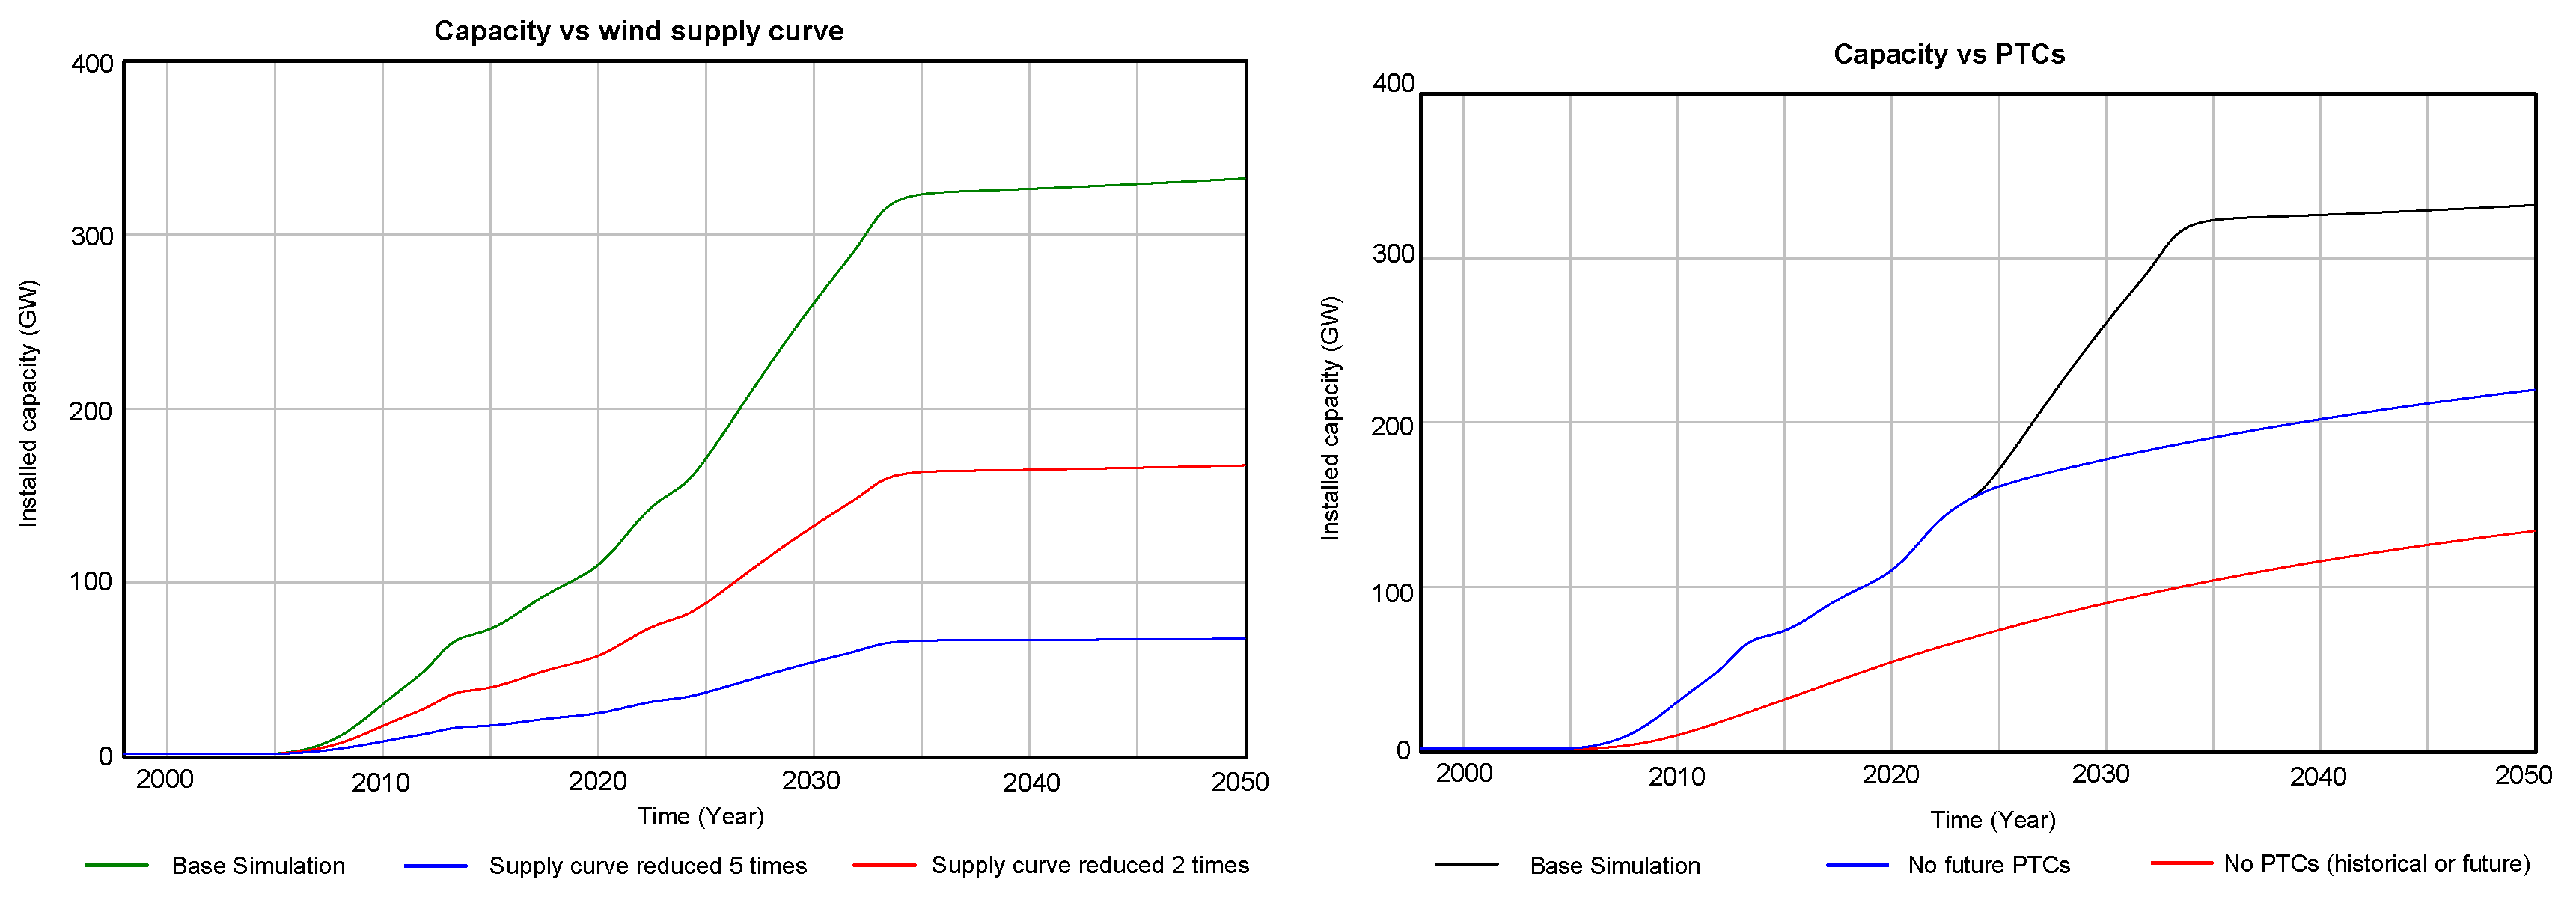
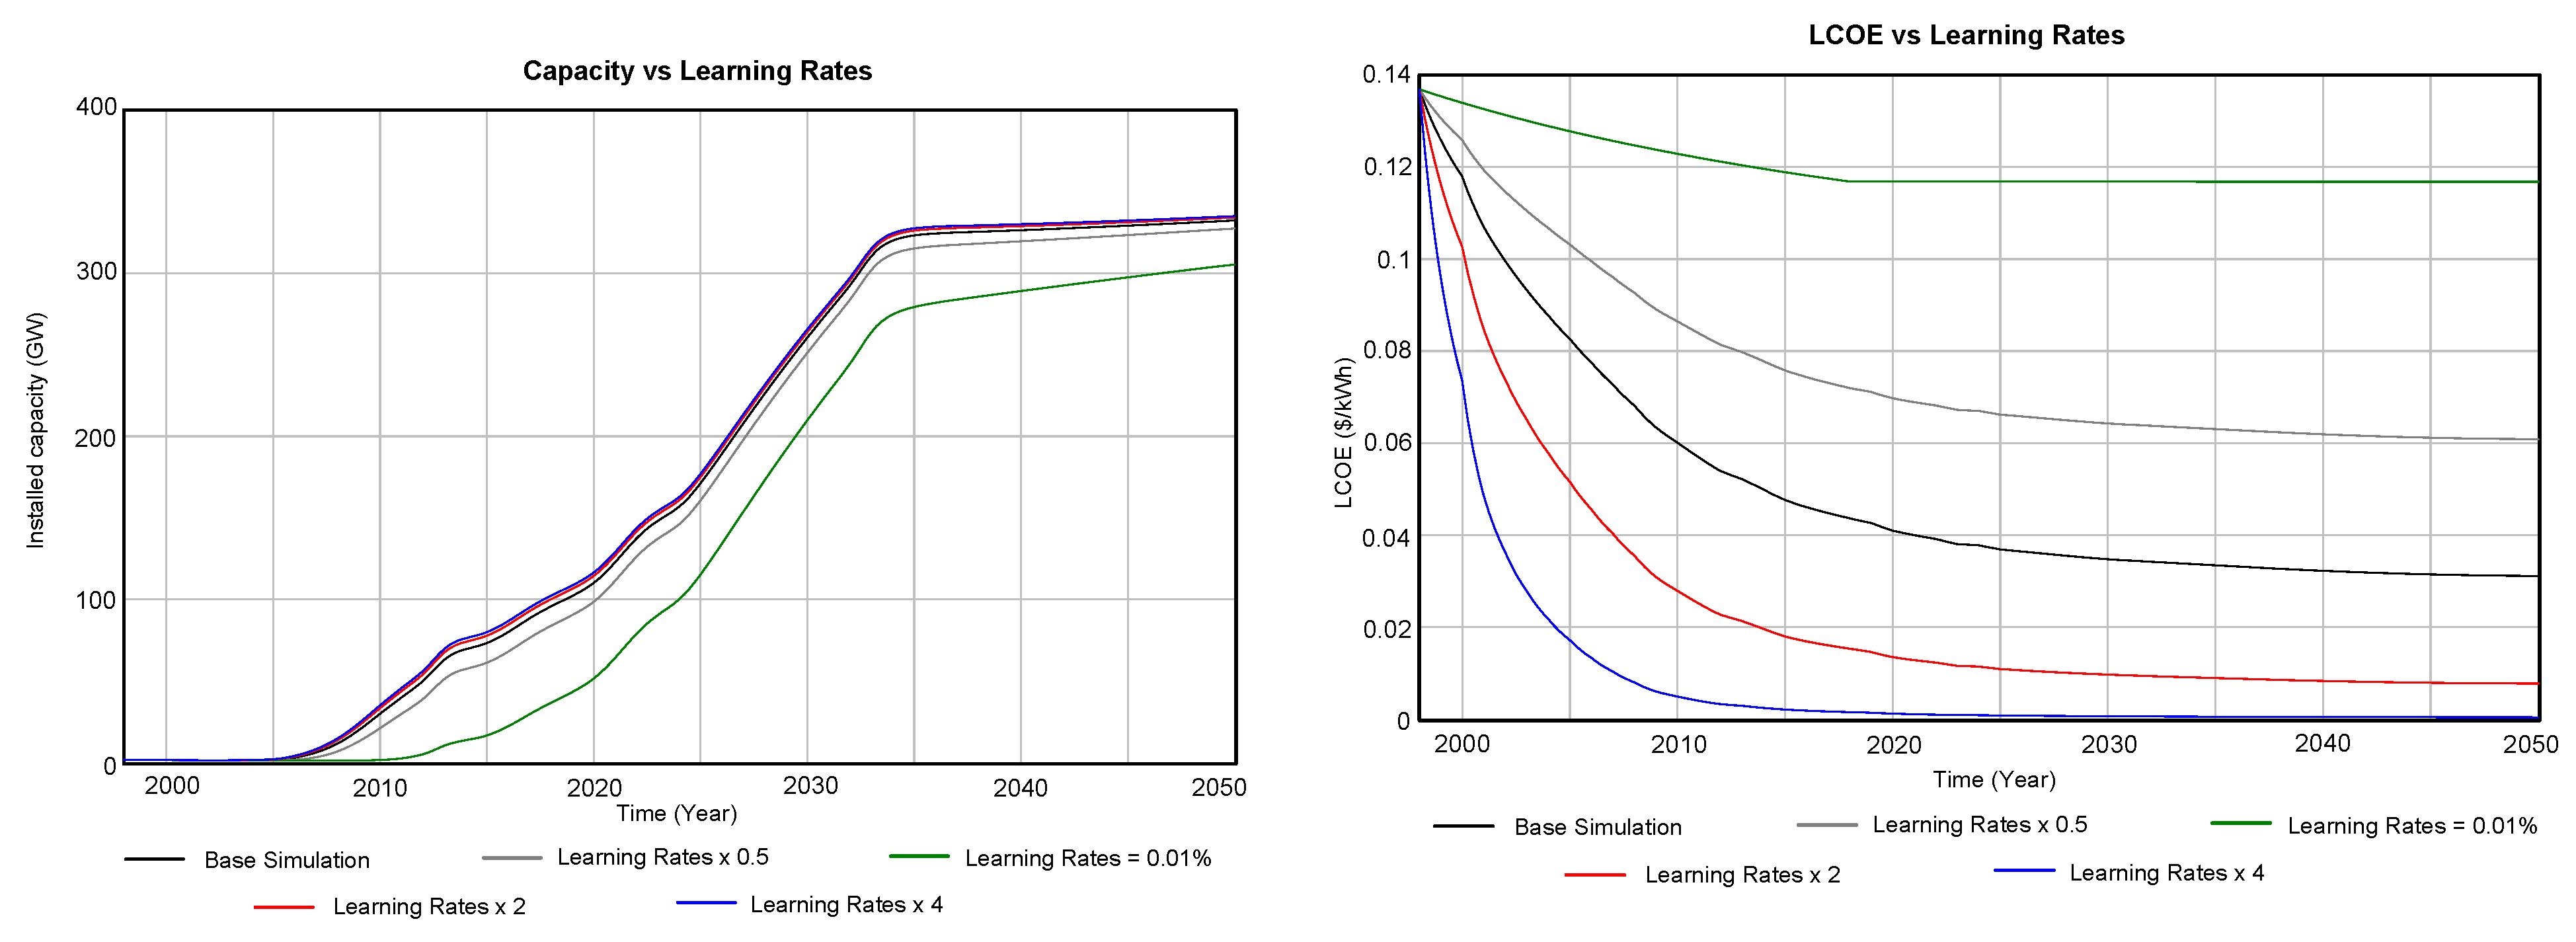
5.3.1. Sensitivity Studies

Additional insights about the model and the represented energy system were obtained through sensitivity studies. Figure 13 presents a tornado chart showing the sensitivity of capacity growth to various elements. It shows that capacity growth is most sensitive to the availability of resources, represented as a supply curve. The second most influential parameter is willingness to invest. These insights are not surprising since the total capacity of the potential wind energy is directly affected by the available and profitable land to build wind installations. As discussed in Section 4.2, investors’ willingness to fund wind energy projects is one of the key factors affecting the overall deployment of wind installations and total capacity growth. The next most influential factors are economic variables, namely the initial capacity factor, electricity price, initial CapEx, and average project lifetime. This is also an expected finding since the feasibility of wind installation deployment is determined using these economic parameters. The model is less sensitive to other variables representing the ability of the developers to grow their capacity and to factors affecting learning rates.
Similarly, Figure 14 illustrates the sensitivity of the LCOE to the various model inputs. In this case, the focus is on variables affecting the cost of energy rather than capacity growth potential. The results confirm the expectation: the largest influencing factor is the capacity factor, since even small changes dramatically affect the resulting cost of energy. The rest of the economic variables have a smaller but still measurable impact on energy cost.
The outcomes of the sensitivity studies confirm the general dynamics of energy system diffusion presented in Figure 6 by demonstrating the dependencies between variables within and between the loops.

5.3.2. Scenario Analysis

We also further explored the impact of influential parameters, namely resource availability, the presence of PTCs, and technological learning. Figure 15 shows the capacity growth outcomes for reduced resources (left) and the availability of PTCs (right).
The sensitivity studies showed the strong influence of the wind supply curve on capacity growth, which was confirmed by the scenario analysis. Reducing resources by 5× and 2× greatly reduced the modeled installed capacity, as shown in Figure 15. This is consistent with the findings in [108], in which the authors point out that siting restrictions could dramatically reduce the overall wind energy growth. The wind growing capacity modeled up to 2050 has not reached the available resource potential, so increasing the available resources would have little to no impact on the modeled installed capacity.
The scenario simulations of the availability of PTCs confirmed the importance of the incentives: both cases where incentives were not available showed a significantly smaller total installed capacity than the base model.
Figure 16 shows the impact of technological learning on capacity growth (left) and the LCOE (right) based on modeled scenarios with reduced and increased learning. As expected, a reduction in learning, represented by reduced learning rates, slows capacity growth, while an increase in technological learning accelerates technology adoption. Although the impact on capacity growth is not significant, the effect on the LCOE is dramatic.
This observation highlights a model limitation, where willingness to invest is modeled as an exogenous variable primarily dependent on federal incentives. In reality, willingness to invest is a much more complex parameter that dynamically depends on many factors beyond incentives, including the LCOE, available resources, cost and availability of competing technologies, and social factors like public acceptance.
In a comprehensive energy system model that includes all energy generation technologies, consumption, and demands, willingness to invest would be an endogenous variable. However, this study specifically focused on the diffusion dynamics of individual energy technologies, necessitating limited model boundaries and treating willingness to invest as an exogenous variable.
Future work could expand this study to model willingness to invest more accurately. Although data for such a model are limited, surveys and expert solicitation techniques could be employed. More detailed modeling would require broadening the system boundaries to include additional variables, such as the costs of competing technologies and energy demands, which could remain exogenous while willingness to invest becomes an endogenous variable. This approach would provide a better understanding of the effect that willingness to invest has on capacity growth.

6. Discussion

In this research, we hypothesized that the dynamics of novel energy system adoption by the energy market are influenced by multiple factors. We explored these factors by examining the history of electricity generation using land-based wind technologies and developed a system dynamics model to investigate the relationships between wind growth capacity and the elements influencing this growth process. The sensitivity analyses and scenario analyses are presented in Section 5.3.
The significance of this research lies in its contribution to addressing the urgent need to tackle energy security and resiliency in the United States while ensuring the feasibility of new energy technologies. By developing a comprehensive model that captures the behavior of new energy technologies within the existing energy system, this research provides valuable insights into the dynamics of technology diffusion and adoption. The successful validation of this model with mature energy systems like wind and solar indicates its potential applicability to emerging technologies such as hydrogen generation from electrolysis and more. The research contributes to novel methodologies for informed decision-making for investments in novel energy systems and aids in the development of effective policies for technology deployment. By highlighting key factors influencing market uptake, such as resource availability, federal incentives, and technological learning, this work supports the transition to a more diverse and resilient energy future.
The scientific novelty lies in the integrated approach for evaluating novel energy technologies where multiple disciplines are considered. The methodology and tool developed in this research support the integration of technological, economic, and social factors to enable informed decisions. This outcome is different from typical analyses that focus primarily on one of the areas, often economics, for investment decision-making.
The model developed in this research provides an intuitive understanding of the underlying complex dynamics of the wind energy system and identifies the most significant factors influencing energy system deployment.
However, there are several limitations in the developed model. First, while the model is intended to be generic and applicable to a diffusion analysis of many novel energy technologies, the model presented in this research was specifically validated with onshore wind energy. As such, the model must be adjusted for the specifics of other technologies. Second, the scope of this research and, as a result, the model boundaries, is limited to factors that are considered the most influential to the commercialization trajectory of novel energy systems. Lastly, as part of limiting the scope of the research, an important parameter, willingness to invest, was modeled as an exogenous variable. However, this variable would be better modeled as an endogenous variable since factors like technological learning, cost reduction, and total deployed capacity impact willingness to invest and vice versa. Future research could refine the model to overcome these limitations.

Future Research

Further research should, in particular, extend the same model to other novel energy technologies, such as utility-scale solar photovoltaic, using technology-specific parameters and historical data while maintaining the model’s structure. Future research also could apply a similar model to battery storage systems. Such research would test the hypothesis that the deployments of novel energy technologies follow a similar trajectory and that the core dynamics and influencing factors remain consistent across different technologies. Lastly, future research could explore in greater detail the willingness to invest factor, i.e., what influences investors’ decisions to fund energy technologies in general and specific technologies in particular. It is desirable to understand both quantitative values, e.g., return on investment, and soft parameters, e.g., perceived risk, to develop more detailed models simulating factors that could support better-informed decision-making.

Author Contributions

Conceptualization, S.L. and D.R.H.; methodology S.L. and K.E.S.; model development, S.L.; model review and edits, K.E.S.; writing—original draft preparation, S.L.; writing—review and editing, D.R.H. and K.E.S.; supervision, D.R.H. All authors have read and agreed to the published version of the manuscript.

Funding

This work was funded, in part, by the Idaho National Laboratory. The Idaho National Laboratory is a multi-program laboratory operated by Battelle Energy Alliance, LLC, for the U.S. Department of Energy under contract no. DE-AC07-05ID14517. This work of authorship was prepared as an account of work sponsored by an agency of the U.S. Government. Neither the U.S. Government, nor any agency thereof, nor any of their employees makes any warranty, express or implied, or assumes any legal liability or responsibility for the accuracy, completeness, or usefulness of any information, apparatus, product, or process disclosed, or represents that its use would not infringe privately owned rights. The U.S. Government retains, and the publisher, by accepting the article for publication, acknowledges that the U.S. Government retains a nonexclusive, paid-up, irrevocable, worldwide license to publish or reproduce the published form of this manuscript or allow others to do so, for U.S. Government purposes. The views and opinions of the authors expressed herein do not necessarily state or reflect those of the U.S. Government or any agency thereof.

Data Availability Statement

The data employed in this paper were taken from openly available documents as indicated throughout the paper. The system dynamics model developed in this research is available in the open-source GitHub repository: https://github.com/lawrencesv/Dynamics-of-new-energy-system-deployment_SD-Model, accessed on 29 March 2025. This research used data from U.S. government publications in the public domain [5,6,119] that are not subject to copyright protection. Source: U.S. Energy Information Administration (March 2025).

Acknowledgments

The authors would like to thank the Idaho National Laboratory and the Light Water Reactor Sustainability Program for supporting the preparation and publication of this manuscript. The authors would also like to thank Chandrakanth Bolisetti and Jisuk Kim for the technical review, and Alexandria Madden for her comprehensive editorial review.

Conflicts of Interest

The authors declare no conflicts of interest.

Abbreviations

CLDcausal loop diagrams
CRFcapital recovery factor
ITCinvestment tax credit
LCAlife cycle assessment
LCOElevelized cost of energy
MBSEmodel-based systems engineering
O&Moperation and maintenance
PPApower purchase agreement
PTCproduction tax credit
R&Dresearch and development
ROIreturn on investment
RPSrenewable portfolio standard
SDsystem dynamics
SEsystems engineering

References

  1. Wiser, R.; Millstein, D.; Hoen, B.; Bolinger, M.; Gorman, W.; Rand, J.; Barbose, G.; Cheyette, A.; Darghouth, N.; Jeong, S.; et al. Land-Based Wind Market Report: 2024 Edition; Technical Report; Lawrence Berkeley National Laboratory: Berkeley, CA, USA, 2024. [Google Scholar] [CrossRef]
  2. International Renewable Energy Agency (IRENA). Renewable Power Generation Costs in 2023; Technical Report; IRENA: Abu Dhabi, United Arab Emirates, 2024. [Google Scholar]
  3. International Renewable Energy Agency (IRENA). Renewable Capacity Statistics 2024; Technical Report; IRENA: Abu Dhabi, United Arab Emirates, 2024. [Google Scholar]
  4. Wind Systems. Wind Energy and the PTC: Sustaining an American Success Story. Available online: https://www.windsystemsmag.com/wind-energy-and-the-ptc-sustaining-an-american-success-story (accessed on 24 December 2024).
  5. U.S. Energy Information Administration. What Is U.S. Electricity Generation by Energy Source? Available online: https://www.eia.gov/tools/faqs/faq.php?id=427 (accessed on 8 June 2024).
  6. U.S. Energy Information Administration. Annual Energy Outlook 2023, Renewable Energy Generating Capacity and Generation. Available online: https://www.eia.gov/outlooks/aeo/ (accessed on 23 December 2024).
  7. International Energy Agency. World Energy Outlook 2021; Technical Report; International Energy Agency: Paris, France, 2021. [Google Scholar]
  8. bp. Energy Outlook 2024. Available online: https://www.bp.com/en/global/corporate/energy-economics/energy-outlook.html (accessed on 24 January 2025).
  9. Esmaeili, P.; Rafei, M.; Salari, M.; Balsalobre-Lorente, D. From oil surges to renewable shifts: Unveiling the dynamic impact of supply and demand shocks in global crude oil market on U.S. clean energy trends. Energy Policy 2024, 192, 114252. [Google Scholar] [CrossRef]
  10. Frazier, A.W.; Marcy, C.; Cole, W. Wind and solar PV deployment after tax credits expire: A view from the standard scenarios and the annual energy outlook. Electr. J. 2019, 32, 106637. [Google Scholar] [CrossRef]
  11. Harvey, H.; Orvis, R.; Rissman, J. Designing Climate Solutions: A Policy Guide for Low-Carbon Energy; Island Press: Washington, DC, USA, 2018. [Google Scholar] [CrossRef]
  12. IEA. United States 2024: Energy Policy Review; Technical Report; International Energy Agency (IEA): Paris, France, 2024. [Google Scholar]
  13. U.S. Department of Energy. Energy Independence and Security. Available online: https://www.energy.gov/eere/energy-independence-and-security (accessed on 24 January 2025).
  14. Resilient Energy Platform. Renewable Energy to Support Energy Security. Available online: https://www.nrel.gov/docs/fy20osti/74617.pdf (accessed on 24 January 2025).
  15. McKinsey & Company. Global Energy Perspective 2024. Available online: https://www.mckinsey.com/industries/energy-and-materials/our-insights/global-energy-perspective (accessed on 24 January 2025).
  16. Simeoni, P.; Nardin, G.; Ciotti, G. Planning and design of sustainable smart multi energy systems. The case of a food industrial district in Italy. Energy 2018, 163, 443–456. [Google Scholar] [CrossRef]
  17. Huang, Z.; Yu, H.; Peng, Z.; Feng, Y. Planning community energy system in the industry 4.0 era: Achievements, challenges and a potential solution. Renew. Sustain. Energy Rev. 2017, 78, 710–721. [Google Scholar] [CrossRef]
  18. Arriaga, M.; Caizares, C.A.; Kazerani, M. Long-Term Renewable Energy Planning Model for Remote Communities. IEEE Trans. Sustain. Energy 2016, 7, 221–231. [Google Scholar] [CrossRef]
  19. Herrera de Reyes, M.A.; Knighton, T.; Cheng, W.C.; Sweeney, K.P.; Joseck, F.C.; Cadogan, J.; Guaita, N.; Boardman, R.D.; Bafana, A.P.; Hanumante, N.C.; et al. Hydrogen Generation and Industrial Heat Opportunities for Nuclear Plants in the Gulf Coast; Technical Report; Idaho National Laboratory (INL): Idaho Falls, ID, USA, 2024. [Google Scholar] [CrossRef]
  20. Garrouste, M.; Wendt, D.S.; Jenson, W.D.; Zhang, Q.; Herrera Diaz, M.A.; Joseck, F.C. Grid-Integrated Production of Fischer-Tropsch Synfuels from Nuclear Power; Technical Report; Idaho National Laboratory (INL): Idaho Falls, ID, USA, 2023. [Google Scholar] [CrossRef]
  21. Freeman, R. Modelling the socio-political feasibility of energy transition with system dynamics. Environ. Innov. Soc. Transit. 2021, 40, 486–500. [Google Scholar] [CrossRef]
  22. Yang, Y.; Xia, S.; Huang, P.; Qian, J. Energy transition: Connotations, mechanisms and effects. Energy Strategy Rev. 2024, 52, 101320. [Google Scholar] [CrossRef]
  23. Neofytou, H.; Nikas, A.; Doukas, H. Sustainable energy transition readiness: A multicriteria assessment index. Renew. Sustain. Energy Rev. 2020, 131, 109988. [Google Scholar] [CrossRef]
  24. Young, J.; Brans, M. Analysis of factors affecting a shift in a local energy system towards 100% renewable energy community. J. Clean. Prod. 2017, 169, 117–124. [Google Scholar] [CrossRef]
  25. Guo, P.; Kong, J.; Guo, Y.; Liu, X. Identifying the influencing factors of the sustainable energy transitions in China. J. Clean. Prod. 2019, 215, 757–766. [Google Scholar] [CrossRef]
  26. Skoczkowski, T.; Bielecki, S.; Wojtyńska, J. Long-Term Projection of Renewable Energy Technology Diffusion. Energies 2019, 12, 4261. [Google Scholar] [CrossRef]
  27. Seel, S.J.; Kemp, J.M.; Cheyette, A.; Millstein, D.; Gorman, W.; Jeong, S.; Robson, D.; Setiawan, R.; Bolinger, M. Utility-Scale Solar, 2024 Edition; Technical Report; Lawrence Berkeley National Laboratory: Berkeley, CA, USA, 2024. [Google Scholar] [CrossRef]
  28. Pruyt, E. System Dynamics Models of Electrical Wind Power. In Proceedings of the International Conference of the System Dynamics Society, Oxford, UK, 25–29 July 2004. [Google Scholar]
  29. Pruyt, E. The EU-25 Power Sector: A System Dynamics Model of Competing Electricity Generation Technologies. In Proceedings of the International Conference of the System Dynamics Society, Boston, MA, USA, 29 July–2 August 2007. [Google Scholar]
  30. Dykes, K.L.; Sterman, J.D. Boom and Bust Cycles in Wind Energy Diffusion Due to Inconsistency and Short-term Bias in National Energy Policies. In Proceedings of the International Conference of the System Dynamics Society, Seoul, Republic of Korea, 25–29 July 2010. [Google Scholar]
  31. Tejeda, J.; Ferreira, S. Applying Systems Thinking to Analyze Wind Energy Sustainability. Procedia Comput. Sci. 2014, 28, 213–220. [Google Scholar] [CrossRef]
  32. Savio, A.; De Giovanni, L.; Guidolin, M. Modelling Energy Transition in Germany: An Analysis through Ordinary Differential Equations and System Dynamics. Forecasting 2022, 4, 438–455. [Google Scholar] [CrossRef]
  33. Laimon, M.; Mai, T.; Goh, S.; Yusaf, T. System dynamics modelling to assess the impact of renewable energy systems and energy efficiency on the performance of the energy sector. Renew. Energy 2022, 193, 1041–1048. [Google Scholar] [CrossRef]
  34. Hafner, S.; Gottschamer, L.; Kubli, M.; Pasqualino, R.; Ulli-Beer, S. Building the Bridge: How System Dynamics Models Operationalise Energy Transitions and Contribute towards Creating an Energy Policy Toolbox. Sustainability 2024, 16, 8326. [Google Scholar] [CrossRef]
  35. Klein, M.; Reeg, M.; Frey, U. Models Within Models—Agent-Based Modelling and Simulation in Energy Systems Analysis. J. Artif. Soc. Soc. Simul. 2019, 22, 6. [Google Scholar] [CrossRef]
  36. Esmaeili Aliabadi, D.; Kaya, M.; Sahin, G. Competition, risk and learning in electricity markets: An agent-based simulation study. Appl. Energy 2017, 195, 1000–1011. [Google Scholar] [CrossRef]
  37. Anatolitis, V.; Welisch, M. Putting renewable energy auctions into action—An agent-based model of onshore wind power auctions in Germany. Energy Policy 2017, 110, 394–402. [Google Scholar] [CrossRef]
  38. Gallo, G. Electricity market games: How agent-based modeling can help under high penetrations of variable generation. Electr. J. 2016, 29, 39–46. [Google Scholar] [CrossRef]
  39. Plazas-Niño, F.; Ortiz-Pimiento, N.; Montes-Páez, E. National energy system optimization modelling for decarbonization pathways analysis: A systematic literature review. Renew. Sustain. Energy Rev. 2022, 162, 112406. [Google Scholar] [CrossRef]
  40. Fishbone, L.G.; Abilock, H. Markal, a linear-programming model for energy systems analysis: Technical description of the bnl version. Int. J. Energy Res. 1981, 5, 353–375. [Google Scholar] [CrossRef]
  41. Kydes, A.S. The Brookhaven Energy System Optimization Model: Its Variants and Uses. In Energy Policy Modeling: United States and Canadian Experiences: Volume II Integrative Energy Policy Models; Springer: Dordrecht, The Netherlands, 1980; pp. 110–136. [Google Scholar] [CrossRef]
  42. Howells, M.; Rogner, H.; Strachan, N.; Heaps, C.; Huntington, H.; Kypreos, S.; Hughes, A.; Silveira, S.; DeCarolis, J.; Bazillian, M.; et al. OSeMOSYS: The Open Source Energy Modeling System: An introduction to its ethos, structure and development. Energy Policy 2011, 39, 5850–5870. [Google Scholar] [CrossRef]
  43. Hunter, K.; Sreepathi, S.; DeCarolis, J.F. Modeling for insight using Tools for Energy Model Optimization and Analysis (Temoa). Energy Econ. 2013, 40, 339–349. [Google Scholar] [CrossRef]
  44. Prina, M.G.; Cozzini, M.; Garegnani, G.; Manzolini, G.; Moser, D.; Filippi Oberegger, U.; Pernetti, R.; Vaccaro, R.; Sparber, W. Multi-objective optimization algorithm coupled to EnergyPLAN software: The EPLANopt model. Energy 2018, 149, 213–221. [Google Scholar] [CrossRef]
  45. Pietzcker, R.C.; Ueckerdt, F.; Carrara, S.; de Boer, H.S.; Després, J.; Fujimori, S.; Johnson, N.; Kitous, A.; Scholz, Y.; Sullivan, P.; et al. System integration of wind and solar power in integrated assessment models: A cross-model evaluation of new approaches. Energy Econ. 2017, 64, 583–599. [Google Scholar] [CrossRef]
  46. Krey, V.; Guo, F.; Kolp, P.; Zhou, W.; Schaeffer, R.; Awasthy, A.; Bertram, C.; de Boer, H.S.; Fragkos, P.; Fujimori, S.; et al. Looking under the hood: A comparison of techno-economic assumptions across national and global integrated assessment models. Energy 2019, 172, 1254–1267. [Google Scholar] [CrossRef]
  47. Binsted, M.; Iyer, G.; Cui, R.; Khan, Z.; Dorheim, K.; Clarke, L. Evaluating long-term model-based scenarios of the energy system. Energy Strategy Rev. 2020, 32, 100551. [Google Scholar] [CrossRef]
  48. Grubb, M.; Wieners, C.; Yang, P. Modeling myths: On DICE and dynamic realism in integrated assessment models of climate change mitigation. WIREs Clim. Change 2021, 12, e698. [Google Scholar] [CrossRef]
  49. Luo, X.; Oyedele, L.O.; Owolabi, H.A.; Bilal, M.; Ajayi, A.O.; Akinade, O.O. Life cycle assessment approach for renewable multi-energy system: A comprehensive analysis. Energy Convers. Manag. 2020, 224, 113354. [Google Scholar] [CrossRef]
  50. Ciacci, L.; Passarini, F. Life Cycle Assessment (LCA) of Environmental and Energy Systems. Energies 2020, 13, 5892. [Google Scholar] [CrossRef]
  51. Volkart, K.; Mutel, C.L.; Panos, E. Integrating life cycle assessment and energy system modelling: Methodology and application to the world energy scenarios. Sustain. Prod. Consum. 2018, 16, 121–133. [Google Scholar] [CrossRef]
  52. Reinert, C.; Deutz, S.; Minten, H.; Dörpinghaus, L.; von Pfingsten, S.; Baumgärtner, N.; Bardow, A. Environmental impacts of the future German energy system from integrated energy systems optimization and dynamic life cycle assessment. Comput. Chem. Eng. 2021, 153, 107406. [Google Scholar] [CrossRef]
  53. INCOSE. Systems Engineering Handbook, 5th ed.; Number INCOSE-TP-2003–002-05; John Wiley & Sons: Hoboken, NJ, USA, 2023. [Google Scholar]
  54. Noguchi, R.A. Recommended Best Practices based on MBSE Pilot Projects. In Proceedings of the INCOSE International Symposium, Orlando, FL, USA, 20–25 July 2019; Volume 29, pp. 753–770. [Google Scholar] [CrossRef]
  55. Sterman, J.D. Business Dynamics, Systems Thinking and Modeling for a Complex World; McGraw Hill: New York, NY, USA, 2010. [Google Scholar]
  56. Ventana Systems, Inc. Vensim. Available online: https://vensim.com/ (accessed on 20 January 2025).
  57. ISEE Systems. Stella Professional. Available online: https://www.iseesystems.com/store/products/stella-professional.aspx (accessed on 20 January 2025).
  58. Powersim Software AS. Powersim Software. Available online: https://powersim.com/ (accessed on 20 January 2025).
  59. Dykes, K. Dynamics of Technology Innovation and Diffusion with Emphasis on Wind Energy. Ph.D. Thesis, Massachusetts Institute of Technology, Cambridge, MA, USA, 2016. [Google Scholar]
  60. Bass, F.M. A New Product Growth for Model Consumer Durables. Manag. Sci. 1969, 15, 215–227. [Google Scholar] [CrossRef]
  61. Maier, F.H. New product diffusion models in innovation management—A system dynamics perspective. Syst. Dyn. Rev. 1998, 14, 285–308. [Google Scholar] [CrossRef]
  62. Maalla, E.; Kunsch, P. Simulation of micro-CHP diffusion by means of System Dynamics. Energy Policy 2008, 36, 2308–2319. [Google Scholar] [CrossRef]
  63. Chen, W.S.; Chen, K.F. Modeling Product Diffusion by System Dynamics Approach. J. Chin. Inst. Ind. Eng. 2007, 24, 397–413. [Google Scholar] [CrossRef]
  64. Dyner, I.; Zuluaga, M.M. SD for Assessing the Diffusion of Wind Power in Latin America: The Colombian Case. In Proceedings of the International Conference of the System Dynamics Society, Nijmegen, The Netherlands, 23–27 July 2006. [Google Scholar]
  65. Energy Innovations. Energy Policy Simulator. Available online: https://energypolicy.solutions/ (accessed on 22 December 2024).
  66. U.S. EPA’s Clean Air Markets Division, Office of Air and Radiation. Documentation for EPA Base Case v.5.13 Using the Integrated Planning Model; Technical Report EPA #450R13002; U.S. Environmental Protection Agency: Washington, DC, USA, 2013. [Google Scholar]
  67. Junginger, M.; Louwen, A. Technological Learning in the Transition to a Low-Carbon Energy System; Academic Press: Cambridge, MA, USA, 2020. [Google Scholar] [CrossRef]
  68. Divan, D.; Sharma, S. Accelerating Commercialization of Energy Innovations. In ENERGY 2040; Springer: Berlin/Heidelberg, Germany, 2024; pp. 165–191. [Google Scholar] [CrossRef]
  69. Arrow, K.J. The Economic Implications of Learning by Doing. Rev. Econ. Stud. 1962, 29, 155–173. [Google Scholar] [CrossRef]
  70. Rubin, E.S.; Azevedo, I.M.; Jaramillo, P.; Yeh, S. A review of learning rates for electricity supply technologies. Energy Policy 2015, 86, 198–218. [Google Scholar] [CrossRef]
  71. Wene, C.O. Energy Technology Learning Through Deployment in Competitive Markets. Eng. Econ. 2008, 53, 340–364. [Google Scholar] [CrossRef]
  72. Bosetti, V.; Carraro, C.; Duval, R.; Tavoni, M. What should we expect from innovation? A model-based assessment of the environmental and mitigation cost implications of climate-related R&D. Energy Econ. 2011, 33, 1313–1320. [Google Scholar] [CrossRef]
  73. Castrejon-Campos, O.; Aye, L.; Hui, F.K.P. Effects of learning curve models on onshore wind and solar PV cost developments in the USA. Renew. Sustain. Energy Rev. 2022, 160, 112278. [Google Scholar] [CrossRef]
  74. Morrison, J.B. Putting the learning curve in context. J. Bus. Res. 2008, 61, 1182–1190. [Google Scholar] [CrossRef]
  75. Esmaieli, M.; Ahmadian, M. The effect of research and development incentive on wind power investment, a system dynamics approach. Renew. Energy 2018, 126, 765–773. [Google Scholar] [CrossRef]
  76. de Gooyert, V.; de Coninck, H.; ter Haar, B. How to make climate policy more effective? The search for high leverage points by the multidisciplinary Dutch expert team ‘Energy System 2050’. Syst. Res. Behav. Sci. 2024, 41, 900–913. [Google Scholar] [CrossRef]
  77. Wang, R.; Hasanefendic, S.; Von Hauff, E.; Bossink, B. A System Dynamics Approach to Technological Learning Impact for the Cost Estimation of Solar Photovoltaics. Energies 2023, 16, 8005. [Google Scholar] [CrossRef]
  78. U.S. Energy Information Administration. Total Energy: Average Price of Electricity to Ultimate Customers. Available online: https://www.eia.gov/totalenergy/ (accessed on 22 December 2024).
  79. U.S. Energy Information Administration. Annual Energy Outlook 2023: Total Energy Supply, Disposition, and Price Summary. Available online: https://www.eia.gov/outlooks/aeo/data/browser/#/?id=1-AEO2023&region=0-0&cases=ref2023~highmacro~lowmacro~highprice~lowprice~highogs~lowogs~highZTC~lowZTC~aeo2022ref&sourcekey=0 (accessed on 22 December 2024).
  80. CONGRESS.GOV. Legislation. Available online: https://www.congress.gov/ (accessed on 22 December 2024).
  81. Brian Lips. The Past, Present, and Future of Federal Tax Credits for Renewable Energy. Available online: https://nccleantech.ncsu.edu/2024/11/19/the-past-present-and-future-of-federal-tax-credits-for-renewable-energy/ (accessed on 22 December 2024).
  82. Feldman, D.; Bolinger, M.; Schwabe, P. Current and Future Costs of Renewable Energy Project Finance Across Technologies; Technical Report NREL/TP-6A20-76881; National Renewable Energy Laboratory: Golden, CO, USA, 2020. [Google Scholar] [CrossRef]
  83. National Renewable Energy Laboratory. Wind Supply Curves. Available online: https://www.nrel.gov/gis/wind-supply-curves (accessed on 22 December 2024).
  84. Brown, L.R. World on the Edge: How to Prevent Environmental and Economic Collapse; W. W. Norton & Company: New York, NY, USA, 2011. [Google Scholar]
  85. Earth Policy Institute. Supporting Data for World on the Edge: How to Prevent Environmental and Economic Collapse. Available online: https://wayback.archive-it.org/22906/20240418170609/https:/www.earth-policy.org/books/wote/wote_data_topic (accessed on 23 December 2024).
  86. U.S. Energy Information Administration. International Energy Outlook 2023. Available online: https://www.eia.gov/outlooks/ieo/ (accessed on 23 December 2024).
  87. Wiser, R.; Bolinger, M.; Lantz, E. Assessing Wind Power Operating Costs in the United States: Results from a Survey of Wind Industry Experts. Renew. Energy Focus 2019, 30, 46–57. [Google Scholar] [CrossRef]
  88. American Clean Power. U.S. Permitting Delays Hold Back Economy, Cost Jobs. Available online: https://cleanpower.org/wp-content/uploads/gateway/2024/04/ACP-Pass-Permitting-Reform_Fact-Sheet.pdf (accessed on 24 December 2024).
  89. Wiser, R.; Bolinger, M. Benchmarking Anticipated Wind Project Lifetimes: Results from a Survey of U.S. Wind Industry Professionals; Technical Report; Lawrence Berkeley National Laboratory: Berkeley, CA, USA, 2019. [Google Scholar] [CrossRef]
  90. U.S. Energy Information Administration. Electricity Explained, Electricity in the United States. Available online: https://www.eia.gov/energyexplained/electricity/electricity-in-the-us.php (accessed on 22 December 2024).
  91. Servert, J.; Cerrajero, E.; López, D.; Rodríguez, A. Cost evolution of components and services in the STE sector: A two-factor learning curve. AIP Conf. Proc. 2018, 2033, 020007. [Google Scholar] [CrossRef]
  92. Kittner, N.; Lill, F.; Kammen, D.M. Energy storage deployment and innovation for the clean energy transition. Nat. Energy 2017, 2, 17125. [Google Scholar] [CrossRef]
  93. Söderholm, P.; Klaassen, G. Wind Power in Europe: A Simultaneous Innovation–Diffusion Model. Environ. Resour. Econ. 2007, 36, 136–190. [Google Scholar] [CrossRef]
  94. Nemet, G.F. Beyond the learning curve: Factors influencing cost reductions in photovoltaics. Energy Policy 2006, 34, 3218–3232. [Google Scholar] [CrossRef]
  95. Yao, Y.; Xu, J.H.; Sun, D.Q. Untangling global levelised cost of electricity based on multi-factor learning curve for renewable energy: Wind, solar, geothermal, hydropower and bioenergy. J. Clean. Prod. 2021, 285, 124827. [Google Scholar] [CrossRef]
  96. Samadi, S. The experience curve theory and its application in the field of electricity generation technologies—A literature review. Renew. Sustain. Energy Rev. 2018, 82, 2346–2364. [Google Scholar] [CrossRef]
  97. Way, R.; Ives, M.C.; Mealy, P.; Farmer, J.D. Empirically grounded technology forecasts and the energy transition. Joule 2022, 6, 2057–2082. [Google Scholar] [CrossRef]
  98. The International Energy Agency (IEA). Onshore Wind Equipment Manufacturing Capacity by Region and Component, 2022–2025. Available online: https://www.iea.org/data-and-statistics/charts/onshore-wind-equipment-manufacturing-capacity-by-region-and-component-2022-2025 (accessed on 22 December 2024).
  99. Statista. Global Market Share of the World’s Leading Wind Turbine Manufacturers in 2022, Based on Take-In-Orders. Available online: https://www.statista.com/statistics/272813/market-share-of-the-leading-wind-turbine-manufacturers-worldwide/ (accessed on 22 December 2024).
  100. Wood Mackenzie. Global Wind OEM Market Share. Available online: https://www.woodmac.com/press-releases/2024-press-releases/global-wind-oem-marketshare/ (accessed on 22 December 2024).
  101. Statista. Distribution of Solar Photovoltaic Module Production Worldwide in 2023, by Country. Available online: https://www.statista.com/statistics/668749/regional-distribution-of-solar-pv-module-manufacturing/ (accessed on 22 December 2024).
  102. The International Energy Agency (IEA). Solar PV Manufacturing Capacity and Production by Country and Region, 2021–2027. Available online: https://www.iea.org/data-and-statistics/charts/solar-pv-manufacturing-capacity-and-production-by-country-and-region-2021-2027 (accessed on 22 December 2024).
  103. Bolinger, M.; Wiser, R. Understanding Trends in Wind Turbine Prices over the Past Decade; Technical Report LBNL-5119E; Lawrence Berkeley National Laboratory: Berkeley, CA, USA, 2011. [Google Scholar] [CrossRef]
  104. The International Chamber of Shipping. Supply Chain and Turbine Operation Challenges Pose Threat to Renewable Fuel Generation. Available online: https://www.ics-shipping.org/news-item/supply-chain-and-turbine-operation-challenges-pose-threat-to-renewable-fuel-generation (accessed on 22 December 2024).
  105. The Manufacturer. Supply Chain Among the Top List of Concerns for the Wind Industry. Available online: https://www.themanufacturer.com/articles/supply-chain-among-the-top-list-of-concerns-for-wind-the-industry (accessed on 22 December 2024).
  106. Wood Mackenzie. The Wind Energy Industry Paradox: Short-Term Headwinds and Long-Term Optimism. Available online: https://www.woodmac.com/news/opinion/wind-energy-industry-paradox (accessed on 22 December 2024).
  107. Castrejon-Campos, O.; Aye, L.; Hui, F.K.P.; Vaz-Serra, P. Economic and environmental impacts of public investment in clean energy RD&D. Energy Policy 2022, 168, 113134. [Google Scholar] [CrossRef]
  108. Lopez, A.; Mai, T.; Lantz, E.; Harrison-Atlas, D.; Williams, T.; Maclaurin, G. Land use and turbine technology influences on wind potential in the United States. Energy 2021, 223, 120044. [Google Scholar] [CrossRef]
  109. National Renewable Energy Laboratory. Energy Analysis, Simple Levelized Cost of Energy (LCOE) Calculator Documentation. Available online: https://www.nrel.gov/analysis/tech-lcoe-documentation.html (accessed on 22 December 2024).
  110. Lee, J.T.; Kim, H.G.; Kang, Y.H.; Kim, J.Y. Determining the Optimized Hub Height of Wind Turbine Using the Wind Resource Map of South Korea. Energies 2019, 12, 2949. [Google Scholar] [CrossRef]
  111. Pluchinotta, I.; Zhou, K.; Zimmermann, N. Dealing with soft variables and data scarcity: Lessons learnt from quantification in a participatory system dynamics modelling process. Syst. Dyn. Rev. 2024, 40, e1770. [Google Scholar] [CrossRef]
  112. Coyle, G. Qualitative and quantitative modelling in system dynamics: Some research questions. Syst. Dyn. Rev. 2000, 16, 225–244. [Google Scholar] [CrossRef]
  113. Sterman, J.D. All models are wrong: Reflections on becoming a systems scientist. Syst. Dyn. Rev. 2002, 18, 501–531. [Google Scholar] [CrossRef]
  114. Zhang, Y.-Z.; Zhao, X.-G.; Ren, L.-Z.; Zuo, Y. The development of the renewable energy power industry under feed-in tariff and renewable portfolio standard: A case study of China’s wind power industry. J. Clean. Prod. 2017, 168, 1262–1276. [Google Scholar] [CrossRef]
  115. Lantz, E.; Steinberg, D.; Mendelsohn, M.; Zinaman, O.; James, T.; Porro, G.; Hand, M.; Mai, T.; Logan, J.; Heeter, J.; et al. Implications of a PTC Extension on U.S. Wind Deployment; Technical Report NREL/TP-6A20-61663; National Renewable Energy Laboratory: Golden, CO, USA, 2014. [Google Scholar] [CrossRef]
  116. Shrimali, G.; Lynes, M.; Indvik, J. Wind energy deployment in the U.S.: An empirical analysis of the role of federal and state policies. Renew. Sustain. Energy Rev. 2015, 43, 796–806. [Google Scholar] [CrossRef]
  117. Bartlett, J. Beyond Subsidy Levels: The Effects of Tax Credit Choice for Solar and Wind Power in the Inflation Reduction Act; Technical Report; Resources for the Future: Washington, DC, USA, 2023. [Google Scholar]
  118. Deschenes, O.; Malloy, C.; McDonald, G. Causal effects of Renewable Portfolio Standards on renewable investments and generation: The role of heterogeneity and dynamics. Resour. Energy Econ. 2023, 75, 101393. [Google Scholar] [CrossRef]
  119. U.S. Energy Information Administration. Annual Energy Outlook 2022; Technical Report; U.S. Energy Information Administration: Washington, DC, USA, 2023. [Google Scholar]
Figure 1. U.S. energy system schematic.
Energies 18 02048 g001
Figure 2. Basic dynamics of technology innovation and diffusion, adapted from [59].
Energies 18 02048 g002
Figure 3. Causal-loop diagram showing the dynamics of deployment of novel energy systems.
Energies 18 02048 g003
Figure 4. The “causal chain” function automatically highlights the learning-by-doing loop from Figure 3, illustrating the capability of model-based system dynamic models.
Energies 18 02048 g004
Figure 5. Identification of all influencing parameters for the installed capacity from Figure 3, illustrating another capability of model-based system dynamic models.
Energies 18 02048 g005
Figure 6. Causal-loop diagram of core dynamics of novel energy system deployment.
Energies 18 02048 g006
Figure 7. Profitable capacity model, representing the relationships between the resources, expected profits, and federal incentives variables in the capacity growth loop in Figure 6.
Energies 18 02048 g007
Figure 8. Technological learning model, representing the relationships between the industry experience and unit cost variables in the learning-by-doing loop in Figure 6.
Energies 18 02048 g008
Figure 9. Developer capacity growth model, representing the developer capacity loop in Figure 6.
Energies 18 02048 g009
Figure 10. Capacity growth model representing the capacity growth loop in Figure 6.
Energies 18 02048 g010
Figure 11. Timeline of PTCs with wind capacity additions in the United States (adopted from [10]).
Energies 18 02048 g011
Figure 12. SD model-simulated installed capacity versus observed installed capacity [1] and projected installed capacity [6].
Energies 18 02048 g012
Figure 13. Sensitivity of capacity growth to modeled variables.
Energies 18 02048 g013
Figure 14. Sensitivity of the LCOE to modeled variables.
Energies 18 02048 g014
Figure 15. Capacity growth versus available wind supply (left). Capacity growth versus PTCs (right).
Energies 18 02048 g015
Figure 16. LCOE versus technological learning (left). Capacity growth versus technological learning (right).
Energies 18 02048 g016
Table 1. Variables and data sources for the wind model.
SubmodelVariableValueData Source
Profitable CapacityHistorical and projected electricity price data:
Historical (1998–2023)Data[78]
Projected (2024–2050)Data[79]
PTC LookupData[80,81]
ITC LookupNot used
Interest Rate4%[82]
ROI10%
Wind Supply CurveData[83]
Technological LearningCumulative Global Capacity:
Historical (1998–2023)Data[3,84,85]
Projected (2024–2050)Data[86]
Initial Global Capacity—Total Globally Installed Capacity in 199810,200 MW[84,85]
Initial CapEx—Total Installed Costs in 19982824 USD/kW[2]
CapEx LR—Learning Rate for Total Installed Costs0.1312Estimated
Initial OpEx—O&M Costs in 199898 USD/kW[1]
OpEx LR—Learning Rate for O&M Costs0.09[87]
Initial Capacity Factor—Capacity Factor in 19980.255[1]
Capacity Factor LR—Capacity Factor Learning Rate0.0517Estimated
Developer Capacity GrowthInitial Developer Capacity in 1998500 MW[1]
Maximum Growth Rate40%[59]
Developer Capacity Adjustment Time1 year[59]
Capacity GrowthPermit Failure Rate75%[59]
Permitting and PPA Decision Time Lookup4–5 years[88]
Willingness to InvestDataEstimated
Average Construction Time1 year[59]
Average Project Lifetime20–30 years[89]
Historical Installed Wind Capacity in the United StatesData[1]
Projected Wind Capacity in the United StatesData[6]
Disclaimer/Publisher’s Note: The statements, opinions and data contained in all publications are solely those of the individual author(s) and contributor(s) and not of MDPI and/or the editor(s). MDPI and/or the editor(s) disclaim responsibility for any injury to people or property resulting from any ideas, methods, instructions or products referred to in the content.

