Abstract
This paper focuses on a hydrogen fuel cell power generation system integrated with photovoltaic (PV) generation, energy storage, and distribution network subsystems, conducting an economic and environmental adaptability analysis. Based on load balance, a mathematical model for the hydrogen fuel cell integrated energy system is established, and four scenarios are constructed: grid-powered, grid + fuel cell, grid + fuel cell + PV, and grid + fuel cell + PV + energy storage. The analysis results show that under the single-rate electricity pricing model, by 2030, the annual costs of Scenarios 3 and 4 are 11.46% and 12.67% lower than Scenario 1, respectively; by 2035, they are reduced by 19.32% and 20.43%, respectively. Under the two-part pricing model, by 2030, the annual costs of Scenarios 3 and 4 are 21.28% and 26.50% lower than Scenario 1, respectively; by 2035, they are reduced by 27.72% and 32.36%, respectively. These quantitative results indicate that the integration of hydrogen fuel cells with PV and energy storage systems can significantly reduce costs and promote their application and development in residential buildings.
1. Introduction
Hydrogen fuel cells, as a clean and efficient energy conversion technology, have gained widespread attention globally in recent years. With the increasing demand for low-carbon energy, hydrogen energy is seen as one of the key pathways to achieving a low-carbon economy [1,2,3]. According to the International Energy Agency (IEA), hydrogen is expected to account for 20% of global energy consumption by 2050 [4]. However, the future development of hydrogen energy and hydrogen fuel cells depends on their integrated economic and environmental performance, which requires effective integration with subsystems such as distribution networks, PV generation, energy storage, etc., to form an integrated energy system with promising application prospects [5,6,7].
In countries such as Japan, the United States, and Germany, several hydrogen fuel cell projects have been launched. These projects provide a foundation for analyzing hydrogen fuel cell integrated energy systems and are valuable for studying their adaptability with different distributed energy systems [8,9]. However, the economic and environmental performance of hydrogen fuel cell systems is influenced by various factors such as carbon tax policies, hydrogen prices, and fuel cell costs, making the study of their adaptability particularly important [10,11].
Currently, research on hydrogen fuel cell integrated energy systems is gradually increasing, covering a wide range of topics, including technological advancements, system performance, operational optimization, and application prospects. Nnabuife et al. analyzed the economics of hydrogen production through water electrolysis, pointing out that with the declining costs of renewable energy generation, the economics of hydrogen are gradually improving [12]. Asif et al. explored the market acceptance of hydrogen fuel cell electric vehicles (FCEVs), showing that policy incentives can effectively increase consumer acceptance of FCEVs [13]. Ren et al. investigated the application of new catalysts in hydrogen fuel cells, highlighting their advantages in reducing costs and improving efficiency [14]. Chen et al. emphasized the importance of optimizing membrane electrode assemblies (MEAs) to improve the overall performance of hydrogen fuel cells, with the use of novel polymer membrane materials significantly enhancing the conductivity and durability of the cells [15]. Lavanya et al. conducted a comprehensive assessment of hydrogen storage technologies, emphasizing the pros and cons of high-pressure hydrogen storage and liquid hydrogen storage, providing important insights for practical applications [16].
At present, the initial investment and operational costs of hydrogen fuel cells are relatively high. Jafari et al. pointed out that the implementation of carbon tax policies can effectively enhance the market competitiveness of hydrogen fuel cells and promote their technological development [17,18]. Abdelkareem et al. analyzed the carbon footprint and energy consumption of hydrogen fuel cells using the Life Cycle Assessment (LCA) method, and the results showed that their environmental impact during the usage phase is significantly lower than that of traditional energy systems [19]. In response to changes in carbon tax policies, Xu et al. proposed a dynamic adjustment strategy to improve the competitiveness of the system under different market conditions [20]. Li et al. studied the impact of changes in carbon tax and hydrogen prices on the operation of hydrogen fuel cells and found that a reasonable dynamic adjustment strategy can effectively improve the economic and environmental performance of the system [21]. Meanwhile, research by Mayyas et al. indicated that the use of dynamic electricity pricing strategies could further optimize the economic benefits of hydrogen fuel cells [22]. Furthermore, Yang et al. proposed a dynamic model based on market fluctuations to optimize the operational strategy of hydrogen fuel cell systems under different economic conditions [23]. Hassan and Jeje analyzed the development and progress of hydrogen fuel cells in sustainable energy, emphasizing the importance of policy support and technological innovation in promoting hydrogen energy applications [24,25]. Kanani and Khan discussed the integration of hybrid renewable energy systems with hydrogen fuel cells, noting that such integration can enhance system flexibility and reliability [26,27,28,29,30].
Although numerous studies have explored the economics and environmental performance of hydrogen fuel cell-based integrated energy systems, several significant limitations persist in the existing research. First, many studies have not adequately addressed the system’s adaptability under various influencing factors, such as carbon tax policies, hydrogen costs, and fuel cell system costs. This oversight can lead to an incomplete understanding of how these variables impact the economic viability and environmental sustainability of these systems. Second, comprehensive comparative studies that evaluate different operational schemes are relatively scarce. Most existing research tends to focus on isolated aspects rather than providing a systematic analysis that compares the advantages and disadvantages of various energy combination configurations. This lack of a systematic approach limits the ability to make informed decisions regarding the optimal design and operation of hydrogen fuel cell integrated energy systems. To address these critical issues, this study concentrates on hydrogen fuel cell power generation systems, augmented by photovoltaic (PV) generation, energy storage, and distribution networks. By conducting a thorough adaptability analysis of hydrogen fuel cell-based integrated energy systems, this research aims to fill the identified gaps in the literature. Specifically, it will provide insights into how these systems can be optimized for better performance under varying economic and environmental conditions, thereby enhancing their practical applicability and sustainability.
The contribution of this paper includes the following three key points. First, based on nearly 10 years of operational data from a hydrogen fuel cell project in Japan, the study performs a life cycle analysis of the system’s power generation efficiency, resulting in a more accurate mathematical model for the variation in hydrogen fuel cell system power generation efficiency. Second, by constructing mathematical models and objective functions for each system, a multi-scheme vertical comparative research structure is developed to comprehensively analyze the advantages and disadvantages of different energy combination schemes. Meanwhile, a horizontal comparative research structure is established using both single-price and two-part tariff electricity pricing systems to further explore the impact of pricing mechanisms on the system. Finally, the study conducts a deep analysis of the environmental and economic performance of the system under the influence of various factors such as carbon tax prices, hydrogen costs, and fuel cell system costs. This provides a scientific basis for the optimization design and practical application of hydrogen fuel cell-based integrated energy systems.
2. Methodology
2.1. Cluster Analysis and Data Fitting
The methodology of this study adopts a systematic approach. First, a typical daily load analysis is conducted after cleaning and standardizing the hourly load data. The K-means clustering algorithm is then applied to the processed load data to perform a clustering analysis, in order to identify several typical daily load patterns. In this process, the optimal number of clusters is determined using the elbow figure, and the load curves are ultimately divided into several categories to better understand the load characteristics.
Second, statistical analysis and data fitting are performed on the hourly power generation efficiency data from a hydrogen fuel cell project over the past ten years. Specifically, linear regression or nonlinear regression models are used to fit the hourly power generation efficiency data to capture the trend of its variation over time. The validity of the fitting model is assessed using various metrics, thereby establishing the fuel cell power generation efficiency model.
K-means clustering was chosen for its efficiency in handling large datasets, while polynomial fitting effectively captures the trend of efficiency variations over time. These two steps provide a solid data foundation for the subsequent integrated energy system analysis.
2.2. Model of Integrated Energy System
The integrated energy system (IES) mentioned in this study consists of hydrogen fuel cell power generation systems, PV systems, energy storage systems, and grid networks. Among these subsystems, renewable and clean energy systems are prioritized to supply electricity to the building. When the demand load cannot be satisfied with all other generations, the grid network can act as a supplementary power source.
In this IES, the primary objective is to meet the electricity demand of the building, while fully utilizing the key roles of the fuel cell, PV, and energy storage systems. By optimizing the energy distribution and peak shaving across various distributed energy systems, the need for purchasing external electricity is reduced to some extent, thereby lowering the peak load demand and greenhouse gas emissions of the building, which in turn reduces the overall operational costs. The balance of the electricity load is represented by Equation (1).
devotes the electricity demand of building at time t, in kW. , , is the PV, fuel cell, and power grid generation power at time t, in kW, respectively. is the battery storage charging or discharging power at time t, in kW.
The mathematical models for the aforementioned PV system, fuel cell system, and energy storage system are as follows:
The hydrogen fuel cell, as the focus of this study, is capable of converting the chemical energy of hydrogen into electrical energy, offering clean, efficient, and stable power generation. It can continuously supply power under varying load demands, providing a reliable power source for the system. The output power of the fuel cell at time t is represented by Equation (2). is the rated output power of the fuel cell at time t, in kW.
The energy storage system is used to balance the fluctuations in electricity load and perform energy regulation between different energy systems. It also exploits the electricity price differential between peak and valley periods to generate certain profits, reducing the overall operational cost of the system. The charging and discharging power of the storage system at time t is represented by Equations (3) and (4).
and devotes the battery storage system charging/discharging power at time t, in kW, respectively. and devotes the battery storage system’s rated power for charging and discharging in kW.
The output power of the PV system mainly depends on factors, including solar radiation, the area of solar panels, and the conversion efficiency. Its mathematical model is represented by Equation (5).
devotes the PV panel photoelectric conversion efficiency. devotes the total PV panel area, in m2. devotes the solar irradiance, in kW/m2. devotes the temperature, in Celsius.
Objective functions under both two-part electricity pricing and single electricity pricing systems are constructed based on environmental and economic indicators. Their mathematical models are represented by Equations (6) and (7).
and devotes the system annual cost under two-part electricity pricing and single electricity pricing, in Yuan, respectively. Initial investment, system operation and maintenance cost, building electricity consumption, hydrogen cost for the fuel cell system, and carbon tax under two-part electricity pricing and single electricity pricing is , respectively. Transformer capacity/demand charges, , is a unique charging under two-part electricity pricing.
3. Results
3.1. Typical Daily Load Analysis
As an example, consider a 5-story office building in Shanghai with a total building area of 40,000 m2 (one basement level and four above-ground floors), and a roof area of approximately 8000 m2.
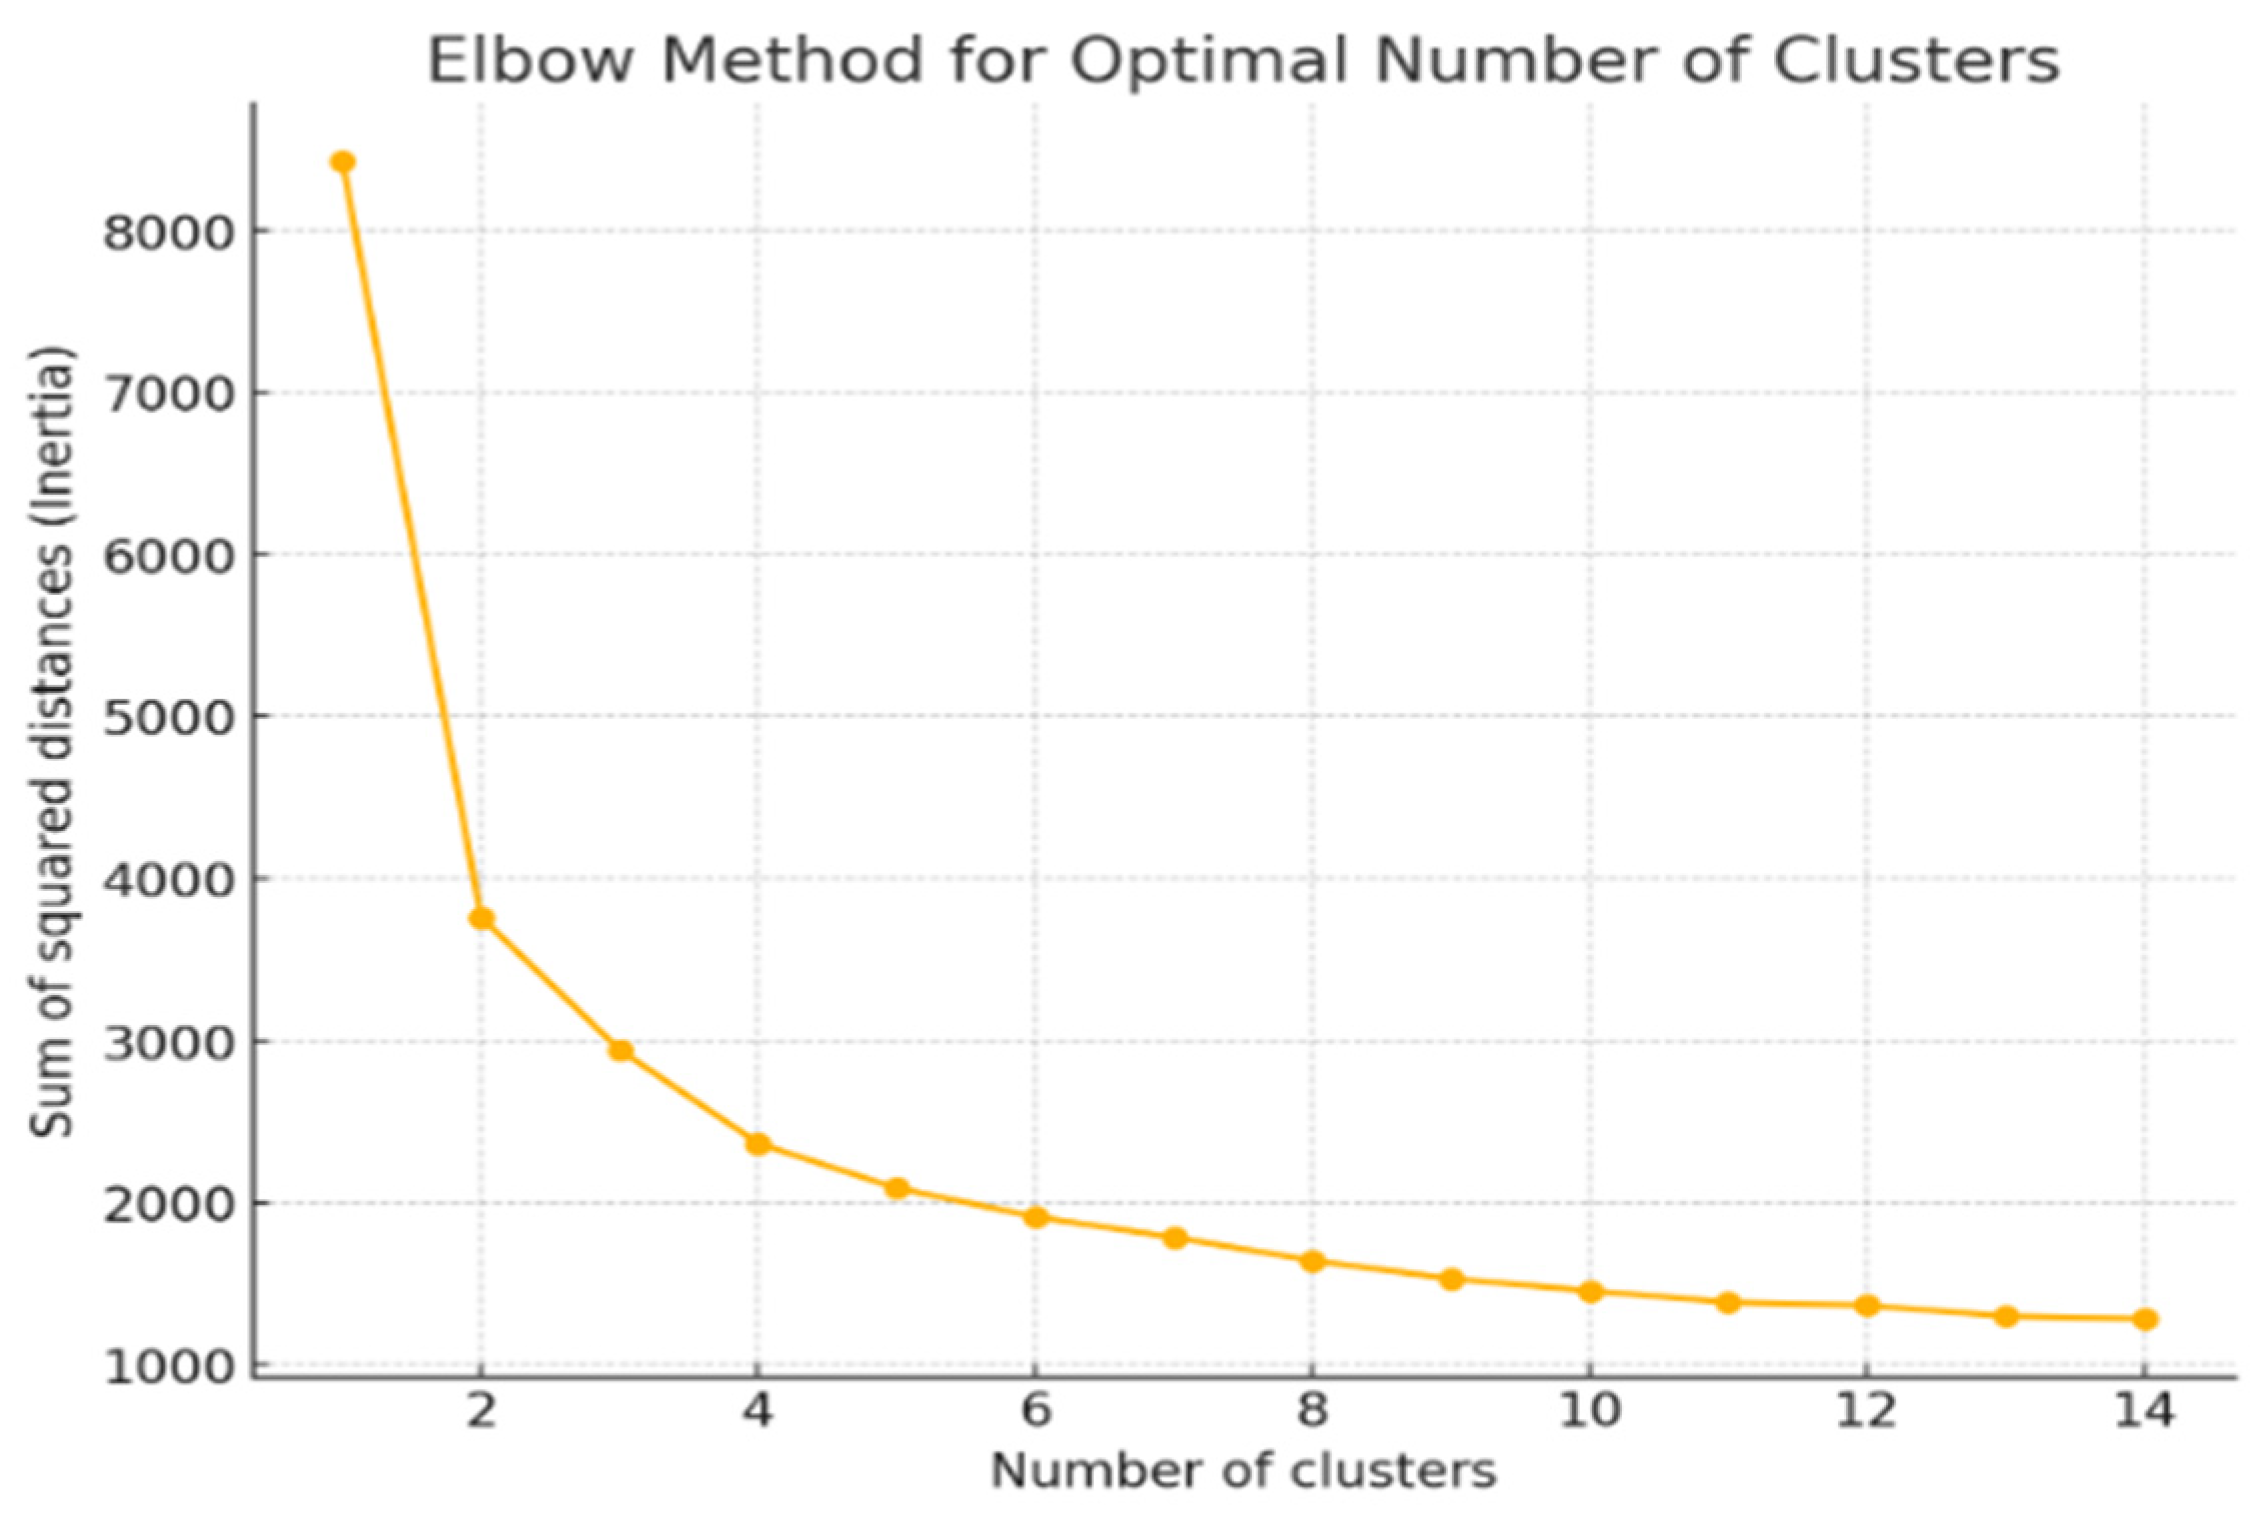
Using energy consumption simulation software, the electricity load of the building was forecasted, generating the dynamic hourly electricity load curve. A K-means clustering analysis was performed on the daily hourly electricity load curve. Starting with a small number of clusters, the number of clusters was gradually increased to perform the K-means clustering. The Sum of Squared Errors (SSE) for each cluster number was calculated, with SSE plotted as the vertical axis and the number of clusters as the horizontal axis, as shown in Figure 1.
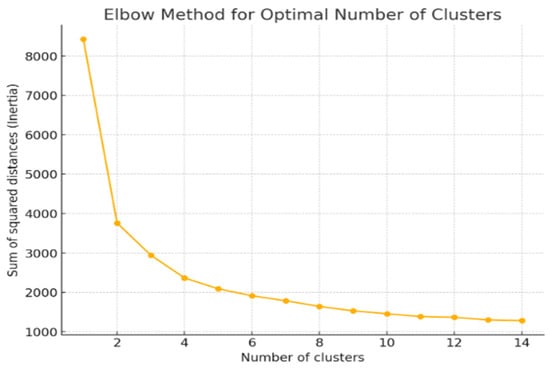
Figure 1.
Elbow plot of typical daily load K-means cluster analysis.
In cluster analysis, the vertical axis of the elbow plot typically represents the Sum of Squared Errors (SSE), which is the sum of the squared distances between data points and their respective cluster centers. As the number of clusters K increases, SSE gradually decreases. However, when K reaches a certain value, the rate of decrease in SSE levels off. This inflection point is referred to as the “elbow” and is used to determine the optimal number of clusters. Based on the plot, it is evident that the decrease slows down noticeably when the number of clusters is 4, making 4 the optimal number of clusters.
Using the optimal number of clusters, a clustering analysis was performed on the daily electricity load data for the entire year, as shown in Figure 2. From Figure 2 and the hourly electricity load curve for the entire year, it is evident that: Cluster 0 is primarily concentrated in the winter months of January, February, March, and December; Cluster 1 corresponds to long holidays, particularly important national holidays; Cluster 2 mainly represents the transitional seasons of April, May, October, and November; and Cluster 3 is mainly concentrated in the summer months of June to September.
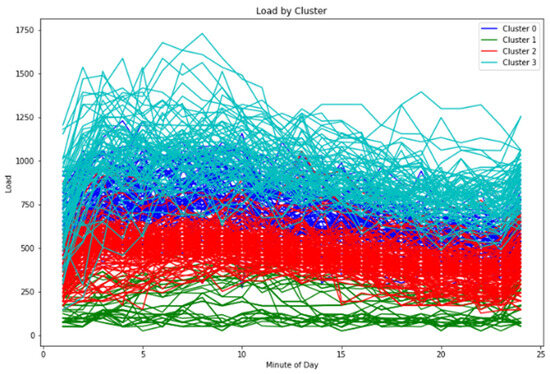
Figure 2.
Electrical load curves were analyzed by K-means clustering.
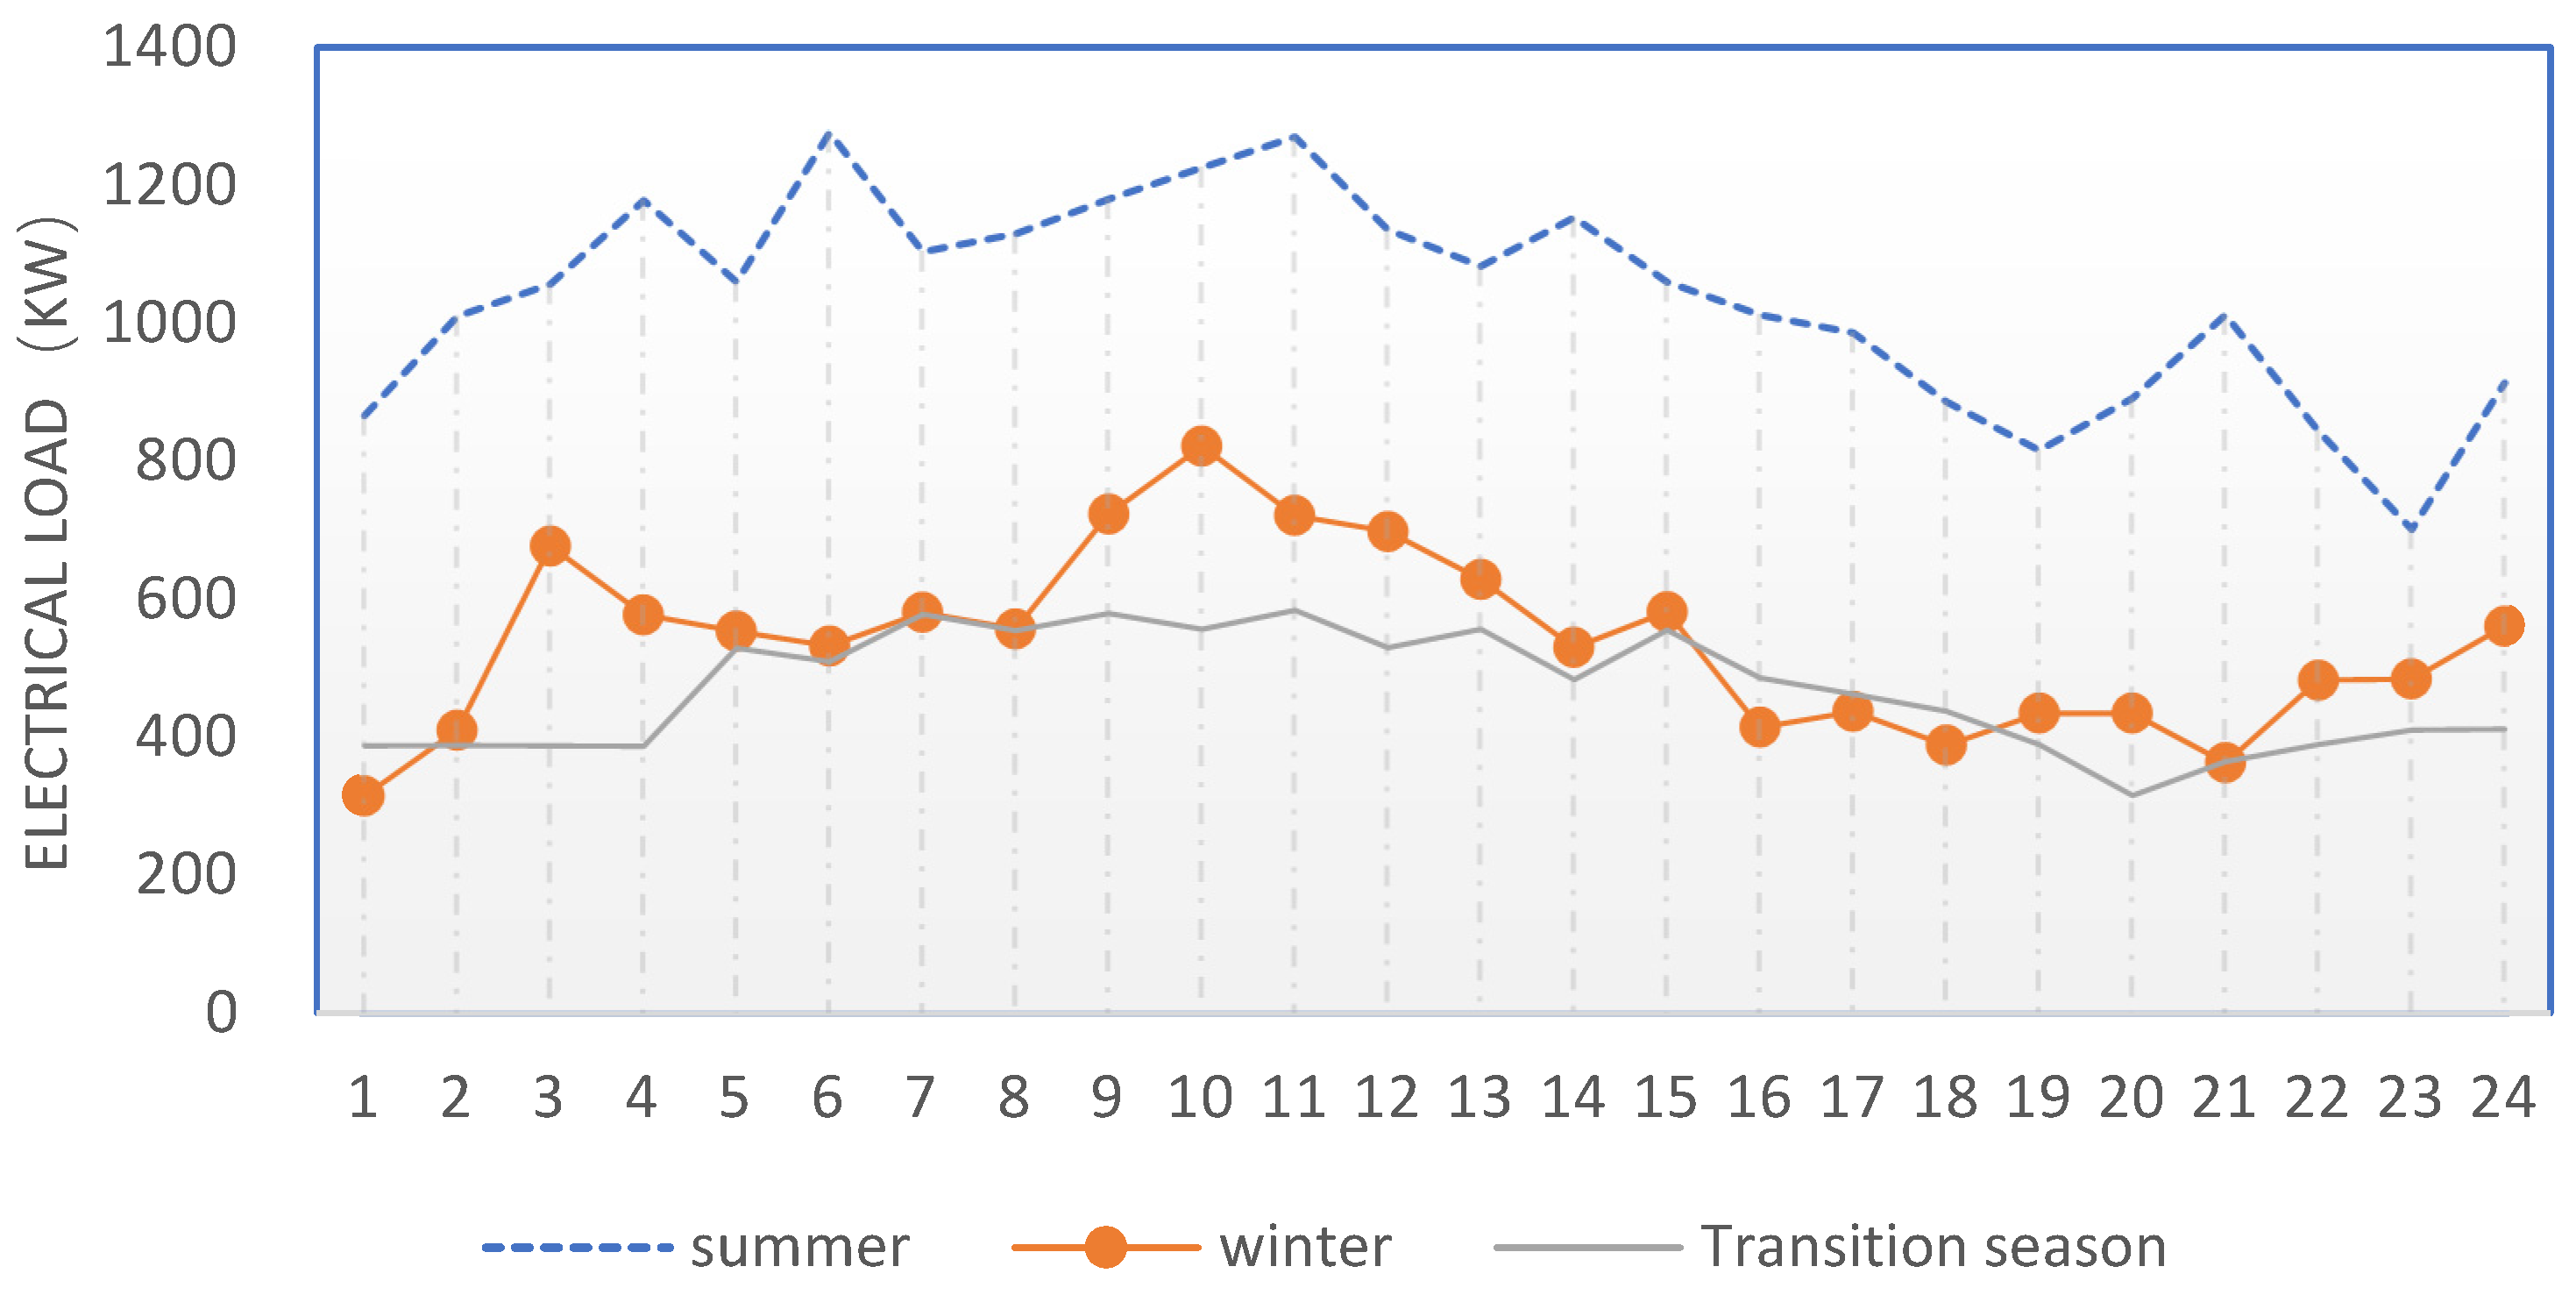
Based on the results of the K-means clustering analysis, typical daily load curves for winter, summer, and transitional seasons were selected. These are shown in Figure 3.

Figure 3.
Three groups of typical daily load curves.
3.2. Fuel Cell’s Power Generation Efficiency LCA
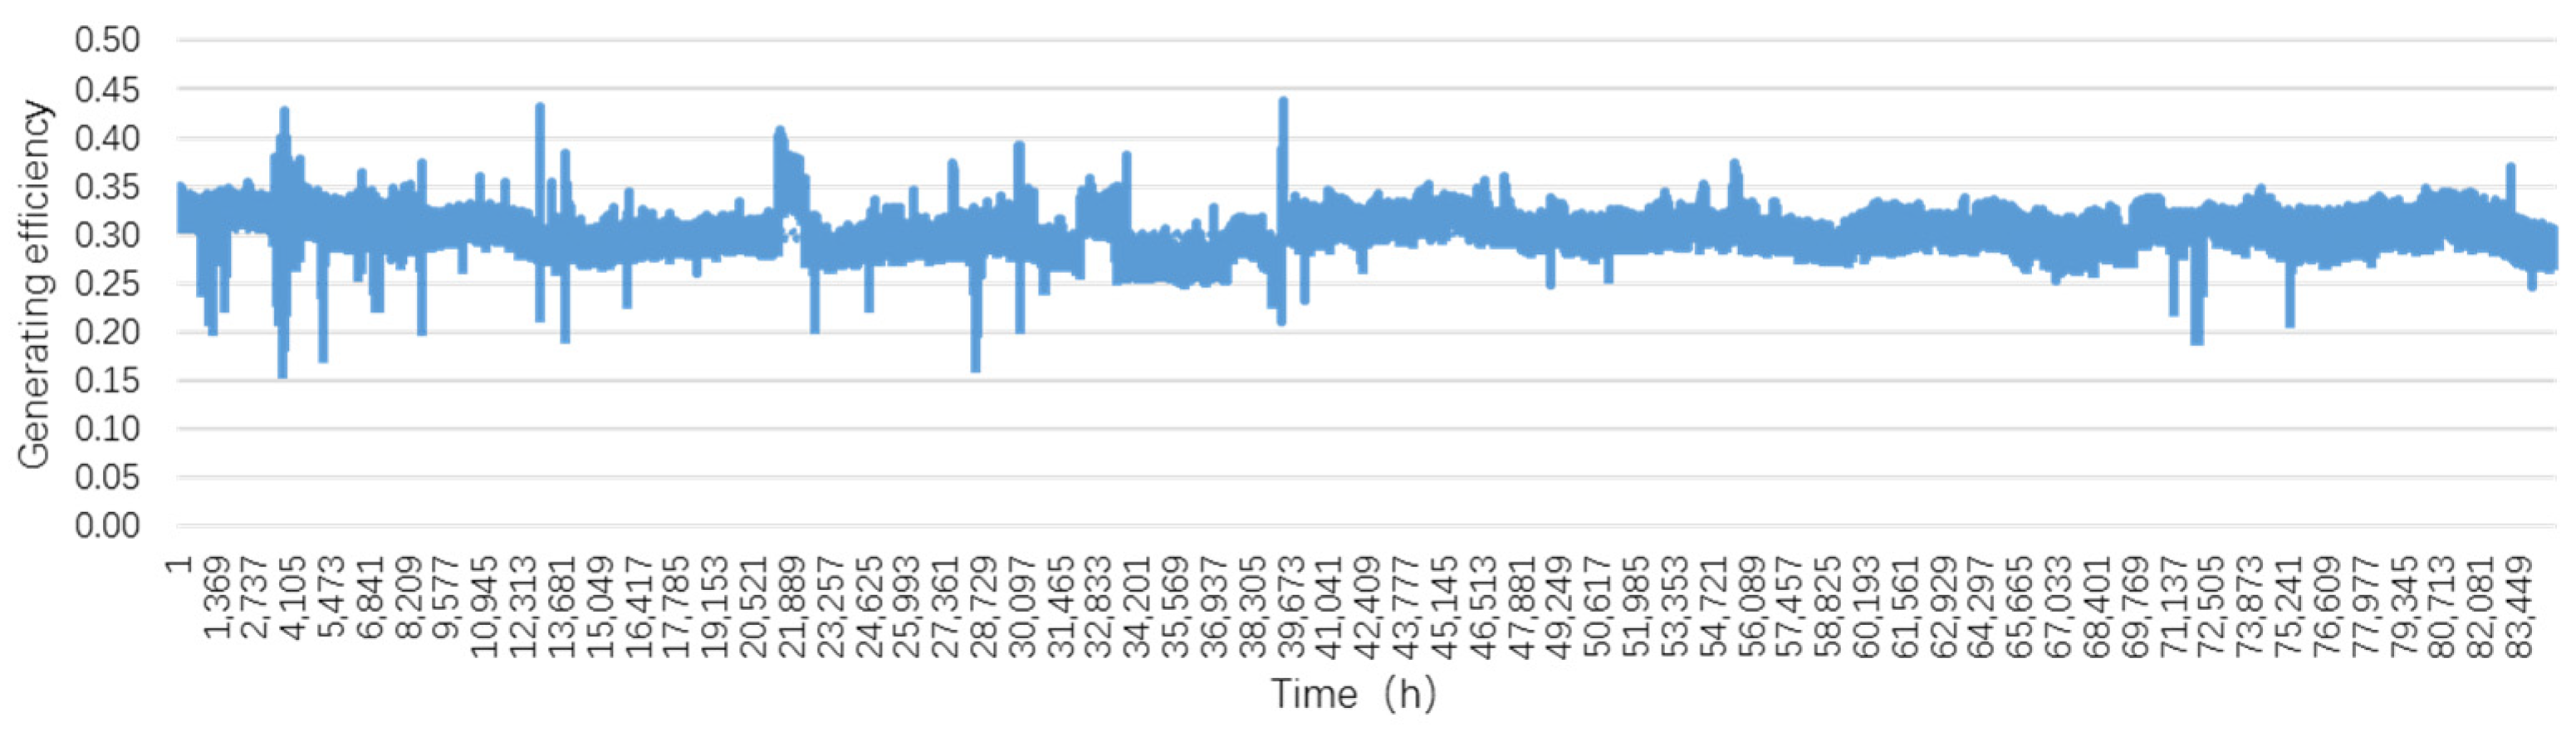
The fuel cell operation data used in this study are sourced from a university in Japan. The fuel cell power generation system started operating in June 2001 and ceased operation in 2011 due to a malfunction, with a total operating time of approximately 80,000 h. The operational data of the fuel cell system over the past decade were analyzed and organized, with a focus on summarizing the power generation efficiency. The aim is to study the relationship between the operational period of the fuel cell and its power generation efficiency. The hourly power generation efficiency data of the fuel cell system over the past ten years are shown in Figure 4. A polynomial fitting approach was applied to the hourly efficiency curve, using 1st to 6th order equations, as detailed in Table 1.

Figure 4.
Hourly generation efficiency of fuel cell system.

Table 1.
Polynomial fitting equations of fuel cell system hourly generation efficiency data.
From Figure 3 and Table 1, it can be observed that the fuel cell system has operated relatively steadily over the past decade, with its power generation efficiency consistently ranging between 0.3044 and 0.3296. The constant terms of the fitting equations from the 1st to 4th order provide insights into the power generation efficiency’s trend over the past decade. Specifically, the changes in efficiency, the amplitude of fluctuations, the intensity of these fluctuations, and the frequency of oscillations have all been relatively small. Therefore, the 1st-order fitting equation in Table 1 best represents the trend of the real curve.
3.3. IES Scenarios Setting
To study the adaptability of the hydrogen fuel cell system and its subsystems, with a focus on economic and environmental performance, four energy supply scenarios are established for vertical comparison. Based on scenarios 1 through 4, both single-rate and two-part electricity pricing models are used to construct energy operation schemes, forming a horizontal comparison research structure. The details are presented in Table 2.
Table 2.
IES scenarios and electricity pricing mechanism combinations.
3.4. IES Capacity and Operation Strategy Setting
The building type of this project is an office building. Based on the annual hourly electricity load curve, the building’s annual average electricity load (baseline power) is 596.96 kW. The photovoltaic (PV) system is installed on 50% of the rooftop area, with an installed capacity of 676.92 kW. The energy storage capacity is determined based on the “Zero Carbon Building Technical Standards (Draft for Comments)”, where one of the criteria for near-zero carbon buildings is that the maximum flexible load adjustment power should be no less than 20% of the baseline power. As a good flexible load, the energy storage capacity is selected as 20% of the baseline power over 2 h, resulting in a value of 119.39 kW/238.78 kWh. The fuel cell configuration refers to one of the standards for zero-carbon buildings in the “Zero Carbon Building Technical Standards (Draft for Comments)”, where the maximum flexible load adjustment power should be no less than 50% of the baseline power. As an excellent emergency power source and distributed power generation, the fuel cell capacity is selected as 30% of the baseline power, with a value of 179.09 kW, after subtracting the energy storage configuration.
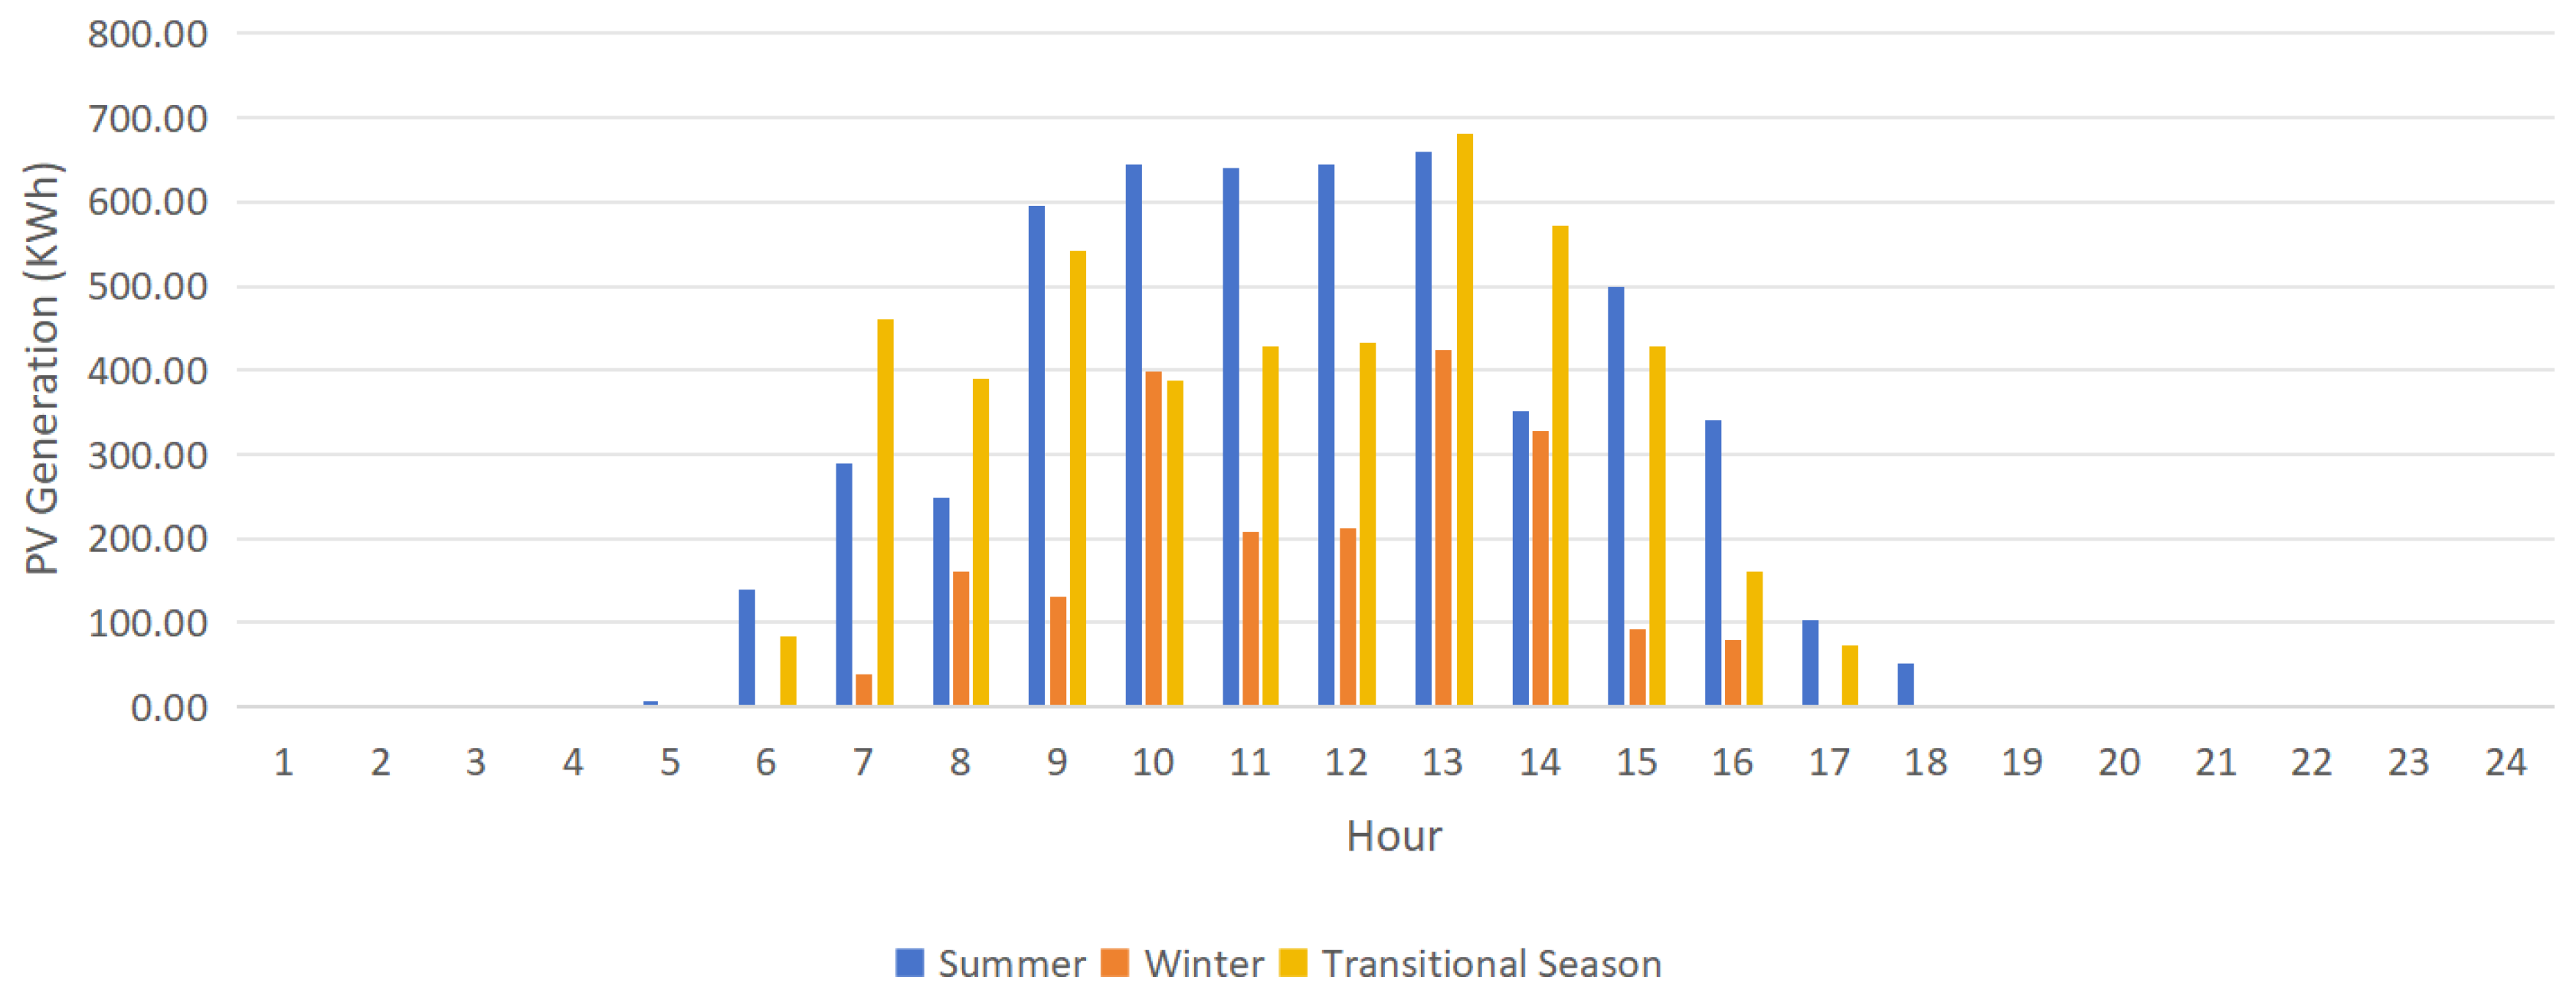
PV system operation strategy: The PV system operates based on sunlight intensity, prioritizing power supply to the load. If there is surplus electricity, it charges the energy storage system. If there is excess power that cannot be stored, it is fed into the grid. Figure 5 shows the PV output operation during the summer, winter, and transitional seasons.

Figure 5.
Daily PV generation during summer, winter, and transitional season.
Fuel Cell Operation Strategy: The fuel cell system operates during peak and high-demand periods, adjusting its output power according to electricity load demands, with the system being shut off during flat or valley periods. To ensure comparability between the single-rate and two-part-rate electricity pricing operation modes, the fuel cell must operate for the same total duration in both pricing models while adhering to the aforementioned operating strategy.
Energy Storage System Operation Strategy: In the two-part electricity pricing mode, the energy storage system performs two charge and discharge cycles per day, while in the single-rate electricity pricing mode, it performs one charge and one discharge cycle per day. The charging occurs during flat or valley periods, and discharging occurs during peak or high-demand periods. The charge and discharge power are determined based on the generation from PV systems, fuel cells, and the electricity load.
Distribution Grid Operation Strategy: During system operation, the distribution grid supplements the system when there is a power deficit.
Table 3, Table 4 and Table 5 show the operation output of the fuel cell and energy storage system under the two-part electricity pricing model. Table 6, Table 7 and Table 8 show the operation output of the fuel cell and energy storage system under the single-rate electricity pricing model. The positive value under battery storage generation power is discharging and negative one presents charging.
Table 3.
Fuel cell and battery storage generation under two-part pricing model in summer.
Table 4.
Fuel cell and battery storage generation under two-part pricing model in winter.
Table 5.
Fuel cell and battery storage generation under two-part pricing model in transitional season.
Table 6.
Fuel cell and battery storage generation under single-part pricing model in summer.
Table 7.
Fuel cell and battery storage generation under single-part pricing model in winter.
Table 8.
Fuel cell and battery storage generation under single-part pricing model in transitional season.
3.5. Technical and Cost Parameters
This section analyzes the current initial investment costs, operation and maintenance costs, performance, and lifespan of each subsystem in the energy supply systems of Plans 1 to 4. According to the document “Notice on Further Improving the Time-of-Use Electricity Pricing Mechanism” (Shanghai Development and Reform Commission, Document No. 50 [2022]), the single-rate and two-part electricity prices in Shanghai are outlined in Table 9 and Table 10. The technical parameters for the fuel cell system, PV power generation system, and energy storage system are provided in Table 11, Table 12 and Table 13, based on manufacturer technical samples and related information. The operation and maintenance cost is estimated at 2.5% of the initial investment cost.
Table 9.
General two-part electricity pricing model for industry and commerce in Shanghai.
Table 10.
General single-part electricity pricing model for industry and commerce in Shanghai.
Table 11.
Fuel cell technical and cost parameters.
Table 12.
PV generation technical and cost parameters.
Table 13.
Battery storage technical and cost parameters.
4. Discussion
4.1. Environmental Analysis
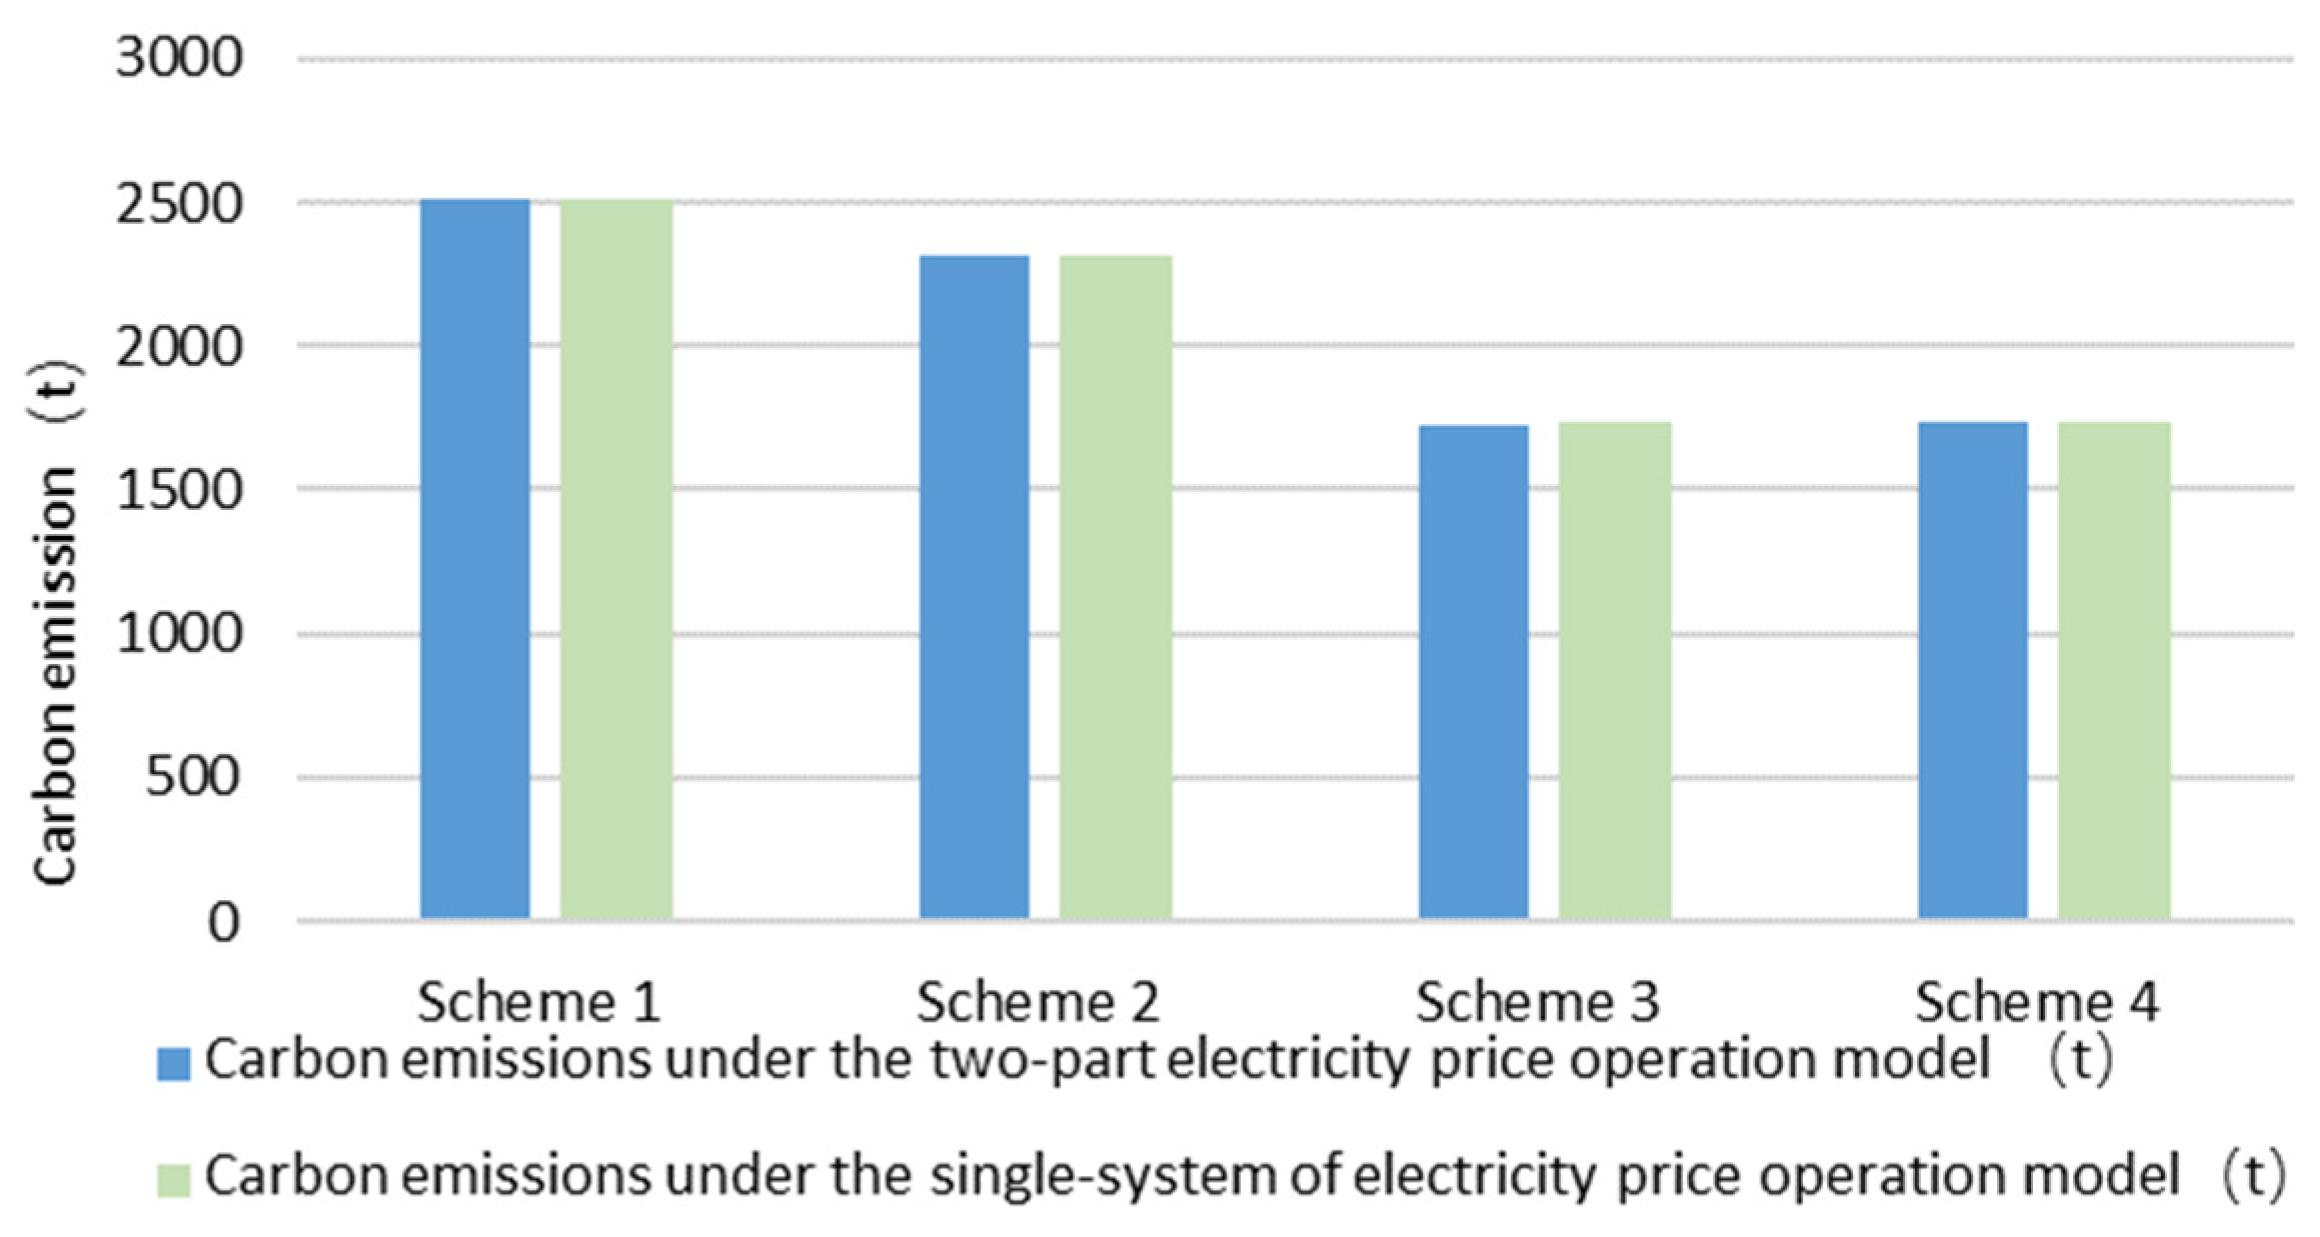
The carbon emissions for Scenarios 1 to 4 are presented in Table 14 and Figure 5. As shown in Table 14 and Figure 5, Scenario 1 has the highest carbon emissions, reaching 2509.77 tons. Scenario 3 has the lowest carbon emissions, with 1734.44 tons under the single-rate electricity pricing model and 1726.06 tons under the two-part electricity pricing model. The inclusion of the energy storage system in Scenario 4 increases the power purchased from the grid, resulting in a slight increase in carbon emissions compared to Scenario 3.
Table 14.
Carbon emission for all scenarios.
From the carbon emission results of Scenarios 1 and 2, it can be observed that the carbon emissions are identical for both operational models. For Scenarios 3 and 4, due to differences in high demand/flat/valley/peak time slots and the integration of the PV system, slight variations in carbon emissions exist between the two operational models.
The changes in carbon emissions between Scenarios 1 to 3, as shown in Figure 6, indicate that the addition of fuel cells and PVc systems effectively reduces carbon emissions. Scenario 2 achieves a 7.7% reduction in carbon emissions compared to Scenario 1. Under the two-part electricity pricing model and the single-rate electricity pricing model, Scenario 3 reduces carbon emissions by 31.2% and 30.9% compared to Scenario 1, respectively.
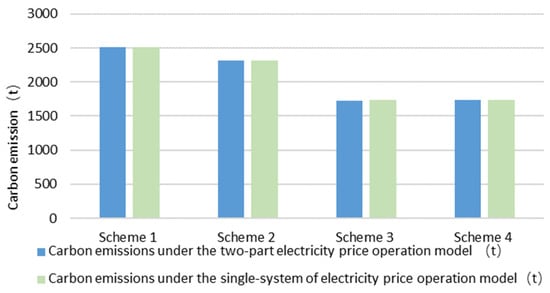
Figure 6.
Box plot of all scenarios’ carbon emission.
4.2. Economic Analysis
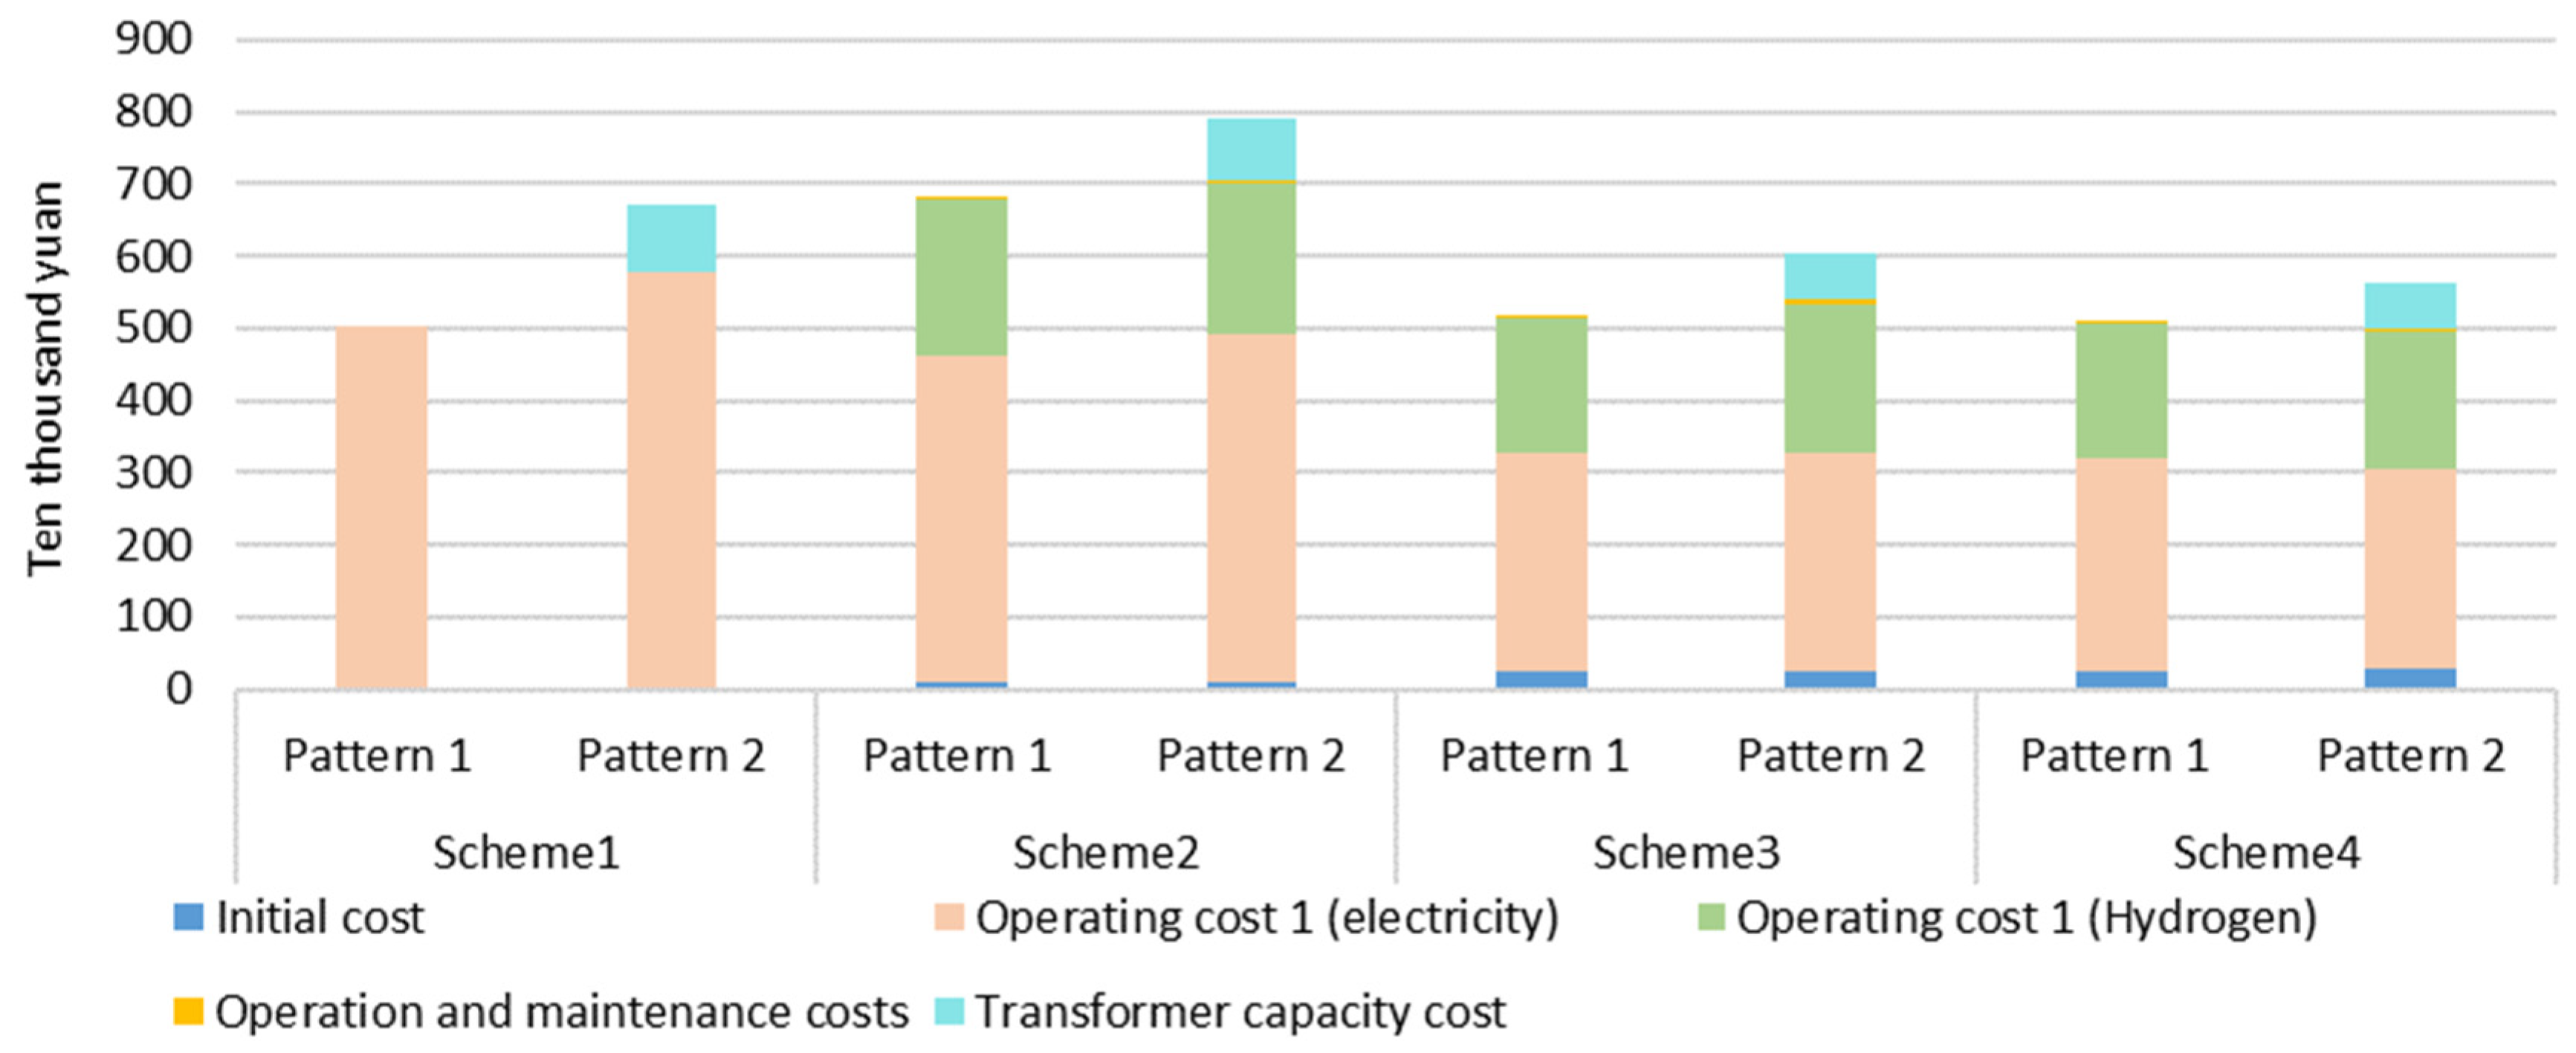
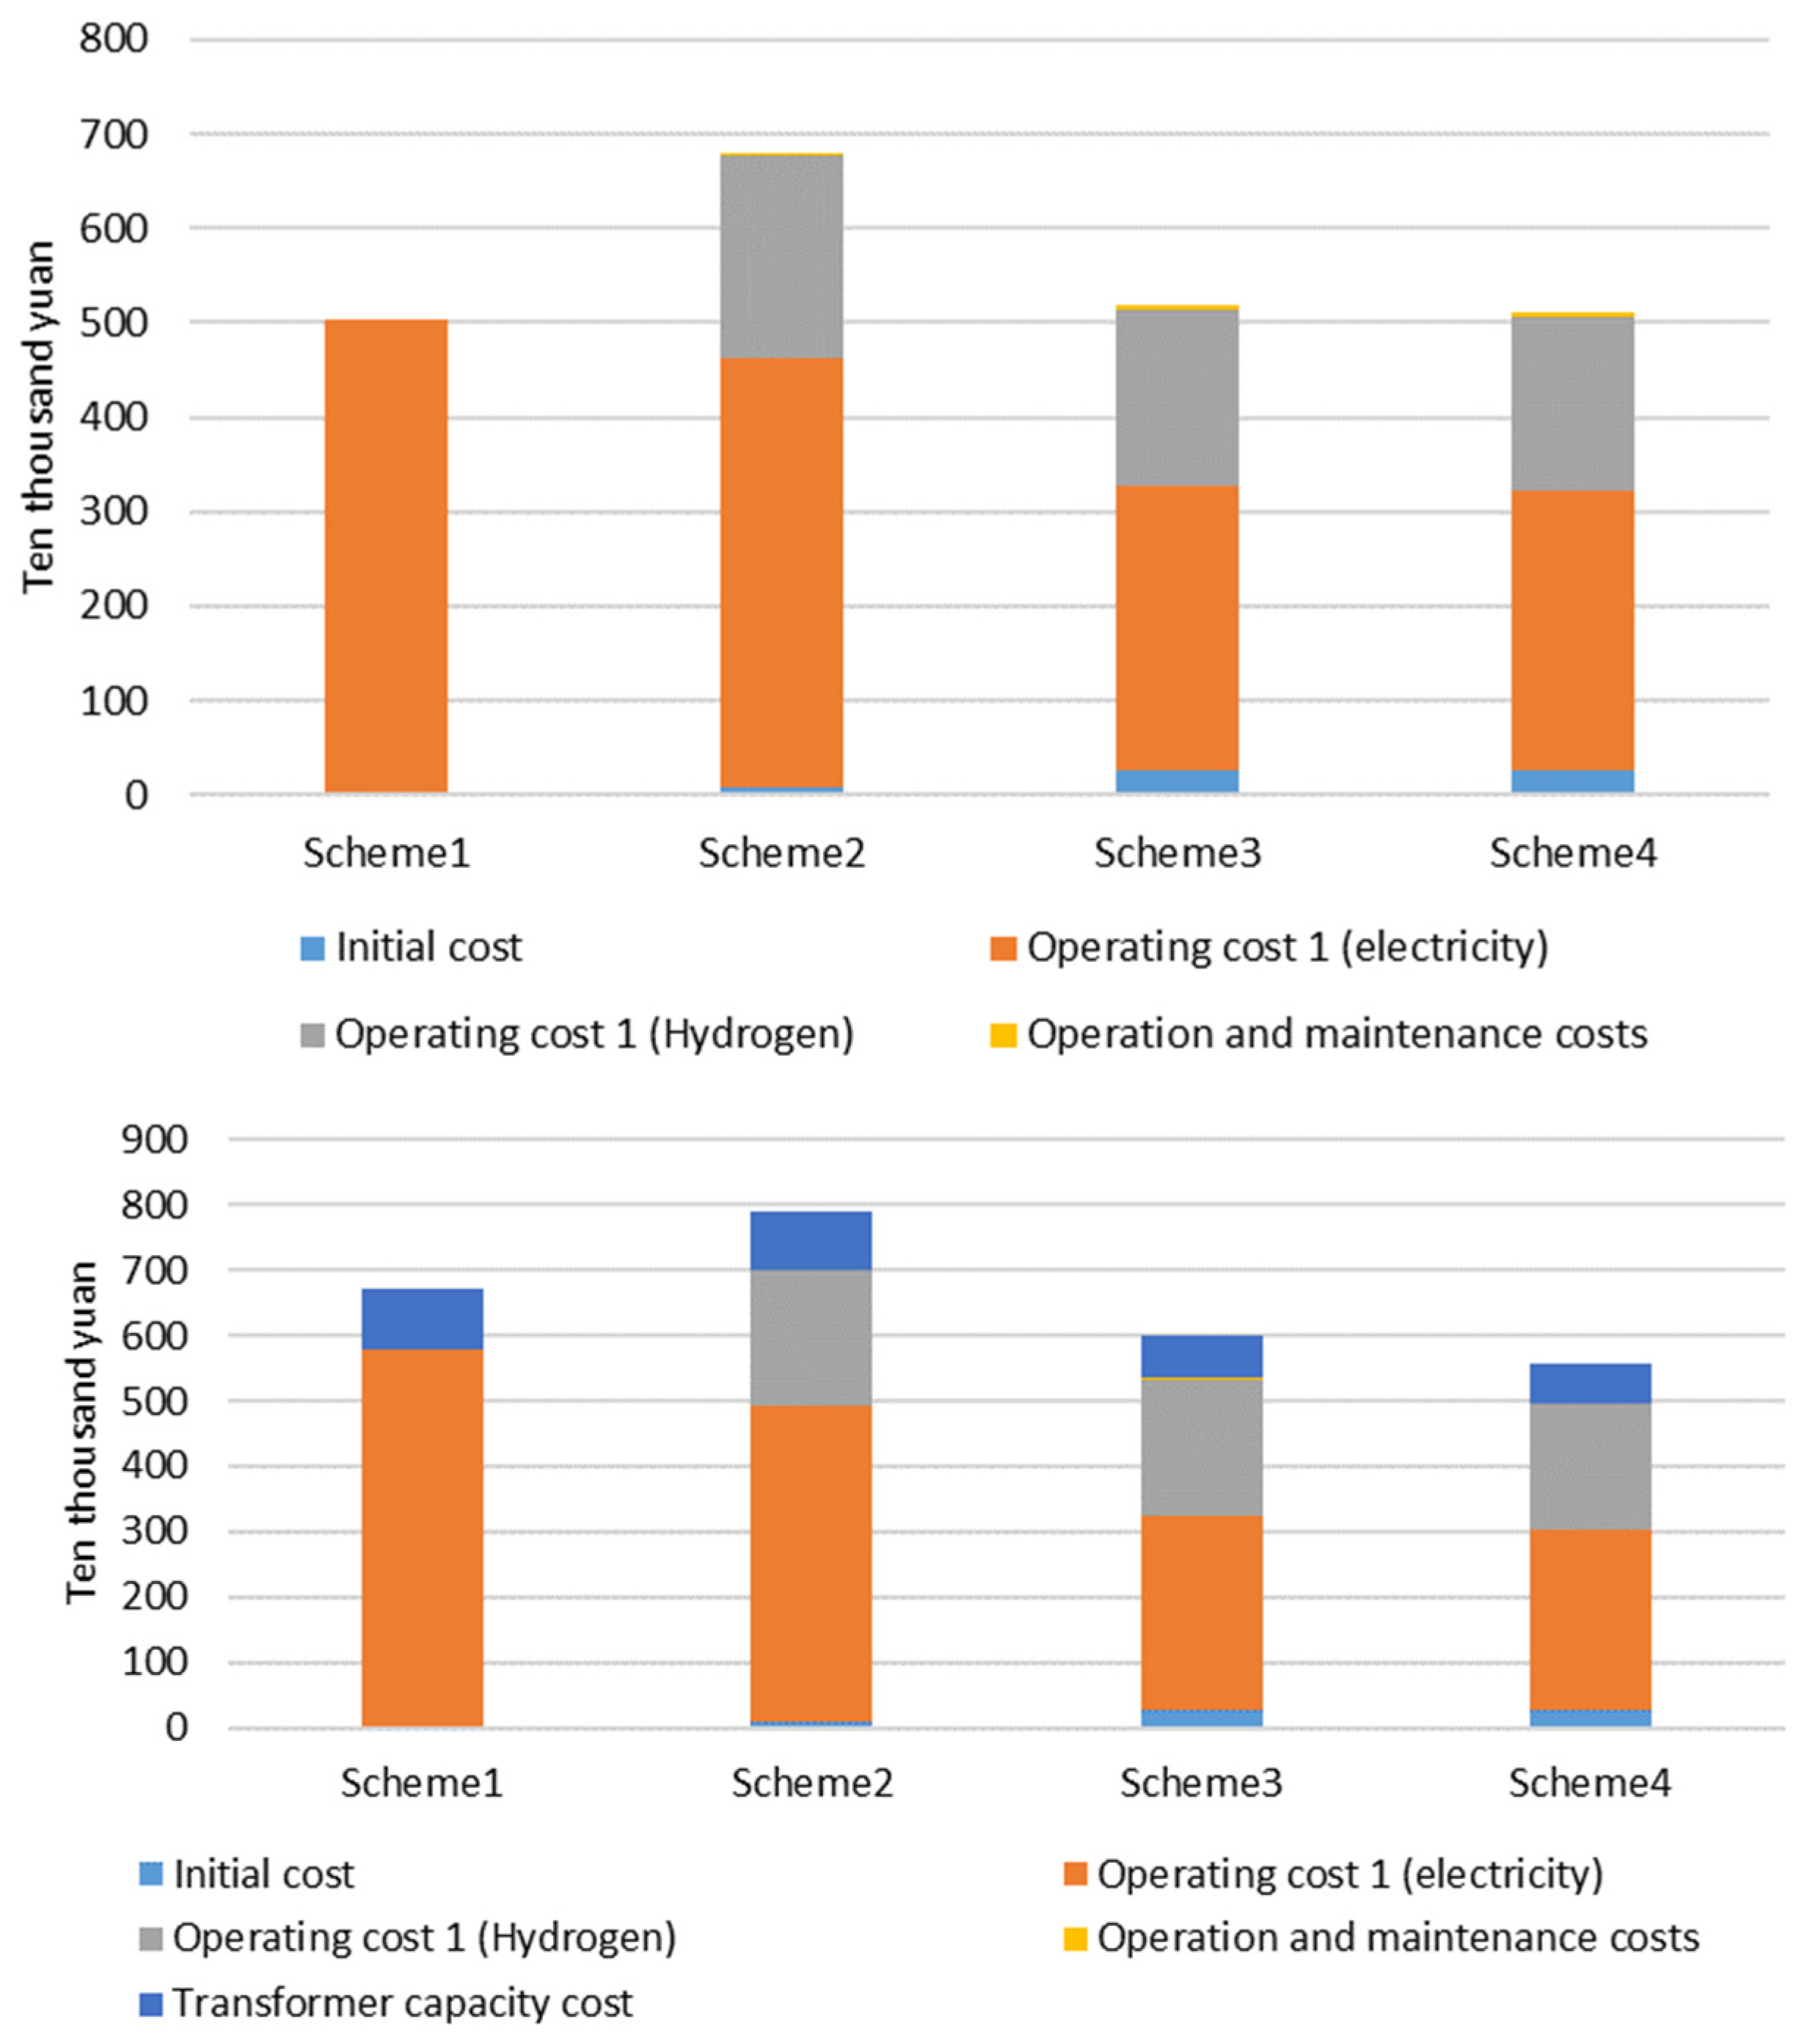
Based on the typical daily load profiles, the annual costs for Scenarios 1 to 4 under both operational models have been calculated. The total annual costs take into account the initial investment, energy consumption costs, operation and maintenance (O&M) costs, capacity costs, and other components. A horizontal comparison under the two operational models and a vertical comparison between the plans are presented in Table 15 and Table 16 and Figure 7 and Figure 8.
Table 15.
Horizontal economic comparison among all scenarios with two electricity pricing modes (Unit: 10,000 Yuan).
Table 16.
Vertical economic comparison among all scenarios with two electricity pricing modes (Unit: 10,000 Yuan).
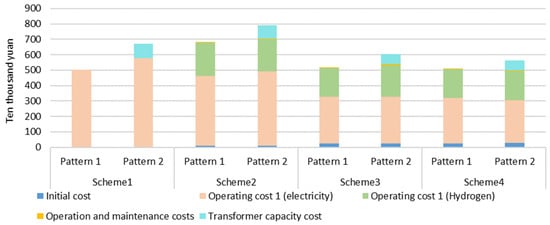
Figure 7.
Box plot of all scenarios’ horizontal economic analysis under two different electricity pricing modes.
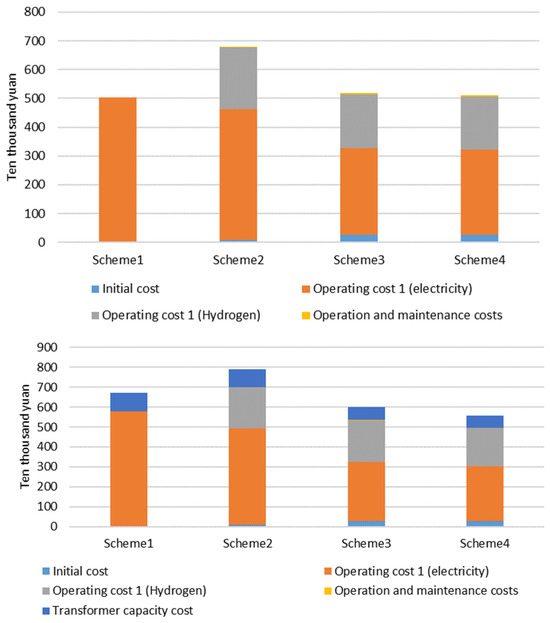
Figure 8.
Box plot of all scenarios’ vertical economic analysis under two different electricity pricing modes.
According to the data in Table 15 and Figure 6, under the current conditions, the annual total costs of all four plans are lower under the single-rate electricity pricing model than under the two-part model. However, it is evident that with the integration of distributed energy systems such as photovoltaics and energy storage, the cost differences between the two operational models gradually decrease. Specifically, for the two-part electricity pricing model, the annual costs of the four plans are higher than those under the single-rate electricity pricing model by 1.6564 million Yuan (32.84%), 1.0949 million Yuan (16.10%), 0.8531 million Yuan (16.42%), and 0.5046 million Yuan (9.85%), respectively.
From the data in Table 16 and Figure 7, it can be seen that under the single-rate electricity pricing model, Scenario 1 has the lowest annual cost at 5.0437 million Yuan. With the inclusion of hydrogen fuel cells, photovoltaic systems, energy storage systems, and other distributed energy sources, the costs of Scenario 4 are nearly equivalent to those of Scenario 1, decreasing to 5.1220 million Yuan.
Through the analysis of the annual costs of Scenarios 1 to 4, it is found that the energy supply plan with only the fuel cell system (Scenario 2) incurs higher annual costs than the other plans under both operational models. However, with the integration of photovoltaics and energy storage systems, the annual costs of Scenarios 1 and 2 significantly decrease. Under both operational models, the annual costs of Scenario 4 are reduced by 24.70% and 28.75% compared to Scenario 2.
4.3. Development Potential Analysis
This section focuses on the development potential of fuel cell integrated energy systems, with an emphasis on forecasting and analyzing three key aspects: fuel cell system costs, hydrogen fuel costs, and carbon tax costs. Through a predictive analysis of these costs, the intrinsic relationship between them and the system’s economic performance is demonstrated, providing a comprehensive and forward-looking research basis for the future development of fuel cell integrated energy systems.
The future potential forecast is divided into three scenarios based on time points: 2025 (current situation), 2030, and 2035, as detailed in Table 17. Scenario analysis is provided in Table 18, Table 19 and Table 20 and Figure 9.
Table 17.
Relevant costs in 2025, 2030, and 2035.
Table 18.
Economic analysis among all scenarios with two electricity pricing modes in 2030 (Unit: 10,000 Yuan).
Table 19.
Economic analysis among all scenarios with two electricity pricing modes in 2035 (Unit: 10,000 Yuan).
Table 20.
Cost comparison among all scenarios with two electricity pricing modes in 2025, 2030, and 2035 (Unit: 10,000 Yuan).
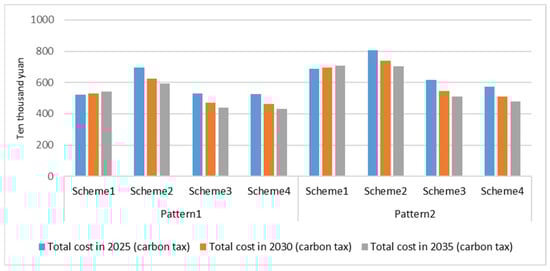
Figure 9.
Box plot of economic comparison of all scenarios with two different electricity pricing modes in 2025, 2030, and 2035.
According to the data in this section, Scenario 1, which lacks the integration of distributed energy sources, has the highest carbon tax costs. As a result, the total annual cost of Plan 1 is projected to increase in both 2030 and 2035.
With the reduction in fuel cell system costs and hydrogen fuel costs, as clearly shown in Table 20 and Figure 8, the total costs of Scenarios 2 to 4 are expected to decrease in 2030 and 2035.
Under the single-rate operational model, Scenario 4 has the lowest total cost in both the 2030 and 2035 scenarios, which is 12.67% and 20.43% lower than that of Scenario 1, respectively. Under the two-part operational model, Scenario 4 again has the lowest total cost in both the 2030 and 2035 scenarios, with a reduction of 26.50% and 32.36% compared to Scenario 1.
In the context of dual carbon goals, future energy consumption may be subject to carbon tax imposition. By 2030, the carbon tax could account for approximately 3% to 4% of the total cost, and by 2035, it may represent approximately 4% to 6% of the total cost. Furthermore, the carbon tax will have the most significant impact on Scenario 1, which solely relies on the grid electricity supply.
4.4. Discussion on Limitations and Uncertainties
In this study, the proposed mathematical model and assumptions have certain limitations. First, the assumed parameters in the model, such as hydrogen production costs, equipment efficiency, and maintenance costs, are based on existing literature and industry standards. However, as market conditions and technologies evolve, these parameters may change, thereby affecting the accuracy and reliability of the model. Additionally, the scarcity of data limits the comprehensiveness of the model, particularly due to the lack of specific application cases in the field of civilian buildings, which poses challenges for model validation and adjustment.
Regarding cost estimation and future predictions, the potential uncertainties mainly arise from market fluctuations, policy changes, and technological advancements. For example, the production cost of hydrogen may be influenced by fluctuations in raw material prices and new energy policies, making future costs difficult to predict. The implementation of carbon tax policies may also affect the economic viability of hydrogen energy, complicating cost estimates.
Therefore, this study suggests that future research should enhance the continuous monitoring of market dynamics and technological advancements to timely adjust model parameters and assumptions, thereby improving the model’s applicability and predictive capability. Additionally, it is recommended to conduct more comprehensive data collection to support more accurate cost estimation and future predictions, thereby enhancing the practicality and feasibility of the research.
5. Conclusions
This study performs an economic and environmental analysis of Scenarios 1 to 4 under two pricing models. Based on the above analytical data, a quantitative and qualitative assessment of the application and development of hydrogen fuel cell IES in residential buildings can be made. The following conclusions can be drawn:
(1) High initial fuel cell system costs: Currently, due to the high cost of fuel cell systems, when the fuel cell system is only used in conjunction with the power distribution grid, the annual costs of Scenario 2 under both operational models are higher than those of other plans. However, in Scenarios 3 and 4, the integration of PV and energy storage systems leads to a significant reduction in the total annual costs of the entire IES.
(2) Cost reduction with fuel cell and distributed energy: Under the single-rate electricity pricing model, by 2030, Scenarios 3 and 4 will have annual costs that are 11.46% and 12.67% lower than Scenario 1, respectively. By 2035, Scenarios 3 and 4 will have annual costs that are 19.32% and 20.43% lower than Scenario 1, respectively.
(3) Cost reduction in the two-part electricity pricing model: Under the two-part pricing model, by 2030, Scenarios 3 and 4 will have annual costs that are 21.28% and 26.50% lower than Scenario 1, respectively. By 2035, Scenarios 3 and 4 will have annual costs that are 27.72% and 32.36% lower than Scenario 1, respectively.
(4) Economic feasibility of independent fuel cell systems: According to current policies, users with a power capacity of more than 315 kVA are required to adopt the two-part pricing model. As the cost of fuel cell systems and hydrogen fuel usage decreases, by 2035, the total annual cost of Scenario 2 under the two-part pricing model will be lower than that of Scenario 1, indicating that fuel cells may become viable for independent use.
(5) Future potential of fuel cells: Based on the analysis of the future prospects of fuel cells, it is concluded that configuring fuel cell systems with a certain proportion of PV and energy storage in combination can effectively reduce total annual costs and facilitate the promotion and adoption of fuel cells.
Future research should continue to focus on changes in policies and market mechanisms to promote the widespread use of hydrogen fuel cells. Additionally, optimizing hydrogen production, storage, and transportation technologies, as well as strengthening overall energy management strategies, will be key to improving system efficiency and reliability. These efforts will lay the foundation for the commercialization of hydrogen fuel cells in fields such as buildings, power generation, and energy storage.
Author Contributions
H.J.: Provided the research concept, drafted the initial manuscript, and reviewed and edited the paper. J.W.: Supervised the research and reviewed and edited the paper. Y.W.: Contributed to the conceptualization and reviewed and edited the paper. Y.R.: Reviewed and revised the paper. Y.G.: Modified and revised the paper. F.Q.: Modified and revised the paper. X.X.: Modified and revised the paper. C.J.: Modified and revised the paper. X.D.: Contributed to data analysis and modified and revised the paper. All authors have read and agreed to the published version of the manuscript.
Funding
This research was funded by the Science and Technology Commission of Shanghai Municipality grant number 21DZ1208800.
Data Availability Statement
All data reported in this article are disclosed within the manuscript. Readers can refer to the relevant information in the text. For specific inquiries, please feel free to contact the authors.
Conflicts of Interest
Haikui Jin, Jian Wang, Ying Wang, Xiaoyan Xu, Chen Ju, and Xun Dong are affiliated with Tongji Architectural Design (Group) Co., Ltd. All authors have no potential conflicts of commercial interest.
References
- Boretti, A.; Pollet, B.G. Hydrogen economy: Paving the path to a sustainable, low-carbon future. Int. J. Hydrogen Energy 2024, 93, 307–319. [Google Scholar] [CrossRef]
- Cheekatamarla, P. Hydrogen and the global energy transition—Path to sustainability and adoption across all economic sectors. Energies 2024, 17, 807. [Google Scholar] [CrossRef]
- Evro, S.; Oni, B.A.; Tomomewo, O.S. Carbon neutrality and hydrogen energy systems. Int. J. Hydrogen Energy 2024, 78, 1449–1467. [Google Scholar]
- Yusaf, T.; Laimon, M.; Alrefae, W.; Kadirgama, K.; Dhahad, H.A.; Ramasamy, D.; Kamal, M.; Yousif, B. Hydrogen energy demand growth prediction and assessment (2021–2050) using a system thinking and system dynamics approach. Appl. Sci. 2022, 12, 781. [Google Scholar] [CrossRef]
- Okundamiya, M.S. Size optimization of a hybrid photovoltaic/fuel cell grid connected power system including hydrogen storage. Int. J. Hydrogen Energy 2021, 46, 30539–30546. [Google Scholar] [CrossRef]
- Gao, Y.; Matsunami, Y.; Miyata, S.; Akashi, Y. Multi-agent reinforcement learning dealing with hybrid action spaces: A case study for off-grid oriented renewable building energy system. Appl. Energy 2022, 326, 120021. [Google Scholar]
- Okundamiya, M.S. Integration of photovoltaic and hydrogen fuel cell system for sustainable energy harvesting of a university ICT infrastructure with an irregular electric grid. Energy Convers. Manag. 2021, 250, 114928. [Google Scholar]
- Fernandes, M.D.; Bistritzki, V.; Domingues, R.Z.; Matencio, T.; Rapini, M.; Sinisterra, R.D. Solid oxide fuel cell technology paths: National innovation system contributions from Japan and the United States. Renew. Sustain. Energy Rev. 2020, 127, 109879. [Google Scholar] [CrossRef]
- Trencher, G.; Taeihagh, A.; Yarime, M. Overcoming barriers to developing and diffusing fuel-cell vehicles: Governance strategies and experiences in Japan. Energy Policy 2020, 142, 111533. [Google Scholar]
- Gao, Y.; Matsunami, Y.; Miyata, S.; Akashi, Y. Operational optimization for off-grid renewable building energy system using deep reinforcement learning. Appl. Energy 2022, 325, 119783. [Google Scholar]
- Yue, M.; Lambert, H.; Pahon, E.; Roche, R.; Jemei, S.; Hissel, D. Hydrogen energy systems: A critical review of technologies, applications, trends and challenges. Renew. Sustain. Energy Rev. 2021, 146, 111180. [Google Scholar]
- Nnabuife, S.G.; Hamzat, A.K.; Whidborne, J.; Kuang, B.; Jenkins, K.W. Integration of renewable energy sources in tandem with electrolysis: A technology review for green hydrogen production. Int. J. Hydrogen Energy 2024, 107, 218–240. [Google Scholar]
- Asif, U.; Schmidt, K. Fuel cell electric vehicles (FCEV): Policy advances to enhance commercial success. Sustainability 2021, 13, 5149. [Google Scholar] [CrossRef]
- Ren, X.; Wang, Y.; Liu, A.; Zhang, Z.; Lv, Q.; Liu, B. Current progress and performance improvement of Pt/C catalysts for fuel cells. J. Mater. Chem. A 2020, 8, 24284–24306. [Google Scholar]
- Chen, D.; Pei, P.; Li, Y.; Ren, P.; Meng, Y.; Song, X.; Wu, Z. Proton exchange membrane fuel cell stack consistency: Evaluation methods, influencing factors, membrane electrode assembly parameters and improvement measures. Energy Convers. Manag. 2022, 261, 115651. [Google Scholar]
- Lavanya, M.; Shrivastava, S.; Lakshmi, T.; Sandadi, E.R.; Gour, S.; Thomas, N.A.; Priya, S.S.; Sudhakar, K. An overview of hydrogen storage technologies–Key challenges and opportunities. Mater. Chem. Phys. 2024, 325, 129710. [Google Scholar]
- Jafari, H.; Safarzadeh, S.; Azad-Farsani, E. Effects of governmental policies on energy-efficiency improvement of hydrogen fuel cell cars: A game-theoretic approach. Energy 2022, 254, 124394. [Google Scholar]
- Zhang, L.; Yang, Y.; Li, Q.; Gao, W.; Qian, F.; Song, L. Economic optimization of microgrids based on peak shaving and CO2 reduction effect: A case study in Japan. J. Clean. Prod. 2021, 321, 128973. [Google Scholar]
- Abdelkareem, M.A.; Elsaid, K.; Wilberforce, T.; Kamil, M.; Sayed, E.T.; Olabi, A. Environmental aspects of fuel cells: A review. Sci. Total Environ. 2021, 752, 141803. [Google Scholar]
- Xu, L.; Yang, J. Carbon pricing policies and renewable energy development: Analysis based on cross-country panel data. J. Environ. Manag. 2024, 366, 121784. [Google Scholar]
- Li, Y.; Kimura, S. Economic competitiveness and environmental implications of hydrogen energy and fuel cell electric vehicles in ASEAN countries: The current and future scenarios. Energy Policy 2021, 148, 111980. [Google Scholar] [CrossRef]
- Mayyas, A.; Chadly, A.; Amer, S.T.; Azar, E. Economics of the Li-ion batteries and reversible fuel cells as energy storage systems when coupled with dynamic electricity pricing schemes. Energy 2022, 239, 121941. [Google Scholar]
- Yang, G.; Zhang, H.; Wang, W.; Liu, B.; Lyu, C.; Yang, D. Capacity optimization and economic analysis of PV–hydrogen hybrid systems with physical solar power curve modeling. Energy Convers. Manag. 2023, 288, 117128. [Google Scholar]
- Hassan, Q.; Algburi, S.; Sameen, A.Z.; Salman, H.M.; Jaszczur, M. Green hydrogen: A pathway to a sustainable energy future. Int. J. Hydrogen Energy 2024, 50, 310–333. [Google Scholar] [CrossRef]
- Jeje, S.O.; Marazani, T.; Obiko, J.O.; Shongwe, M.B. Advancing the hydrogen production economy: A comprehensive review of technologies, sustainability, and future prospects. Int. J. Hydrogen Energy 2024, 78, 642–661. [Google Scholar]
- Kanani, B.; Zahedi, A. Step toward sustainable development through the integration of renewable energy systems with fuel cells: A review. Sustain. Energy Technol. Assess. 2024, 70, 103935. [Google Scholar]
- Khan, T.; Yu, M.; Waseem, M. Review on recent optimization strategies for hybrid renewable energy system with hydrogen technologies: State of the art, trends and future directions. Int. J. Hydrogen Energy 2022, 47, 25155–25201. [Google Scholar] [CrossRef]
- Habib AR, R. A comparative study of the machine learning-based energy management system for hydrogen fuel cell electric vehicles. Future Technol. 2024, 3, 13–24. [Google Scholar]
- Ogbonnaya, C.; Hegarty, G. Manufacturing Strategies for a Family of Integrated Photovoltaic-Fuel Cell Systems. Energies 2024, 17, 4837. [Google Scholar] [CrossRef]
- Habib, A.R.R.; Butler, K. Environmental and economic comparison of hydrogen fuel cell and battery electric vehicles. Future Technol. 2022, 1, 25–33. [Google Scholar]
- Beijing Institute of Technology. Review and Outlook of Global and Chinese Carbon Markets; Beijing Institute of Technology: Beijing, China, 2025. [Google Scholar]
- China Hydrogen Energy Industry. Development Report; China Hydrogen Energy Industry: Beijing, China, 2020. [Google Scholar]
- Xie, Z.F. Hydrogen Market Price Report. Hunan Daily, 15 March 2024; p. 5. [Google Scholar]


Disclaimer/Publisher’s Note: The statements, opinions and data contained in all publications are solely those of the individual author(s) and contributor(s) and not of MDPI and/or the editor(s). MDPI and/or the editor(s) disclaim responsibility for any injury to people or property resulting from any ideas, methods, instructions or products referred to in the content. |
© 2025 by the authors. Licensee MDPI, Basel, Switzerland. This article is an open access article distributed under the terms and conditions of the Creative Commons Attribution (CC BY) license (https://creativecommons.org/licenses/by/4.0/).