Abstract
This study analyzes the influence of natural resource rents, governance indicators, and their interactions on economic growth in twelve oil-producing countries in the MENA region from 2002 to 2021. Various versions of a panel ARDL model are estimated using PMG, MG, and DFE estimators. The results suggest that natural resource rents in MENA oil-producing countries positively affect long-term economic growth when accompanied by good governance. Government effectiveness and control of corruption also contribute positively to economic growth in the long run. Furthermore, financial development is found to enhance long-term economic growth. These findings highlight the potential of natural resources to drive economic growth when supported by strong institutions. To maximize natural resource rent benefits, MENA countries should improve governance indicators such as government effectiveness, control of corruption, and rule of law. This includes enhancing civil service competence, decision implementation, and managing political pressure. Key factors include revenue mobilization, infrastructure quality, policy consistency, and penalties for corruption. Ensuring equality under the law, transparent legal processes, an independent judiciary, and access to legal remedies are crucial for effective rule of law. Additionally, MENA countries should prioritize developing non-oil sectors like tourism, industry, technology, entertainment, transportation, and communication.
1. Introduction
The relationship between governance, natural resources, and economic growth is a relevant topic for MENA countries because many of these countries are rich in natural resources, particularly oil and gas, but they face numerous social, economic, and political challenges, as seen in Sudan, Yemen, Iraq, and Libya. Research has extensively examined the impact of natural resource rents on economic growth and the phenomenon known as the “resource curse”, as highlighted by [1]. Factors contributing to the resource curse include Dutch disease, pension-seeking behavior, external shocks on natural resource prices, declining institutional quality, and insufficient investment in human capital. Dutch disease, caused by natural resource income and currency appreciation, can harm other sectors. Governments’ inaction during resource booms can hinder economic reforms. Pursuing income in resource-rich countries may lead to corruption and inefficiency. Without effective institutions, economic actors tend to engage in rent-seeking behavior, while politicians are free to pursue self-serving agendas to maintain power, ultimately hindering economic growth [2]. The volatility of natural resource prices creates uncertainty, affecting factor accumulation. The influence of resource wealth on economic growth is closely tied to institutional development. Weak institutions can result in overexploitation and poor resource allocation, while strong institutions can mitigate these negative effects. Therefore, the presence of abundant resources affects economic growth through various channels, with institutional quality being a critical factor [3]. Good institutions play a key role in creating markets by safeguarding property rights, ensuring contract integrity, and maintaining law and order. This environment fosters business and private investment. Institutions significantly impact investments in physical and human capital, technology, and industrial production. They are crucial for economic growth and resource distribution.
Research on the “resource curse” phenomenon, based on the work of [1], investigates the slow economic growth experienced by resource-rich countries. Factors like institutional quality and human capital play a crucial role in determining the impact of resource dependence on economic development. Some studies suggest that countries with strong institutions and human capital can benefit from their resources, while others argue that resource abundance often hinders development in developing nations. Countries like Botswana, Canada, and Norway have effectively managed their resources to achieve sustainable development [3,4]. Before the 1980s, natural resources were viewed as advantageous, but their overreliance could weaken institutional capacity and lead to mismanagement. Although resource-rich countries tend to have lower economic growth rates, success stories like Norway demonstrate that natural resources can indeed contribute to development. Good governance is vital to prevent the negative effects of resource abundance and maximize the economic benefits of natural resources [5].
Studies since the 1980s have highlighted a negative correlation between economic growth and natural resource abundance in developing countries, sparking debates on the resource curse. These studies primarily focus on the slow growth of resource-rich nations while overlooking the impact of governance. Many oil-dependent developing countries exhibit poor governance, which is a key factor in the resource curse. Research emphasizes the importance of institutions in addressing the challenges posed by resource abundance. In his work, [6] defines the resource curse as the struggle faced by resource-rich countries in achieving economic development comparable to that of less resource-endowed nations. This paradox underscores that natural resource wealth does not automatically translate into sustainable economic growth. Issues such as corruption and weak law enforcement are often associated with the resource curse. Sachs and Warner [7] suggest that resource-rich countries tend to have underdeveloped manufacturing sectors, hindering overall economic growth due to the influence of resource rent-driven interest rate behavior.
In resource-rich countries, institutional weakness is a concerning reality that contributes to unsustainable growth cycles by leading to the misallocation of revenue toward unproductive activities. This overreliance on natural resource income can negatively influence the country’s institutional framework and hinder economic growth in the long term. Many resource-rich countries have recognized this issue and have implemented significant institutional reforms to address it. Countries like Norway and Botswana have effectively managed their natural resources to achieve high growth rates by investing in productive projects and maintaining transparency in their operations. Lessons from these countries highlight the importance of efficient resource management and institutional reforms for sustainable economic development [3]. Similarly, [8] emphasize the importance of effective management of natural resource revenues through good governance and quality institutions, particularly about property rights influenced by historical institutions. Institutional reforms and good governance are crucial for resource-rich countries to achieve sustainable economic growth. However, some oil-producing countries in the MENA region face challenges due to their heavy dependence on oil and gas exports. Countries such as Saudi Arabia and the UAE have effectively implemented diversification strategies, whereas Yemen and Iraq are facing challenges due to political instability and weak institutions. The Saudi government was one of the first in the region to prioritize economic diversification in its development goals, as outlined in the 1970 five-year plan. Despite initial efforts, the government shifted back to relying on oil revenues after oil price crises. However, the shale oil and gas revolution in 2014 prompted a renewed focus on diversification. The country’s tenth development plan in 2015 and the National Transformation Plan: Vision 2030 in 2016 aimed to diversify away from the oil sector. To reduce reliance on oil revenues, the government introduced Value Added Tax (VAT) in 2018 as part of its diversification strategy. The UAE has transformed into the most diversified economy in the region, reducing its reliance on the oil sector for GDP growth and government revenue. Initiatives like Vision 2021 have focused on developing the UAE as a global financial, business, and tourist hub, making it the fastest-growing investment destination in the Middle East. The government has introduced indirect taxes like VAT and excise taxes to generate non-oil revenues [9].
Falling oil prices, reduced spending, and slow economic growth threaten these countries. If oil prices remain low, they may experience significant losses in oil royalties, leading to reduced budget surpluses or deficits in some cases. Despite the recognition of the need for precautionary measures to manage oil price fluctuations, even countries with substantial reserves could face depletion if prices continue to decline. Weak governance and institutional structures in these countries exacerbate the challenges they face, limiting policymakers’ ability to respond effectively to the crisis [5,10,11].
This study investigates how natural resource rents, governance indicators, and their interactions affect economic growth in 12 oil-producing countries in the MENA region from 2002 to 2021. The countries included in the study are Algeria, Bahrain, Iraq, Iran, Kuwait, Libya, Oman, Qatar, Saudi Arabia, the United Arab Emirates, Sudan, and Yemen. The study aims to address the following questions: (i) What is the influence of natural resource rents on economic growth in the 12 oil-producing countries in the MENA region? (ii) What is the impact of governance indicators on economic growth in the 12 oil-producing countries in the MENA region? (iii) How do interactions between natural resource rents and governance indicators affect economic growth in the 12 oil-producing countries in the MENA region?
By analyzing the relationship between resource revenues and economic growth, particularly in the context of governance quality, we aim to shed light on the role of governance in economic performance. This study is innovative in two ways. Firstly, it considers the entire natural resources sector, not just oil, and incorporates governance indicators. Various panel ARDL models are used to ensure the reliability of the findings. Given the significant reliance on natural resources in MENA countries, further research is needed. Secondly, this analysis seeks to enhance understanding by including governance indicators and their interactions with natural resource rents as explanatory variables for economic growth. This study is the first to consider these interactions in MENA countries. By exploring this relationship, new sub-mechanisms linking governance indicators and economic growth may be revealed. The declining resources and slow economic growth in MENA oil-producing countries highlight the importance of effective strategies for institutional development and economic growth, particularly in the context of ongoing economic diversification efforts in the region. Additionally, incorporating governance indicators into the analysis of the relationship between natural resource rents and economic growth in a resource-rich region like MENA is crucial and can serve as a valuable point of reference. Furthermore, this study has the potential to contribute to the current body of literature.
The importance of studying the relationship between natural resource rents, governance, and economic growth stems from the fact that previous studies have shown contrasting outcomes. Some countries experience positive effects of resource wealth (e.g., [11,12,13,14]) while others face negative impacts (e.g., [15,16,17]). Therefore, it is crucial to understand the role of governance in moderating these effects.
2. Literature Review on the Relationship Between Natural Resource Rents, Governance, and Economic Growth
2.1. A Theoretical Review of the Link Between Natural Resource Rents, Governance, and Economic Growth
Research on resource plagues now emphasizes policy implications and the negative consequences of relying on natural resources. Countries that are abundant in natural resources typically experience slower economic growth compared to those that have fewer resources [18]. The Dutch disease theory connects the increase in natural resources to exchange rate effects, suggesting that commodity booms can lead to a stronger real exchange rate, reducing the competitiveness of traditional export and import sectors. Critics argue that policymakers can address these issues, but there is no consensus. Another concern is the terms of trade in commodity exports, where volatility in global markets can disrupt export earnings and hinder economic growth. Additionally, during economic booms, resource-rich countries often overspend, leading to excessive debt and inefficient investment, ultimately harming economic performance. Recent research emphasizes the importance of institutional quality in linking resource dependence to poor economic outcomes. Strong institutions are essential for long-term economic development, but many resource-rich countries lack effective institutional mechanisms, hindering regulatory oversight and public policy improvements. The quality of institutions is considered an important intermediary between natural resource wealth and economic growth. Van der Ploeg [19] has shown how an abundance of resources can stimulate economic growth through mechanisms such as exchange rate appreciation, loss of learning by doing, poor institutional quality, authoritarian structures, and corruption that can result in negative effects, retirement-seeking behaviors, and ineffective policies. He also discussed strategies that countries can implement to mitigate these negative effects and turn resource wealth into a blessing.
Natural resource rents are often used to fund public spending on infrastructure, telecommunications, healthcare, and education, which can support economic growth. However, excessive reliance on these rents can have negative effects, especially in the presence of institutional deficiencies [20]. Economists argue that resource rents may divert entrepreneurs from productive activities towards rent-seeking behavior, hindering economic development. Moreover, the abundance of natural resources can create structural distortions that impede growth, such as higher real wages and exchange rate appreciation, which can reduce competitiveness in non-resource sectors. Additionally, resource-rich countries may struggle with low human development, poverty, and inequality due to limited policy flexibility. Dependence on natural resources can weaken institutions and lead to market failures, further constraining economic potential [21].
Resource-rich countries often encounter issues like quota hunting, political instability, and corruption, which can result in economic stagnation, political unrest, and a lack of accountability. Corruption fueled by resource rents impedes economic growth and promotes unproductive behavior. Ineffective allocation of public funds and a lack of accountability exacerbate the situation. Countries with strong institutions are more resilient to these challenges, while those with weak governance systems struggle to effectively manage their resources [5]. Ultimately, corruption and political conflicts in resource-rich countries impede economic development and the delivery of quality public services to their citizens. In resource-rich countries with weak institutions, ruling elites often exploit resources for personal gain without oversight or efforts to enhance regulation. Strong institutions that hold politicians accountable can prevent this misuse of resources for political gain [22]. Transparency is essential to mitigate the adverse effects of resource wealth, safeguard public finances, and build trust in government. Institutional reforms, including protecting property rights and implementing anti-corruption measures, are vital to prevent the resource curse and foster economic development. In conclusion, both natural resource rents and weak institutions cause the resource curse. Effective resource management and robust institutional frameworks are crucial for sustainable development. Countries with low corruption, a strong rule of law, and democratic institutions can better handle natural resource wealth and enhance fiscal outcomes. Economic diversification is key for resource-rich nations to prevent the resource curse and foster prosperity [23].
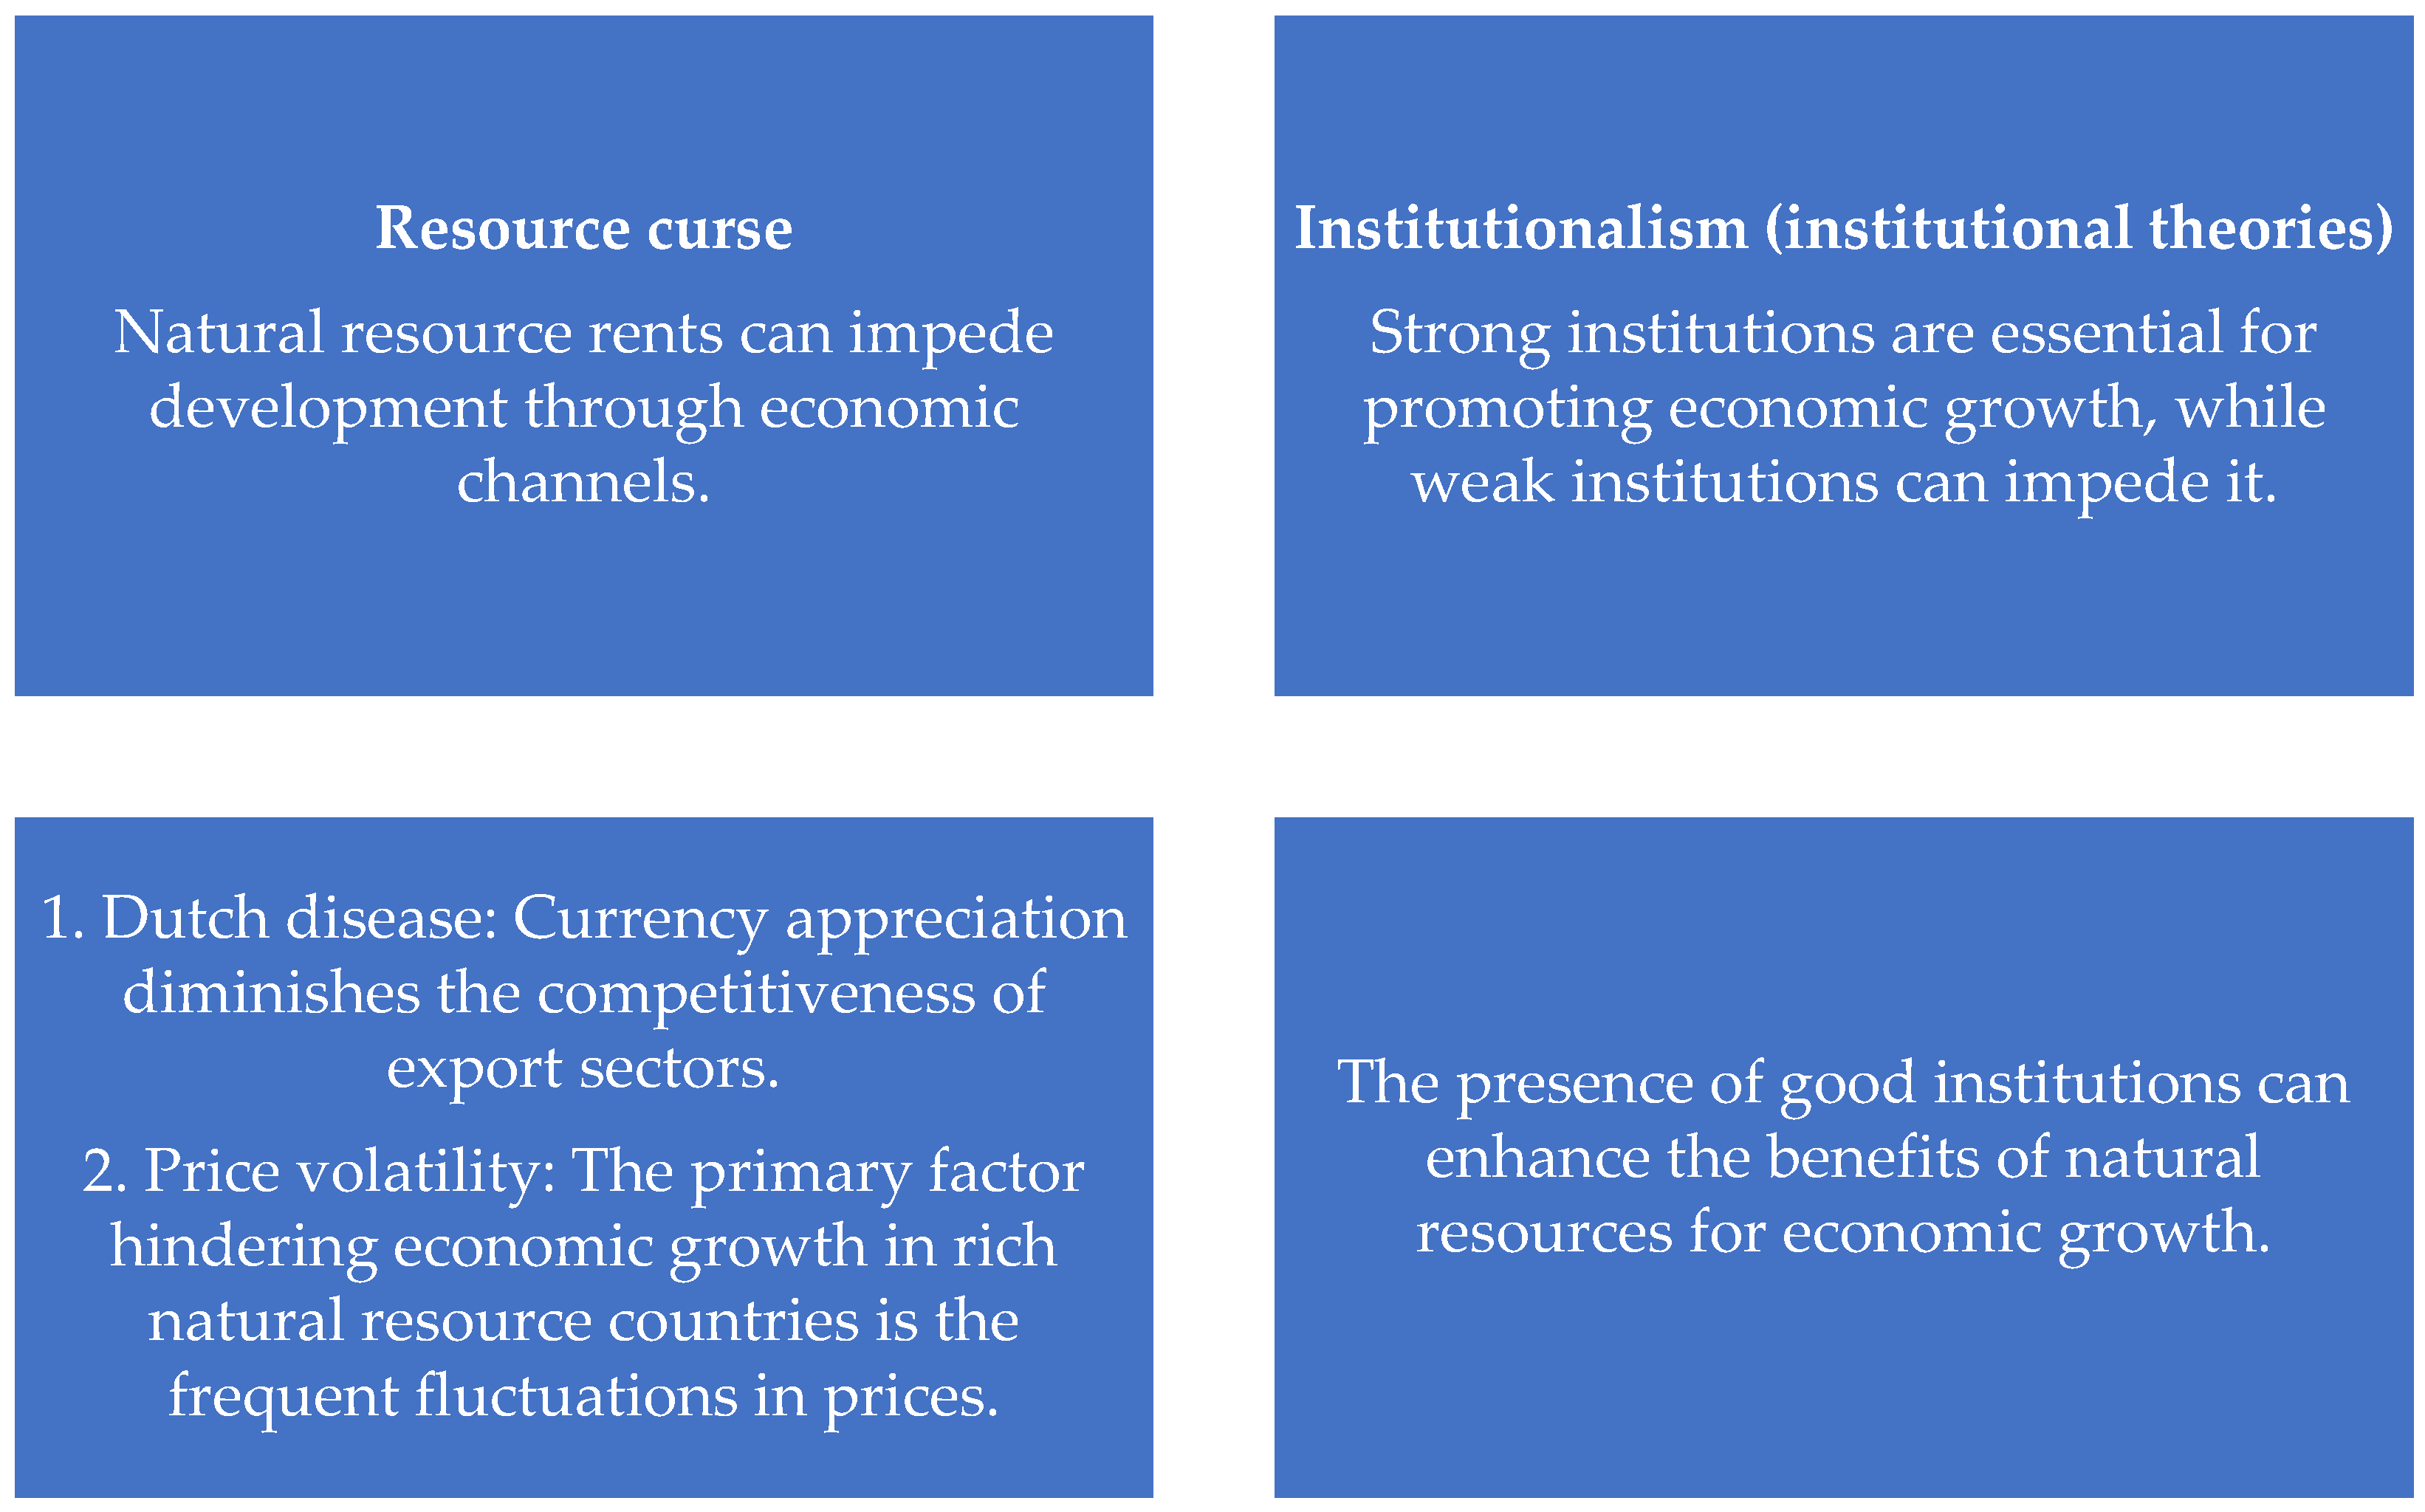
Overall, uncertainties regarding the direct economic impact of resource abundance led several authors to explore a potential hidden mechanism through which natural resources could influence economic growth. While the macroeconomic perspective focused on issues like “Dutch disease” and price fluctuations, an alternative approach emerged, highlighting institutional deficiencies as the primary barrier to growth in resource-rich economies. It is crucial to distinguish between the two branches of thought within the institutional framework. One branch, rooted in the “resource curse” theory, views natural resource abundance as a driver of institutional decay and corruption among the ruling elite, ultimately hindering economic growth. The other branch, known as “institutionalism”, also underscores the importance of institutions, but posits a different causal relationship: countries with abundant natural resources are not inherently cursed with weak institutions, but rather weak institutions themselves impede economic growth. To illustrate these perspectives on resource economics, we present a visual representation shown in Figure 1 [24] (Kaznacheev, 2013).
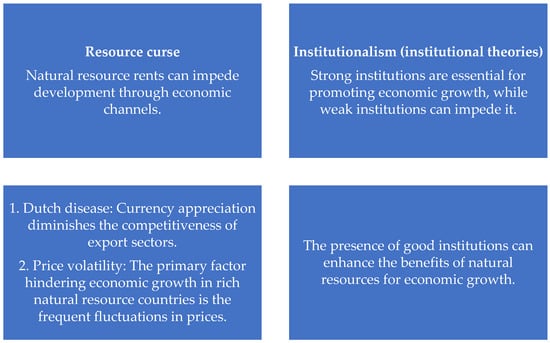
Figure 1.
Resource curse and institutionalism. Source: Own construction based on [24].
2.2. Review of Empirical Studies
The existing literature in this research area focuses on the impact of natural resource rents and the quality of institutions on economic growth. The importance of institutional quality in determining the impact of natural resource rents has been widely acknowledged in the literature. Alayli [25] argued that the issue lies not with the natural resources themselves, but with the lack of good governance. By enhancing the transparency of resource payments from firms to governments, improving government transparency in managing resource revenues, and regulating the trade of high-risk resources, income generated from these natural resources can be utilized to promote growth and development. Empirical studies have shown that the impact of resource leasing on economic growth varies depending on the level of institutional development [11,12,13,26,27,28,29]. This section presents research on the relationship between natural resource ownership, economic growth, and institutional quality in different countries.
Economists are debating the impact of natural resource dependence on development. Sarmidi et al. [13] found that natural resources could positively affect economic growth when combined with good institutional quality. Apergis and Payne [30] studied the relationship between oil wealth and economic growth in MENA countries, noting improvements in institutions and economic reforms. Brunnschweiler [12] found a positive correlation between natural resource revenues and economic growth, especially with strong institutions. Karimu et al. [26] discovered that resource rents can boost public investments in sub-Saharan Africa, depending on political institutions. Arin and Braunfels [27] emphasized the importance of institutional quality in the impact of oil revenues on long-term economic growth. Nasir and Redmond [14] studied the effects of natural resource revenues, international trade, financial development, trade opening, and institutional quality on economic growth and human development index, showing a positive effect on economic growth but a negative impact on human development. Belaid et al. [11] discovered that the resource-blessing hypothesis applies to MENA countries regardless of their democratic status. They also found that the presence of a military officer as the chief of state is a key factor in determining whether the resource curse is evident. Specifically, their research revealed that countries with military leaders experience the resource curse, as oil rents do not contribute to economic growth.
Leite and Weidmann [31] found no direct link between commodity prices and economic growth, but they did identify an indirect impact of corruption hindering growth when analyzing the effect of natural resource rents on economic growth in resource-rich countries from 1970 to 1990. Papyrakis and Gerlach [15] also explored the resource curse hypothesis and discovered that natural resources can hurt growth in isolation, but have a positive impact when considering factors like corruption, investment, and education. Olomola [16] suggested that oil-exporting countries in Africa have been affected by the resource curse, analyzing the impact of oil rents on economic growth in African oil-exporting countries from 1970 to 2000 and highlighting the negative effects of factors such as lack of democracy and weak institutions. Vandycke [32] provided evidence on how natural resources influence physical capital development in Eurasian economies, emphasizing the challenges posed by weak institutions and inadequate management of public investment processes. Jalloh [33] argued that natural resources do not always lead to economic growth in resource-rich countries. Eregha and Mesagan [34] examined how institutional quality affects economic growth in oil-rich African countries, finding limited impact. Mohtadi [17] explored the relationship between natural resource returns and quality-adjusted human capital, revealing a negative association in both developed and developing countries.
Antonakakis et al. [35] used a vector-based autoregressive approach to study the impact of oil dependence on economic growth in 76 countries from 1980 to 2012. They emphasized considering the endogenous nature of institutions and the influence of political institutions on the relationship between resource dependence and economic growth. The study suggests that in countries with weak political institutions, oil dependency may not lead to improved economic performance, underscoring the significance of understanding the interplay between natural resources and macroeconomic outcomes within the context of institutional quality. El-Anshasy et al. [36] analyzed the impact of oil revenue and its volatility on economic growth, as well as the influence of institutions on this relationship using the ARDL method. The study covered the period 1961–2013 for 17 major oil-producing countries. The findings indicated that oil revenue volatility has a significant negative impact on economic growth, while a higher growth rate of oil revenue positively affects economic growth. Additionally, the study suggests that good institutions can help mitigate the adverse effects of oil revenue volatility. The combination of volatile oil revenues and inadequate governmental responses contributes to the resource curse phenomenon. Amini [37] examined the effects of resource and institutional wealth on economic growth in developed and underdeveloped countries, finding no significant impact. Dwumfour and Ntow-Gyamfi [38] discovered that institutional quality could offset the negative impact of resource rents on financial development in African nations. Abdulahi et al. [39] identified institutional quality thresholds that establish a positive link between resource rents and economic growth in sub-Saharan Africa. In a study conducted by [40], the impact of mineral resource dependence on human development and economic growth in ten rich natural resource African countries was analyzed. The study revealed a weak negative correlation between human development growth and the proportion of mineral rents. The authors suggested that despite an increase in resource rents, economic growth is hindered by institutional weaknesses and corruption.
Hassan et al. [41] andEpo and Faha [28] emphasized the role of institutional quality in mitigating the effects of natural resources on economic growth. Mohammed et al. [42] discussed the influence of oil revenues on economic growth in oil-producing countries, highlighting the importance of both public and private investments for economic development. Matallah [10] studied the relationship between oil rents and economic growth in 11 MENA oil-exporting countries from 1996 to 2017. The study used various statistical methods to analyze the data. The findings indicate that oil revenues have a significant positive impact on the economic growth of MENA oil exporters. However, these revenues were found to be resource-dependent. The study also highlights the importance of governance in revenue diversification, as oil rents tend to discourage economic diversification efforts by promoting income-focused activities. Motameni [43] examined how oil rents affect economic growth in oil-rich countries with overvalued currencies and weak institutions. The study found that oil rents have a detrimental impact on economic growth in countries with poor institutional quality. Belarbi et al. [44] investigated the connection between oil dependence, institutional quality, and economic growth, emphasizing the non-linear relationship and the crucial role of institutions in shaping economic outcomes in oil-dependent nations. Sun and Wang [45] explored the relationship between natural resources, environmental pollution, and economic growth in China, revealing a negative impact of natural resources on environmental pollution and economic growth, known as the “resource curse”.
In a recent study, [46] studied the impact of governance on physical infrastructure development in 15 MENA countries by using natural resource rent for public investment. Their findings indicate that enhancing governance quality has a positive influence on physical infrastructure development in the MENA region. The research shifts away from conventional arguments about the curse of natural resource rent and focuses on the relationship between natural resource rent, good governance, and infrastructure development. The results highlight the importance of natural resource rent and governance in infrastructure development. More recently, [29] examined the impact of natural resources on sustainable economic development in eight resource-rich countries in sub-Saharan Africa from 1981 to 2017. This study included public debt as an explanatory variable to assess its impact on economic growth. Using the NARDL threshold test and Granger asymmetric causality tests, the researchers found that commodity prices had varying effects on economic development in different countries. Equatorial Guinea had a positive impact, while the Republic of the Congo had a negative one, supporting the resource theory. The study recommended improved public debt management and institutional enhancements to support economic development in resource-rich countries. Similarly, [47] studied the impact of natural resources on human development, emphasizing the role of governance. Analyzing data from 44 major commodity-exporting countries from 1990 to 2021, the study found that oil and gas prices supported the resource-richness hypothesis, while coal prices supported the neutral hypothesis. Good governance was found to have a positive effect on human development. The study revealed a mix of blessing and curse of resources outcomes across countries, highlighting the importance of governance for utilizing resource wealth effectively to promote inclusive growth and human development. In their study, [48] employed machine learning techniques to examine governance in countries with abundant oil resources. By applying Principal Components Analysis and K-clustering, the researchers categorized countries into six groups based on indicators of good governance. The findings of the study provide evidence in support of the resource curse theory, underscoring the connection between governance quality and the management of natural resources. To mitigate this issue, countries that rely on oil production should establish clear and transparent regulations for managing resource revenues and prioritize economic diversification.
In summary, effective corporate governance is essential for oil-producing countries to effectively manage their economy. This includes implementing transparent and responsive practices, such as clear decision-making processes, contracts, and revenue streams, to prevent corruption and ensure that energy resources benefit the public. Accountability mechanisms must be established to hold government officials and industry stakeholders accountable for their actions. Sustainable energy production is crucial for future generations to benefit from resources and income. Comprehensive planning, regulations, and supervision are necessary for responsible and sustainable resource extraction. Revenue management is critical for collecting, allocating, and effectively utilizing revenues from natural resource exploitation to prevent economic volatility, corruption, and social unrest. Stakeholder engagement is vital in energy governance to ensure that policies are inclusive, transparent, and meet societal needs. Governance indicators provide valuable insights into governance practices, policies, and regulations in the energy sector, helping to identify strengths and weaknesses in governance structures [49].
Further empirical research is needed to deepen understanding of the impact of resource abundance on economic growth in the MENA region. The role of institutional quality in connecting resources, governance, and growth in MENA countries warrants further investigation to comprehend the effects of resource abundance on economic growth in a weak institutional setting. It is proposed that resource abundance may impede economic growth in the absence of strong institutions, exacerbating governance challenges. Testing this hypothesis could offer valuable insights into the resource curse phenomenon and its implications for economic performance in the MENA region. This study expands the scope by examining the impact of total natural resource rents on economic growth within institutions, particularly in major oil-producing countries in the MENA region.
3. Data Presentation and Methodology
3.1. Overview of Data Utilized
This section provides an overview of the data, including the source, format, and any relevant details that may be important for understanding and analyzing the data. The study examines how natural resource rents and governance quality affect economic growth in 12 oil-producing MENA countries (Algeria, Bahrain, Iraq, Iran, Kuwait, Libya, Oman, Qatar, Saudi Arabia, Sudan, United Arab of Emirates, and Yemen) from 2002 to 2021. The definitions of the different variables used in this study are presented in Table 1. Real GDP per capita is used as a measure of economic growth. It is important to mention that only the major oil-producing countries in the MENA region were included in the analysis, based on data availability. The chosen period of 2002 to 2021 was determined by the availability of governance indicators data. In our analysis of the impact of natural resource rents and governance on economic growth, we focused on the variables GDP per capita (GDPC) expressed in constant 2015 USD, natural resource rents as a share of GDP (NRR), and governance indicators including control of corruption (CC), regulatory quality (RQ), rule of law (RL), government effectiveness (GE), political stability and absence of violence (PS), and voice and accountability (VA). Control of corruption measures the extent to which individuals use public power for personal gain, while rule of law assesses the level of confidence in and adherence to societal rules. Government effectiveness is assessed based on the quality of public services, the competence of civil services and their autonomy from political influence, and the effectiveness of policy development. Political stability and the absence of violence are evaluated based on the likelihood of a government being overthrown through unconstitutional or violent means, including terrorism. Regulatory quality is determined by the government’s ability to implement effective policies and regulations that support private sector growth. Voice and accountability are determined by the level of citizen participation in government elections and citizens’ access to freedom of expression, association, and media. The governance indicators range from −2.5 to 2.5, with higher positive values indicating better performance (the Worldwide Governance Indicators compile data reflecting opinions on governance quality from enterprise, citizen, and expert survey participants in industrialized and developing nations. The data are sourced from various survey organizations, think tanks, non-governmental organizations, international bodies, and private companies.). The control variables include domestic investment (DI), represented by gross fixed capital formation as a percentage of GDP, foreign direct investment as a share of GDP (FDI), and financial development (FD). Financial development is represented by domestic credit provided by the financial sector as a percentage of GDP. The data used in this study are obtained from the online database of the World Development Indicators [50] of the World Bank. The variables are all log-transformed, except for the governance indicators and FDI, which can have negative values. Table 2 reports descriptive statistics for the various variables within the chosen sample of MENA countries, with a distinction made between Gulf Cooperation Council (GCC) countries and non-GCC countries. A first glance at the statistics in Table 2 indicates that the Gulf countries outperform other MENA countries in terms of economic indicators and governance indicators. The data show that economic indicators are higher on average in GCC countries compared to both the overall sample and non-GCC countries. Similarly, governance indicators are also higher in GCC countries than in non-GCC countries. The weakest governance indicator is voice and accountability, which could explain the low levels of citizen participation in elections and limited access to freedom of expression, association, and media in most MENA countries. The performance of Gulf countries compared to other MENA countries is evident and becomes a reality.

Table 1.
Definition of variables.
Table 2.
Descriptive statistics.
3.2. Methodology Used
Our methodology involves estimating a panel data model with annual data from 2002 to 2021 for 12 oil-producing countries in the MENA region. In this study, we used the latest available data. However, our research is limited by the narrow study period from 2002 to 2021, as governance indicators are only available for this timeframe for the countries we examined. We consider variables like per-capita GDP, natural resource rents, governance indicators, domestic investment, and financial development. The methodology includes assessing cross-dependence for heterogeneity, testing stationarity with panel-unit-root tests, examining co-integration between variables, and estimating the panel data model using various techniques. When analyzing relationships in a panel data model, it is crucial to consider cross-sectional dependency (CSD), where a shock in one country can affect others due to economic links. Verifying CSD is essential in panel analysis. The Lagrange multiplier (LM) CSD tests by [51] and [52] are commonly used. However, these tests may be biased if group averages are zero and individual averages are not. Pesaran et al. [53] developed the bias-corrected LM scale test to address this issue. This test determines independence or cross-sectional dependence between series. The null hypothesis of the bias-corrected LM test suggests independence, while the alternative hypothesis suggests dependence.
Pesaran [54] introduced a panel unit root test that accounts for cross-sectional dependence in the data. This test extends the traditional Dickey Fuller (DF) or augmented Dickey Fuller (ADF) regressions by including cross-sectional averages. New asymptotic results are derived for both the ADF statistics within individual cross-sections (CADF) and their simple averages. Pesaran [54] also introduced the cross-sectional augmented IPS (CIPS) statistic, which involves averaging the individual CADF test statistics across the entire panel. The null hypothesis of the CIPS test is that each cross-section of the panel is non-stationary, and the test follows an asymptotically normal distribution. Panel unit root tests are used to assess the stationarity of a series. When examining multivariate relationships, it is crucial to determine if a specific set of variables is cointegrated. Cointegration in time series analysis implies that if a group of variables are individually integrated of order one, certain linear combinations of these variables may be stationary. The vector of slope coefficients in this case is referred to as the cointegration vector. Panel cointegration can be confirmed using the [55] panel cointegration test. Once the cointegration relationship is identified, it can be estimated using the panel ARDL method. This approach helps us avoid spurious results that may arise from simpler methods like OLS. Additionally, macroeconomic variables are often non-stationary at levels but tend to be stationary at their first difference. This dynamic model includes lag-dependent variables as explanatory factors. Therefore, we opt for the heterogeneous dynamic panel data model. The panel ARDL model is preferred over other dynamic panel models that require variables to have the same integration order. This model is particularly efficient for small sample sizes. It offers the advantage of estimating short-term and long-term parameters simultaneously, accommodating variables with different integration orders. Moreover, the panel ARDL model addresses endogeneity issues and provides unbiased long-run estimates and test statistics. It also incorporates short-run adjustments to long-run equilibrium without sacrificing long-run insights. By selecting the appropriate lag order, multicollinearity concerns can be mitigated [56,57].
In this study, the model we developed connects natural resource rents, governance indicators, financial development, foreign direct investment, and domestic investment to GDP per capita in the following way:
By converting Equation (1) into its logarithmic form and specifying it for time series on panel data, we derive the following equation:
where the index i (i = 1, 2, … 12) denotes the country i in the selected sample, t (t = 2002, …, 2021) denotes the time period. All variables are anticipated to positively influence economic growth. Natural resources rents may have varying effects on economic growth in the sample, with some studies showing a negative relationship between natural resource rents and economic growth. However, proper allocation of resources could lead to a positive impact on economic growth. Governance institutions are also expected to have a positive influence on economic growth. Domestic investment is likely to contribute positively to economic growth by boosting output and incomes. Financial development is expected to support economic growth by facilitating project financing and economic activities.
The following equation represents the panel ARDL model to be estimated:
From Equation (3), we derive the panel ARDL error correction model as follows:
where is the coefficient of the speed of adjustment ( represent the long run effects of independent variables. The variable, ECT = is the error correction term; and represent the coefficients of short-term dynamics; r indicates the optimal lag for the dependent variable; s indicates the optimal lag orders for the regressors; represents the country specific effects; and denotes the residual term.
We estimate the panel ARDL model using the Pooled Mean Group (PMG), Mean Group (MG), and Dynamic Fixed Effect (DFE) estimators to capture how variables adjust to long-term relationship dynamics. The PMG estimator is suitable for dynamic panels with more temporal observations than individuals. It assumes that the model constant, short-term coefficients, and error variances may vary between individuals, while the long-term coefficients are the same across all countries. The PMG estimator strikes a balance between the MG and DFE estimators, offering improved estimate accuracy compared to the MG estimator when assuming similar long-term coefficients. The Hausman statistical test is used to determine the most efficient estimator between PMG, MG, and DFE. Various versions of the panel ARDL model are estimated. Initially, the model is estimated without governance indicators as explanatory variables for economic growth. Subsequently, each governance variable (CC, PS, GE, RQ, RL, VA) is included in the model to assess its impact on economic growth. In the final version of the model, each governance variable is included along with its interaction with natural resource rents (CC*LNRR, PS*LNRR, GE*LNRR, RQ*LNRR, RL*LNRR, VA*LNRR) to examine the influence of natural resource rents on economic growth in the presence of governance.
4. Analysis and Discussion of Research Results
The results of the CSD tests are displayed in Table 3. They show that we reject the null hypothesis of no cross-section dependence for all variables at a significance level of 1%, except for LGDPC, GE, RL, RQ, GE*LNRR, CC*LNRR, RL*LNRR, PS*LNRR, and RQ*LNRR based on the Pesaran CD test. Overall, the findings of all tests suggest that there is cross-section dependence in the panel, indicating that a shock in one country can affect other countries in the region.
Table 3.
Results of CSD tests.
The results of the CSD unit root tests suggest that there is cross-sectional dependence present in each series. As a result, the [54] CIPS (Z(t-bar)) test for unit roots, which considers cross-sectional dependence, can be used to assess the stationarity of the series. The results of the CIPS test, presented in Table 4, show that all variables are non-stationary at their levels but become stationary after differencing, except for PS and RQ, which remain non-stationary even after differencing.
Table 4.
Results from the CIPS test.
Due to their integration orders being greater than 1, variables PS and RQ are not considered in the analysis. The focus is on investigating the cointegration relationship between LGDPC, LNRR, LDI, LFD, FDI, GE, CC, RL, VA, GE*LNRR, CC*LNRR, RL*LNRR, and VA*LNRR. We examine nine versions of the panel ARDL model. The first model (model 1) includes economic indicators (LNRR, LDI, LFD, FDI). In the second model (model 2), we introduce the variable government effectiveness (GE). The third model (model 3) adds the variable control of corruption (CC). The fourth model (model 4) includes the variable rule of law (RL). The fifth model (model 5) incorporates the variable voice and accountability (VA). In the sixth model (model 6), we include the variable GE and its interaction with NRR (GE*LNRR). The seventh model (model 7) introduces the variable CC and its interaction with NRR (CC*LNRR). The eighth model (model 8) includes the variable RL and its interaction with NRR (RL*LNRR). The ninth model (model 9) adds the variable VA and its interaction with NRR (VA*LNRR). We assess the cointegration among the variables using the panel Kao cointegration test for the nine versions of the panel ARDL model. The results of the panel Kao cointegration test for the different models are reported in Table 5. The different findings show that the null hypothesis of no cointegration is rejected, indicating a cointegration relationship among these variables for all versions of the model. This suggests that the variables are likely to move together in the long term whatever the version of the model considered.
Table 5.
Kao cointegration test results.
After confirming the cointegration among the various variables in the different models, we proceeded to estimate nine panel ARDL models to examine the impact of natural resource rents on economic growth in both the short and long run. Prior to estimating the models, we conducted the Hausman test to determine the most appropriate estimator among PMG, MG, and DFE. The results of this test are shown in Table 6. Each model has a preferred estimator that is more reliable than the others. Therefore, we used the appropriate estimator (PMG, MG, or DFE) determined by the Hausman test for each model. The results of the estimation for the first five models (models 1, 2, 3, 4, and 5) are presented in Table 7, while the results for the last four models (models 6, 7, 8, and 9) are displayed in Table 8. Based on the findings from model 1 presented in Table 7, the natural resource rents variable does not exhibit statistical significance in either the long term or short term. This suggests that natural resource rents do not influence economic growth in MENA countries, regardless of the time frame considered, when governance indicators are not included in the model. When incorporating governance indicators (GE, CC, RL, VA) into models 2, 3, 4, and 5, the results show that GE and CC have a positive and significant long-term effect on economic growth, while RL and VA do not show significance. Conversely, in the short term, both GE and CC have a negative and significant impact on economic growth, with RL and VA remaining insignificant. The short-term negative effects of government effectiveness can be attributed to the fact that it takes a considerable amount of time for improvements in the quality of public services, the competence and independence of civil services, and the efficiency of policy development to have a positive impact on economic growth, whereas short-term negative effects of corruption can be attributed to the practice of “greasing the wheels” in the short term in MENA countries. The lack of significance of VA and RL can be attributed to their minimal impact on economic growth due to their low levels. Natural resource rents have a positive and significant impact on long-term economic growth in models 2, 3, and 5, but not in model 4. In the short term, natural resource rents only have a positive and significant effect in model 3. Across all four models (2, 3, 4, and 5), natural resource rents do not exhibit a negative impact on economic growth in either the short or long term. This suggests that the resource curse theory is not supported in the context of the analyzed oil-producing MENA countries.
Table 6.
Results from the Hausman test.
Table 7.
Panel ARDL estimates for models 1, 2, 3, 4 and 5.
Table 8.
Panel ARDL estimates for models 6, 7, 8, and 9.
Our research findings support the conclusions of [30] regarding the counterbalancing effect of improvements in institutional quality on the oil curse in a sample of MENA countries from 1990 to 2013. Additionally, our results are in line with those of [35], who found that in countries with weak political institutions, oil dependency may not necessarily lead to enhanced economic growth across 76 countries categorized by income groupings and levels of development from 1980 to 2012. Furthermore, our findings are consistent with [10], who emphasized the significance of good governance in enabling oil rents to serve as a crucial funding source for diversification in MENA oil-exporting countries, as well as with the research by [14] demonstrating the positive influence of natural resource abundance and institutional quality on economic growth in a diverse group of 30 countries. Similarly, the study by [46] highlights the importance of natural resources and governance in infrastructure development and economic growth in the MENA region. However, our results differ from the findings of [37], who found that natural resource abundance and institutional factors did not significantly impact economic growth in a study of 83 countries with varying levels of development from 1996 to 2010. Additionally, the research by [11] suggested that the resource-blessing hypothesis is applicable to MENA countries regardless of their democratic status.
In the results of models 6, 7, 8, and 9 presented in Table 8, it is evident that the interaction between governance indicators (GE, CC, RL, VA) and NRR (GE*LNRR, CC*LNRR, RL*LNRR, VA*LNRR) has a positive and significant impact on long-term economic growth in models 6, 7, and 9. However, this interaction is not significant in the short term across all four models. These results indicate that in the presence of good governance, natural resource rents can contribute to long-term economic growth in the oil-producing MENA countries included in the sample. These results are consistent with previous studies by [11,12,13,14,26,27,30,47]. These studies indicate that natural resources can be a boon for economic growth when coupled with strong institutions.
For the control variables, the variable financial development is found to have a positive and significant impact on long-term economic growth in models 2, 5, 6, and 9, with a negative and significant effect only in model 8. However, in the short term, financial development has a negative and statistically significant impact on economic growth in models 2 and 5. This is due to the low competition in financial systems in the MENA region, limited capital account openness, and privatization. The results indicate that financial development may promote economic growth in MENA countries over the long term. The finding for financial development aligns with the results of [58] and can be attributed to the increased significance of windfall revenues in developing economies abundant in natural resources. The variable domestic investment shows a positive and significant impact on economic growth in three models (2, 5, and 8) out of nine, and a negative and significant impact in two models (6 and 9) in the long run. It also has a positive and significant impact on economic growth in the short run in two models (4 and 5). These results align with economic theory, which suggests that domestic investment can stimulate economic growth. Finally, among the five models (1, 2, 3, 4, and 5), it is observed that the variable FDI has a positive and significant effect on long-term economic growth only in model 5, while it has a negative and significant impact in model 2. Furthermore, FDI is not statistically significant in any of the five models in the short term. These findings suggest that FDI inflows alone may not be adequate to stimulate economic growth in MENA countries. The low levels of foreign direct investment in most MENA countries may be responsible for the negative impact, as research indicates that FDI alone does not lead to immediate economic growth.
In summary, higher natural resource rents contribute to economic growth in the MENA region, while improvements in governance indicators and financial development also play key roles in fostering economic growth. The study’s findings are robust and provide valuable insights for policymakers.
We assess the robustness of various MG, DFE, and PMG estimates in different models using the panel fully modified ordinary least squares (FMOLS) method to estimate long-run coefficients. The results of FMOLS are presented in Table 9 and Table 10. The panel FMOLS method provides results consistent with the MG, DFE, and PMG estimators across all models in the study. The study confirms that natural resource rents, financial development, and good governance positively impact economic growth in MENA oil-producing countries. These findings are robust and can be interpreted confidently.
Table 9.
Panel FMOLS estimates for models 1, 2, 3, 4 and 5.
Table 10.
Panel FMOLS estimates for models 6, 7, 8, and 9.
5. Conclusions and Policy Recommendations
The study analyzes the impact of natural resource rents and governance indicators on economic growth in 12 oil-rich MENA countries from 2002 to 2021 by estimating various panel ARDL models using PMG, MG, and DFE estimators. The results indicate that natural resource rents, government effectiveness, and control of corruption positively affect long-term economic growth. The interaction between governance indicators and natural resource rents also has a positive impact on long-term economic growth in three out of four models. However, this interaction is not significant in the short term. Overall, governance combined with natural resource rents can boost long-term economic growth in the studied countries. In the short term, natural resource rents may have a positive or insignificant effect on economic growth. Overall, the study’s findings suggest that the resource curse theory is not applicable to the MENA countries examined when governance indicators are considered. This could be attributed to the study’s more recent timeframe (2002–2021), the significant role of natural resource revenues, the enhanced quality of institutions in Gulf countries, and the economic diversification efforts primarily led by Gulf countries.
Moreover, it is shown that financial development contributes to long-term growth. Other control variables like domestic investment and FDI show mixed results, likely due to the dominance of the natural resources sector hindering diversification efforts. The study suggests that improving governance can help these countries benefit from their resource wealth, and achieve sustainable growth through the diversification of the different economic activities. Policymakers should focus on building a strategic plan with measurable goals and commit to long-term governance improvements to ensure economic resilience and prosperity for future generations.
To maximize their benefits from natural resource rents, MENA countries should enhance governance indicators like government effectiveness, control of corruption, and rule of law. This includes improving civil service competence, efficient government decision implementation, and managing political pressure. Other key factors include revenue mobilization, infrastructure quality, policy consistency, and enforcement of penalties to combat corruption. Additionally, ensuring equality under the law, transparent legal processes, an independent judiciary, and access to legal remedies is essential for the rule of law to be effective. Oil-producing countries in the MENA region can benefit from increased oil and gas revenues by saving and reforming government subsidies. This is important as fossil fuel revenues may decrease in the future. The rise in revenues also offers an opportunity for tax and fuel reforms. To reduce dependence on the oil and gas sector and enhance economic resilience, all MENA countries should expedite economic diversification efforts by bolstering various sectors to broaden revenue streams. Countries like Saudi Arabia and the UAE have successfully implemented diversification strategies, while Yemen, Libya, and Iraq face challenges due to political instability and weak institutions. Saudi Arabia prioritized economic diversification early on, as seen in its Vision 2030 initiative. The UAE has emerged as the most diversified economy in the region, reducing its reliance on oil for GDP growth and government revenue [9]. MENA countries should focus on developing non-oil sectors like tourism, industry, technology and innovation, entertainment, transportation, and communication. Improving information and communication technology infrastructure can attract more foreign investments and drive economic growth. Infrastructure development programs support economic activities and productivity, laying the groundwork for sustainable growth with reduced dependence on natural resources. Economic diversification can help MENA countries transition from resource-dependent economies to diversified ones. Strong institutions are essential for successful diversification and overcoming the natural resources curse. Upgrading infrastructure is crucial for diversification strategies to succeed, supporting the development of key sectors and transforming the economic structure to promote growth in targeted industries. Diversifying their economies away from reliance on oil is crucial for sustainable growth. Countries like the UAE and Saudi Arabia, which have successfully diversified their economies, can serve as a model for others in the region.
Our research is limited by the short study period from 2002 to 2021, constrained by the availability of governance indicators. However, our findings provide valuable insights into MENA countries as significant oil-exporting nations. Future research could further analyze MENA countries rich in natural resources by categorizing them based on institutional quality and comparing the outcomes between those with strong and weak institutions. Additionally, future research could explore the presence of non-linear relationships to examine threshold effects, where governance needs to surpass a certain threshold to effectively mitigate the resource curse.
Author Contributions
Conceptualization, M.B. and A.A.A.; Methodology, M.B.; Software, M.B.; Validation, M.B. and A.A.A.; Formal analysis, M.B. and A.A.A.; Investigation, M.B. and A.A.A.; Resources, M.B.; Data curation, M.B.; Writing—original draft, M.B.; Writing—review & editing, A.A.A. All authors have read and agreed to the published version of the manuscript.
Funding
This research received no external funding.
Data Availability Statement
The data presented in this study are available upon reasonable request from the corresponding author. They are available and accessed through https://databank.worldbank.org/source/world-development-indicators, accessed on 28 October 2024.
Conflicts of Interest
The authors declare no conflicts of interest.
References
- Sachs, J.D.; Warner, A.M. Natural Resource Abundance and Economic Growth; NBER Working Paper No 5398; National Bureau of Economic Research: Cambridge, MA, USA, 1995. [Google Scholar]
- Gallego, J.; Maldonado, S.; Trujillo, L. From curse to blessing? institutional reform and resource booms in Colombia. J. Econ. Behav. Organ. 2020, 178, 174–193. [Google Scholar] [CrossRef]
- Singh, S.; Sharma, G.D.; Radulescu, M.; Balsalobre-Lorente, D.; Bansal, P. Do natural resources impact economic growth: An investigation of P5 + 1 countries under sustainable management. Geosci. Front. 2024, 15, 101595. [Google Scholar] [CrossRef]
- Gupta, S.; Segura-Ubiergo, A.; Flores, E. Direct Distribution of Resource Revenues: Worth Considering? IMF Staff Discussion Note SDN/14/05; International Monetary Fund: Washington, DC, USA, 2014. [Google Scholar]
- Alssadek, M.; Benhin, J. Natural resource curse: A literature survey and comparative assessment of regional groupings of oil-rich countries. Resour. Policy 2023, 84, 103741. [Google Scholar] [CrossRef]
- Elbra, A.D. The Forgotten Resource Curse: South Africa’s Poor Experience with Mineral Extraction. Resour. Policy 2013, 38, 549–557. [Google Scholar] [CrossRef]
- Sachs, J.D.; Warner, A.M. The Big Push, Natural Resource Booms and Growth. J. Dev. Econ. 1999, 59, 43–79. [Google Scholar] [CrossRef]
- Acemoglu, D.; Johnson, S.; Robinson, J.A. Reversal of Fortune: Geography and Institutions in the Making of the Modern World Income Distribution. Q. J. Econ. 2002, 117, 1231–1294. [Google Scholar] [CrossRef]
- Shadab, S. The New Arab Gulf: Evaluating the Success of Economic Diversification in the UAE. In Social Change in the Gulf Region: Multidisciplinary Perspectives; Springer: Singapore, 2023; pp. 415–430. [Google Scholar]
- Matallah, S. Economic diversification in MENA oil exporters: Understanding the role of governance. Resour. Policy 2020, 66, 101602. [Google Scholar] [CrossRef]
- Belaid, F.; Dagher, L.; Filis, G. Revisiting the resource curse in the MENA region. Resour. Policy 2021, 73, 102225. [Google Scholar] [CrossRef]
- Brunnschweiler, C. Cursing the Blessings? Natural Resource Abundance, Institutions, and Economic Growth. World Dev. 2008, 36, 399–419. [Google Scholar] [CrossRef]
- Sarmidi, T.; Law, S.H.; Jafari, Y. Resource curse: New evidence on the role of institutions. Int. Econ. J. 2014, 28, 191–206. [Google Scholar] [CrossRef]
- Nasir, M.A.; Redmond, T.S. Role of Natural Resource Abundance, International Trade and Financial Development in the Economic Development of Selected Countries. Resour. Policy 2020, 66, 101591. [Google Scholar] [CrossRef]
- Papyrakis, E.; Gerlagh, R. The Resource Curse Hypothesis and its Transmission Channels. J. Comp. Econ. 2004, 32, 181–193. [Google Scholar]
- Olomola, P.A. Oil Wealth and Economic Growth in Oil Exporting African Countries; AERC Research Paper 170; African Economic Research Consortium: Nairobi, Kenya, 2007. [Google Scholar]
- Mohtadi, H.; Ross, M.L.; Ruediger, S.; Jarrett, U. Does Oil Hinder Transparency? Working Paper; University of Wisconsin and UCLA: Madison, MI, USA, 2017. [Google Scholar]
- Saeed, K.A. Revisiting the natural resource curse: A cross-country growth study. Cogent Econ. Financ. 2021, 9, 2000555. [Google Scholar] [CrossRef]
- Van Der Ploeg, F. Natural resources: Curse or blessing? J. Econ. Lit. 2011, 49, 366–420. [Google Scholar]
- Barma, N.; Kaiser, K.; Minh, T.L.; Viñuela, L. Rents to Riches? Political Economy of Natural Resource-Led Development; World Bank: Washington, DC, USA, 2012. [Google Scholar]
- Bahar, D.; Santos, M.A. One more resource curse: Dutch disease and export concentration. J. Dev. Econ. 2018, 132, 102–114. [Google Scholar]
- Narh, J. The resource curse and the role of institutions revisited. Environ. Dev. Sustain. 2023, 27, 8187–8207. [Google Scholar]
- Tsani, S. Natural Resources, Governance and Institutional Quality: The Role of Resource Funds. Resour. Policy 2013, 38, 181–195. [Google Scholar]
- Kaznacheev, P. Resource Rents and Economic Growth: Economic and Institutional Development in Countries with a High Share of Income from the Sale of Natural Resources. Analysis and RECOMMENDATIONS Based on International Experience; Russian Presidential Academy of National Economy and Public Administration (RANEPA): Moscow, Russia, 2013. [Google Scholar]
- Alayli, M.A. Resource Rich Countries and Weak Institutions: The Resource Curse Effect. 2005. Available online: https://media.gradebuddy.com/documents/2515441/d319ae96-c107-4a15-b022-7c215478775e.pdf (accessed on 14 November 2024).
- Karimu, A.; Adu, G.; Marbuah, G.; Mensah, J.T.; Amuakwa-Mensah, F. Natural Resource Revenues and Public Investment in Resource-rich Economies in Sub-Saharan Africa. Rev. Dev. Econ. 2017, 21, 107–130. [Google Scholar]
- Arin, K.P.; Braunfels, E. The resource curse revisited: A Bayesian model averaging approach. Energy Econ. 2018, 70, 170–178. [Google Scholar]
- Epo, B.N.; Faha, N.D.R. Natural resources, institutional quality, and economic growth: An African tale. Eur. J. Dev. Res. 2020, 32, 99–128. [Google Scholar]
- Ampofo, G.M.K.; Laari, P.B.; Ware, E.O.; Shaw, W. Further investigation of the total natural resource rents and economic growth nexus in resource-abundant sub-Saharan African countries. Miner. Econ. 2023, 36, 97–121. [Google Scholar] [CrossRef]
- Apergis, N.; Payne, J.E. The oil curse, institutional quality, and growth in MENA countries: Evidence from time-varying cointegration. Energy Econ. 2014, 46, 1–9. [Google Scholar]
- Leite, C.; Weidmann, J. Does Mother Nature Corrupt? Natural Resources, Corruption, and Economic Growth. In Governance, Corruption and Economic Performance; Abed, G.T., Gupta, S., Eds.; International Monetary Fund: Bretton Woods, NH, USA, 2002; pp. 71–99. [Google Scholar]
- Vandycke, N. Natural Resources, Physical Capital and Institutions: Evidence from Eurasia. World Bank Policy Research Working Paper No. 6586. 2013. Available online: https://ssrn.com/abstract=2317130 (accessed on 5 November 2024).
- Jalloh, M. Natural resources endowment and economic growth: The West African Experience. J. Nat. Resour. Dev. 2013, 3, 66–84. [Google Scholar]
- Eregha, P.B.; Mesagan, E.P. Oil resource abundance, institutions and growth: Evidence from oil producing African countries. J. Policy Model. 2016, 38, 603–619. [Google Scholar]
- Antonakakis, N.; Cunado, J.; Filis, G.; De Gracia, F.P. Oil dependence, quality of political institutions and economic growth: A panel VAR approach. Resour. Policy 2017, 53, 147–163. [Google Scholar]
- El-Anshasy, A.; Mohaddes, K.; Nugent, J.B. Oil, Volatility and Institutions: Cross-Country Evidence from Major Oil Producers; Working Paper No. 310; Globalization and Monetary Policy Institute: Dallas, TX, USA, 2017. [Google Scholar]
- Amini, A. Studying the effect of abundance of natural resources on economic growth. Eur. J. Sustain. Dev. 2018, 7, 201–208. [Google Scholar]
- Dwumfour, R.A.; Ntow-Gyamfi, M. Natural resources, financial development and institutional quality in Africa: Is there a resource curse? Resour. Policy 2018, 59, 411–426. [Google Scholar]
- Abdulahi, M.E.; Shu, Y.; Khan, M.A. Resource rents, economic growth, and the role of institutional quality: A panel threshold analysis. Resour. Policy 2019, 61, 293–303. [Google Scholar]
- Henry, A. Transmission channels of the resource curse in Africa: A time perspective. Econ. Model. 2019, 82, 13–20. [Google Scholar]
- Hassan, A.S.; Meyer, D.F.; Kot, S. Effect of Institutional Quality and Wealth from Oil Revenue on Economic Growth in Oil-Exporting Developing Countries. Sustainability 2019, 11, 3635. [Google Scholar] [CrossRef]
- Mohammed, J.I.; Karimu, A.; Fiador, V.O.; Abor, J.Y. Oil revenues and economic growth in oil-producing countries: The role of domestic financial markets. Resour. Policy 2020, 69, 101832. [Google Scholar]
- Motameni, A. The Impact of Oil Rent, Currency Overvaluation, and Institution Quality, on Economic Growth of Oil-Rich Countries: A Heterogeneous Panel Data Study. Int. J. Energy Econ. Policy 2021, 11, 483–493. [Google Scholar]
- Belarbi, Y.; Hamdi, F.; Khalfi, A.; Souam, S. Growth, institutions and oil dependence: A buffered threshold panel approach. Econ. Model. 2021, 99, 105477. [Google Scholar]
- Sun, Z.; Wang, Q. The asymmetric effect of natural resource abundance on economic growth and environmental pollution: Evidence from resource-rich economy. Resour. Policy 2021, 72, 102085. [Google Scholar]
- Ali, H.; Bhuiyan, S. Governance, Natural Resource Rent, and Infrastructure Development: Evidence from Middle East and North Africa. Politics Policy 2022, 50, 408–440. [Google Scholar]
- Chen, Y.; Khurshid, A.; Rauf, A.; Yang, H.; Calin, A.C. Natural resource endowment and human development: Contemporary role of governance. Resour. Policy 2023, 81, 103334. [Google Scholar]
- Tatar, M.; Harati, J.; Farokhi, S.; Taghvaee, V.; Wilson, F.A. Good governance and natural resource management in oil and gas resource-rich countries: A machine learning approach. Resour. Policy 2024, 89, 104583. [Google Scholar]
- Moghani, A.M.; Loni, R. Review on energy governance and demand security in oil-rich countries. Energy Strategy Rev. 2025, 57, 101625. [Google Scholar]
- World Development Indicators, 2024. World Bank, Washington. Available online: https://databank.worldbank.org/source/world-development-indicators (accessed on 28 October 2024).
- Breusch, T.; Pagan, A. The Lagrange Multiplier Test and Its Application to Model Specification in Econometrics. Rev. Econ. Stud. 1980, 47, 239–254. [Google Scholar]
- Pesaran, M.H. General Diagnostic Test for Cross Section Dependence in Panels; Working Paper; University of Cambridge & USC: Cambridge, UK, 2004. [Google Scholar]
- Pesaran, M.H.; Ullah, A.; Yamagata, T. A Bias-Adjusted LM Test of Error Cross-Section Independence. Econom. J. 2008, 11, 105–127. [Google Scholar]
- Pesaran, M.H. A simple panel unit root test in the presence of cross-section dependence. J. Appl. Econom. 2007, 22, 265–312. [Google Scholar]
- Kao, C. Spurious regression and residual-based tests for cointegration in panel data. J. Econom. 1999, 90, 1–44. [Google Scholar]
- Belloumi, M.; Touati, K. Do FDI Inflows and ICT Affect Economic Growth? An Evidence from Arab Countries. Sustainability 2022, 14, 6293. [Google Scholar] [CrossRef]
- Alshehry, A.; Belloumi, M. The Symmetric and Asymmetric Impacts of Energy Consumption and Economic Growth on Environmental Sustainability. Sustainability 2024, 16, 205. [Google Scholar]
- Hasanov, F.J.; Aliyev, R.; Taskin, D.; Suleymanov, E. Oil rents and non-oil economic growth in CIS oil exporters. The role of financial development. Resour. Policy 2023, 82, 103523. [Google Scholar]
Disclaimer/Publisher’s Note: The statements, opinions and data contained in all publications are solely those of the individual author(s) and contributor(s) and not of MDPI and/or the editor(s). MDPI and/or the editor(s) disclaim responsibility for any injury to people or property resulting from any ideas, methods, instructions or products referred to in the content. |
© 2025 by the authors. Licensee MDPI, Basel, Switzerland. This article is an open access article distributed under the terms and conditions of the Creative Commons Attribution (CC BY) license (https://creativecommons.org/licenses/by/4.0/).