Abstract
Lithium-ion batteries (LIBs) are widely utilized in consumer electronics, electric vehicles, and large-scale energy storage systems due to their high energy density and long lifespan. Accurately estimating the state of health (SOH) and predicting the remaining useful life (RUL) of cells is crucial to ensuring their safety and preventing potential risks. Existing state estimation methodologies primarily rely on electrical signal measurements, which predominantly capture electrochemical reaction dynamics but lack sufficient integration of thermomechanical process data critical to holistic system characterization. In this study, relevant thermal and mechanical features collected during the formation process are extracted and incorporated as additional data sources for battery state estimation. By integrating diverse datasets with advanced algorithms and models, we perform correlation analyses of parameters such as capacity, voltage, temperature, pressure, and strain, enabling precise SOH estimation and RUL prediction. Reliable predictions are achieved by considering the interaction mechanisms involved in the formation process from a mechanistic perspective. Full lifecycle data of batteries, gathered under varying pressures during formation, are used to predict RUL using convolutional neural networks (CNN) and Gaussian process regression (GPR). Models that integrate all formation-related data yielded the lowest root mean square error (RMSE) of 2.928% for capacity estimation and 16 cycles for RUL prediction, highlighting the significant role of surface-level physical features in improving accuracy. This research underscores the importance of formation features in battery state estimation and demonstrates the effectiveness of deep learning in performing thorough analyses, thereby guiding the optimization of battery management systems.
1. Introduction
As a renewable energy storage device, Li-ion batteries (LIBs) have been widely used in consumer electronics, transportation, and energy grids because their advantages of high energy density, low cost, and long lifespan [1,2]. However, the structural-degradation-dominated battery aging leads to safety issues, such as overheating and short circuits, which limit the future application of LIBs [3]. To ensure battery safety, battery management system (BMS) plays a critical role in predicting battery states and assessing potential risks [4]. The accumulation of irreversible reactions during the electrochemical process is responsible for performance deterioration, and these manifest in the form of electrical, thermal, and mechanical signals. Commercial BMS operates mainly based on the electrical features, whereas the battery state of health (SOH) and remaining useful life (RUL) are two indicators that quantitatively describe the performance of a battery over its lifecycle [5,6]. Given that the capacity-based method for defining SOH is simple and offers high estimation accuracy, it is typically represented by the ratio of current capacity to its initial capacity [7]. RUL and SOH are strongly correlated, but RUL suggests deeper information about battery degradation until the end of its lifespan.
Previous studies have proposed various SOH estimation [8,9] and RUL prediction [10,11] methods to provide effective information for battery management. Most model-based methods still face challenges in establishing accurate models for complex battery systems and operating conditions, and the models may lose accuracy over time and with changing usage conditions [12]. The rapid development of artificial intelligence enables flexible and accurate battery state assessment by machine learning with different approaches [8]. Each model has its unique advantage on their appropriate application scenarios. Given the distinct characteristics of different models, no single model is universally applicable to all situations. For example, convolutional neural network (CNN), which utilizes incremental capacity (IC) features extracted from specific batteries in the NASA dataset [13], achieves higher accuracy in capacity estimation compared to long short-term memory (LSTM), support vector machine (SVM), convolutional transformer [14], random forest (RF) models [15,16], and physics-informed neural network [17]. However, when applying IC features to other batteries in the dataset, the accuracy of the LSTM model is higher than that of the artificial neural network (ANN) model and SVM [18]. In general, by integrating the advantages of different models, the accuracy and robustness of capacity and lifetime prediction can be improved across various applications [19,20].
Along with innovations in algorithms, collecting a comprehensive set of features to enrich the dimensions of dataset is considered a feasible approach to improving prediction accuracy as well. The electrical, thermal, and mechanical features during the electrochemical process provide valuable insights about the reaction details [21], especially for the formation cycles, whereas the solid-state electrolyte interphase (SEI) is formed at the electrode/electrolyte interface. It has a great impact on the evolution of SEI layer and growth of dendritic-Li in following cycles of their service life [22]. The captured datasets correlate with the increase in internal resistance and the accumulation of irreversible Li-loss in long-term cycling [23]. The chemical, structural, and mechanical properties of SEI layer are determined by the factors from the composition of electrolyte [24], current density [25,26], and formation temperature and pressure [27,28]. Here in this work, the electrochemical performance and its related corresponding physical features with the variation in formation temperature and pressure are extracted to train our integrated model. The RMSE of SOH estimation could reach to 2.928%, and RUL prediction yields with the lowest RMSE of 16 cycles. With the containment of more relevant features, the effectiveness and reliability of a battery management system could be significantly enhanced.
2. Experiment
2.1. Pouch Cell Preparation
The NCM523/graphite pouch cell without electrolyte was purchased from Dongguan Detai Energy Co., Ltd. (Dongguan, China). The 3 mL of 1.0 M LiPF6 in EC:DEC with a weight ratio of 1:1 (Duoduo Chemical Co., Ltd., Suzhou, China) electrolyte was added after drying the pouch cell at 45 °C in dynamic vacuum overnight. Before the attachment of temperature, strain stress sensors, cells were allowed to stand 12 h for wetting. Galvanostatic cycling tests were conducted following the application of an initial pressure of 25–78 N to the cells by the mold in a temperature-controlled chamber using NEWARE Battery Test System (CT-ZWJ-4′S-T-1U, Shenzhen Data generation, Shenzhen, China).
2.2. Relevant Feature Extraction
In this system, the 51 microcontroller is used as the main control board to collect real-time data on temperature, strain, and pressure changes. The resistive thin-film pressure sensor (FSR406 from Luo Jia Technology Co., Ltd., Shenzhen, China) has a sensing range of 20 g to 20 kg. The FSR406 is composed of a polyester film with excellent mechanical properties, highly conductive materials, and nanoscale pressure-sensitive materials. The top layer consists of a flexible film and a pressure-sensitive layer bonded on top, while the bottom layer includes a flexible film and conductive circuitry bonded on it. The two layers are bonded using double-sided adhesive and separated at the sensing area. When the sensing area (40 mm × 40 mm) is subjected to a pressure greater than 20 g, the previously disconnected circuits at the bottom layer are closed through the pressure-sensitive layer on the top, and the resistance output at the port decreases as the pressure on the sensing area increases. The microcontroller converts the resistance value changes from the pressure sensor into a digital value, which ranges from 0 to 4095. Specifically, when the pressure on the sensing area is less than 20 g or greater than 20 kg, the collected values are 4095 and 0, respectively. The microcontroller’s digital values are proportional to the resistance values. A servo-controlled tensile testing machine (RS-8000 from Huayi Testing Co., Ltd., Yangzhou, China) was used to calibrate the sensor. First, the FSR406 sensor was installed in the fixture of the RS-8000, and the microcontroller was started to record the real-time data changes of the pressure sensor. Then, the control parameters for the testing machine were set, such as applying a fixed pressure to the pressure sensor for up to 10 s. During the test, the machine automatically recorded the data and generated a test report after the experiment. By comparing the actual strain values with the applied pressure, the sensor can be calibrated.
2.3. Model Development
The framework of this integrated model is based on the proposed deep transfer learning model from our previous study [17]. The CNN model contains three convolutional layers, three max-pooling layers, and one fully connected layer. The input shape of the LSTM is (batch_size, time_steps, input_features), where batch_size is the number of samples in each training batch, time_steps is the number of time steps in each sample sequence, and input_features is the number of features at each time step. The sequence length of each sample in the LSTM is 10, so the shape of each LSTM input sample is 1 × 10 × 3 (i.e., 1 sample, 10 time steps, and 3 features). The target label for the LSTM is the discharge capacity of the current cycle. The GPR model is selected as a second-level learner for training on the constructed dataset.
3. Results and Discussion
3.1. Collection of Datasets
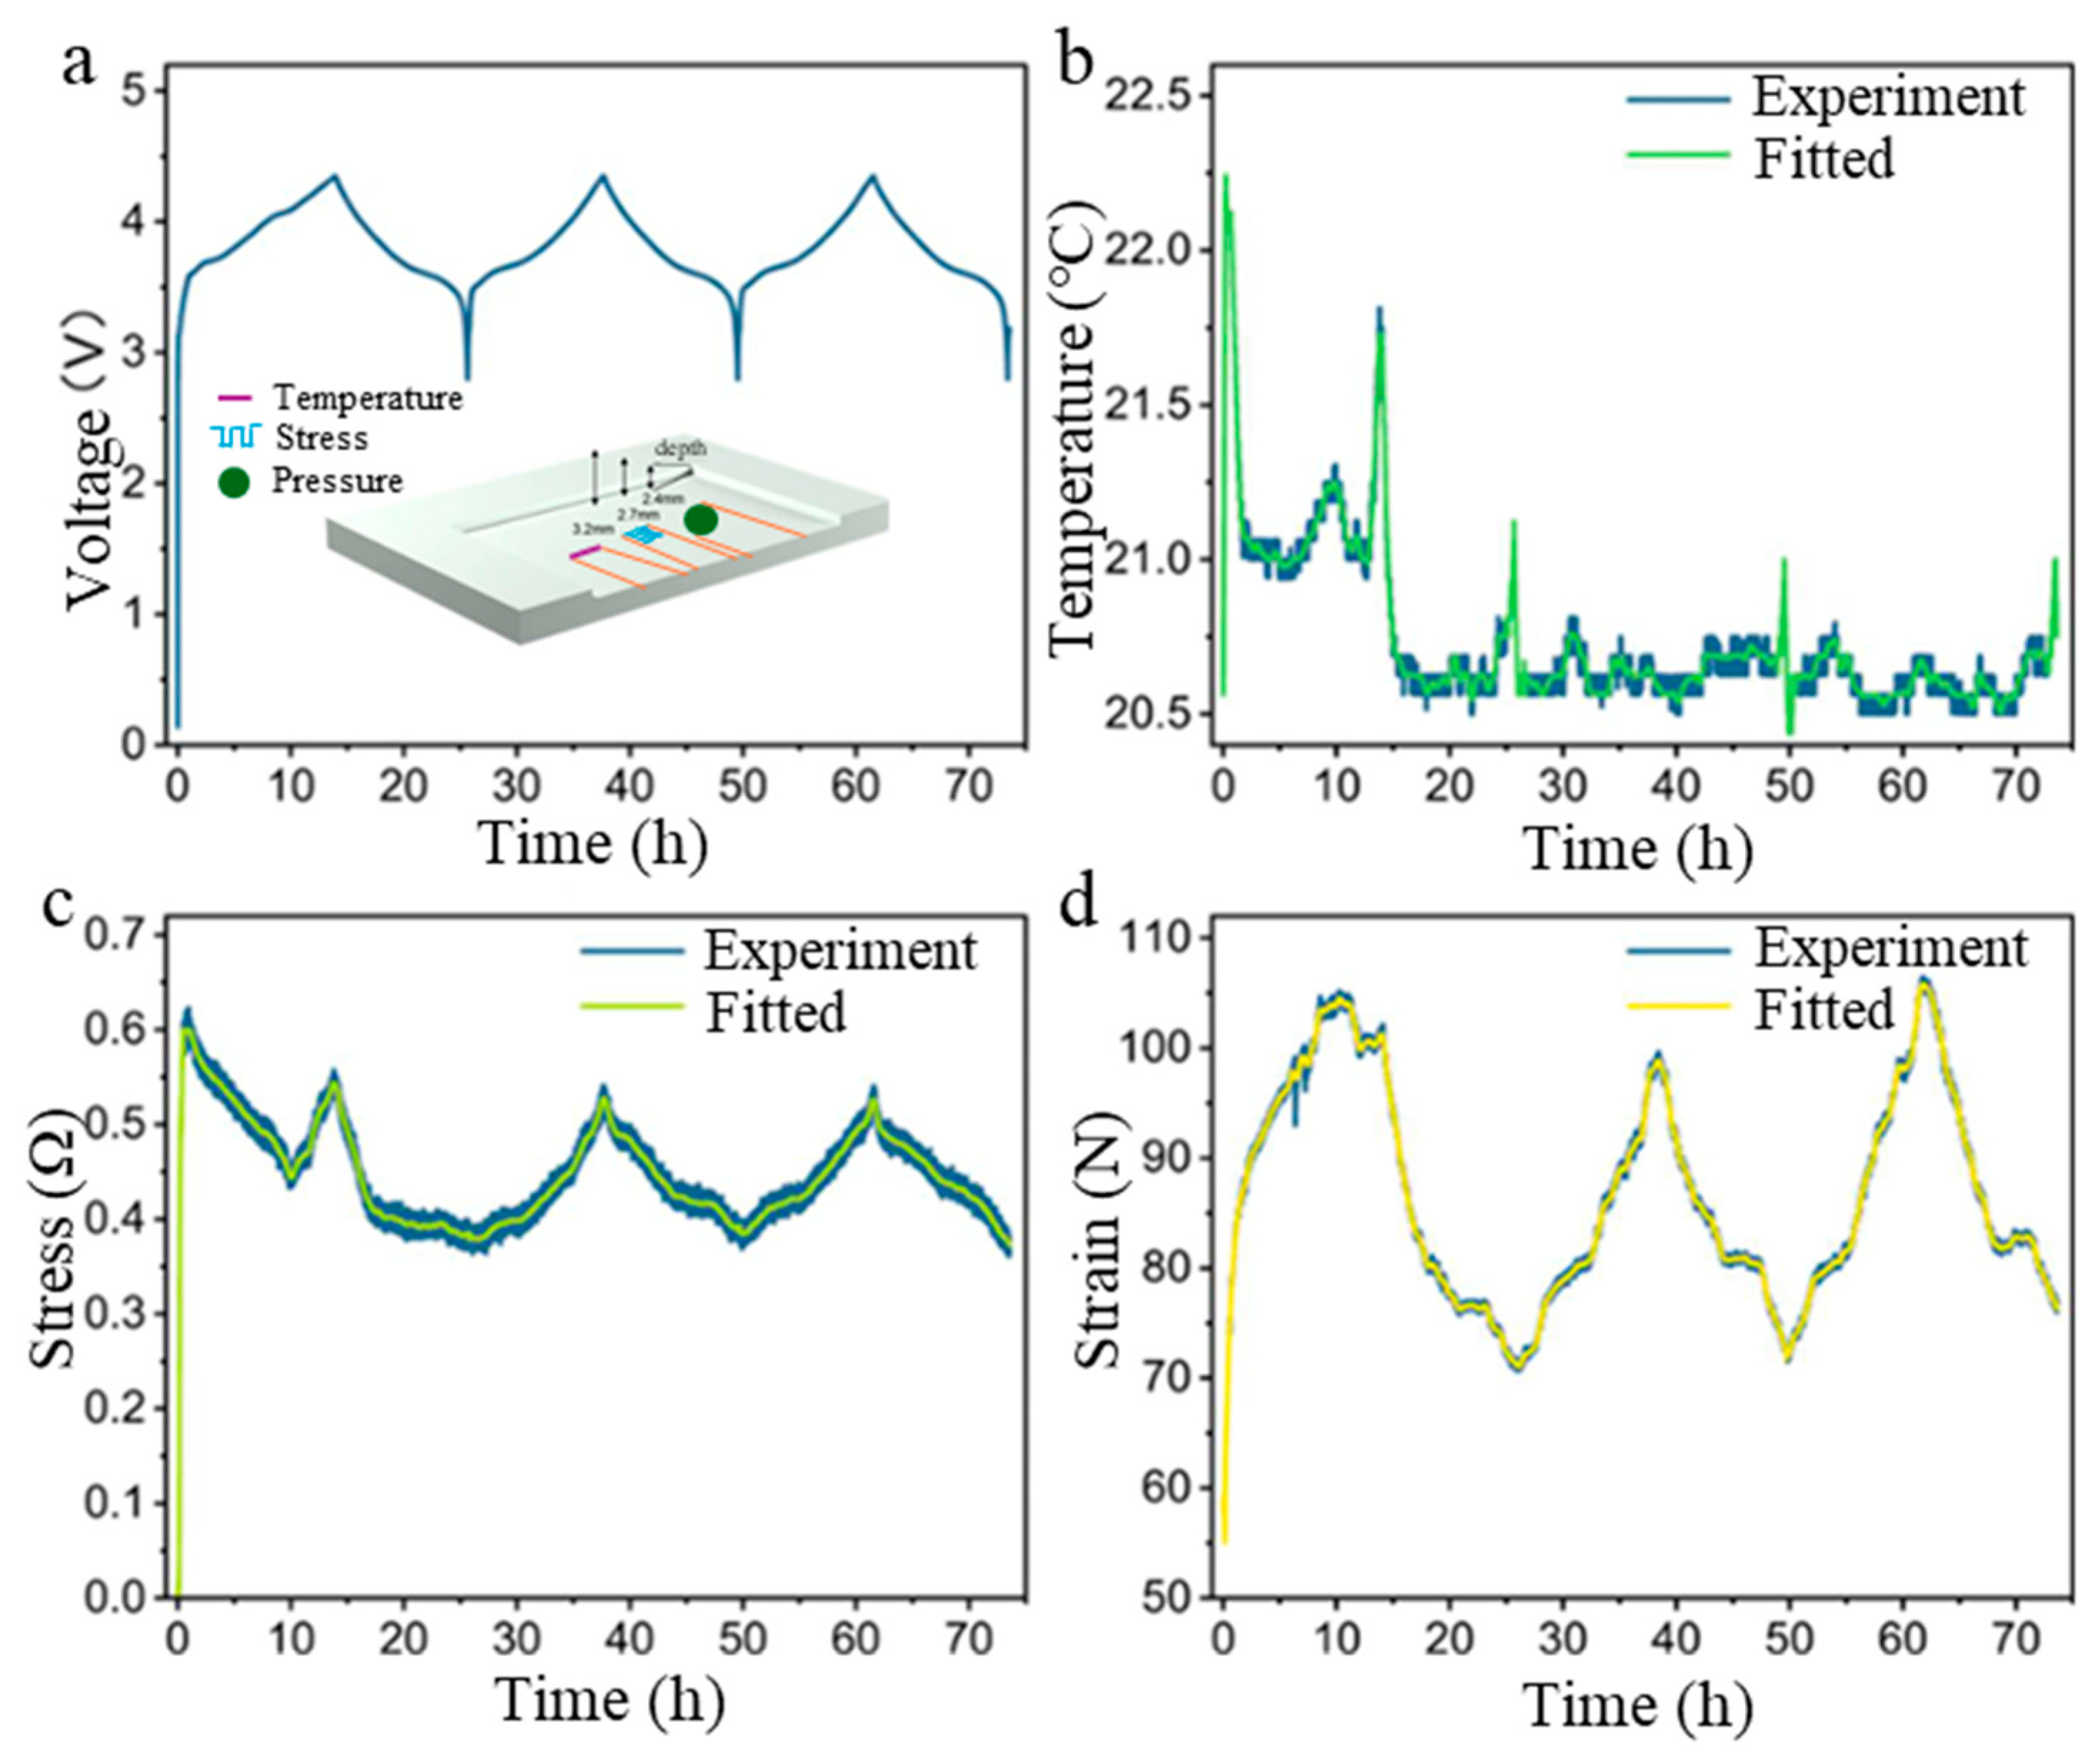
The experimental configuration, as illustrated in Figure 1, features temperature, strain, and stress sensors affixed to the cell surface and mounted within a custom-designed test fixture. Initial compressive pressure was calibrated through precision adjustment of the fixture’s groove depth. The fixture was engineered using Cinema 4D CAD software and fabricated through additive manufacturing (3D printing). Three distinct groove depths were implemented: 3.2 mm (41 N applied force), 2.7 mm (55 N), and 2.4 mm (76 N), establishing a controlled pressure gradient across the test conditions. Prior to electrochemical testing, instrumented cells underwent a 2 h stabilization period in a thermal chamber to achieve equilibrium in temperature, mechanical strain, and pressure parameters. Formation protocols consisted of galvanostatic cycling at 0.1 C rate (0.11 A) within a voltage window of 2.8–4.2 V. The study employed 22 commercial pouch cells (1.1 Ah capacity, NCM532 cathode/graphite anode) stratified into two experimental groups based on formation temperature under 20 °C and 30 °C, respectively. Post–formation conditioning, all cells underwent cyclic aging tests under controlled thermal conditions (30 °C ambient temperature) using a 1 C charge/discharge regimen (1.1 A) within a 3.0–4.2 V operational range.
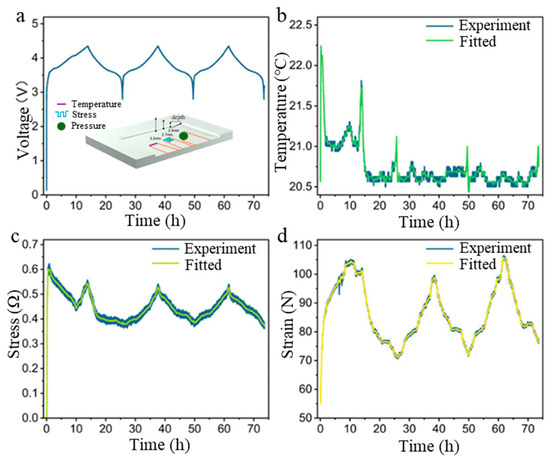
Figure 1.
The electrochemical performance and corresponding thermal and mechanical features of sample cell at formation cycles. (a) Voltage profile and schematic illustration of cell holders with temperature, strain, and stress sensor. The experiment and fitted (b) temperature, (c) stress, and (d) strain profiles.
The model is established by integrating the CNN and LSTM frameworks, and its performance is validated through ablation experiments. The raw data exhibit substantial noise contamination that not only prolongs training convergence but also introduces model bias, ultimately compromising predictive accuracy. This necessitates meticulous digital signal preconditioning that optimizes noise reduction while preserving critical morphological features. Therefore, when performing digital signal processing, it is essential to smooth the signal as much as possible while maintaining its shape. The Savitzky–Golay filter is a commonly used smoothing filter in digital signal processing, designed to remove noise from the signal and extract trend information. It uses a sliding window approach to perform local polynomial fitting on the signal and then estimates the smoothed value of the original signal using the fitted polynomial. This filter achieves superior noise attenuation while maintaining the morphological integrity of raw signals, rendering it particularly applicable to sensor signal processing in embedded systems requiring high-fidelity data acquisition. The larger the sliding window, the more pronounced the smoothing effect; the smaller the window, the closer it stays to the original curve. Additionally, the smaller the order of the fitted polynomial, the more pronounced the smoothing effect; the larger the order, the closer it stays to the original curve. In this case, the Savitzky–Golay filter method provided by the Scipy (1.11.x) library in Python (3.5+) is used to smooth the data. Based on the characteristics of the actual data, the sliding window size and the polynomial fitting order are set to 21 and 4, respectively. The experimental and fitted temperature, stress, and strain profiles are shown in Figure 1b–d. While ensuring signal smoothing, the shape of the sensor signals remains unchanged, indicating that no information has been lost. This preprocessing approach ensures the architectural integrity of sensor waveforms while creating optimal conditions for subsequent neural network processing.
Figure 1b illustrates the temperature evolution during the first three cycles, where observed fluctuations arise from inherent heat generation during electrochemical processes. The distinct thermal behavior between the initial cycle and subsequent cycles has been systematically characterized in our prior investigation [17]. Stress variations predominantly reflect bulk dimensional changes, with the underlying mechanism involving the following two coupled processes: (i) reversible lithium-ion intercalation/deintercalation dynamics and (ii) irreversible electrolyte decomposition. Notably, interface passivation established during the first cycle effectively suppresses gas evolution in subsequent cycles, thereby rendering the strain evolution governed by highly reversible lithium-ion migration post-formation. In contrast to stress sensing mechanisms, the strain signal captured by pressure sensors specifically monitors axial dimensional changes. Besides the reversible Li-ions de/intercalation, the initial formation and continued growth of the SEI layer, and the accumulation of death lithium also play an important role in pressure changes. Both stress and pressure profiles exhibit periodic synchronization with charge–discharge characteristics, while providing distinct complementary information—electrochemical curves manifest capacity fade whereas in situ pressure measurements reveal real-time internal state dynamics. The fundamental distinction between reversible and irreversible volumetric expansion mechanisms introduces a transformative framework for interrogating capacity degradation pathways, enabling precise decoupling of recoverable versus permanent damage modes in energy storage systems.
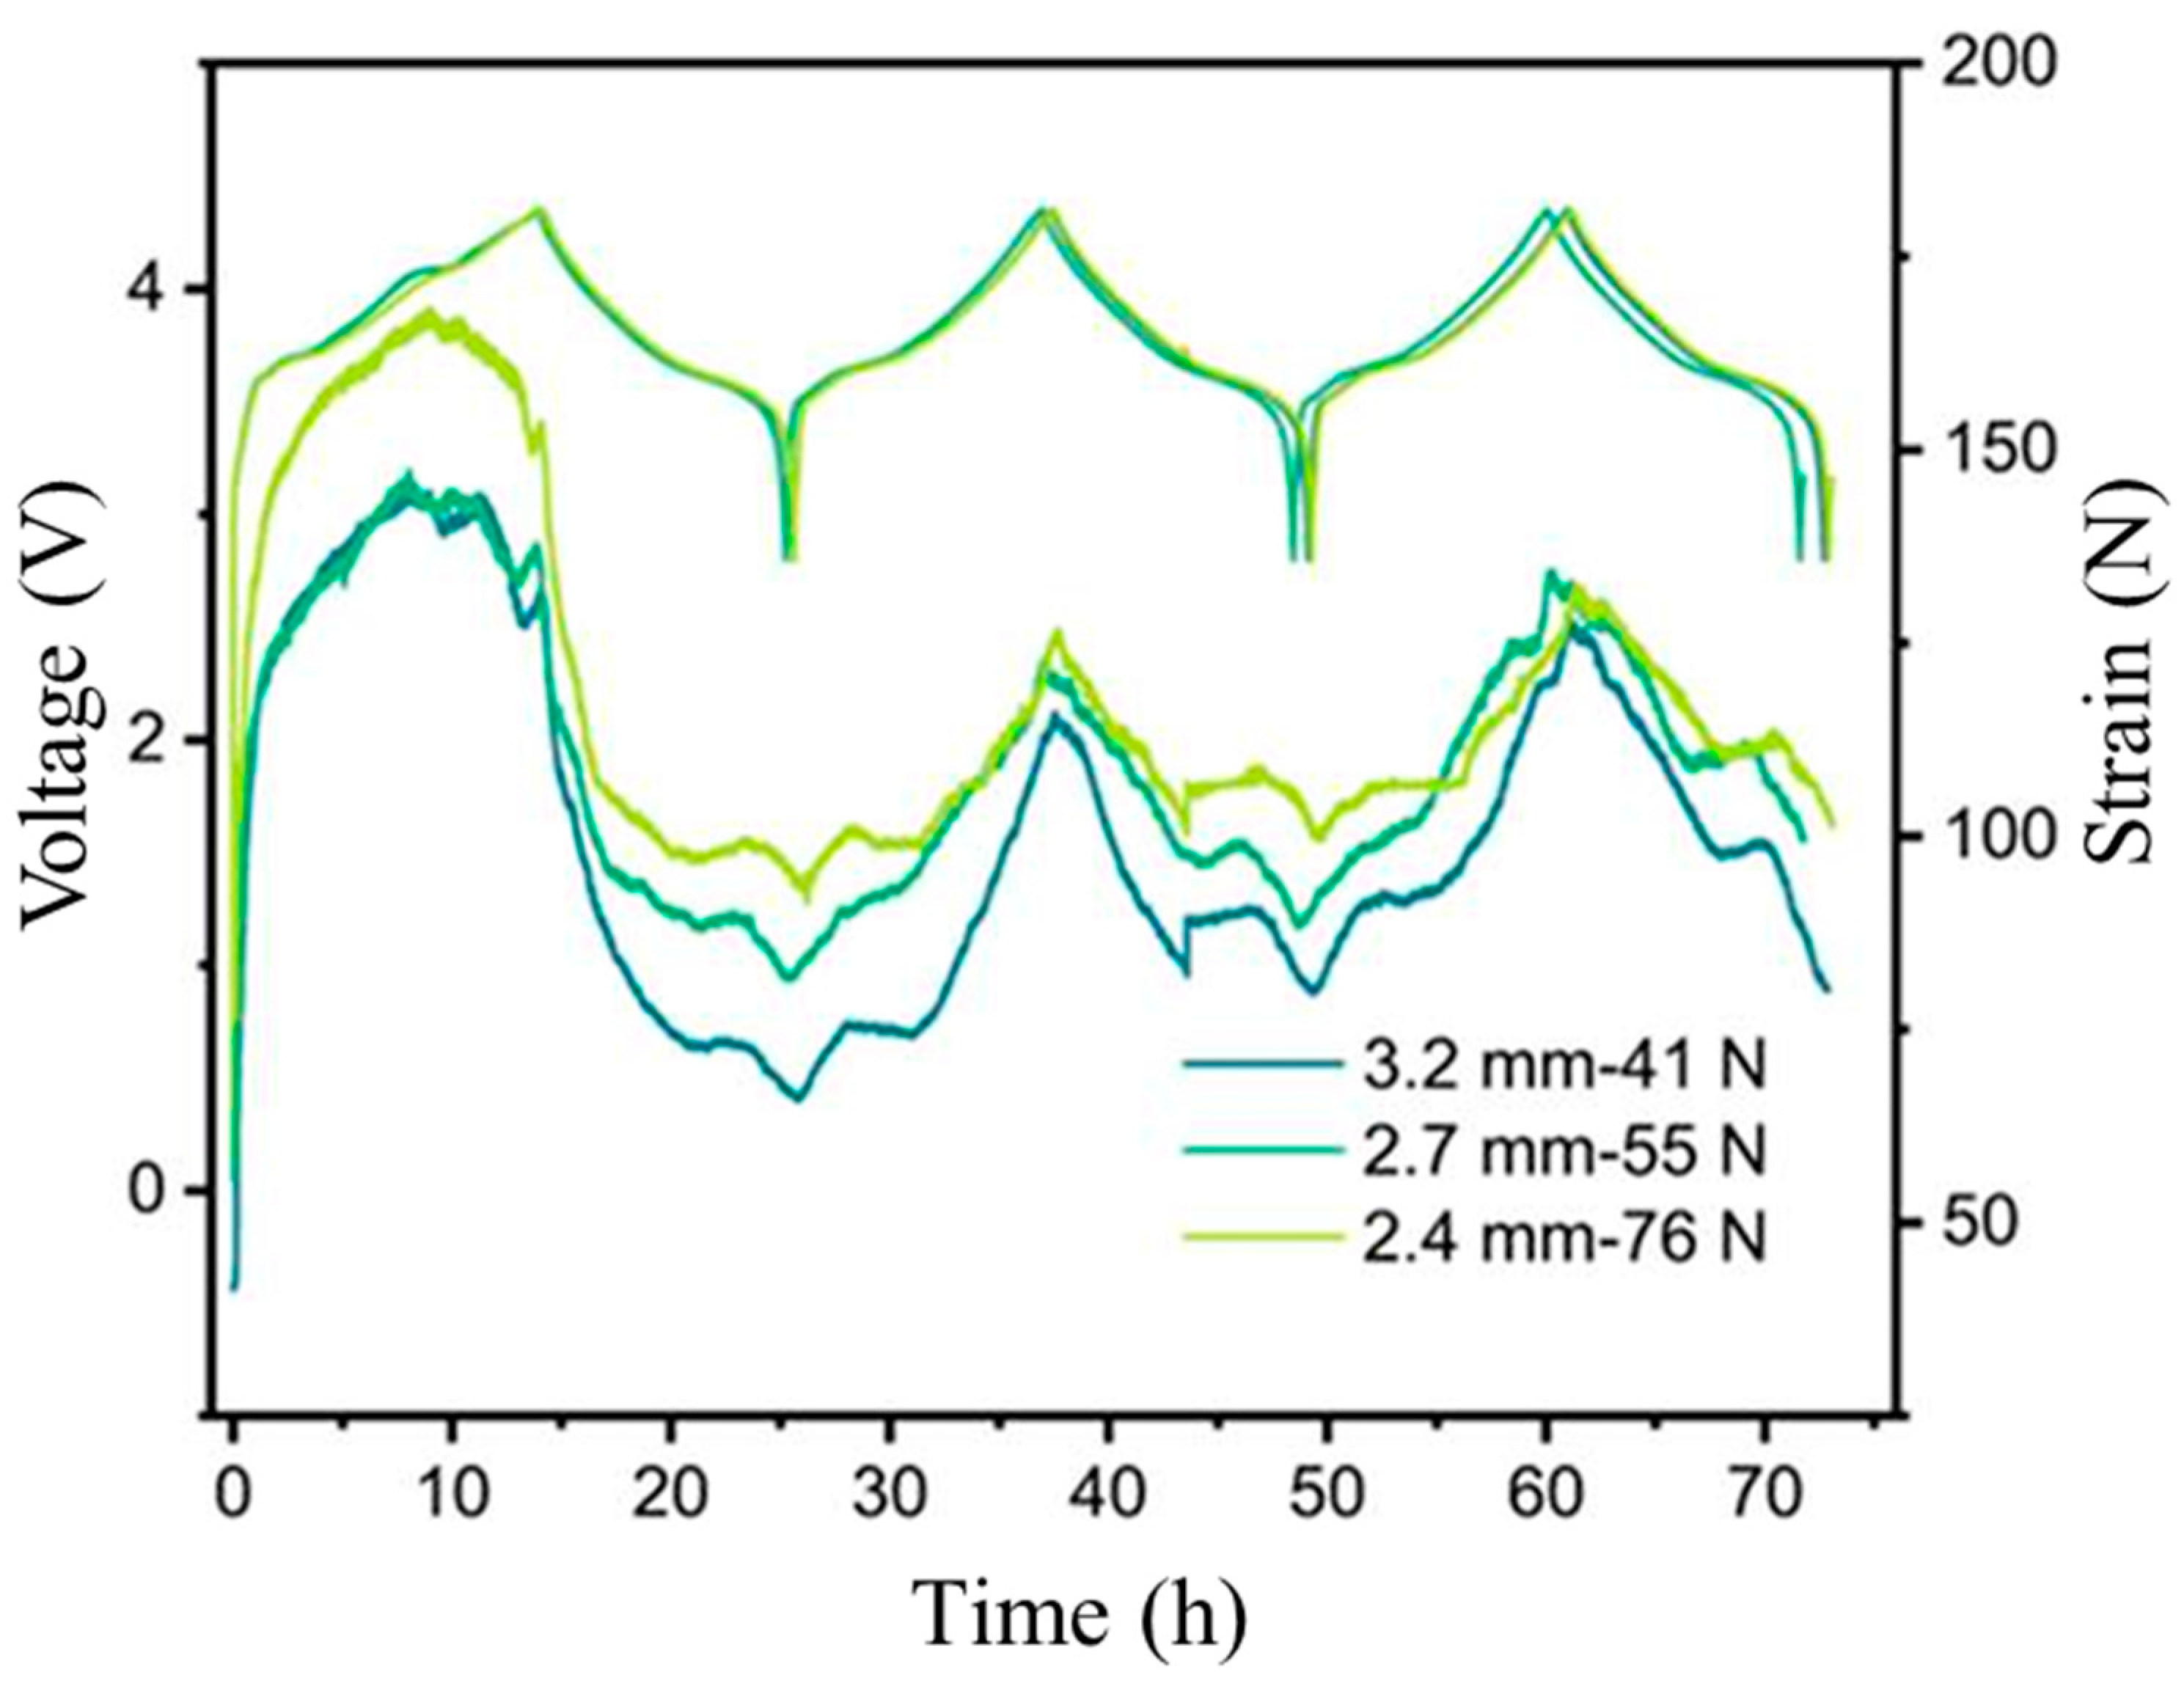
Figure 2 demonstrates the charge–discharge voltage profiles and real-time pressure changes during three formation cycles for three batteries with initial pressures of 41 N, 55 N, and 76 N, respectively. Three representative features were extracted from the pressure response, including Pi−e, Pd, and Pmax. Pi−e is the pressure difference between the end and the start of the formation process, representing the irreversible volume change. Pd is the pressure at the end of the formation process, indicating the strain at the start of cycling. Pmax is the maximum pressure value during the formation process. Subsequently, a four-parameter fitting was performed between these three features and the cycle number when the SOH decreased to 80%, and their Pearson correlation coefficients were calculated as 0.2877, 0.5684, and 0.4188, respectively. This quantitative correlation demonstrates that decoupling reversible/irreversible mechanical responses during formation enables prognostic assessment of battery lifespan through mechanical fingerprinting.
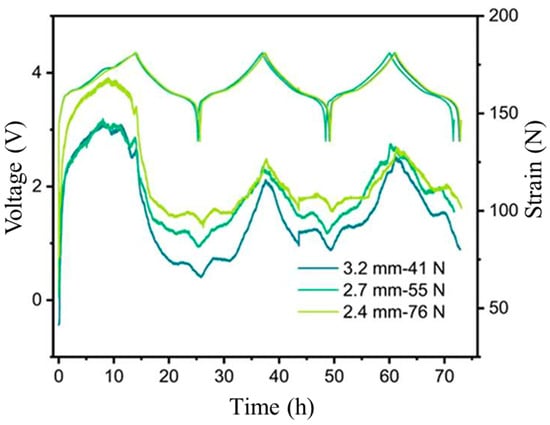
Figure 2.
The charge–discharge profiles and their corresponding strain curve for the formation cycles of cells under different pressure.
3.2. Formation at Different Conditions
Figure 3 systematically evaluates the capacity fade dynamics of pouch cells under varying formation protocols, correlating cycle number with capacity retention across a gradient of formation temperatures (20 and 30 °C) and stack pressures (25–78 N). The data reveal distinct degradation trajectories, where elevated temperatures accelerate SEI growth while insufficient compressive pressure promotes electrode delamination. All the tested cells underwent continuous cycling until their SOH declined to 80% of the initial capacity, representing the standard threshold for LIB end-of-life determination. Experimental results reveal that formation protocols conducted at 20 °C with 76 N pressure or at 30 °C with 25 N pressure yielded superior electrochemical performance, with these conditions demonstrating enhanced capacity retention capabilities over extended cycling. Notably, although the overall cycling stability exhibited some variability across test conditions, cells formed at 30 °C consistently maintained better capacity preservation compared to the 20 °C groups. This can be attributed to the critical role of solid-electrolyte interphase (SEI) layer formation dynamics, where optimized temperature–pressure combinations during the initial formation cycles promote the development of more stable and mechanically robust interfacial layers. The self-limiting nature and mechanical resilience of the SEI layer critically determine long-term cyclability through three synergistic mechanisms: (i) suppressing electrolyte decomposition via electron tunneling inhibition, (ii) mitigating active lithium loss by blocking solvent co-intercalation pathways, and (iii) spatially regulating lithium-ion flux to prevent dendrite nucleation at critical current densities.
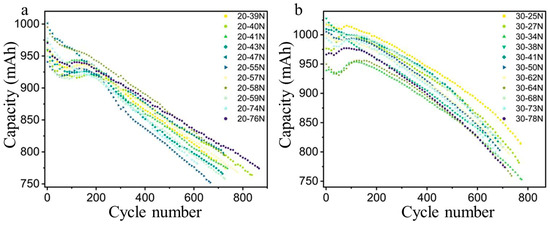
Figure 3.
Discharge capacity at different initial pressures under the formation temperatures of (a) 20 °C and (b) 30 °C until 80% of initial capacity.
3.3. Feature Extraction from Formation and Cycling Process
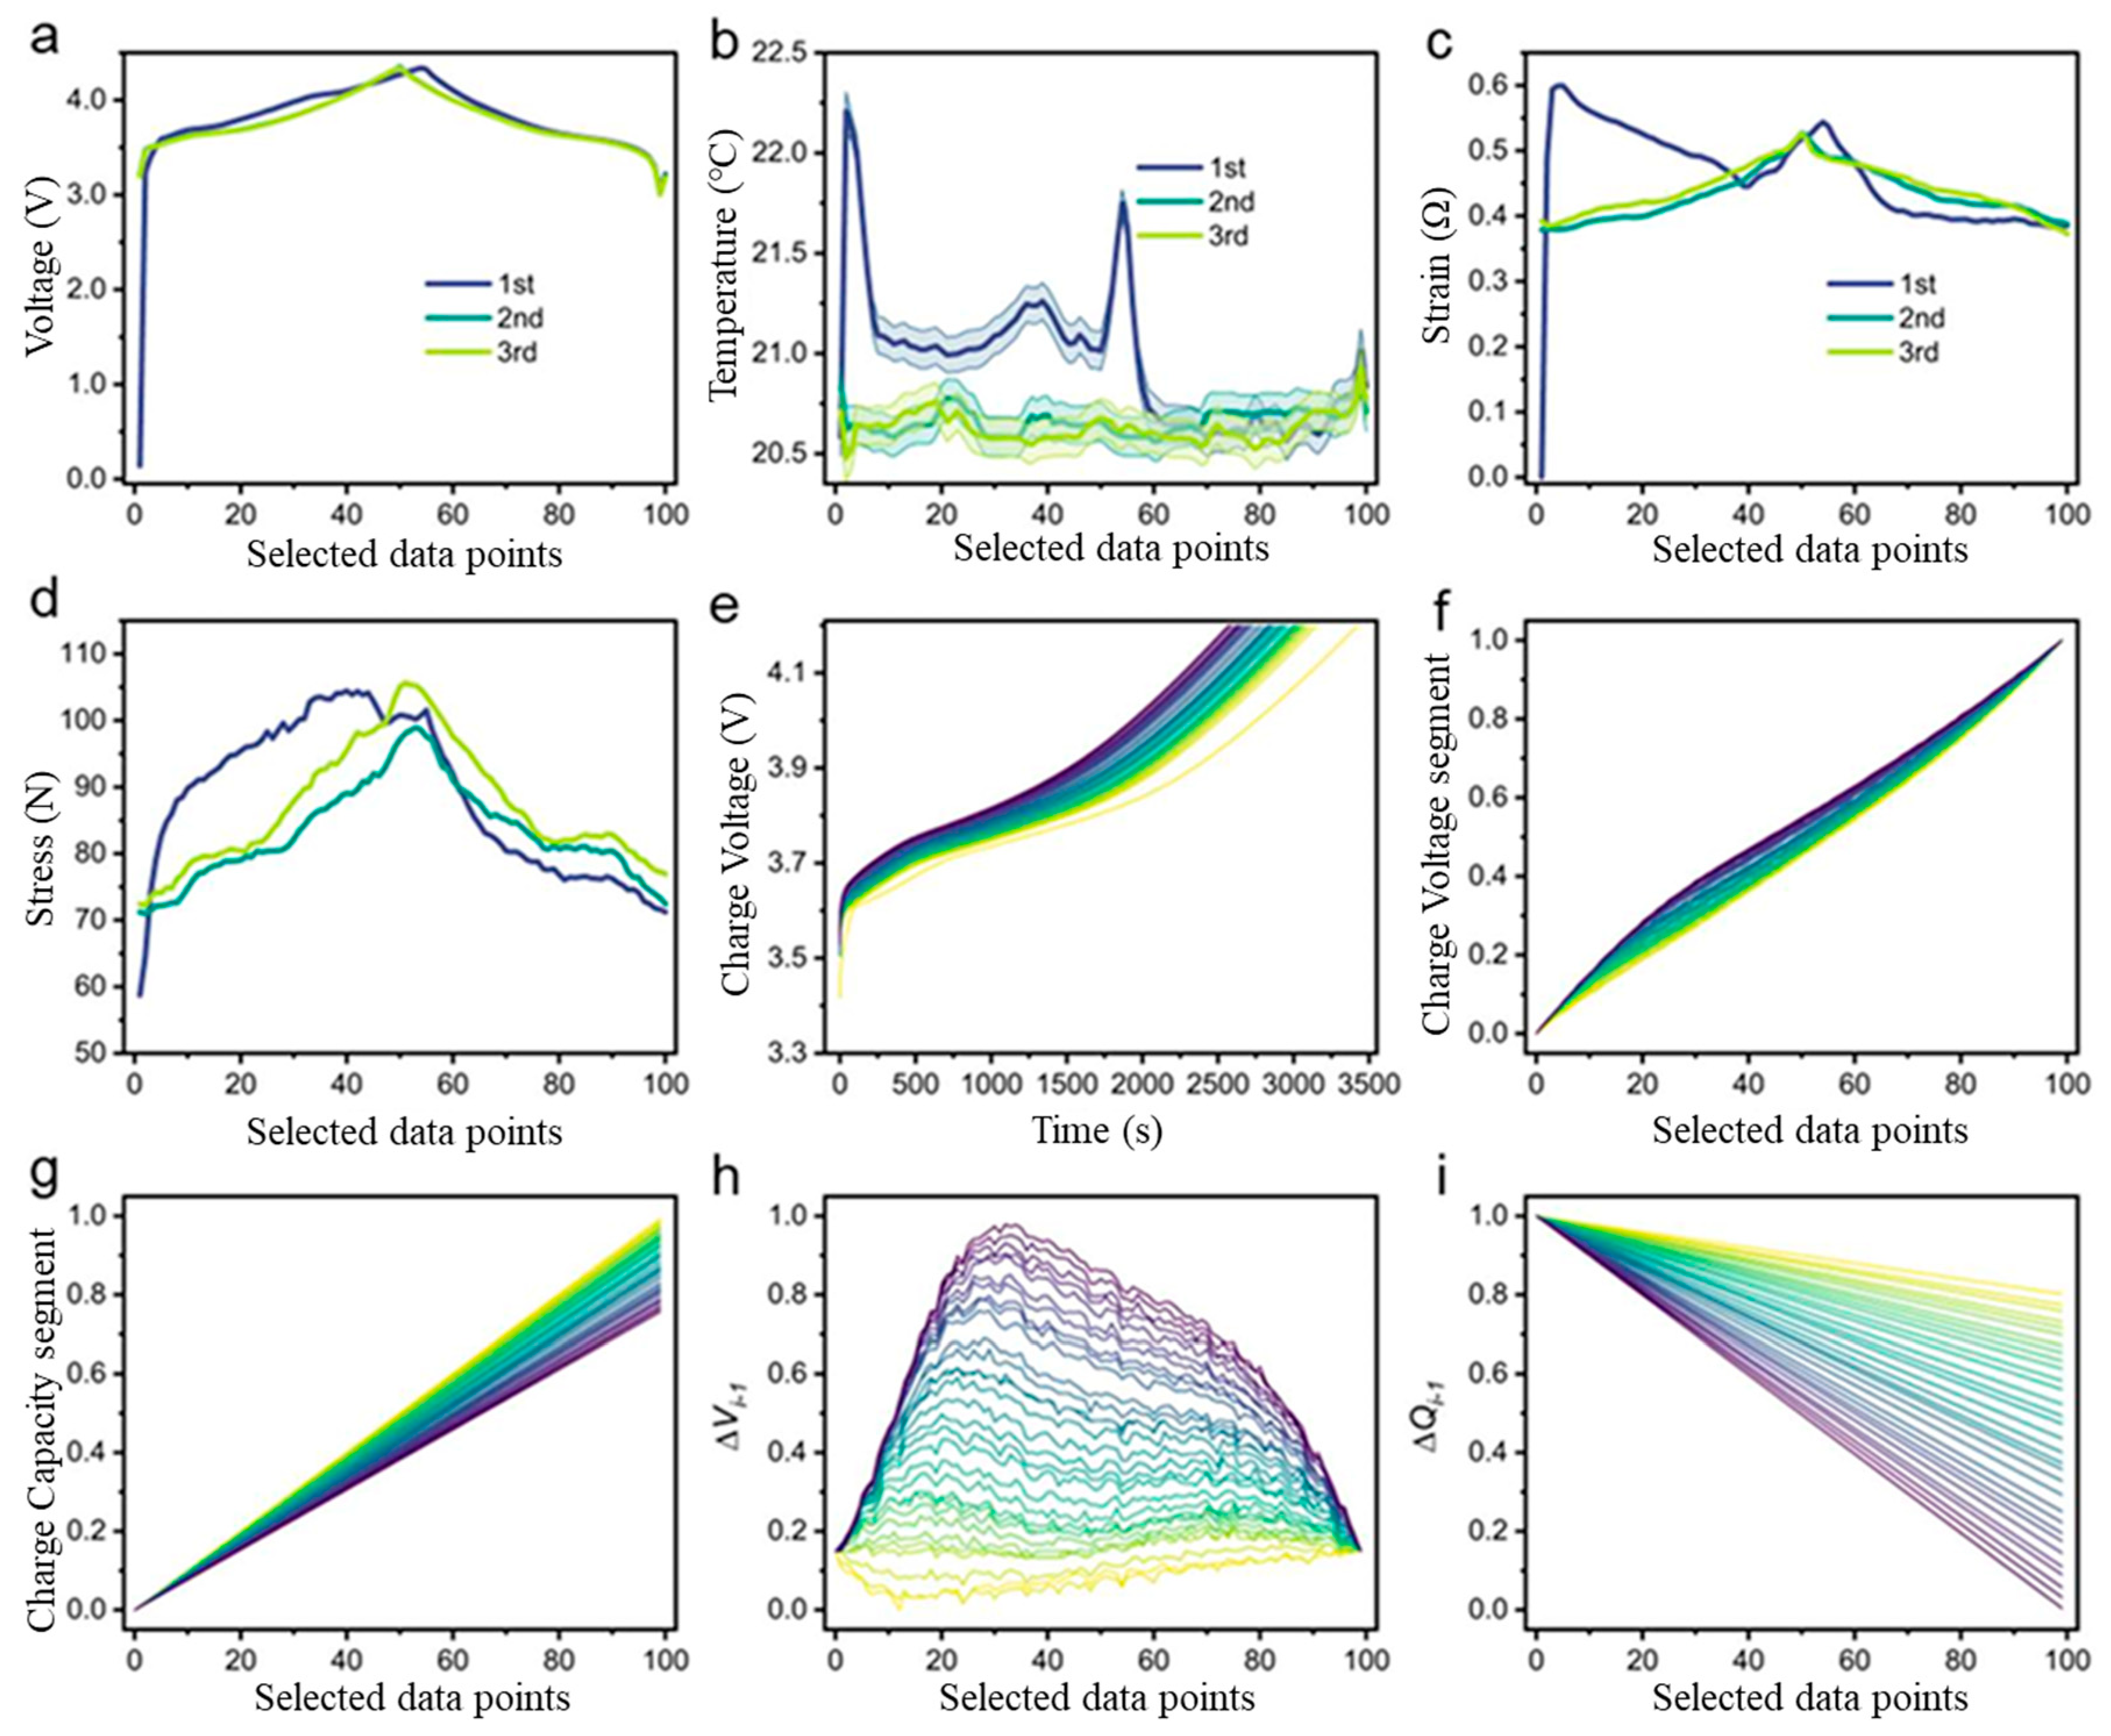
Following linear interpolation of voltage, temperature, strain, voltage, cycle voltage, cycle capacity, cycle ∆Vi−1, and cycle ∆Qi−1 into linear interpolations with a fixed length of 100 data points (Figure 4), these processed signals were horizontally concatenated to construct CNN input samples with the shape of 1 × 3 × 100 × 10 (i.e., 1 sample, 3 cycles, 100 sampling points, and 10 feature curves). The target label for the CNN is the discharge capacity of the current cycle. To systematically evaluate formation pressure effects through ablation studies, the dataset was partitioned into training, validation, and test subsets at an 8:1:1 ratio. Ablation experiments are conducted to investigate the effect of formation pressure on the model, which requires training, optimizing, and testing the CNN model. The model adjusts its parameters by learning from the data in the training set to make accurate predictions on new datasets. During the model training phase, the validation set is used to assess the performance of different hyperparameter combinations to find the optimal ones. After the model is trained, its final prediction performance is evaluated using the test set. The three datasets complement each other, ensuring the model’s ability to generalize to unseen data and avoiding overfitting or underfitting. An early stopping mechanism is employed during training to prevent overfitting and enhance the generalization ability. The principle behind this is to monitor the performance of the model on the validation set and stop training when the performance no longer improves, thus avoiding overfitting. Specifically, at the end of each cross-validation training cycle, the accuracy of the model on the validation set is observed. If there is no improvement over several consecutive cycles, it indicates that the model may have overfitted. In this work, training is stopped when no performance improvement is detected over 12 cycles, and the model parameters with the best performance on the validation set are selected as the parameters for this cross-validation. The performance and generation ability of the model is improved by selecting appropriate hyperparameters through the validation set. The relationship between the learning rate, batch size, number of iterations, and predictive performance during the hyperparameter optimization process is shown in Table 1. Through systematic optimization balancing computational efficiency, training duration, and model accuracy, the hyperparameters were ultimately configured with a learning rate of 0.001 and a batch size of 128.
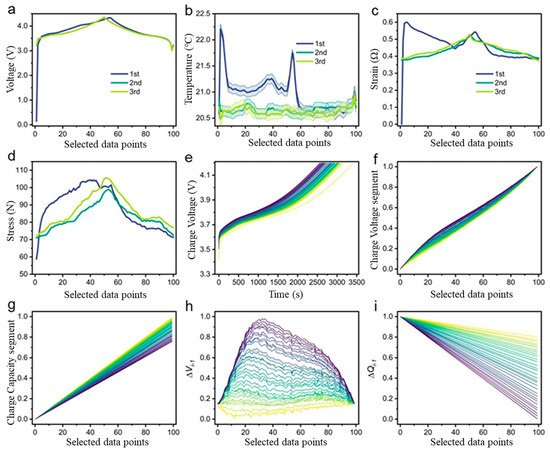
Figure 4.
Features extracted from the formation and cycling processes, using battery 20–72 N as a representative sample. During the formation process, the extracted features include: (a) voltage curve, (b) average temperature curve of three points, (c) strain curve, and (d) pressure curve. (e) Charging voltage curve during the cycling process, along with four corresponding features across the 3.70 V to 3.85 V range: (f) partial charge voltage curve, (g) partial charge capacity curve, (h) difference in charging voltage curve (∆Vi−1) between each cycle and the first cycle, and (i) difference in charging capacity curve (∆Qi−1) between each cycle and the first cycle.

Table 1.
Hyperparameters of the Model and Estimation Error.
3.4. SOH Estimation with CNN Model
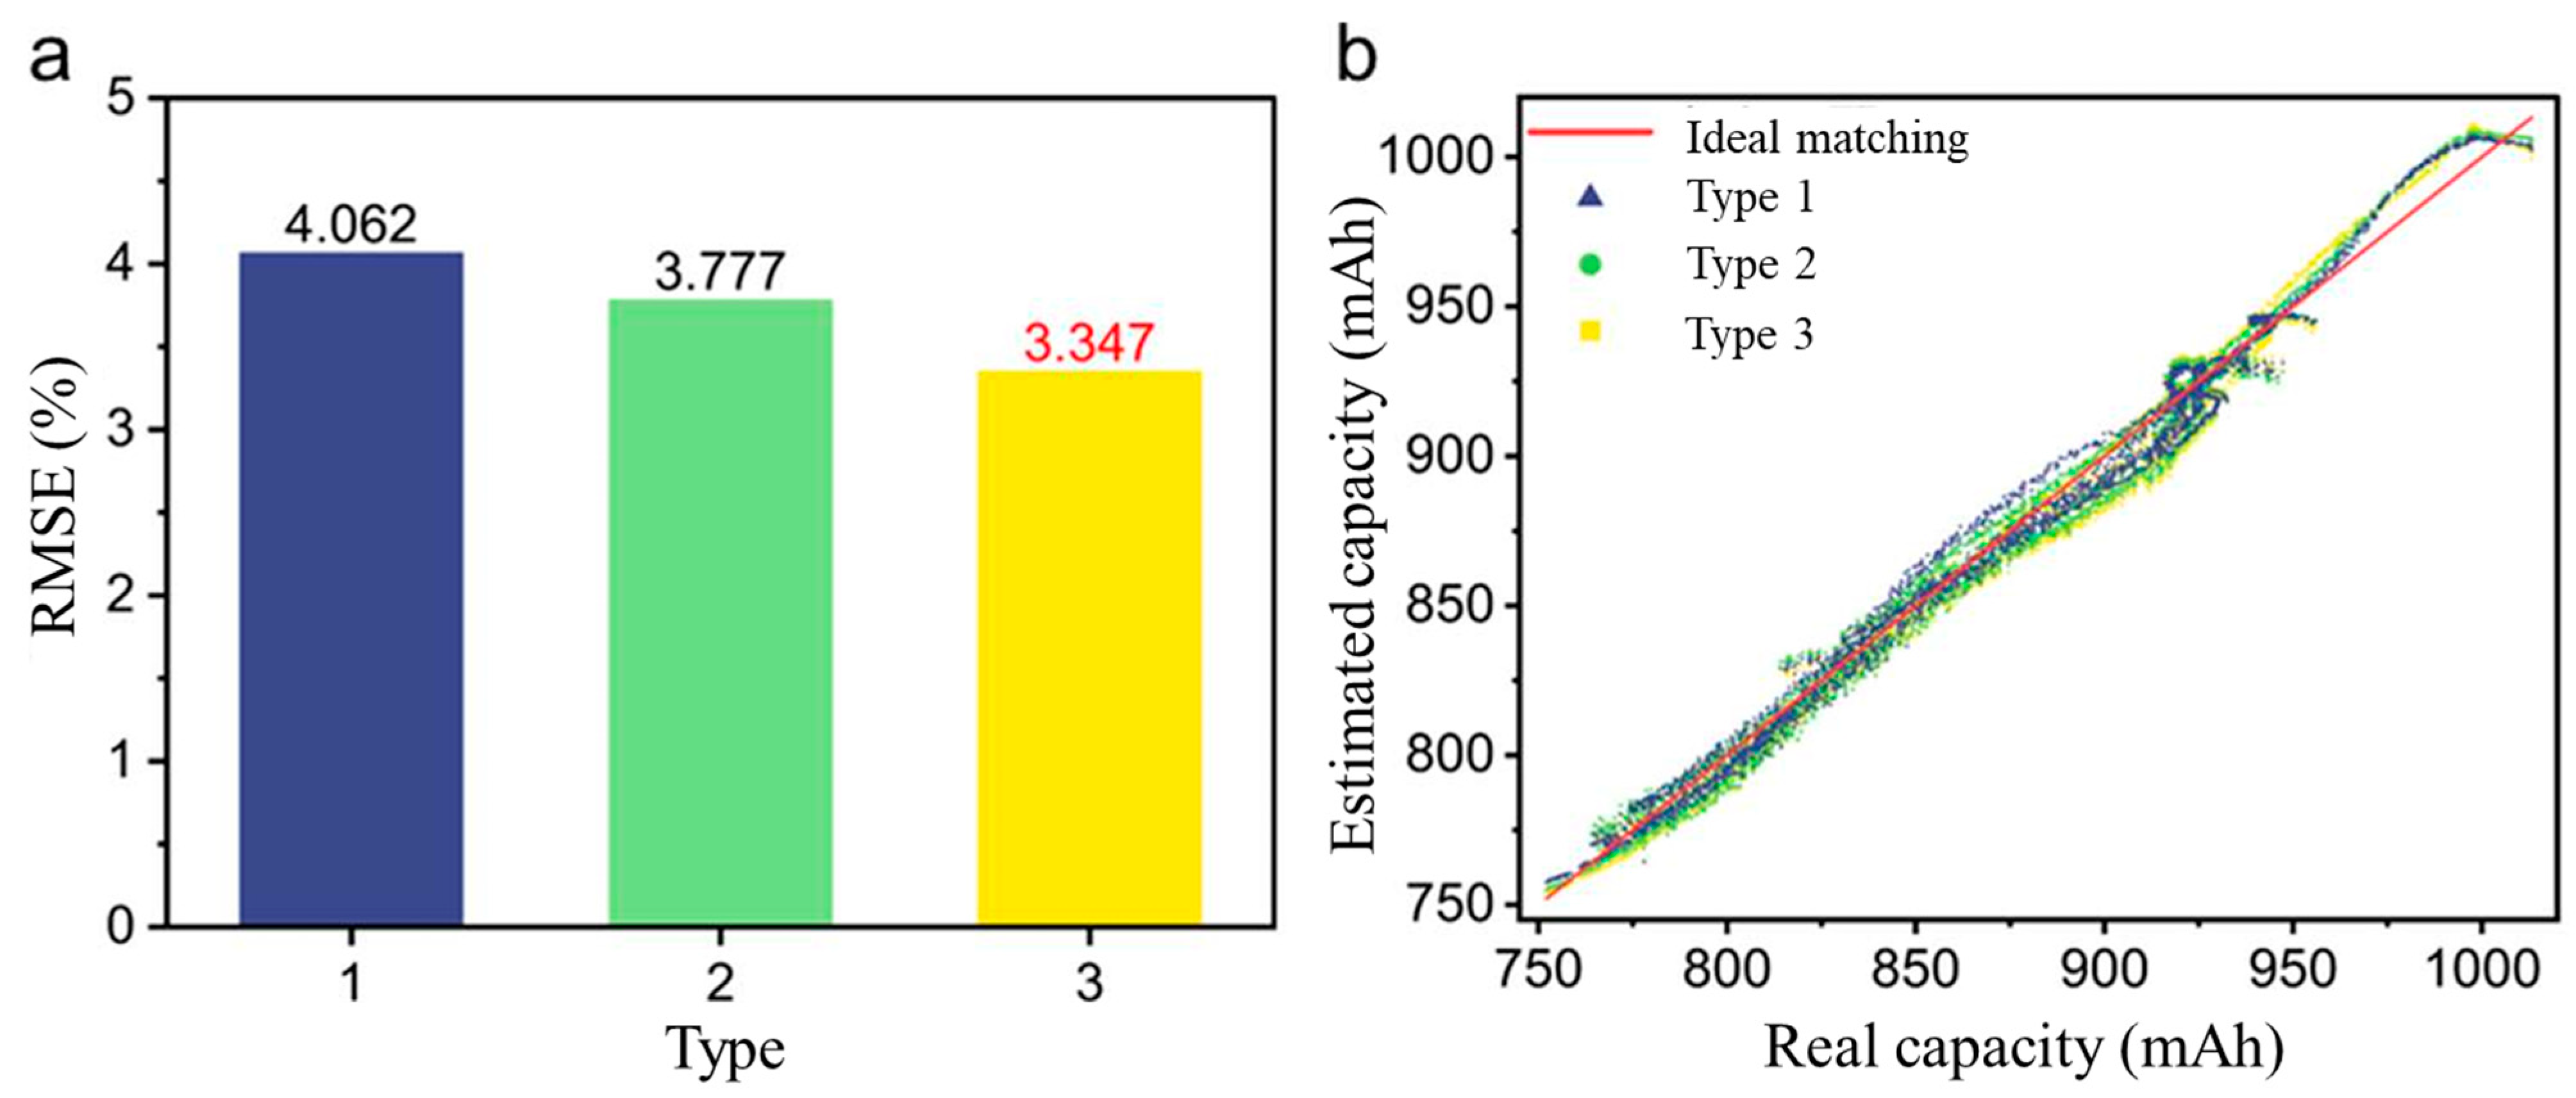
Figure 5 demonstrates the comparison of the accuracy of SOH estimation with the following three types of dataset input configurations: (1) baseline model without sensor signals; (2) multimodal input incorporating temperature, strain, and voltage signals; and (3) multimodal input incorporating temperature, strain, pressure, and voltage. The experimental framework employs a robust validation protocol, utilizing datasets collected from five statistically representative battery cells under various cycling conditions. To effectively evaluate the model, Root Mean Square Error (RMSE) quantifies the deviation between the predicted values and the actual values, which obtained by taking the square root of the Mean Square Error (MSE). The RMSE metric inherently amplifies the influence of outliers through its quadratic error formulation, where larger prediction deviations receive geometrically increasing weight in the error aggregation process. The RMSE range is [0, +∞], where a smaller value indicates better model prediction with smaller errors. It is defined as follows:
where ypre denotes predicted values and ylabel represents experimentally measured capacity values. This error metric demonstrates sensitivity to outlier values due to its quadratic nature, making it especially suitable for detecting significant estimation deviations in battery health monitoring applications.

Figure 5.
CNN estimation on capacities. (a) Average RMSE for the three input types and (b) visualization of the predicted values versus the actual capacities.
The comparative analysis reveals critical insights through two complementary visualizations. The average RMSE (Figure 5a), and the difference between actual and predicted capacity (Figure 5b), suggest that more comprehensive dataset in type 3 drives higher accuracy and reliability of estimation. Notably, the comprehensive dataset (Type 3) achieves 17.6% error reduction compared to the baseline, demonstrating that pressure measurement integration enables more precise capacity fade tracking through mechanical-thermal-electrical parameter correlation. The observed performance enhancement suggests that pressure variations contain complementary degradation signatures that improve neural network recognition of nonlinear capacity fade patterns, particularly during high-rate cycling phases where mechanical stress becomes significant.
3.5. SOH Estimation Based on Integrated Model
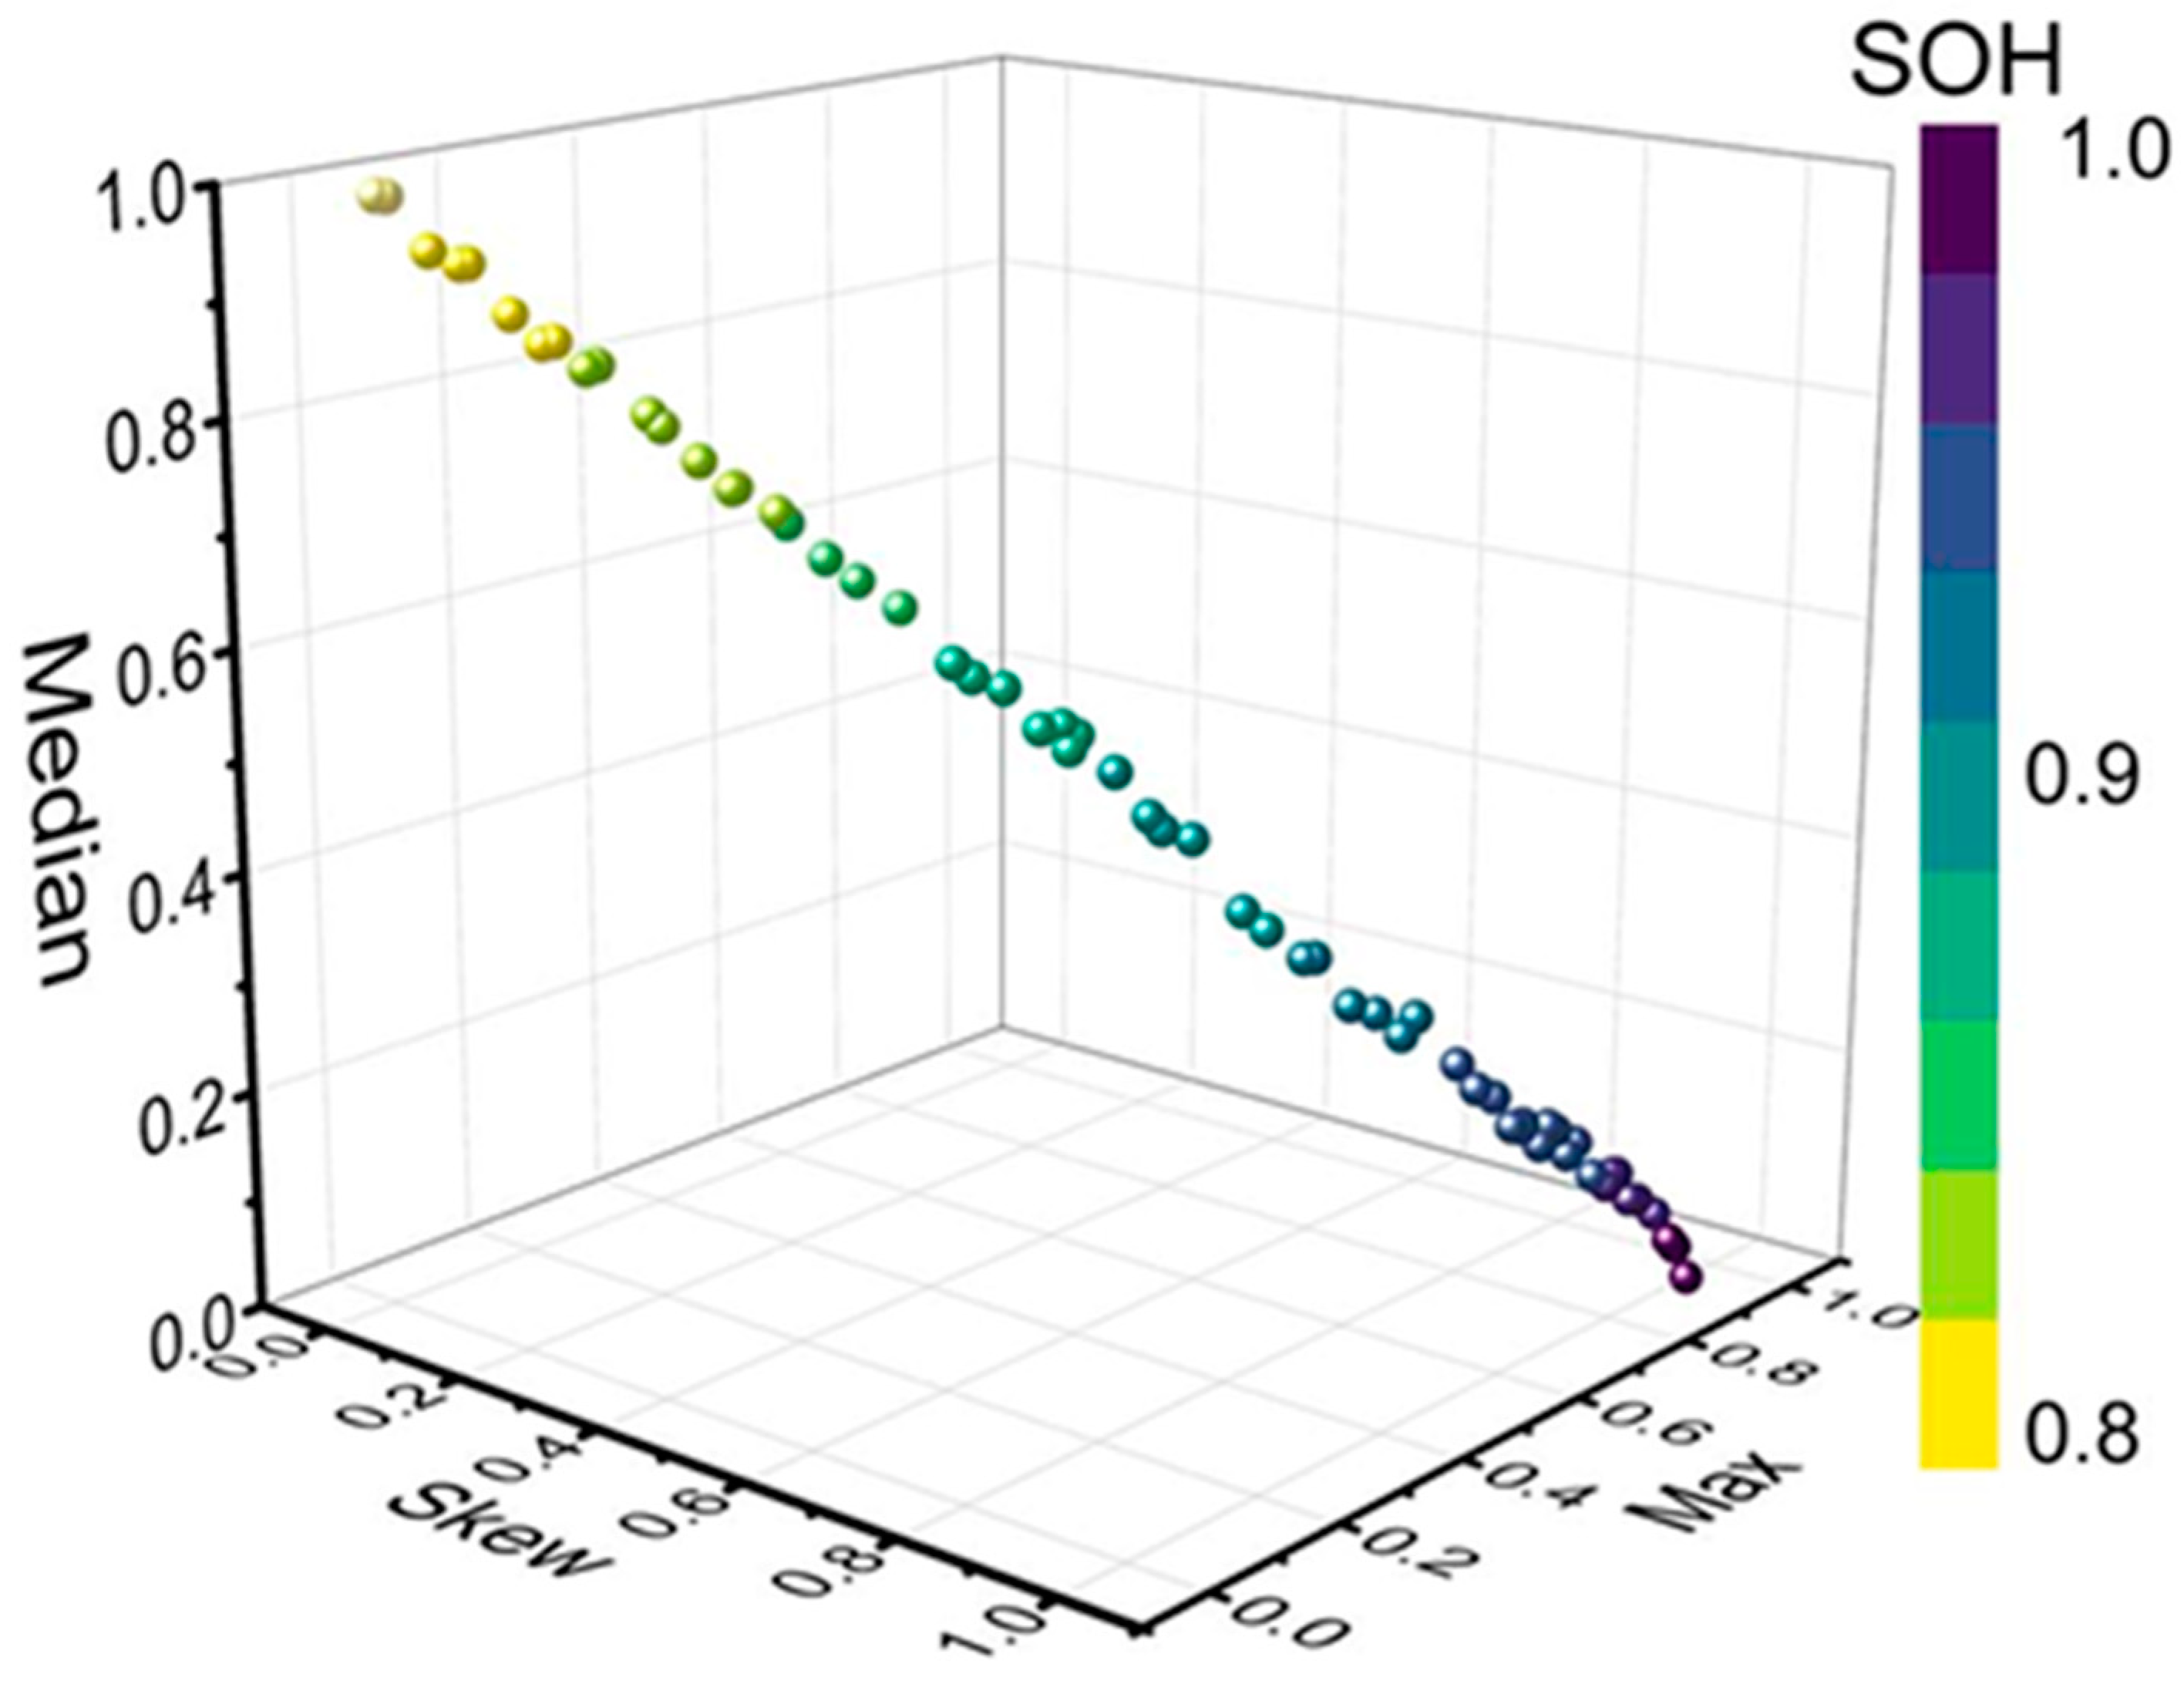
The relationship between the maximum value of the cyclic charge capacity curve and capacity degradation shown in Figure 6 reveals significant correlations between key statistical parameters of the cyclic charging profile and battery capacity degradation. Specifically, the maximum value of the cyclic charge capacity curve demonstrates an inverse relationship with capacity fade—as the cycle count accumulates, the attainable charge capacity within the fixed voltage window progressively diminishes. The median is the middle value of the sampled voltage. As the number of cycles increases, it shows that an increasing number of sampled voltage data points are above the average voltage (mean). The statistical skewness coefficient (γ₁), quantifying the asymmetric distribution of voltage plateaus during discharge, exhibits a right-skewed profile (γ₁ > 0) that progressively diminishes with cycling, correlating with the homogenization of Li-ion flux distribution caused by electrode porosity evolution. This corresponds to the shape of the cyclic charge curve, where initially, the voltage increases slowly, then gradually speeds up as the charging time progresses.

Figure 6.
LSTM features. Statistical features extracted from the partial charge voltage curve and partial charge capacity curve, including the median, skewness (Skew), and maximum value (Max) related to the SOH of battery.
The raw cycling-derived dataset is initially partitioned into input–output pairs, where operational parameters serve as input variables and discharge capacity represents the target output. To ensure rigorous model validation, a 10-fold cross-validation strategy is systematically implemented to train two distinct base learners: CNN for spatial feature extraction and LSTM network for temporal pattern recognition. The complementary strengths of these heterogeneous architectures are strategically leveraged through feature-level ensemble construction: The capacity predictions from both CNN and LSTM models are horizontally concatenated along with their respective temporal-spatial feature representations to form an augmented input matrix. This synthesized feature set, combined with the corresponding true discharge capacity values, establishes a meta-dataset for secondary learning. To capitalize on probabilistic modeling advantages, Gaussian Process Regression (GPR) is employed as the meta-learner, utilizing its inherent capability to quantify prediction uncertainty through Bayesian inference. The hierarchical training paradigm completes with GPR optimization on the constructed meta-dataset, enabling nonlinear integration of base model predictions while maintaining interpretability through covariance kernel analysis. Quantitative evaluation reveals the superiority of this ensemble approach, as demonstrated in Figure 7a comparing Root Mean Square Error (RMSE) metrics across different estimation methods. The proposed stacked ensemble achieves a remarkable 18.7% RMSE reduction compared to standalone CNN (3.601%) and 14.2% improvement over LSTM (3.413%), culminating in a minimal final RMSE of 2.928%. The statistical significance of these improvements is confirmed through paired t-tests (p < 0.01) across all cross-validation folds. Visual corroboration is provided in Figure 7b–d, illustrating the tight alignment between estimated and actual capacity trajectories. The ensemble predictions not only maintain consistency across full degradation cycles but also demonstrate enhanced stability during capacity regeneration phases—a critical advantage for practical battery management systems. This synergistic performance confirms the framework’s ability to effectively amalgamate heterogeneous model predictions through principled probabilistic integration, thereby achieving superior estimation accuracy and operational robustness in SOH monitoring.
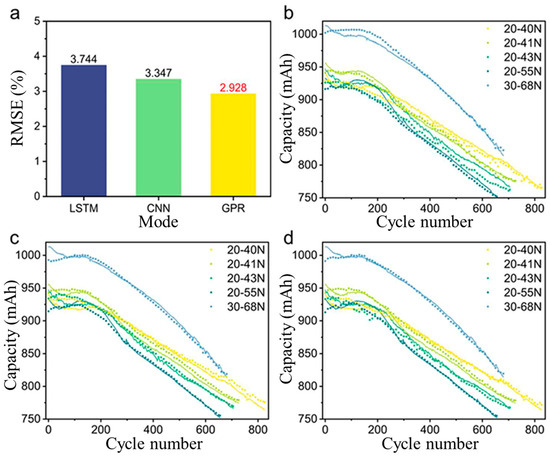
Figure 7.
Battery capacity estimation with different methods on the same dataset. (a) RMSE of capacity estimation results for different methods. The predicted values versus the actual capacities with (b) LSTM, (c) CNN, and (d) GPR.
3.6. RUL Estimation
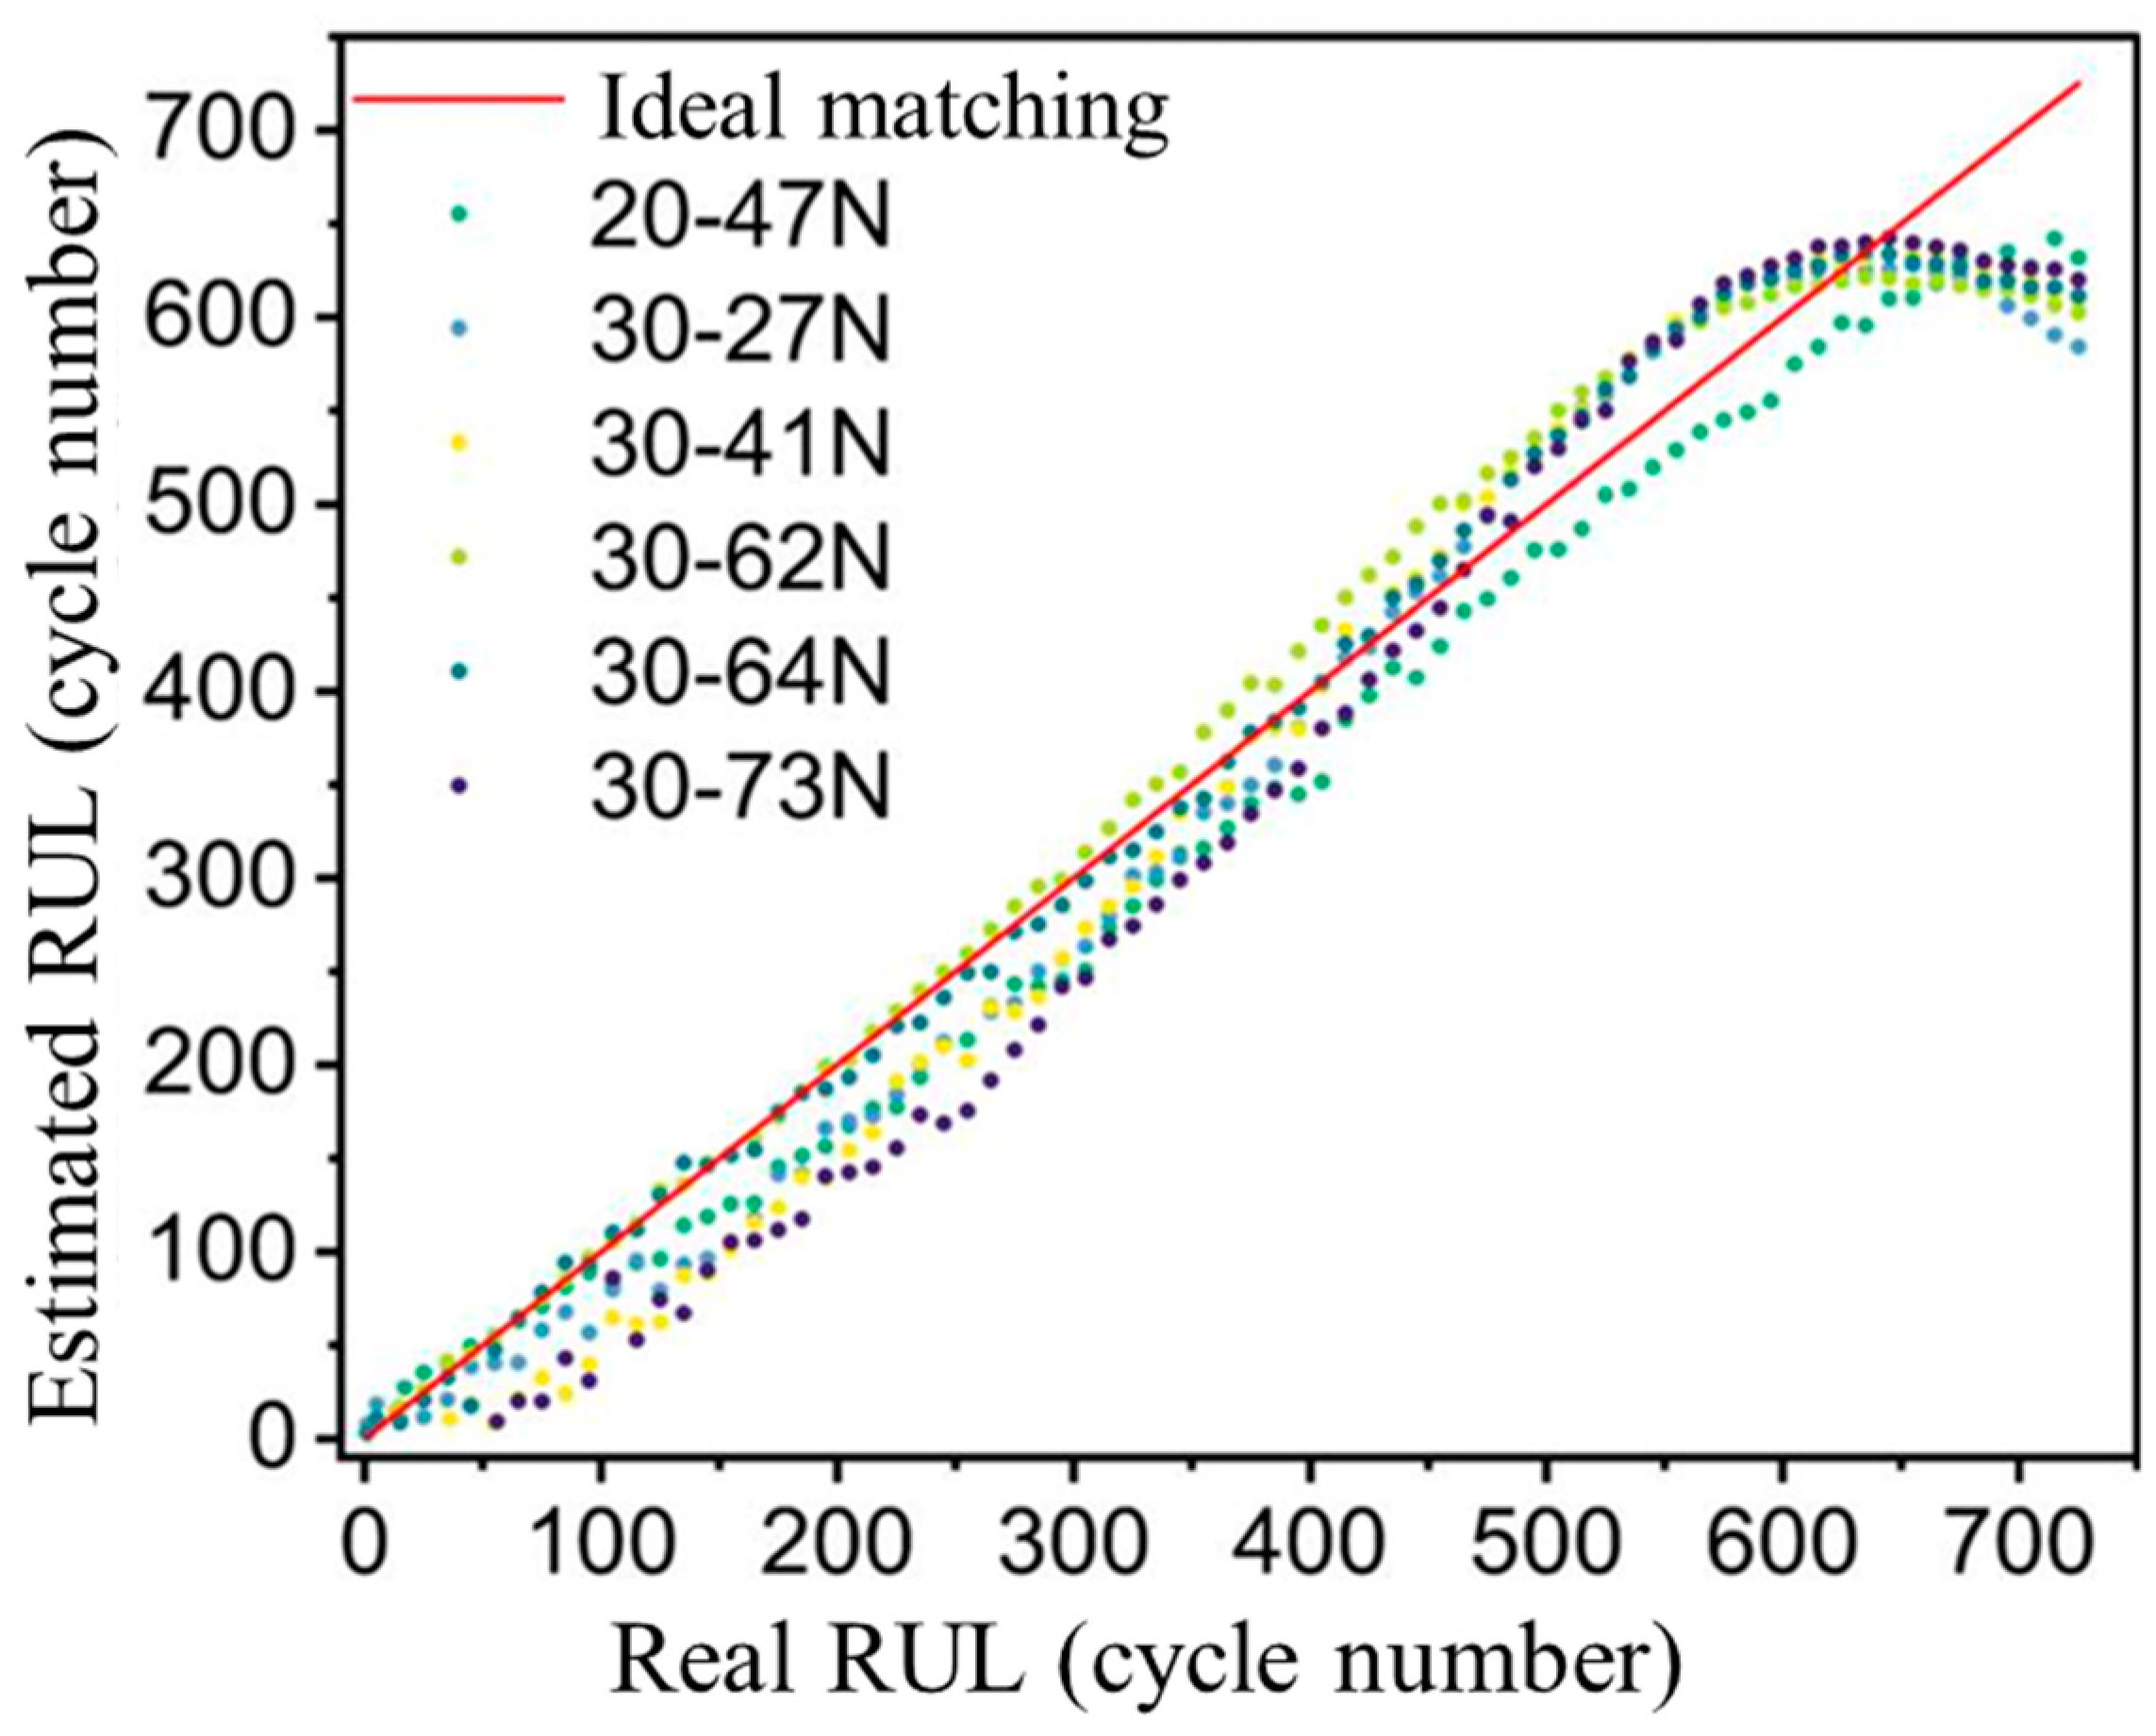
The RUL estimation results presented in Figure 8 demonstrate a characteristic evolution pattern of prediction accuracy throughout the battery aging process. While the predicted RUL values generally follow the actual degradation trajectory, the prediction performance exhibits temporal dependency. Specifically, the data-driven model shows greater deviations during initial degradation phases, with prediction errors gradually diminishing as cycling progresses. This phenomenon can be attributed to the adaptive learning mechanism of model that continuously incorporates real-time degradation patterns through online updating algorithms. Notably, the prediction reliability significantly improves during the latter lifespan (corresponding to accelerated degradation phases), achieving sufficient accuracy for practical decision-making applications. Statistical analysis reveals an average RMSE of 38 cycles for conventional RUL predictions, which is substantially reduced to 16 cycles through our optimized estimation framework (detailed parameters in Table 2). This temporal accuracy progression carries critical practical implications. During early degradation stages when failure mechanisms remain stochastic, the conservative prediction intervals provide sufficient safety margins. As batteries approach their end-of-life threshold (typically 80% capacity retention), the enhanced prediction accuracy (RMSE < 20 cycles) enables three key operational strategies: (1) development of optimized charge–discharge protocols to extend residual lifespan through degradation-aware management; (2) predictive maintenance scheduling for critical battery pack components; and (3) risk-informed replacement planning to prevent thermal runaway incidents. Particularly for electric vehicle applications, this phased accuracy characteristic aligns well with real-world usage patterns—early warnings facilitate long-term battery health planning, while precise RUL predictions enable safe retirement management.

Figure 8.
The relationship between estimated and real RUL.
Table 2.
The RMSE of RUL prediction with different number of features.
4. Conclusions
This study establishes a data-centric paradigm for LIB health prognostics through comprehensive multidimensional feature analysis. By systematically integrating electromechanical-thermal coupling characteristics with deep learning architectures, we propose a physics-informed neural network that effectively deciphers the complex degradation patterns throughout the battery lifecycle. The developed model synergistically combines real-time electrical signatures, thermal dynamics, and mechanical responses through a hierarchical attention mechanism, enabling adaptive weight allocation for dominant aging indicators. Experimental validation using formation-cycle pressure-controlled datasets reveals the critical role of electrode-level mechanical constraints in modulating degradation pathways. Our optimized framework achieves state-of-the-art performance with 2.928% RMSE in state-of-health (SOH) estimation and 16-cycle tolerance in remaining-useful-life (RUL) prediction, representing improvements, respectively, compared to conventional electrical-only models. The pressure-dependent calendric aging analysis further demonstrates a nonlinear correlation between mechanical stress and capacity fade rate, where optimal constraint forces mitigate parasitic reactions while maintaining interfacial stability.
These findings provide three critical advancements for next-generation battery management systems: (1) a new paradigm for multiphysics feature engineering that bridges macroscopic measurements with mesoscale electrochemical processes; (2) quantitative evidence of stress-mediated degradation mechanisms through in operando mechanical-electrochemical correlation; and (3) a transferable deep learning architecture adaptable to various battery chemistries and form factors. The proposed methodology not only enhances prediction accuracy but also enables proactive safety control through early detection of mechanical integrity loss—a critical capability for high-risk applications in electric aviation and grid-scale storage systems. Future studies will focus on implementing this framework in embedded BMS hardware and extending the multiphysics correlation models to extreme operating conditions. This research ultimately paves the way for self-adaptive battery systems capable of real-time health diagnosis and lifespan optimization through continuous learning of coupled electrochemical-mechanical dynamics.
Author Contributions
Methodology, W.H.; Investigation, D.Y.; Resources, W.H.; Data curation, D.Y.; Writing—original draft, D.Y.; Writing—review & editing, X.H. All authors have read and agreed to the published version of the manuscript.
Funding
Weilin He and Xin He acknowledge the financial support of the Fundamental Research Funds for the Central Universities (SCU2023HGXY).
Data Availability Statement
The original contributions presented in this study are included in the article. Further inquiries can be directed to the corresponding author.
Conflicts of Interest
The authors declare no conflicts of interest.
References
- Harper, G.; Sommerville, R.; Kendrick, E.; Driscoll, L.; Slater, P.; Stolkin, R.; Walton, A.; Christensen, P.; Heidrich, O.; Lambert, S.; et al. Recycling lithium-ion batteries from electric vehicles. Nature 2019, 575, 75–86. [Google Scholar] [CrossRef] [PubMed]
- Zhang, R.; Wang, C.; Zou, P.; Lin, R.; Ma, L.; Li, T.; Hwang, I.-H.; Xu, W.; Sun, C.; Trask, S.; et al. Long-life lithium-ion batteries realized by low-Ni, Co-free cathode chemistry. Nat. Energy 2023, 8, 695–702. [Google Scholar] [CrossRef]
- Li, Y.; Guo, W.; Stroe, D.-I.; Zhao, H.; Kristensen, P.K.; Jensen, L.R.; Pedersen, K.; Gurevich, L. Evolution of aging mechanisms and performance degradation of lithium-ion battery from moderate to severe capacity loss scenarios. Chem. Eng. J. 2024, 498, 155588. [Google Scholar] [CrossRef]
- Ng, M.-F.; Zhao, J.; Yan, Q.; Conduit, G.J.; Seh, Z.W. Predicting the state of charge and health of batteries using data-driven machine learning. Nat. Mach. Intell. 2020, 2, 161–170. [Google Scholar] [CrossRef]
- Hu, X.; Feng, F.; Liu, K.; Zhang, L.; Xie, J.; Liu, B. State estimation for advanced battery management: Key challenges and future trends. Renew. Sustain. Energy Rev. 2019, 114, 109334. [Google Scholar] [CrossRef]
- Tang, Y.; Zhong, S.; Wang, P.; Zhang, Y.; Wang, Y. Remaining useful life prediction of high-capacity lithium-ion batteries based on incremental capacity analysis and Gaussian kernel function optimization. Sci. Rep. 2024, 14, 23524. [Google Scholar] [CrossRef] [PubMed]
- Li, C.; Yang, L.; Li, Q.; Zhang, Q.; Zhou, Z.; Meng, Y.; Zhao, X.; Wang, L.; Zhang, S.; Li, Y.; et al. SOH estimation method for lithium-ion batteries based on an improved equivalent circuit model via electrochemical impedance spectroscopy. J. Energy Storage 2024, 86, 111167. [Google Scholar] [CrossRef]
- Lu, J.; Xiong, R.; Tian, J.; Wang, C.; Sun, F. Deep learning to estimate lithium-ion battery state of health without additional degradation experiments. Nat. Commun. 2023, 14, 2760. [Google Scholar] [CrossRef]
- Li, R.; Kirkaldy, N.D.; Oehler, F.F.; Marinescu, M.; Offer, G.J.; O’kane, S.E.J. The importance of degradation mode analysis in parameterising lifetime prediction models of lithium-ion battery degradation. Nat. Commun. 2025, 16, 2776. [Google Scholar] [CrossRef] [PubMed]
- Shuai, W.; Yiting, L.; Shoubin, Z.; Lifei, C.; Pecht, M. Remaining useful life prediction of lithium-ion batteries using a novel particle flow filter framework with grey model. Sci. Rep. 2025, 15, 3311. [Google Scholar] [CrossRef]
- Iftikhar, M.; Shoaib, M.; Altaf, A.; Iqbal, F.; Villar, S.G.; Lopez, L.A.D.; Ashraf, I. A deep learning approach to optimize remaining useful life prediction for Li-ion batteries. Sci. Rep. 2024, 14, 25838. [Google Scholar] [CrossRef] [PubMed]
- Wang, Y.; Zhang, X.; Li, K.; Zhao, G.; Chen, Z. Perspectives and challenges for future lithium-ion battery control and management. eTransportation 2023, 18, 100260. [Google Scholar] [CrossRef]
- Zeng, S.; Chen, S.; Alkali, B. Lithium-Ion Battery Capacity Estimation Based on Incremental Capacity Analysis and Deep Convolutional Neural Network. Energies 2024, 17, 1272. [Google Scholar] [CrossRef]
- Wan, Z.; Kang, Y.; Ou, R.; Xue, S.; Xu, D.; Luo, X. Multi-step time series forecasting on the temperature of lithium-ion batteries. J. Energy Storage 2023, 64, 107092. [Google Scholar] [CrossRef]
- Roman, D.; Saxena, S.; Robu, V.; Pecht, M.; Flynn, D. Machine learning pipeline for battery state-of-health estimation. Nat. Mach. Intell. 2021, 3, 447–456. [Google Scholar] [CrossRef]
- Tian, J.; Xiong, R.; Shen, W.; Lu, J.; Sun, F. Flexible battery state of health and state of charge estimation using partial charging data and deep learning. Energy Storage Mater. 2022, 51, 372–381. [Google Scholar] [CrossRef]
- Wang, F.; Zhai, Z.; Zhao, Z.; Di, Y.; Chen, X. Physics-informed neural network for lithium-ion battery degradation stable modeling and prognosis. Nat. Commun. 2024, 15, 4332. [Google Scholar] [CrossRef]
- Zhang, L.; Zhang, J.; Gao, T.; Lyu, L.; Wang, L.; Shi, W.; Jiang, L.; Cai, G. Improved LSTM based state of health estimation using random segments of the charging curves for lithium-ion batteries. J. Energy Storage 2023, 74, 109370. [Google Scholar] [CrossRef]
- Sun, Z.; He, W.; Wang, J.; He, X. State of Health Estimation for Lithium-Ion Batteries with Deep Learning Approach and Direct Current Internal Resistance. Energies 2024, 17, 2487. [Google Scholar] [CrossRef]
- Hosen, M.S.; Jaguemont, J.; Van Mierlo, J.; Berecibar, M. Battery lifetime prediction and performance assessment of different modeling approaches. iScience 2021, 24, 102060. [Google Scholar] [CrossRef]
- Ma, L.; Tian, J.; Zhang, T.; Guo, Q.; Hu, C. Accurate and efficient remaining useful life prediction of batteries enabled by physics-informed machine learning. J. Energy Chem. 2024, 91, 512–521. [Google Scholar] [CrossRef]
- He, W.; Li, D.; Sun, Z.; Wang, C.; Tang, S.; Chen, J.; Geng, X.; Wang, H.; Liu, Z.; Hu, L.; et al. Data-driven estimation of battery state-of-health with formation features. J. Micromechanics Microengineering 2024, 34, 075004. [Google Scholar] [CrossRef]
- Xiao, Y.; Wang, Y.; Bo, S.-H.; Kim, J.C.; Miara, L.J.; Ceder, G. Understanding interface stability in solid-state batteries. Nat. Rev. Mater. 2020, 5, 105–126. [Google Scholar] [CrossRef]
- Li, Y.; Huang, W.; Li, Y.; Pei, A.; Boyle, D.T.; Cui, Y. Correlating Structure and Function of Battery Interphases at Atomic Resolution Using Cryoelectron Microscopy. Joule 2018, 2, 2167–2177. [Google Scholar] [CrossRef]
- Shuchi, S.B.; Oyakhire, S.T.; Zhang, W.; Sayavong, P.; Ye, Y.; Chen, Y.; Yu, Z.; Cui, Y.; Bent, S.F. Deconvoluting Effects of Lithium Morphology and SEI Stability at Moderate Current Density Using Interface Engineering. Adv. Mater. Interfaces 2024, 11, 304. [Google Scholar] [CrossRef]
- Zhang, S.; Li, Y.; Bannenberg, L.J.; Liu, M.; Ganapathy, S.; Wagemaker, M. The lasting impact of formation cycling on the Li-ion kinetics between SEI and the Li-metal anode and its correlation with efficiency. Sci. Adv. 2024, 10, eadj8889. [Google Scholar] [CrossRef] [PubMed]
- Xie, S.; Ren, L.; Yang, X.; Wang, H.; Sun, Q.; Chen, X.; He, Y. Influence of cycling aging and ambient pressure on the thermal safety features of lithium-ion battery. J. Power Sources 2020, 448, 227425. [Google Scholar] [CrossRef]
- Li, Z.; Tu, H.; Wang, H.; Hu, L.; Chen, S.; Yan, R.; He, X. Data-driven assessment of lithium-ion battery degradation using thermal patterns from computer vision. J. Energy Chem. 2025, 105, 852–859. [Google Scholar] [CrossRef]


Disclaimer/Publisher’s Note: The statements, opinions and data contained in all publications are solely those of the individual author(s) and contributor(s) and not of MDPI and/or the editor(s). MDPI and/or the editor(s) disclaim responsibility for any injury to people or property resulting from any ideas, methods, instructions or products referred to in the content. |
© 2025 by the authors. Licensee MDPI, Basel, Switzerland. This article is an open access article distributed under the terms and conditions of the Creative Commons Attribution (CC BY) license (https://creativecommons.org/licenses/by/4.0/).