
Comparable Study on Celadon Production Fueled by Methanol and Liquefied Petroleum Gas at Industry Scale

 , ,
, , 


Abstract
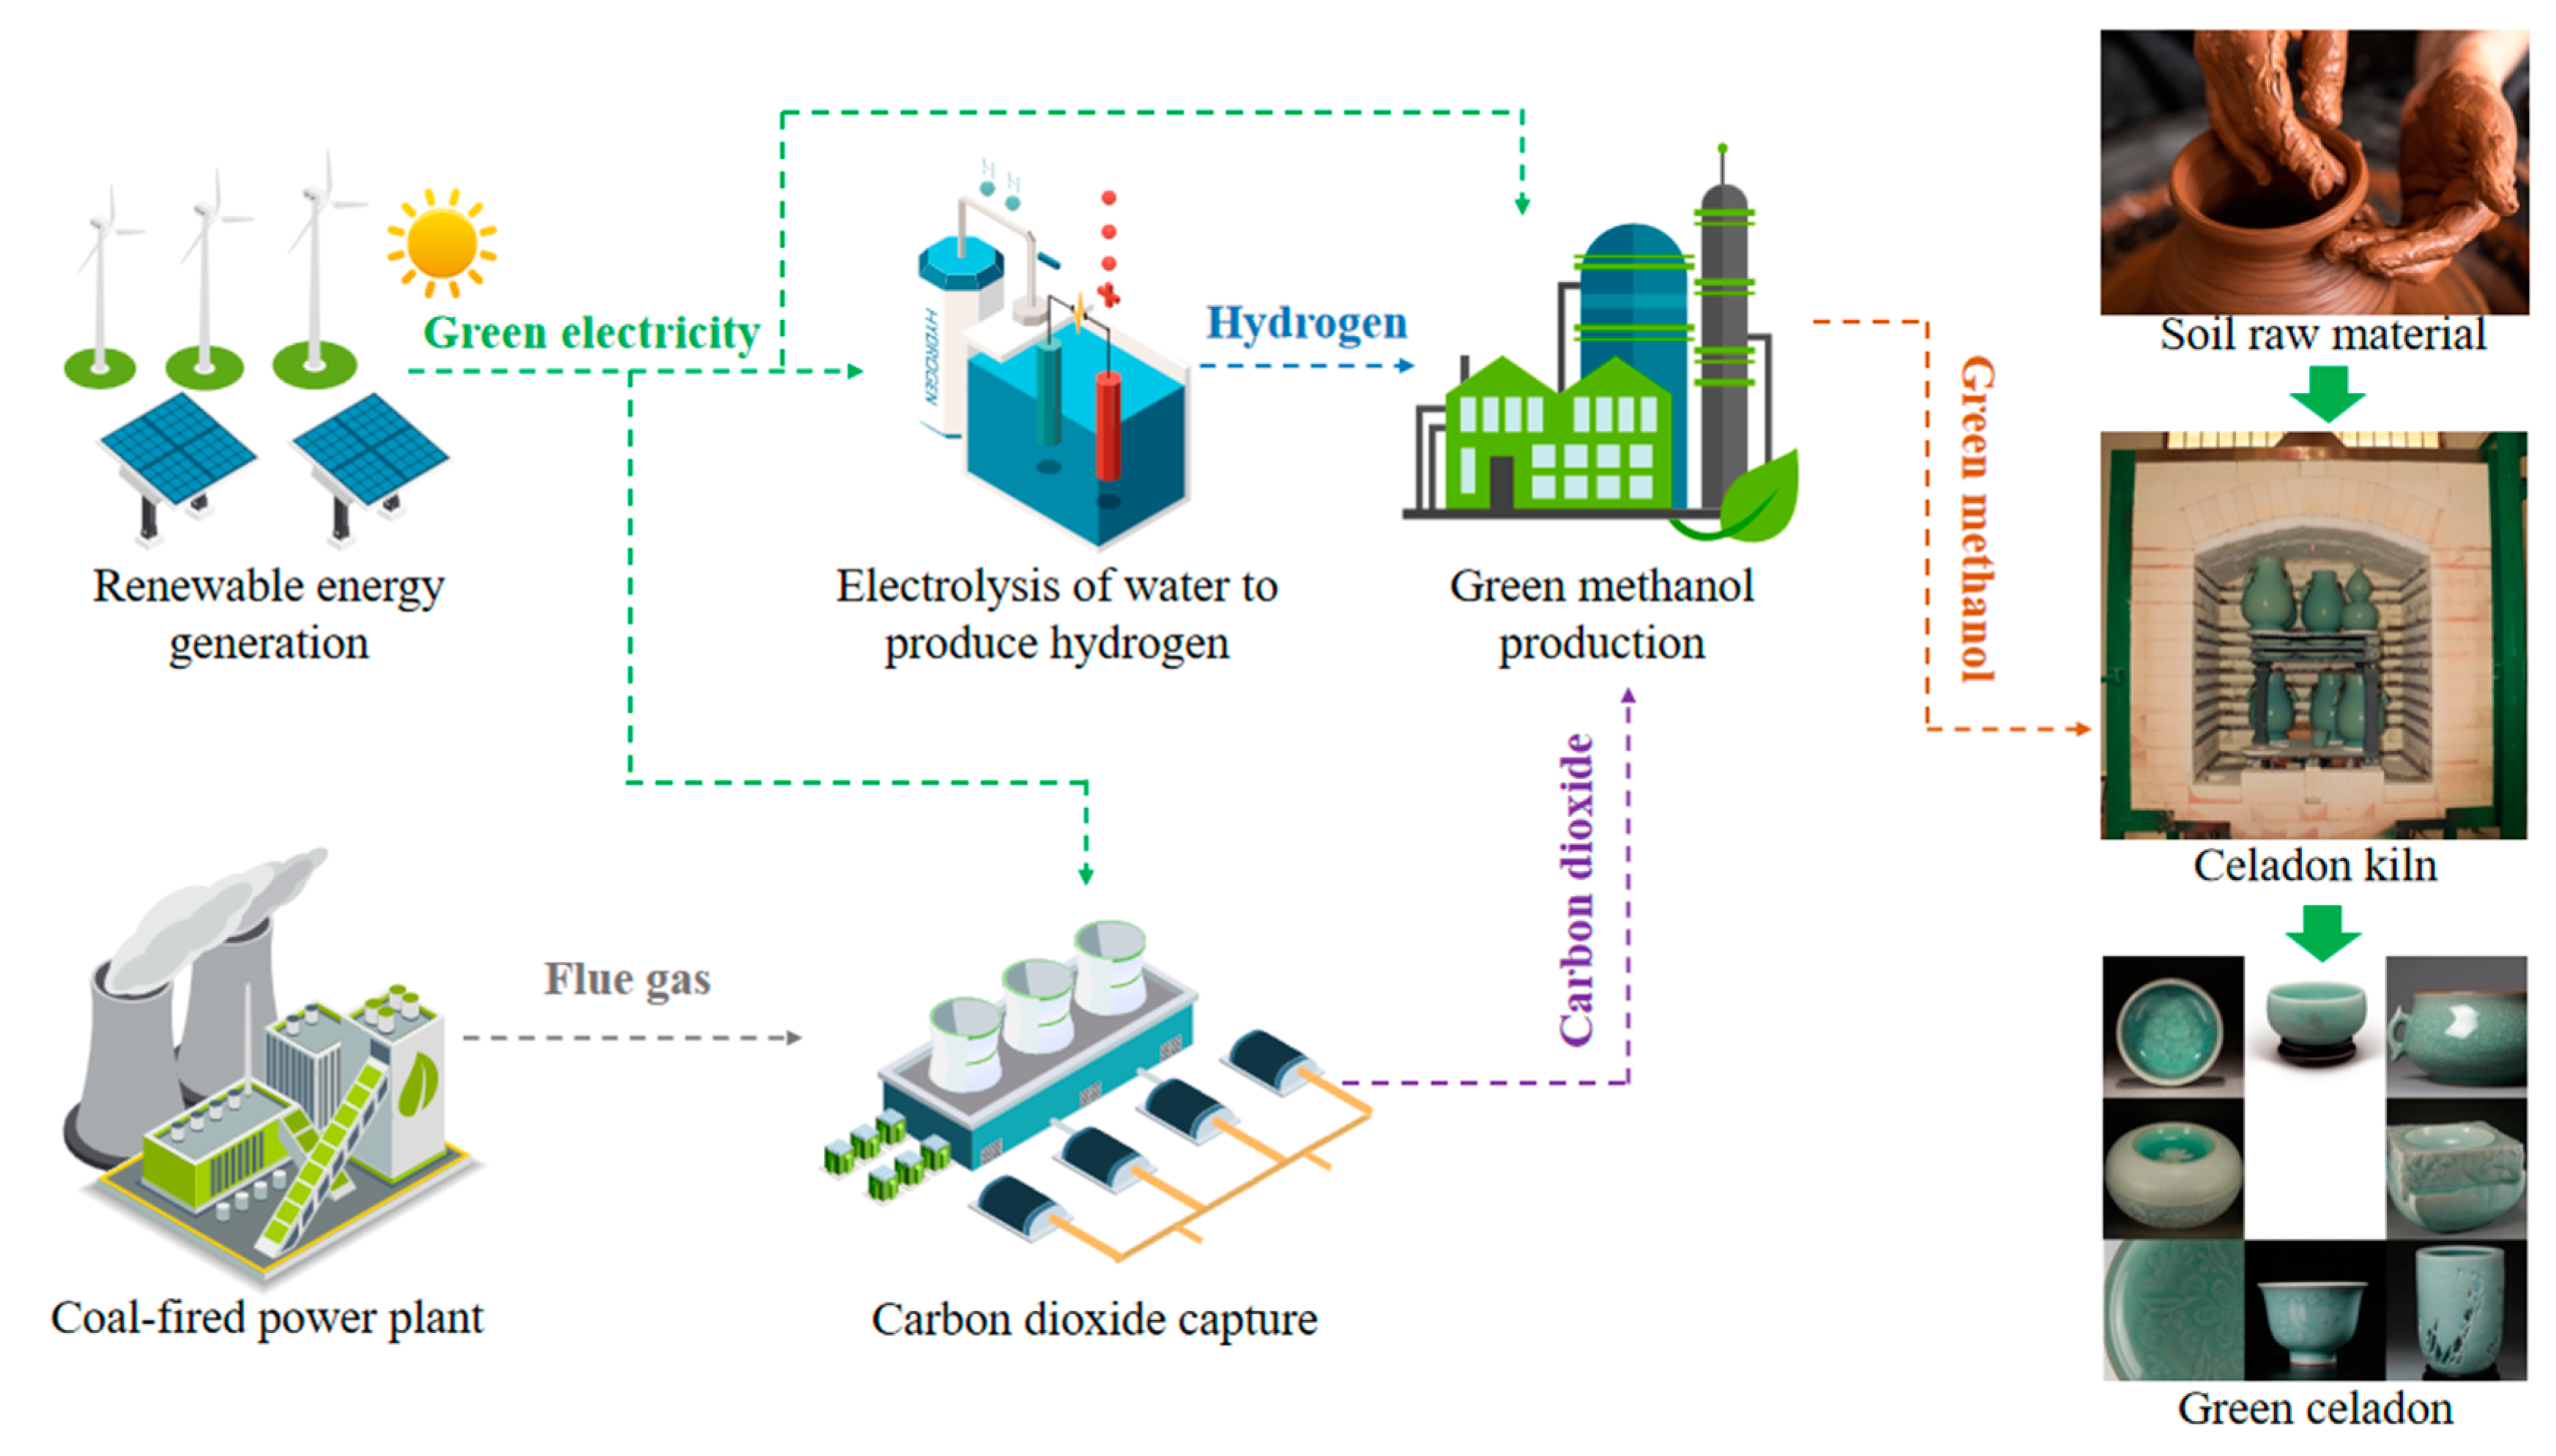
1. Introduction
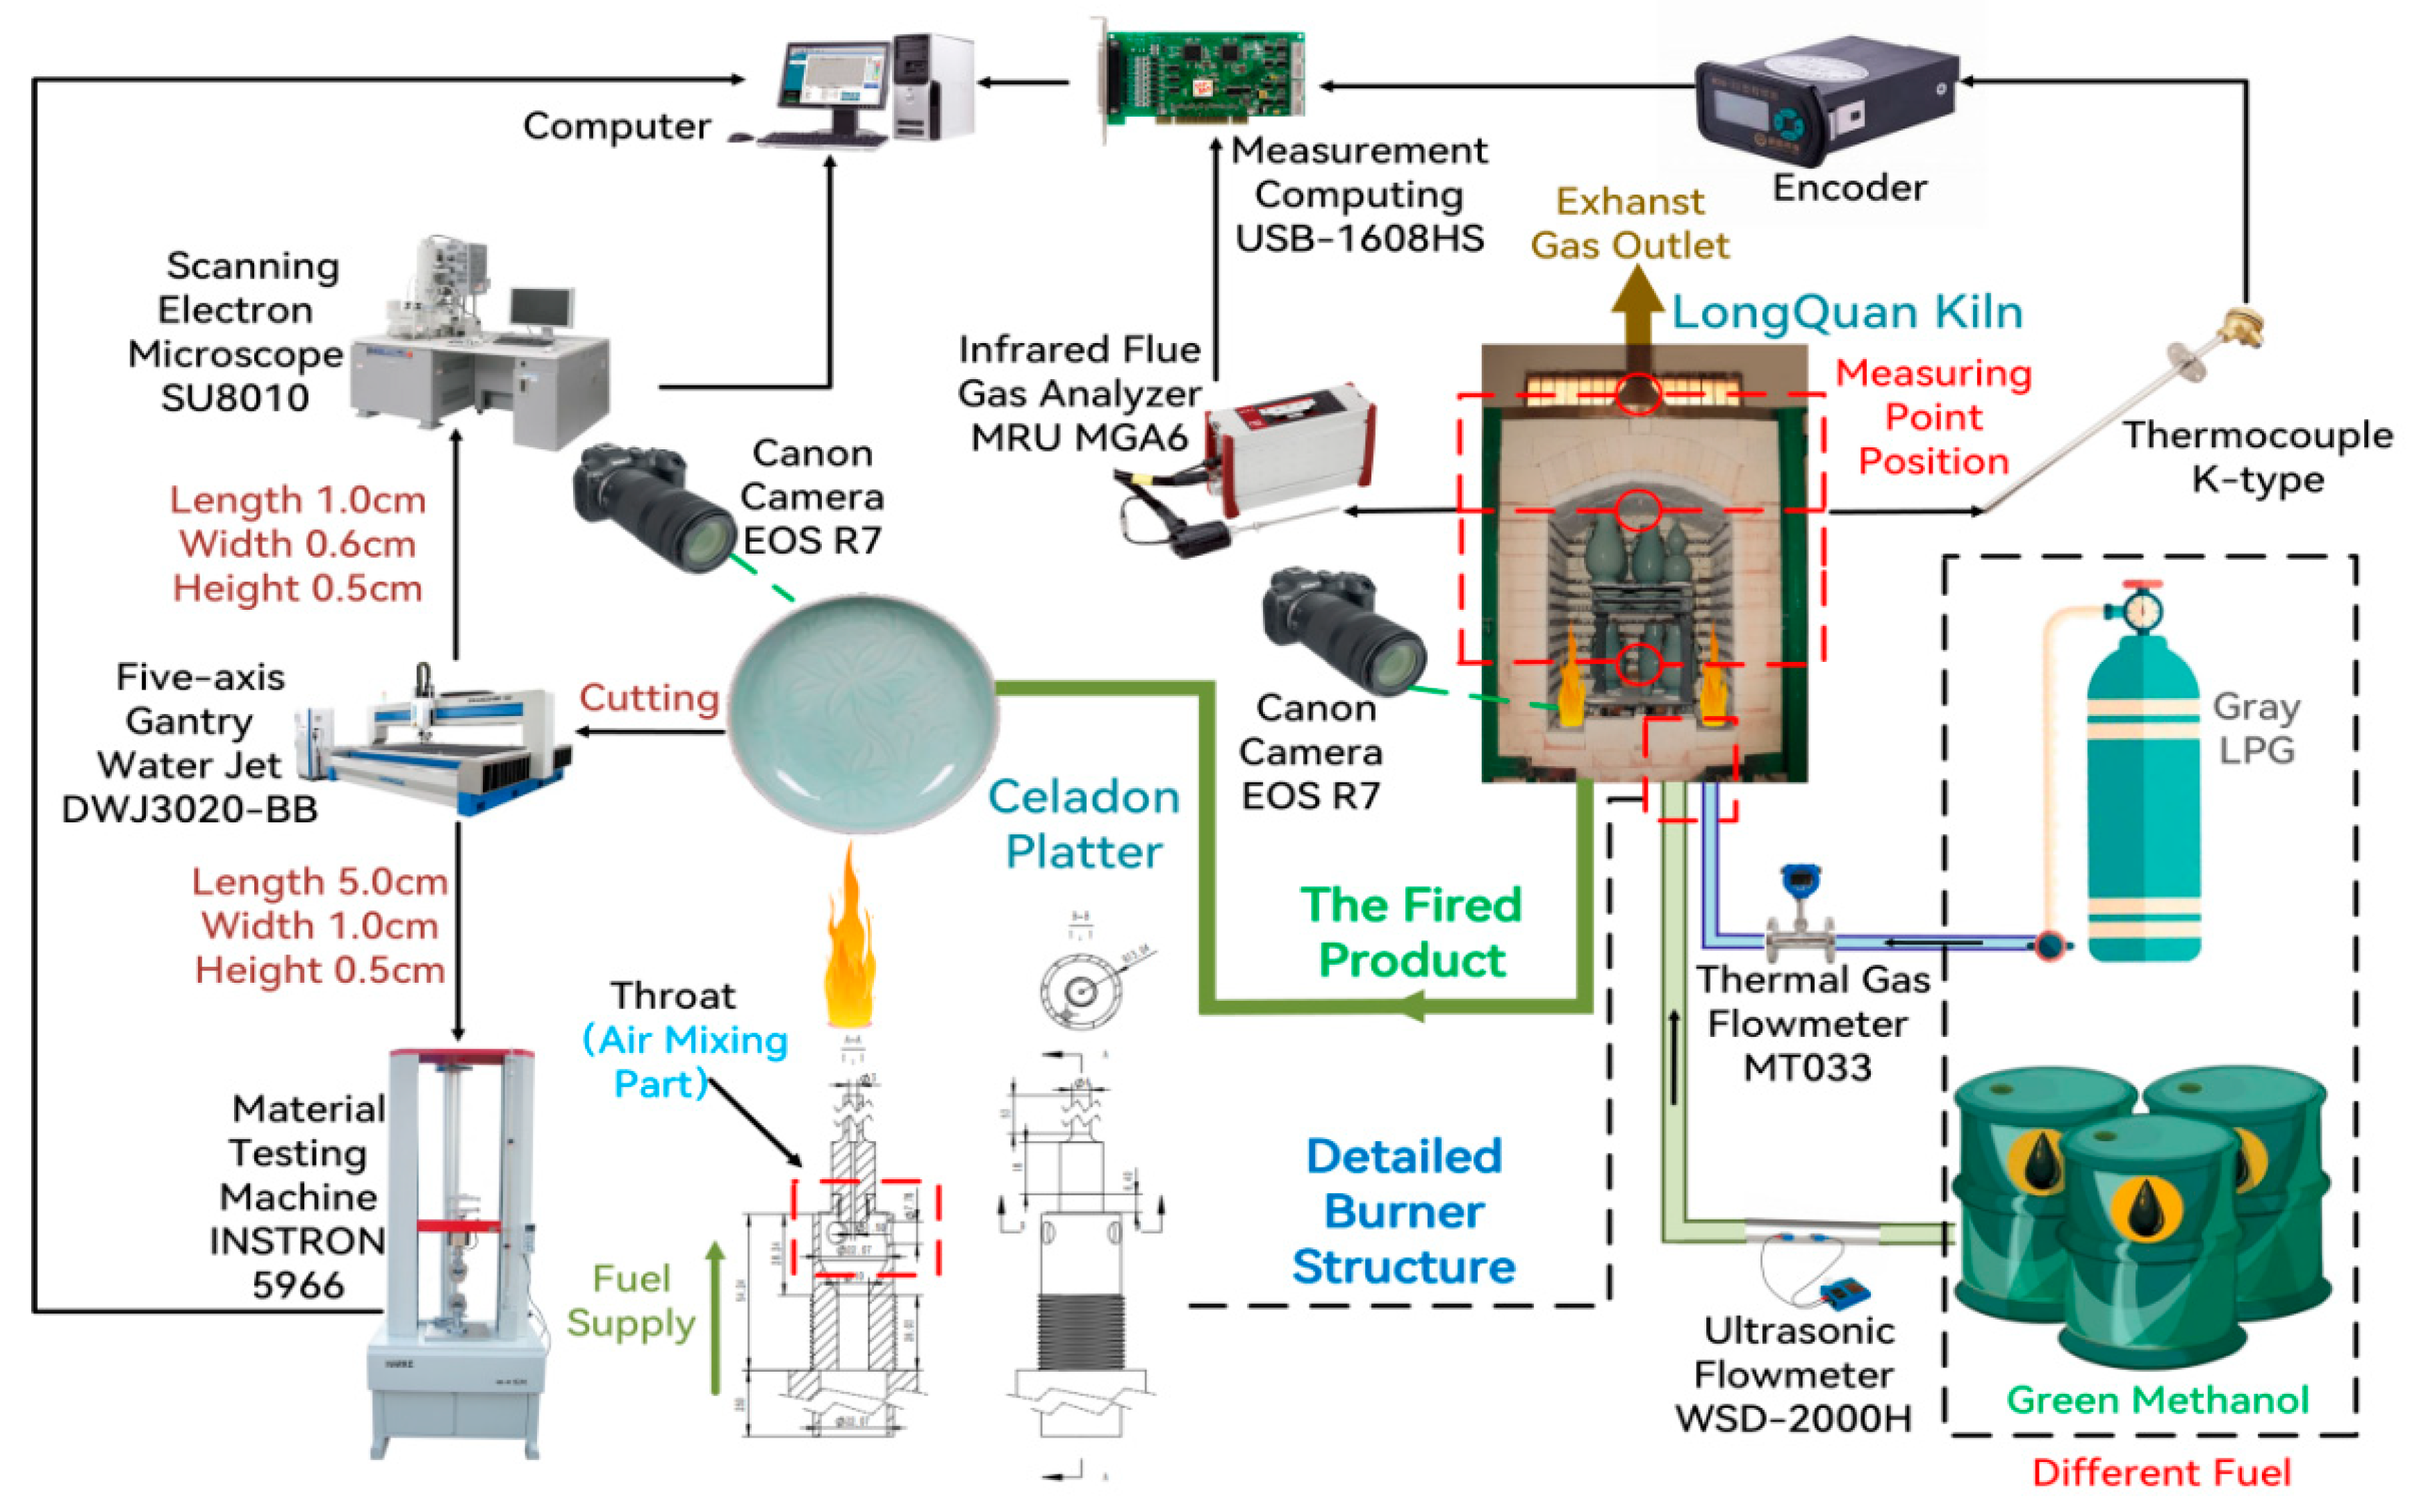
2. Experimental Method
3. Result and Discussion
3.1. Comparative Analysis of Flame Appearances
3.2. Assessment of Celadon Firing Process
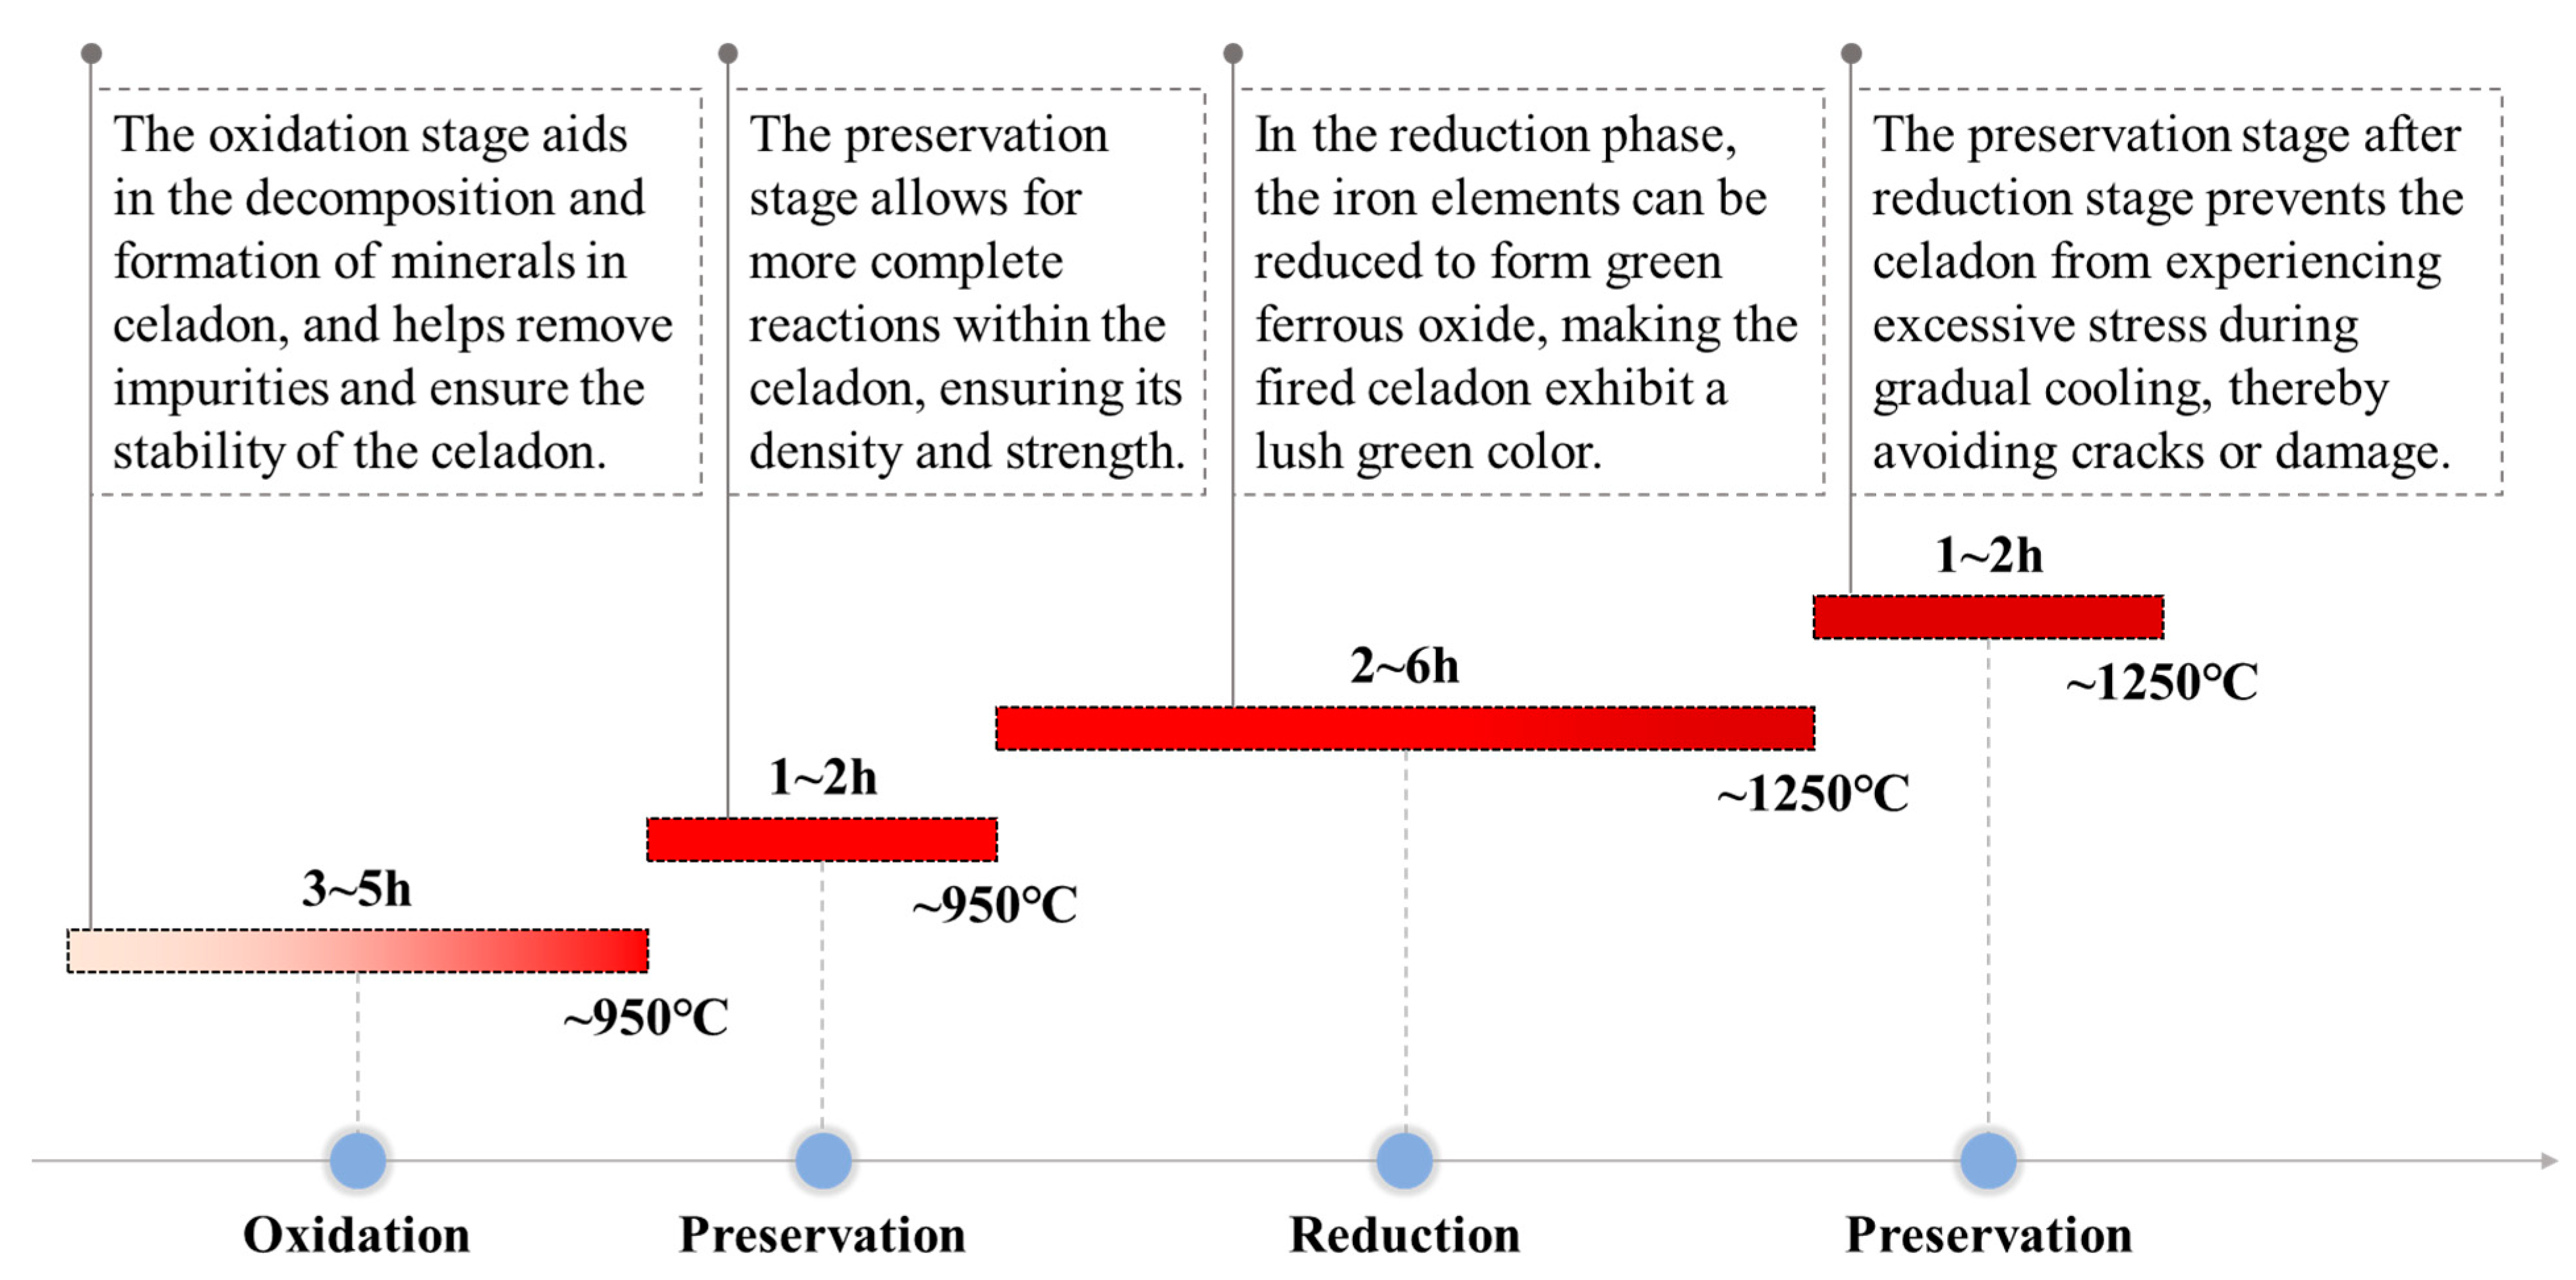
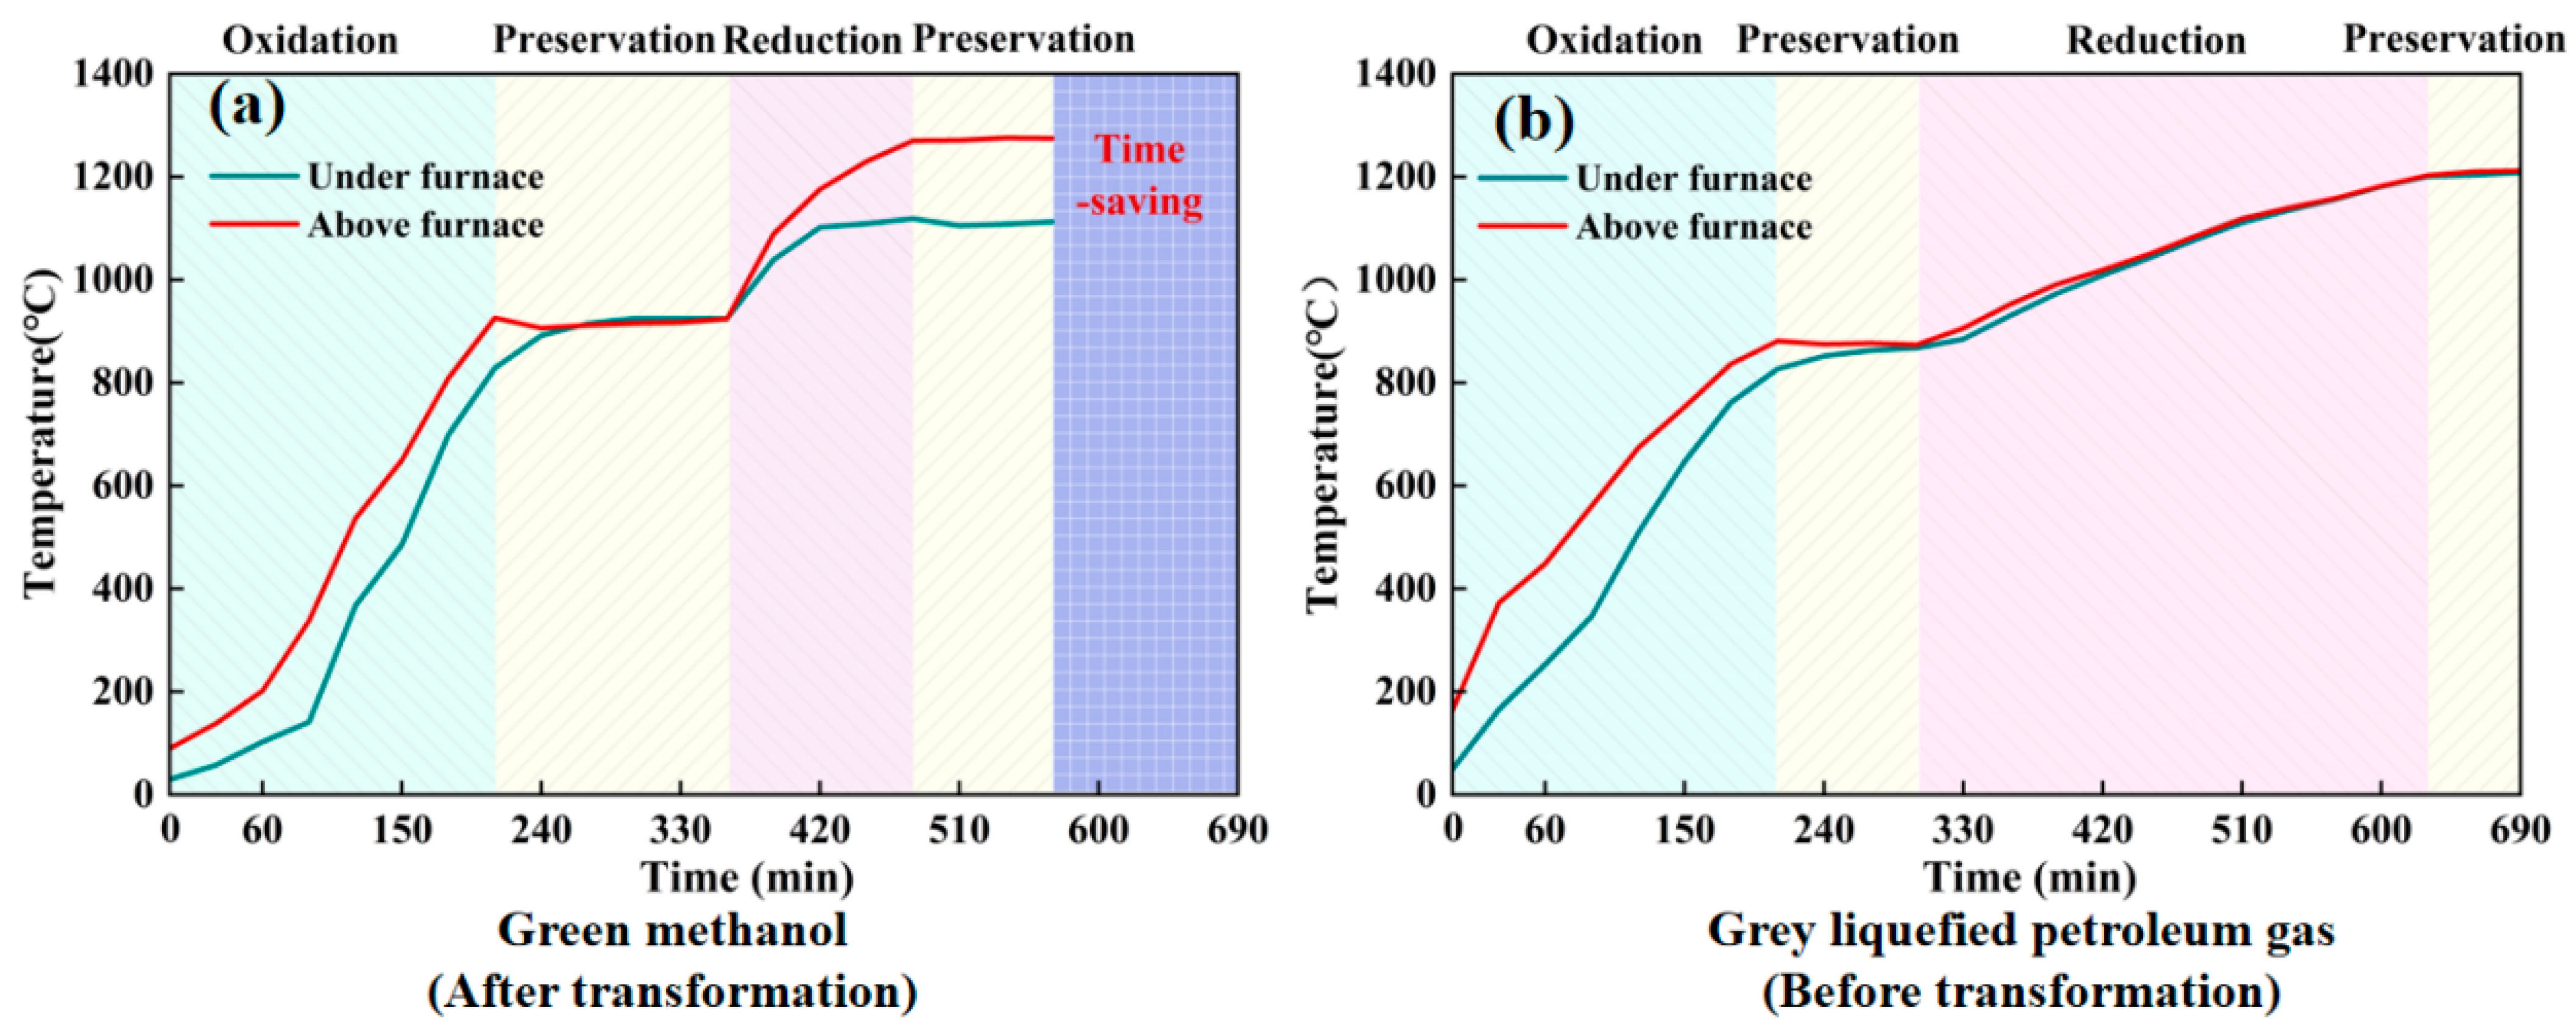
3.2.1. Temperature Changes During the Firing Process
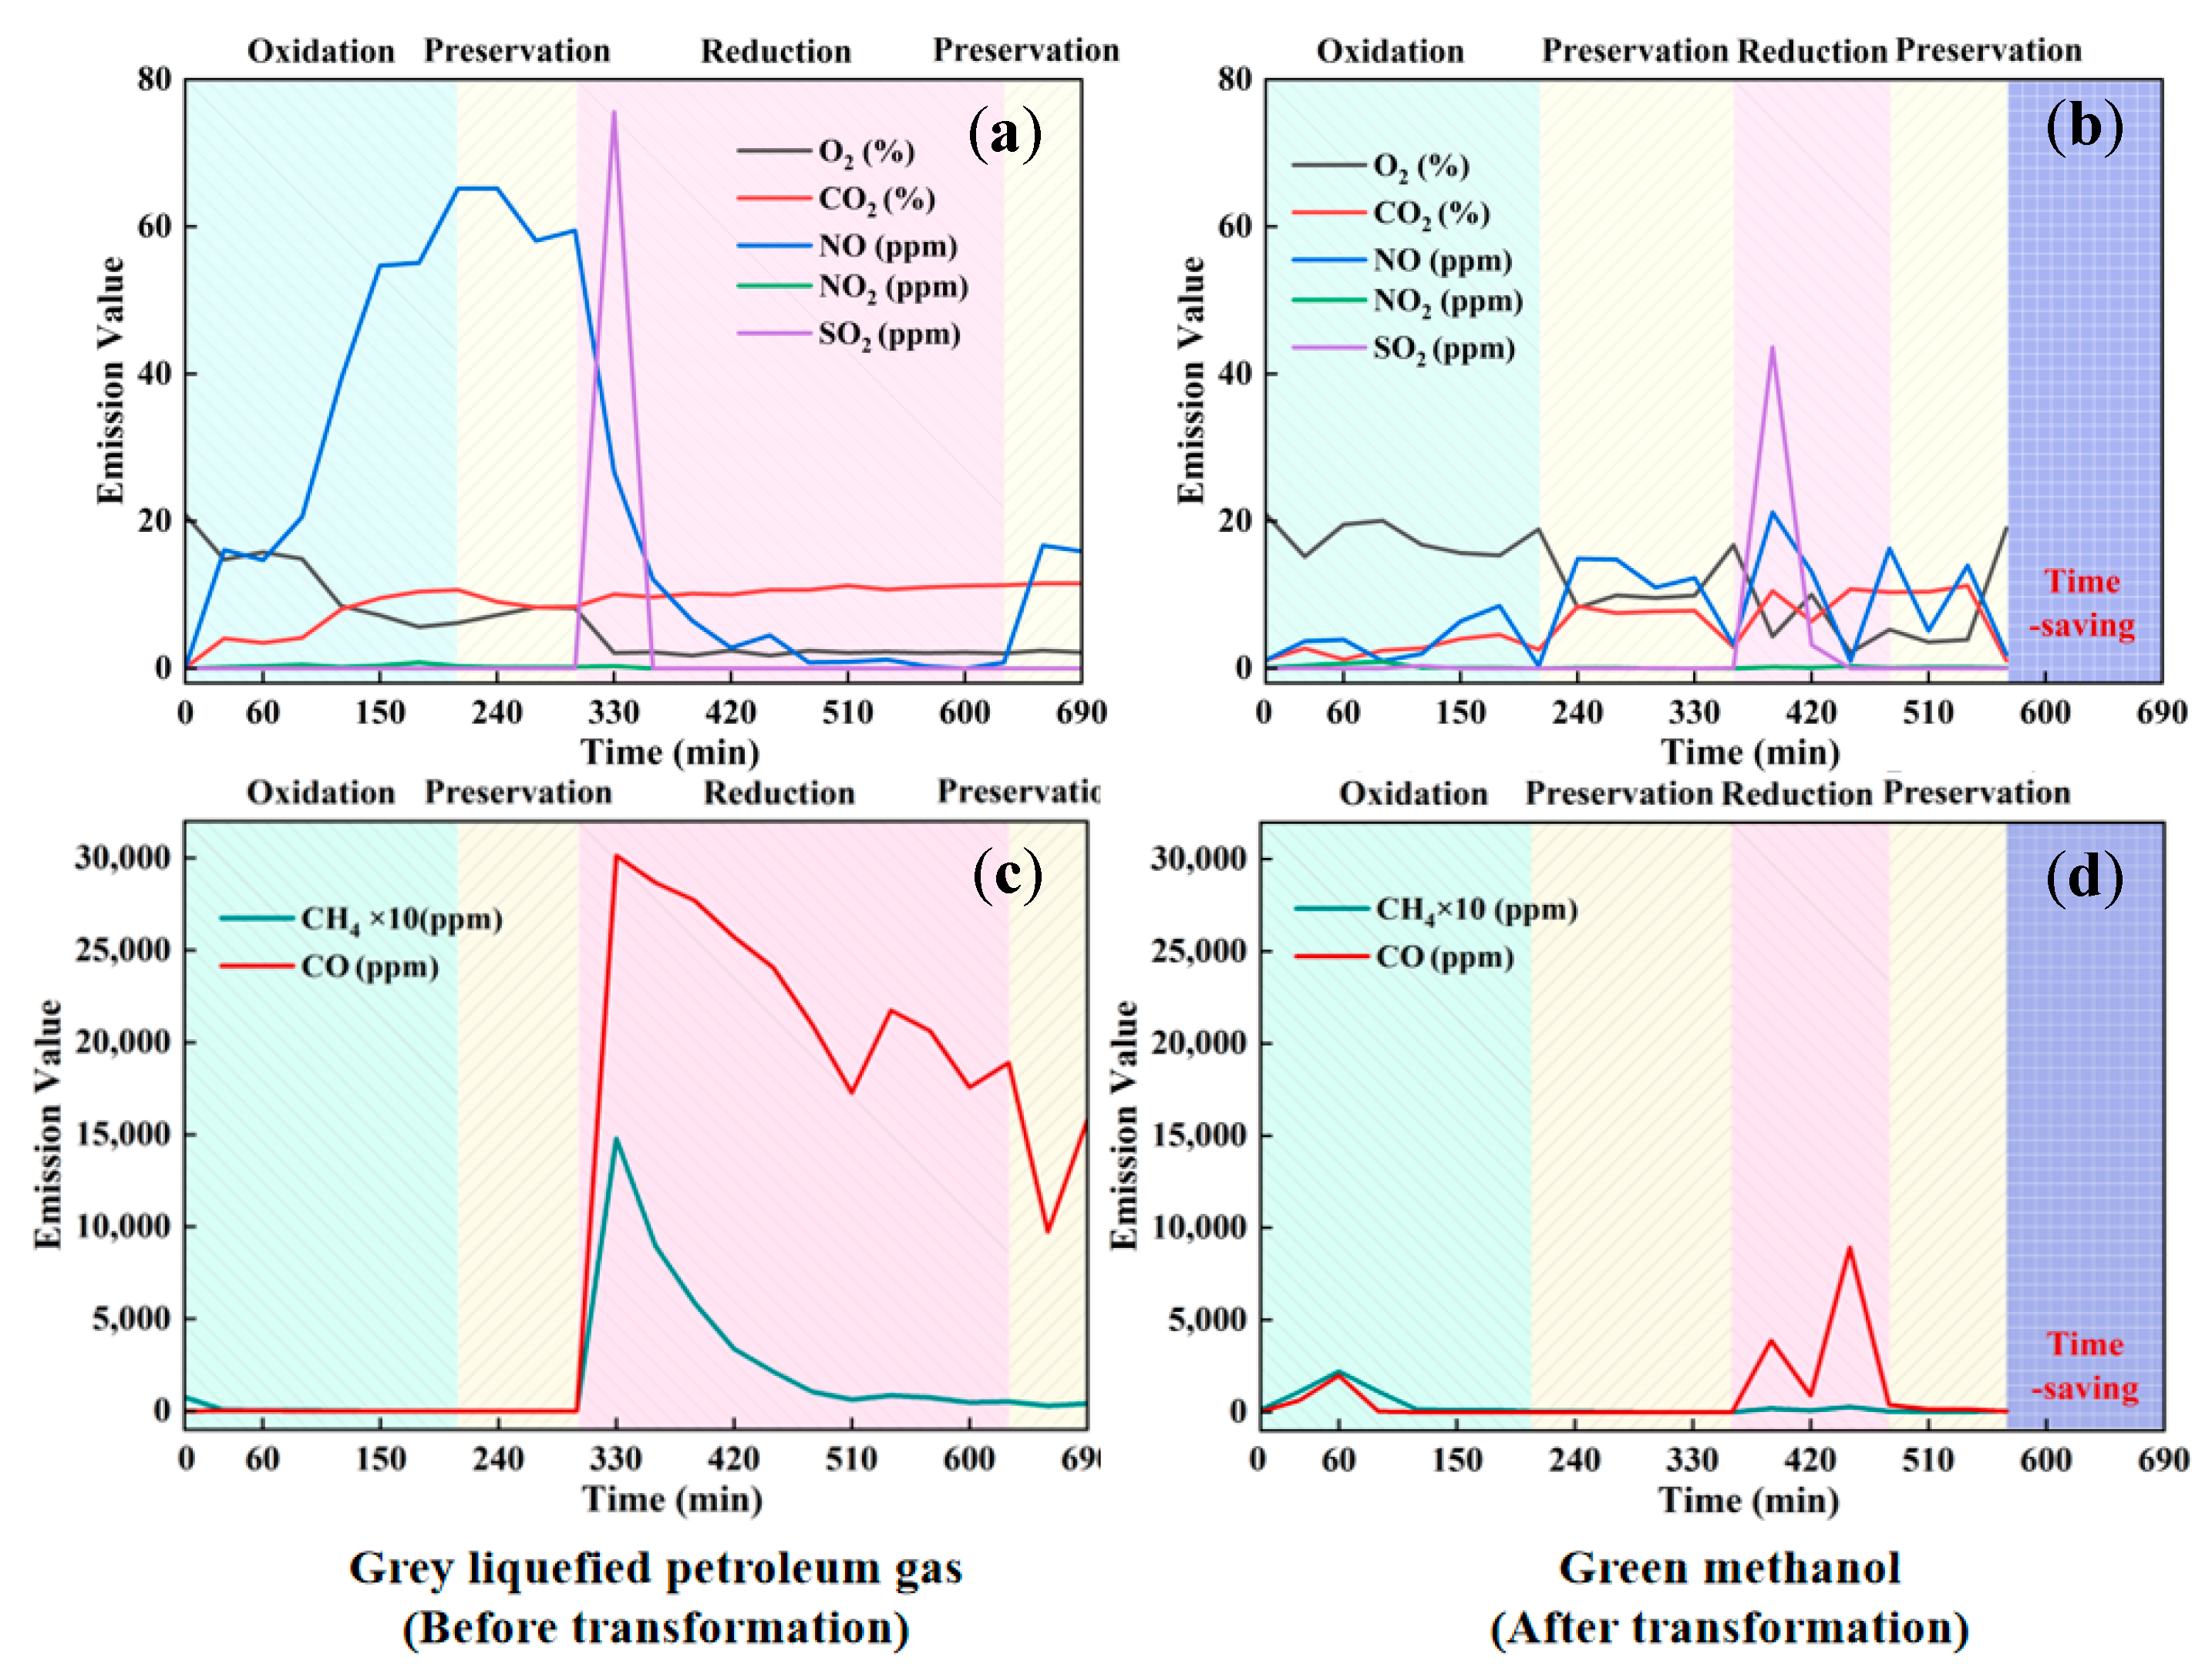
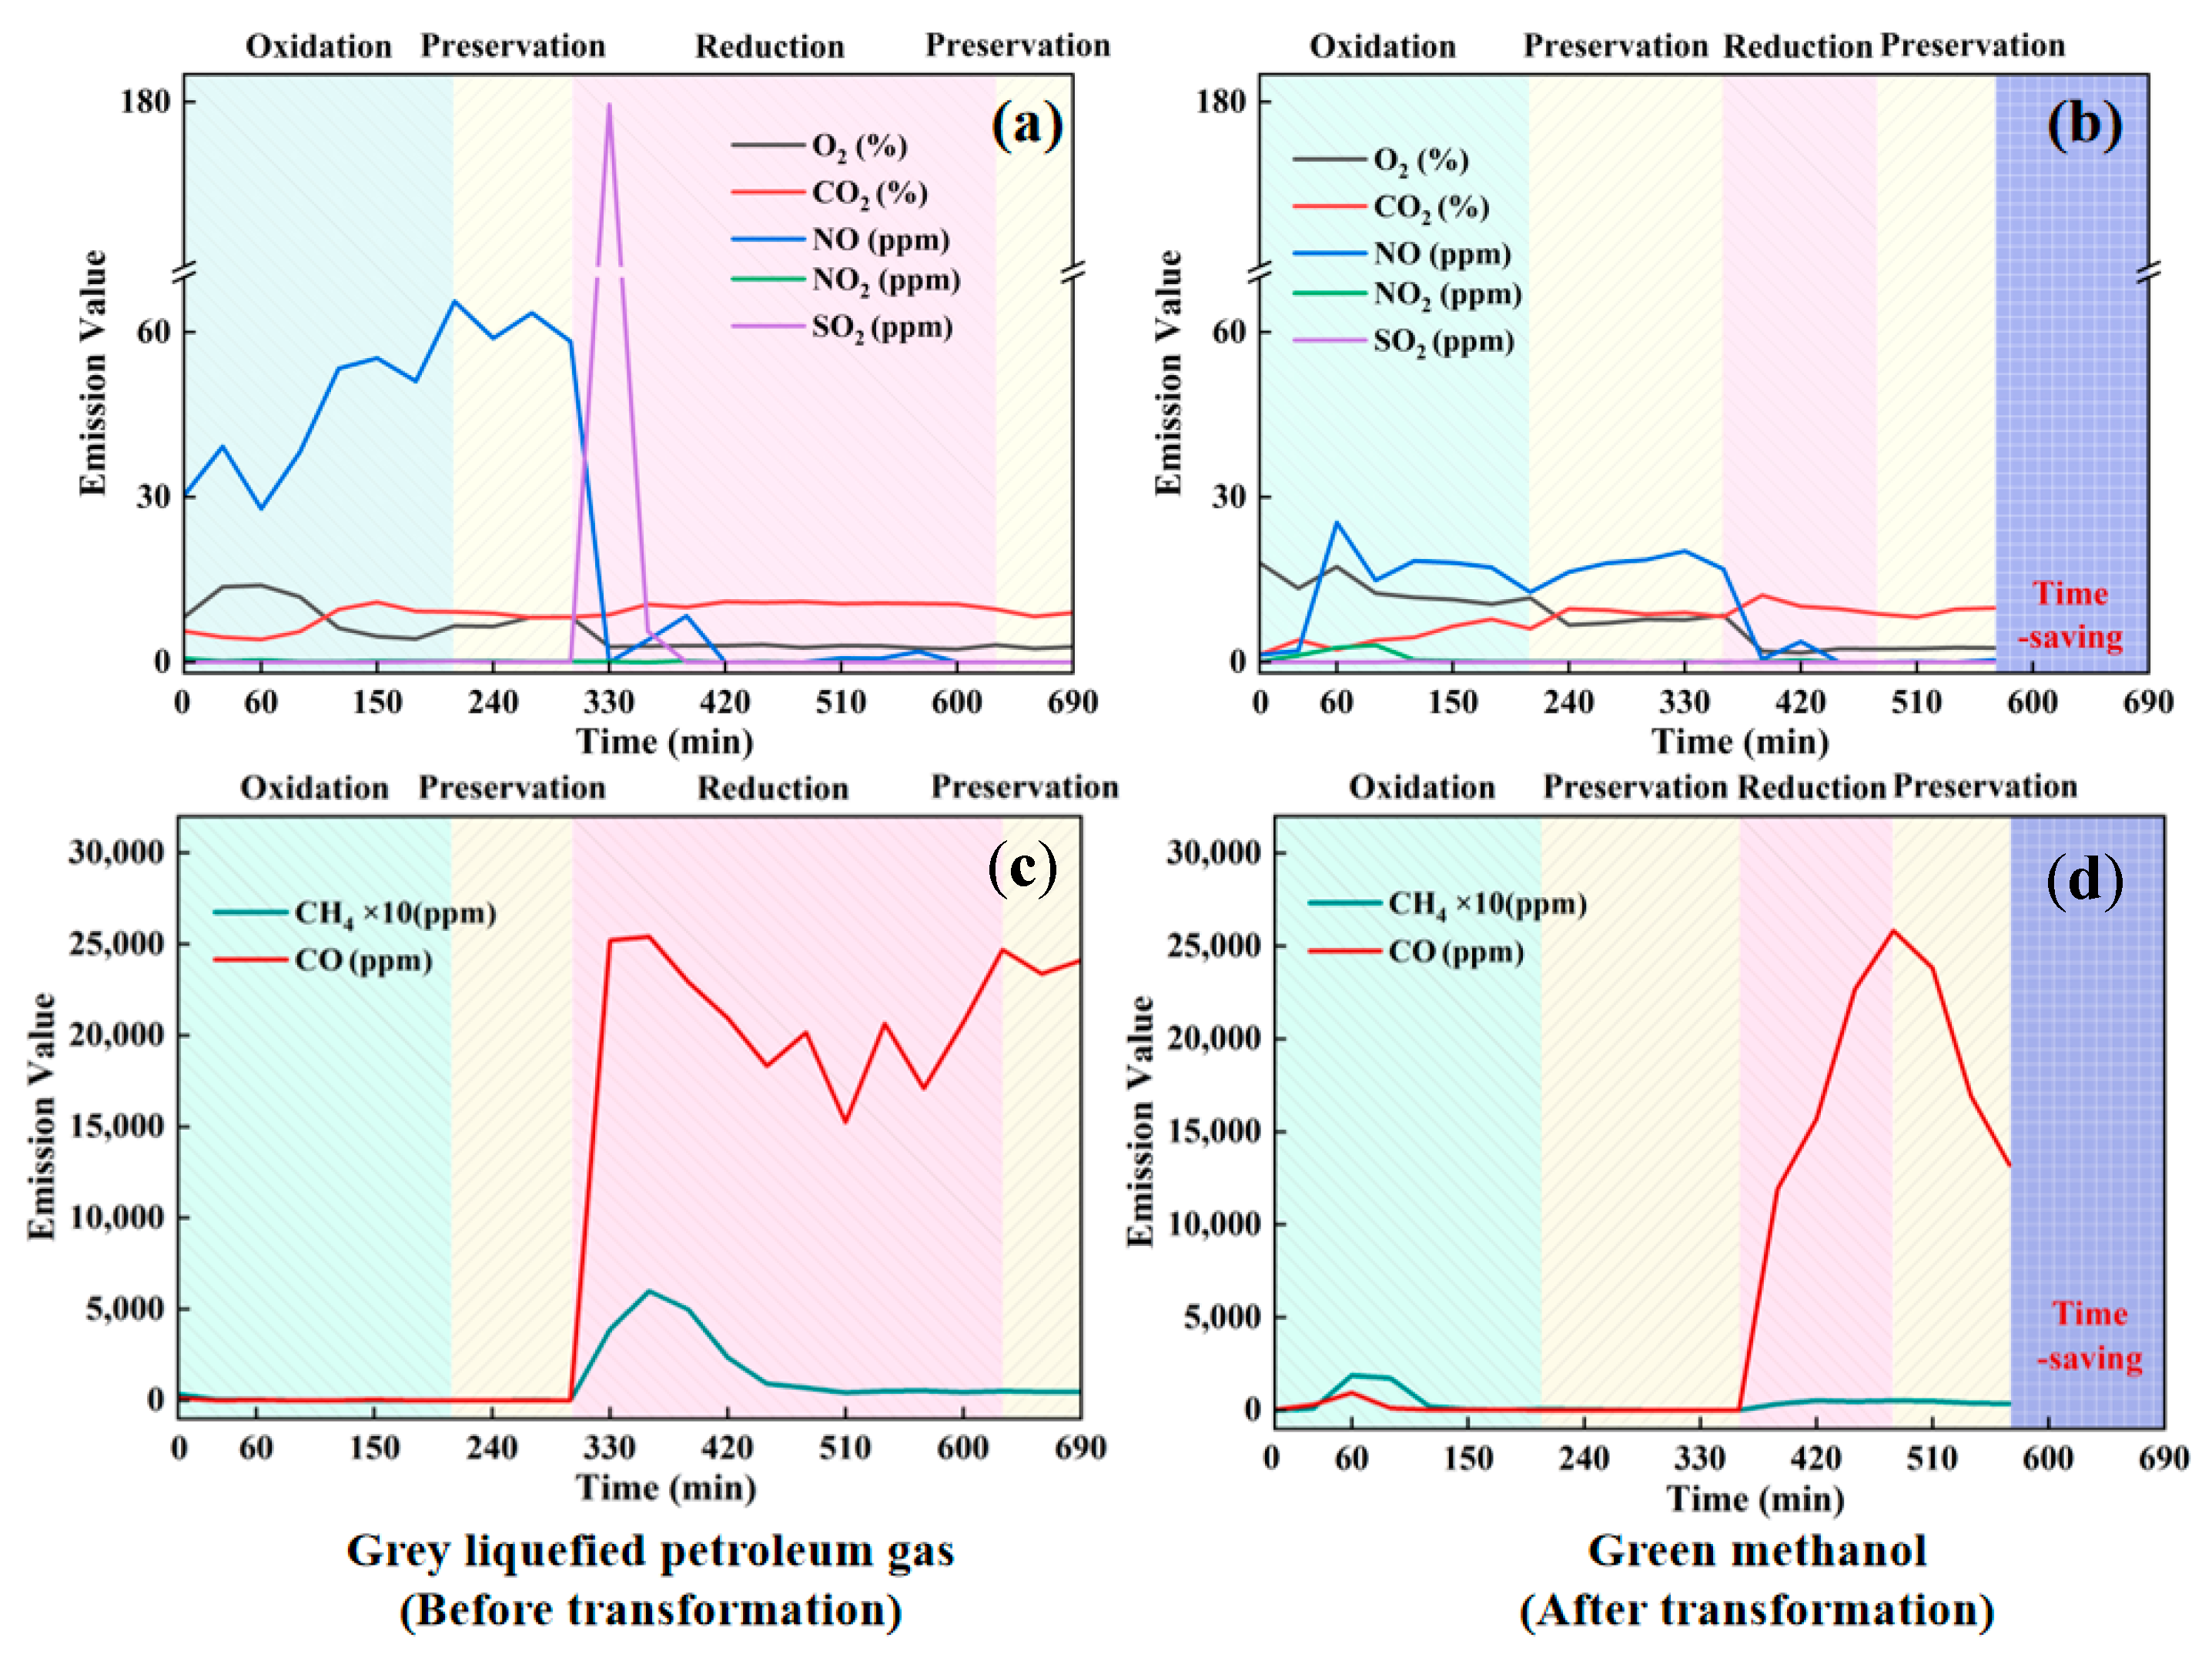
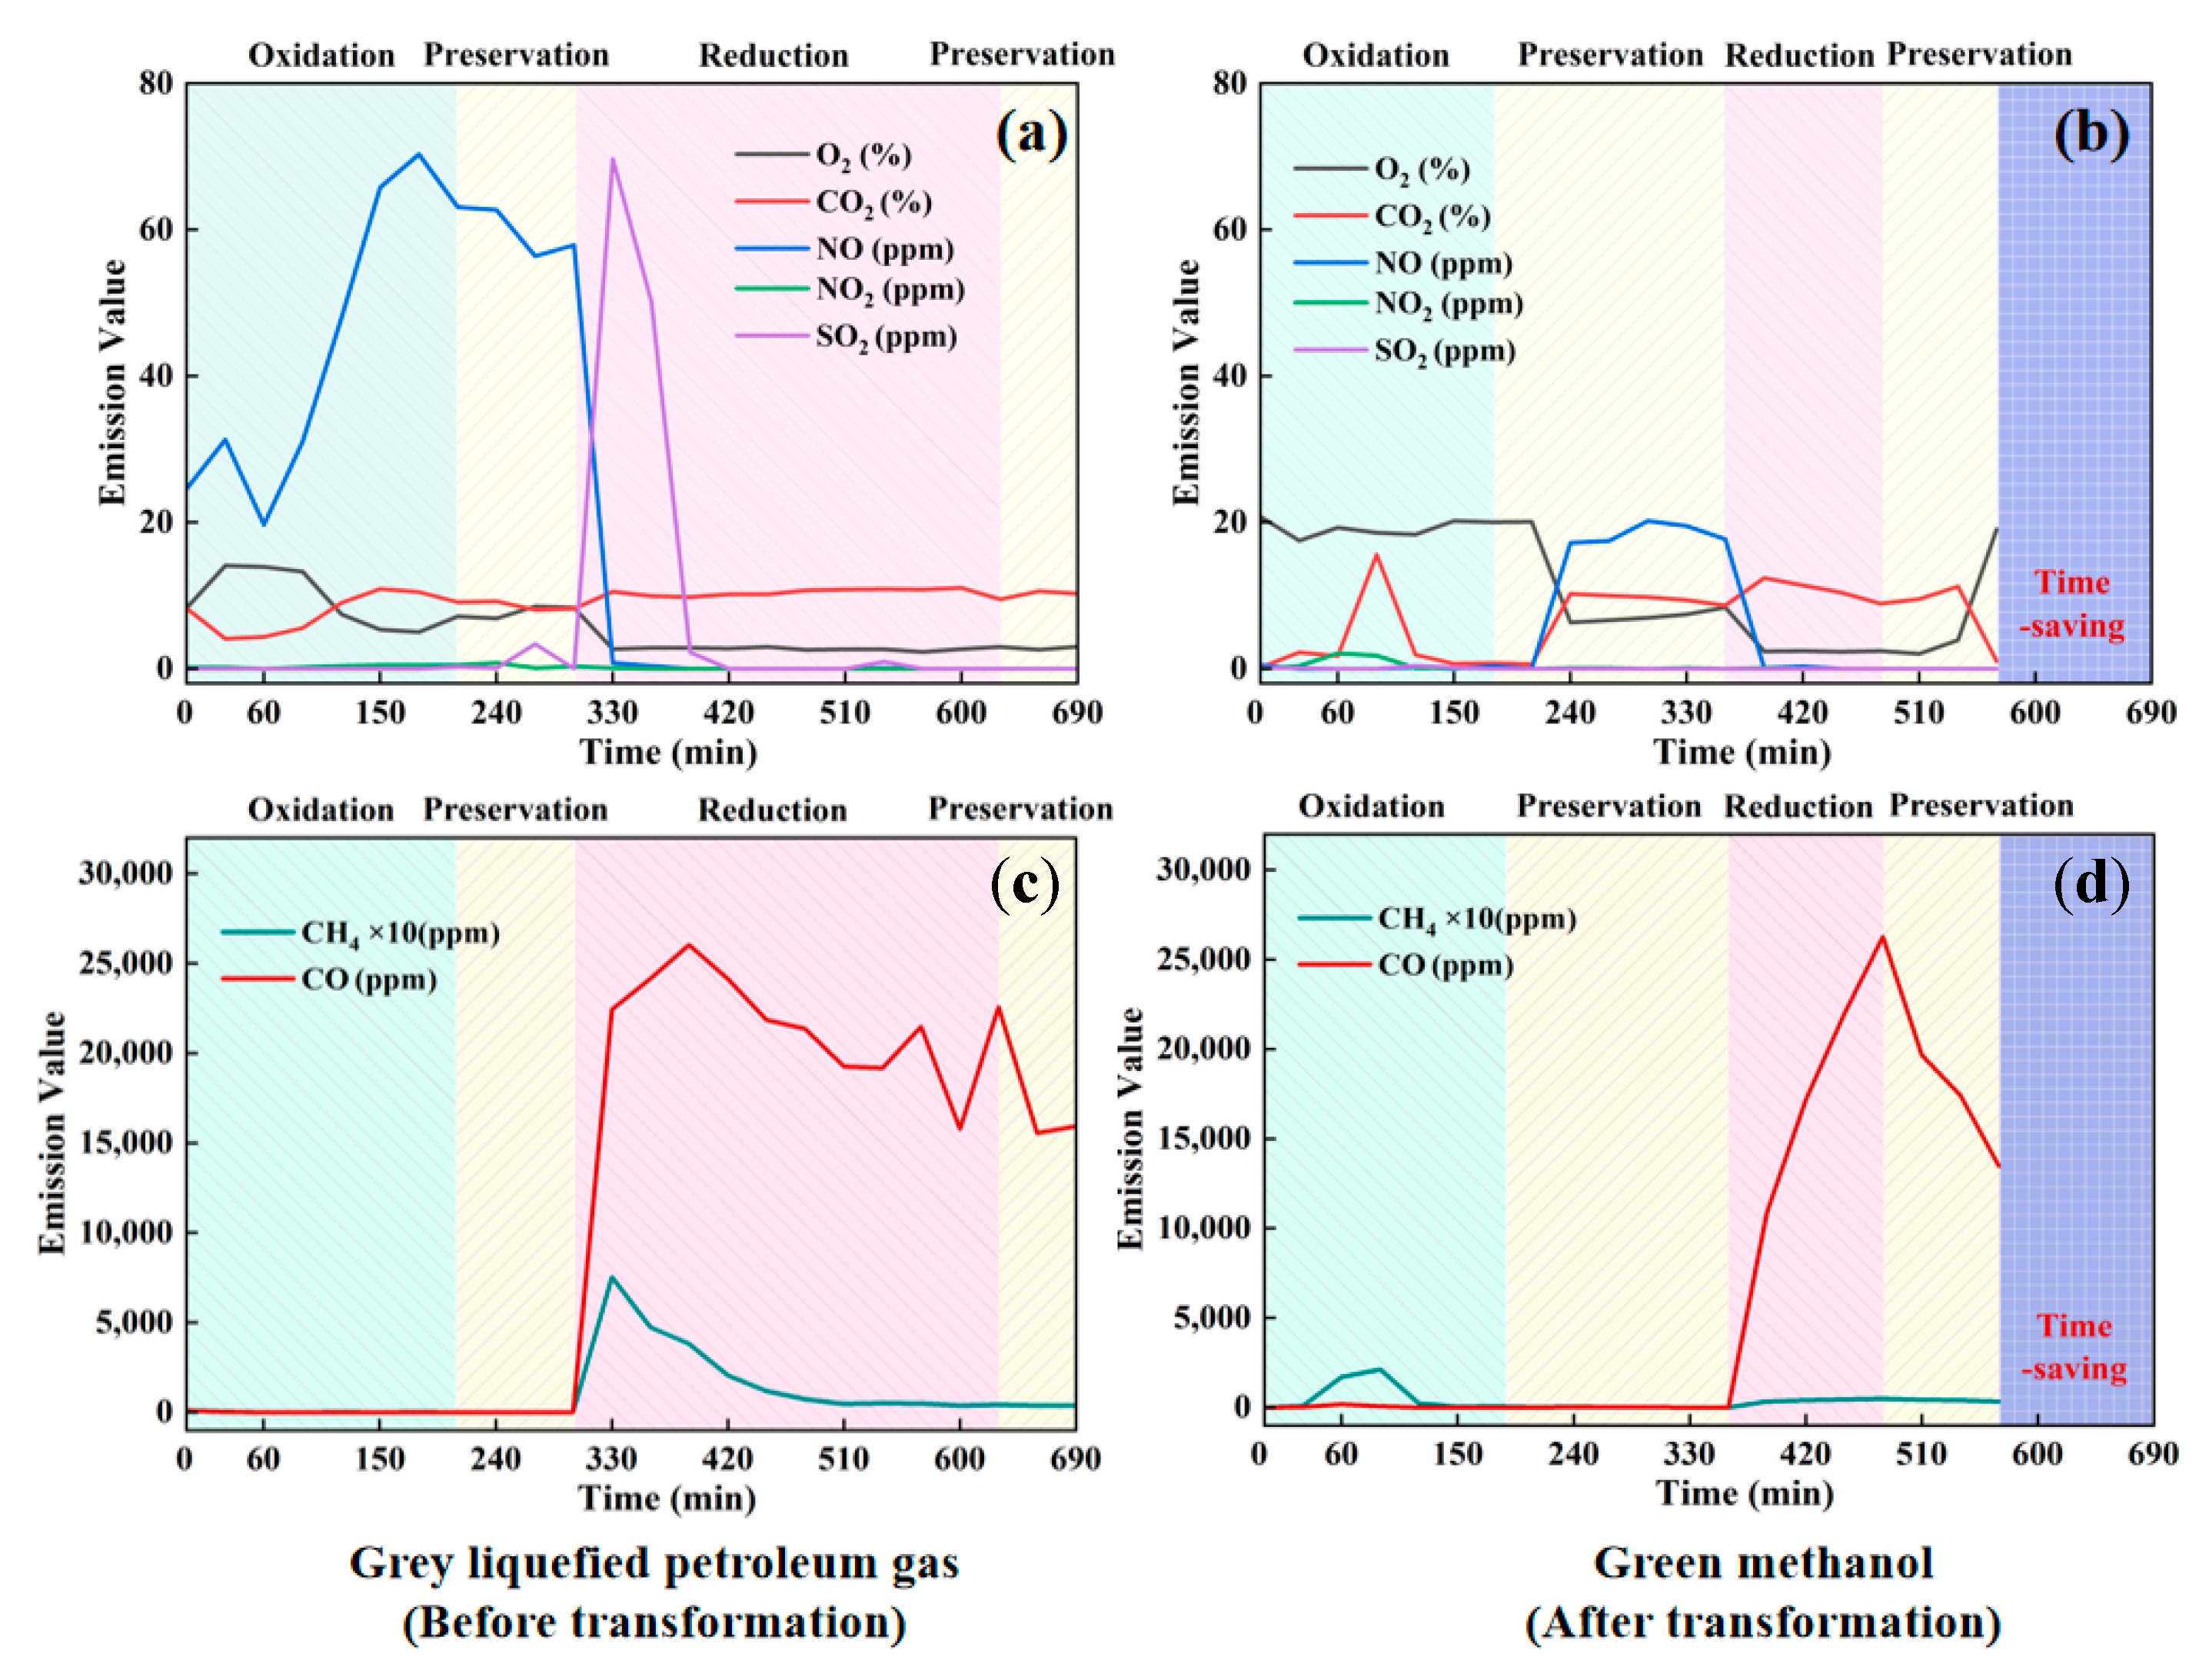
3.2.2. Pollutant Emissions During the Firing Process
3.3. Celadon Product Analysis
3.3.1. Analysis of Celadon Product Appearance
3.3.2. Comparative Analysis of Microstructure and Elements in Celadon
3.3.3. Comparative Analysis of Stress–Strain of Products
4. Conclusions
- Combustion Performance: Under identical production conditions (400 cups/day per kiln), the methanol flame was observed to be deeper in color, more transparent, and hotter than the LPG flame. Greater stability in combustion was also recorded across various firing stages, including oxidation, reduction, and holding.
- Firing Process Efficiency: A faster temperature increase was recorded in the methanol-fired kiln compared to the LPG-fired kiln, particularly during the oxidation and holding stages, resulting in a 17.4% reduction in total firing time.
- Pollutant Emissions: A substantial decrease in pollutant emissions was observed with methanol combustion, with reductions of 70.89% in NO, 37.43% in SO2, and 93.67% in CO compared to LPG. Additionally, CO2 and CH4 emissions were reduced by 45.07% and 85.89%, respectively.
- Celadon Quality: Celadon fired with methanol exhibited a more uniform and vivid glaze color, a smoother and glossier surface, and a denser microstructure with minimal bubble formation. Elemental analysis confirmed a compositional shift, with the K/O ratio increasing from 8.439% to 11.706%, the Fe/O ratio decreasing from 4.793% to 3.735%, the Al/O ratio decreasing from 33.445% to 31.696%, and the Si/O ratio increasing from 76.169% to 89.825%. These changes align with the characteristics of high-quality celadon, featured by lower iron and aluminum content and higher potassium and silicon content.
- Mechanical Properties: Bending stress analysis indicated that the mechanical properties of celadon produced using methanol and LPG were comparable.
Author Contributions
Funding
Data Availability Statement
Conflicts of Interest
References
- Huang, S.; Freestone, I.C.; Zhu, Y.; Shen, L. The introduction of celadon production in North China: Technological characteristics and diversity of the earliest wares. J. Archaeol. Sci. 2020, 114, 105057. [Google Scholar] [CrossRef]
- Wang, Y.; Liu, Y.; Cui, S.; Sun, B.; Gong, X.; Gao, F.; Wang, Z. Comparative life cycle assessment of different fuel scenarios and milling technologies for ceramic tile production: A case study in China. J. Clean. Prod. 2020, 273, 122846. [Google Scholar] [CrossRef]
- Ding, K.; Li, A.; Lv, J.; Gu, F. Decarbonizing ceramic industry: Technological routes and cost assessment. J. Clean. Prod. 2023, 419, 138278. [Google Scholar] [CrossRef]
- Reddy, V.J.; Hariram, N.P.; Maity, R.; Ghazali, M.F.; Kumarasamy, S. Sustainable E-Fuels: Green Hydrogen, Methanol and Ammonia for Carbon-Neutral Transportation. World Electr. Veh. J. 2023, 14, 349. [Google Scholar] [CrossRef]
- Blanco, E.C.; Sánchez, A.; Martín, M.; Vega, P. Methanol and ammonia as emerging green fuels: Evaluation of a new power generation paradigm. Renew. Sustain. Energy Rev. 2023, 175, 113195. [Google Scholar] [CrossRef]
- Cui, J.; Aziz, M. Techno-economic analysis of hydrogen transportation infrastructure using ammonia and methanol. Int. J. Hydrogen Energy 2023, 48, 15737–15747. [Google Scholar] [CrossRef]
- Maersk. Maersk Signs Long-Term Methanol Sourcing Deal. 2024. Available online: https://www.maersk.com/news/articles/2024/10/30/maersk-signs-long-term-methanol-sourcing-deal (accessed on 30 December 2024).
- MarineLink. Maersk To Buy Bio-Methanol Shipping Fuel From China’s LONGi Green Energy Technology. 2024. Available online: https://www.marinelink.com/news/maersk-buy-biomethanol-shipping-fuel-518652 (accessed on 30 October 2024).
- Geely. Geely’s E-Fuels Solution to a Carbon Neutral Future. 2024. Available online: https://global.geely.com/en/news/2024/geely-e-fuel-solution-carbon-neutral-future (accessed on 9 January 2024).
- Amiri, M.; Shirneshan, A. Effects of air swirl on the combustion and emissions characteristics of a cylindrical furnace fueled with diesel-biodiesel-n-butanol and diesel-biodiesel-methanol blends. Fuel 2020, 268, 117295. [Google Scholar] [CrossRef]
- Dai, H.; Wang, Z.; Zhai, C. Co-partial oxidation of acetic acid, methanol, and ethanol in an integrated porous media with efficient heat recirculation: Green hydrogen production and its expansion method. J. Clean. Prod. 2023, 418, 138122. [Google Scholar] [CrossRef]
- Bazaluk, O.; Havrysh, V.; Nitsenko, V.; Baležentis, T.; Streimikiene, D.; Tarkhanova, E.A. Assessment of Green Methanol Production Potential and Related Economic and Environmental Benefits: The Case of China. Energies 2020, 13, 3113. [Google Scholar] [CrossRef]
- Zheng, L.; Figueroa-Labastida, M.; Streicher, J.; Hanson, R.K. Measurements and a new correlation of methanol laminar flame speeds at temperatures up to 916 K and elevated pressures behind reflected shock waves. Proc. Combust. Inst. 2024, 40, 105192. [Google Scholar] [CrossRef]
- Ming, Z.; Liu, B.; Zhang, X.; Wen, M.; Liu, H.; Cui, Y.; Ye, Y.; Wang, C.; Jin, C.; Yusuf, A.A.; et al. Study of methanol spray flame structure and combustion stability mechanisms by optical phenomenology and chemical kinetics. Fuel Process. Technol. 2023, 252, 107947. [Google Scholar] [CrossRef]
- Zhang, Z.; Wen, M.; Cui, Y.; Ming, Z.; Wang, T.; Zhang, C.; Ampah, J.D.; Jin, C.; Huang, H.; Liu, H. Effects of Methanol Application on Carbon Emissions and Pollutant Emissions Using a Passenger Vehicle. Processes 2022, 10, 525. [Google Scholar] [CrossRef]
- Zhu, J.; Wang, Z.; Li, R.; Liu, S.; Hua, Y. Experimental study and prediction model of combustion stability and combustion mode variation of burning methanol/biodiesel blends for diesel engines. Fuel 2023, 335, 127038. [Google Scholar] [CrossRef]
- Pandey, S. A critical review: Application of methanol as a fuel for internal combustion engines and effects of blending methanol with diesel/biodiesel/ethanol on performance, emission, and combustion characteristics of engines. Heat Transf. 2022, 51, 3334–3352. [Google Scholar] [CrossRef]
- Shayan, S.B.; Seyedpour, S.; Ommi, F.; Moosavy, S.; Alizadeh, M. Impact of methanol–gasoline fuel blends on the performance and exhaust emissions of a SI engine. Int. J. Automot. Eng. 2011, 1, 219–227. [Google Scholar]
- Verhelst, S.; Turner, J.W.; Sileghem, L.; Vancoillie, J. Methanol as a fuel for internal combustion engines. Prog. Energy Combust. Sci. 2019, 70, 43–88. [Google Scholar] [CrossRef]
- Pan, W.; Yao, C.; Han, G.; Wei, H.; Wang, Q. The impact of intake air temperature on performance and exhaust emissions of a diesel methanol dual fuel engine. Fuel 2015, 162, 101–110. [Google Scholar] [CrossRef]
- Gainey, B.; Yan, Z.; Gandolfo, J.; Lawler, B. Methanol and wet ethanol as interchangeable fuels for internal combustion engines: LCA, TEA, and experimental comparison. Fuel 2023, 333, 126257. [Google Scholar] [CrossRef]
- Darley, E.F. Studies on the Effect of Cement-Kiln Dust on Vegetation. J. Air Pollut. Control. Assoc. 1966, 16, 145–150. [Google Scholar] [CrossRef]
- Alonso, E.; Gallo, A.; Roldán, M.; Pérez-Rábago, C.; Fuentealba, E. Use of rotary kilns for solar thermal applications: Review of developed studies and analysis of their potential. Sol. Energy 2017, 144, 90–104. [Google Scholar] [CrossRef]
- Sai, P.S.T.; Surender, G.D.; Damodaran, A.D.; Suresh, V.; Philip, Z.G.; Sankaran, K. Residence time distribution and material flow studies in a rotary kiln. Met. Trans. B 1990, 21, 1005–1011. [Google Scholar] [CrossRef]
- Li, A.; Li, X.; Li, S.; Ren, Y.; Shang, N.; Chi, Y.; Yan, J.; Cen, K. Experimental studies on municipal solid waste pyrolysis in a laboratory-scale rotary kiln. Energy 1999, 24, 209–218. [Google Scholar] [CrossRef]
- Stjernberg, J.; Ion, J.C.; Antti, M.-L.; Nordin, L.-O.; Lindblom, B.; Odén, M. Extended studies of degradation mechanisms in the refractory lining of a rotary kiln for iron ore pellet production. J. Eur. Ceram. Soc. 2012, 32, 1519–1528. [Google Scholar] [CrossRef]
- Bancroft, W.D.; Nugent, R.L. Copper Oxide in the Borax Bead. J. Phys. Chem. 1929, 33, 729–744. [Google Scholar] [CrossRef]
- Marshall, J.; Carroll, J.; Crighton, J.S. Atomic Spectrometry Update—Industrial Analysis: Metals, Chemicals and Advanced Materials. J. Anal. At. Spectrom. 1990, 5, 323R–359R. [Google Scholar] [CrossRef]
- Jin, X.; Wang, X.; Liang, Y. The mechanism of “flint red” and its relationship with celadon glaze color. J. Eur. Ceram. Soc. 2022, 42, 3332–3338. [Google Scholar] [CrossRef]
- Liu, P.; Wang, F.; Luo, H.; Zhu, J.; Shi, P.; Hao, Y.; Feng, B. Analysis of the influence of iron source and its occurrence state on the color of celadon glaze. Ceram. Int. 2022, 48, 18425–18432. [Google Scholar] [CrossRef]
- Liu, P.; Guo, J.; Im, H.G.; Roberts, W.L. The effects of CO2/CH4 ratio on soot formation for autothermal reforming of methane at elevated pressure. Combust. Flame 2023, 258, 112379. [Google Scholar] [CrossRef]
- Shamsipur, M.; Barati, A.; Karami, S. Long-wavelength, multicolor, and white-light emitting carbon-based dots: Achievements made, challenges remaining, and applications. Carbon 2017, 124, 429–472. [Google Scholar] [CrossRef]
- Edelman, R.; Bahadori, Y.; Olson, S.; Stocker, D. Laminar diffusion flames under micro-gravity conditions. In Proceedings of the 26th Aerospace Sciences Meeting, Reno, NV, USA, 11–14 January 1988. [Google Scholar] [CrossRef]
- Saxena, M.R.; Maurya, R.K.; Mishra, P. Assessment of performance, combustion and emissions characteristics of methanol-diesel dual-fuel compression ignition engine: A review. J. Traffic Transp. Eng. 2021, 8, 638–680. [Google Scholar] [CrossRef]
- Holmgren, K.M.; Andersson, E.; Berntsson, T.; Rydberg, T. Gasification-based methanol production from biomass in industrial clusters: Characterisation of energy balances and greenhouse gas emissions. Energy 2014, 69, 622–637. [Google Scholar] [CrossRef]
- Pham, V.C.; Rho, B.-S.; Kim, J.-S.; Lee, W.-J.; Choi, J.-H. Effects of Various Fuels on Combustion and Emission Characteristics of a Four-Stroke Dual-Fuel Marine Engine. J. Mar. Sci. Eng. 2021, 9, 1072. [Google Scholar] [CrossRef]
- Tian, Z.; Wang, Y.; Zhen, X.; Liu, Z. The effect of methanol production and application in internal combustion engines on emissions in the context of carbon neutrality: A review. Fuel 2022, 320, 123902. [Google Scholar] [CrossRef]
- Sadeq, A.M. Alternative Fuels for Sustainable Combustion. 2024. ISBN 9798990783690. Available online: https://www.researchgate.net/publication/382547111_Alternative_Fuels_for_Sustainable_Combustion#fullTextFileContent (accessed on 30 December 2024).
- Chuvashev, A.N.; Chuprakov, A.I. Investigation of environmental indicators of diesel engine when working on methanol. J. Phys. Conf. Ser. 2019, 1399, 055085. [Google Scholar] [CrossRef]
- Duan, H.; Ji, D.; Ding, Y.; Wang, G.; Zheng, J.; Zhou, G.; Miao, J. Comparative study of black and gray body celadon shards excavated from Wayaoyang kiln in Longquan, China. Microchem. J. 2016, 126, 274–279. [Google Scholar] [CrossRef]
- Li, H.; Fang, Y.; Li, Z.; Dong, W.; Zhou, J.; Bao, Q. Effects of TiO2 on the structure and coloration of azure glaze. J. Aust. Ceram. Soc. 2024, 60, 1637–1643. [Google Scholar] [CrossRef]
- Liu, Q.; Tan, M.; Li, L. Firing technology of iron fetal celadon products in Longquan Kiln. China Ceram. Ind. 2023, 30, 74–79. [Google Scholar] [CrossRef]
- Ham, S.; Shim, I.; Lee, Y.; Kang, J.; Koh, K. An Archaeochemical Microstructural Study on Koryo Inlaid Celadon. Bull. Korean Chem. Soc. 2002, 23, 1531–1540. [Google Scholar] [CrossRef]
- Colomban, P.; Liem, N.Q.; Sagon, G.; Tinh, H.X.; Hoành, T.B. Microstructure, composition and processing of 15th century Vietnamese porcelains and celadons. J. Cult. Herit. 2003, 4, 187–197. [Google Scholar] [CrossRef]
- Zhou, S.; Fu, L.; Liang, B. Clustering analysis of ancient celadon based on SOM neural network. Sci. China Technol. Sci. 2008, 51, 999–1007. [Google Scholar] [CrossRef]
- Hu, L.X.; Fan, Y.L.; Zhu, X.D. Numerical Analysis of Time Dependent Behavior for Celadon Clay Rock. Appl. Mech. Mater. 2013, 353, 1067–1072. [Google Scholar] [CrossRef]
- Park, J.; Park, S.Y.; Lee, D.; Song, Y.S. Shape memory polymer composites embedded with hybrid ceramic microparticles. Smart Mater. Struct. 2020, 29, 055037. [Google Scholar] [CrossRef]
- Marinković, D.; Dezső, G.; Milojević, S. Application of Machine Learning During Maintenance and Exploitation of Electric Vehicles. Adv. Eng. Lett. 2024, 3, 132–140. [Google Scholar] [CrossRef]


| Substance | Calorific Value (kJ/kg) | Density (kg/m3) |
|---|---|---|
| liquefied petroleum gas (g) | 53,340 | 1.24 |
| methanol (l) | 19,500 | 0.791 × 10³ |
| Mass Flow (kg/H) | LPG | Methanol | Calorific Value of Flow (MJ/Hour) |
|---|---|---|---|
| oxidation stage | 4.69 | 12.82 | 250 |
| First insulation stage | 6.09 | 16.67 | 325 |
| Reduction stage | 10.22 | 27.95 | 545 |
| Second insulation stage | 7.78 | 21.28 | 415 |
| Experimental Parameter | Details |
|---|---|
| Temperature Measurement Method | Three K-type thermocouples |
| Gas Composition Analysis | MRU MGA6 infrared flue gas analyzer |
| Flame Image Capture | Canon EOS R7 camera with RF-S18-150mm F3.5-6.3 IS STM lens |
| Cutting Method for Celadon | DWJ3020-BB five-axis gantry waterjet cutter |
| Microstructural and Elemental Analysis | SU8010 cold field emission scanning electron microscope (SEM) |
| Stress–Strain Analysis | INSTRON 5966 universal testing machine |
| Atomic (%) | Unfired Celadon | Celadon Fired Using Liquefied Petroleum Gas | Celadon Fired Using Methanol |
|---|---|---|---|
| O | 43.402 | 44.874 | 42.201 |
| Al | 13.768 | 15.008 | 13.376 |
| Si | 37.977 | 34.180 | 37.907 |
| K | 3.386 | 3.787 | 4.940 |
| Fe | 1.467 | 2.151 | 1.576 |
Disclaimer/Publisher’s Note: The statements, opinions and data contained in all publications are solely those of the individual author(s) and contributor(s) and not of MDPI and/or the editor(s). MDPI and/or the editor(s) disclaim responsibility for any injury to people or property resulting from any ideas, methods, instructions or products referred to in the content. |
© 2025 by the authors. Licensee MDPI, Basel, Switzerland. This article is an open access article distributed under the terms and conditions of the Creative Commons Attribution (CC BY) license (https://creativecommons.org/licenses/by/4.0/).
Share and Cite
Song, Y.; Han, S.; Hu, T.; Lyu, H.; Chen, N.; Zhang, X.; Lin, S.; Zheng, C.; Liu, P.; Gao, X. Comparable Study on Celadon Production Fueled by Methanol and Liquefied Petroleum Gas at Industry Scale. Energies 2025, 18, 2131. https://doi.org/10.3390/en18082131
Song Y, Han S, Hu T, Lyu H, Chen N, Zhang X, Lin S, Zheng C, Liu P, Gao X. Comparable Study on Celadon Production Fueled by Methanol and Liquefied Petroleum Gas at Industry Scale. Energies. 2025; 18(8):2131. https://doi.org/10.3390/en18082131
Chicago/Turabian StyleSong, Yihong, Shangbo Han, Teng Hu, Huajie Lyu, Nuo Chen, Xiao Zhang, Saisai Lin, Chenghang Zheng, Peng Liu, and Xiang Gao. 2025. "Comparable Study on Celadon Production Fueled by Methanol and Liquefied Petroleum Gas at Industry Scale" Energies 18, no. 8: 2131. https://doi.org/10.3390/en18082131
APA StyleSong, Y., Han, S., Hu, T., Lyu, H., Chen, N., Zhang, X., Lin, S., Zheng, C., Liu, P., & Gao, X. (2025). Comparable Study on Celadon Production Fueled by Methanol and Liquefied Petroleum Gas at Industry Scale. Energies, 18(8), 2131. https://doi.org/10.3390/en18082131