Article

Coordinated Scheduling and Operational Characterization of Electricity and District Heating Systems: A Case Study

1
State Grid Liaoning Electric Power Supply Co., Ltd., Shenyang 110004, China
2
Department of Thermal Engineering, Tsinghua University, Beijing 100084, China
*
Author to whom correspondence should be addressed.
Energies 2025, 18(9), 2211; https://doi.org/10.3390/en18092211
Submission received: 27 February 2025 / Revised: 17 April 2025 / Accepted: 24 April 2025 / Published: 26 April 2025
(This article belongs to the Section J1: Heat and Mass Transfer)

Abstract

:
With the increasing penetration of renewable energy generation in energy systems, power and district heating systems (PHSs) continue to encounter challenges with wind and solar curtailment during scheduling. Further integration of renewable energy generation can be achieved by exploring the flexibility of existing systems. Therefore, this study systematically explores the deep transfer modifications of a specific thermal power plant based in Liaoning, China, and the operational characteristics of the heating supply system of a particular heating company. In addition, the overall PHS operational performance is analyzed. The results indicate that both absorption heat pumps and solid-state electric thermal storage technologies effectively improve system load regulation capabilities. The temperature decrease in the water medium in the primary network was proportional to the pipeline distance. When the pipeline lengths were 1175 and 14,665 m, the temperature decreased by 0.66 and 3.48 °C, respectively. The heat exchanger effectiveness and logarithmic mean temperature difference (LMTD) were positively correlated with the outdoor temperature. When the outdoor temperature dropped to −18 °C, the heat exchanger efficiency decreased to 60%, and the LMTD decreased to 17.5 °C. The study findings provide practical data analysis support to address the balance between power supply and heating demand.

1. Introduction

As global fossil fuel resources continue to deplete and environmental issues intensify, steering energy systems development toward a more sustainable and efficient direction has become imperative. Combined heat and power (CHP) systems are widely recognized and utilized as efficient energy sources [1]. In the “Three North” region in China, where the heating season is extended, CHP units constitute a significant proportion of the installed capacity. Historically, CHP units have operated under a “heat-driven electricity” model, in which the electricity output remains high to meet thermal load demands, significantly constraining the peak-shaving capability of the unit [2,3]. With the rapid development and large-scale integration of renewable energy sources, such as photovoltaics and wind energy, the limitations of power and district heating systems (PHSs) in terms of peak-shaving capability and flexibility have become increasingly apparent [4]. This issue has led to an imbalance between heat supply and power generation.
The flexibility potential must be positively exploited in four key areas, including flexibility retrofitting of thermal power plants, application of various energy storage technologies, demand-side flexibility research, and integrated and coordinated PHS operation, to establish a new power system dominated by renewable energy and address the imbalance between heat and power. Extensive research has been conducted in these areas. In terms of flexibility enhancement, the absorption heat pump (AHP) system can utilize commonly available low-grade thermal energy, demonstrating robust heat conversion capabilities [5,6]. This technology can effectively augment the heating capacity of systems, making it a focal point of interest for researchers. Single-effect AHPs are the most commonly used AHP cycles [7]. Various advanced systems have been proposed to enhance the cycle efficiency, including double-effect AHPs [8,9], generator-absorber heat exchange (GAX) heat pumps [10,11,12], and different AHPs utilizing refrigerants such as water [13] and ammonia [14,15]. These innovations aim to achieve a greater temperature increase between the heat input and output. Compared with traditional systems, AHP integration reduces steam extraction from turbines by over 40% [16,17].
Energy storage systems (ESSs) [18] have emerged as a key solution to further enhance system flexibility and address the challenges for renewable energy integration. An ESS enables the decoupling of heat and power, allowing thermal power plants to respond more flexibly to electricity demand fluctuations while maintaining a stable heat supply. Solid-state electric thermal storage (SETS) [19,20,21] and thermal energy storage (TES) [22,23] technologies have been extensively researched and employed in various applications. These technologies enable the storage of excess electricity as thermal energy during low electricity demand periods, which can subsequently be released during peak heating periods. This process ensures a stable heat supply and enhances grid flexibility.
Demand-side management (DSM) also serves as an important tool to increase the flexibility of CHP systems [24]. DSM alleviates pressure on the grid during peak periods by adjusting the user energy consumption patterns to align with renewable energy supply availability [25,26]. With the assistance of advanced control algorithms, intelligent heating systems can dynamically adjust heat consumption according to real-time tariffs or grid conditions, further facilitating the integration of renewable energy. Furthermore, PHSs, which integrate electricity and district heating systems, are considered a crucial strategy for enhancing energy efficiency and reducing greenhouse gas emissions [27]. The coordination of electrical and thermal systems distributes excess renewable electricity to the heating network, thereby preventing wind and sunlight abandonment [28].
Owing to the high costs of actual retrofitting, most studies on PHSs rely heavily on theoretical modeling and simulation analyses. However, such studies often lack rigorous quantitative analyses and validation based on real-world data, which may undermine the reliability and practicality of the research outcomes for real-world applications. Consequently, the effectiveness and feasibility of applying these findings in practice are limited. This study addresses this research gap by collecting real-world operational data from a thermal power plant and a heating company based in Liaoning, China. We systematically reviewed the operational characteristics of the deep retrofitting modifications and heating system of the plant and conducted an in-depth analysis of the overall performance of the PHSs. The findings offer data-driven support for similar system modifications in other regions and rigorous quantitative analysis and validation to address the balance between the power system, heating system, and their interactions to further enhance system stability and increase renewable energy utilization.

2. Method

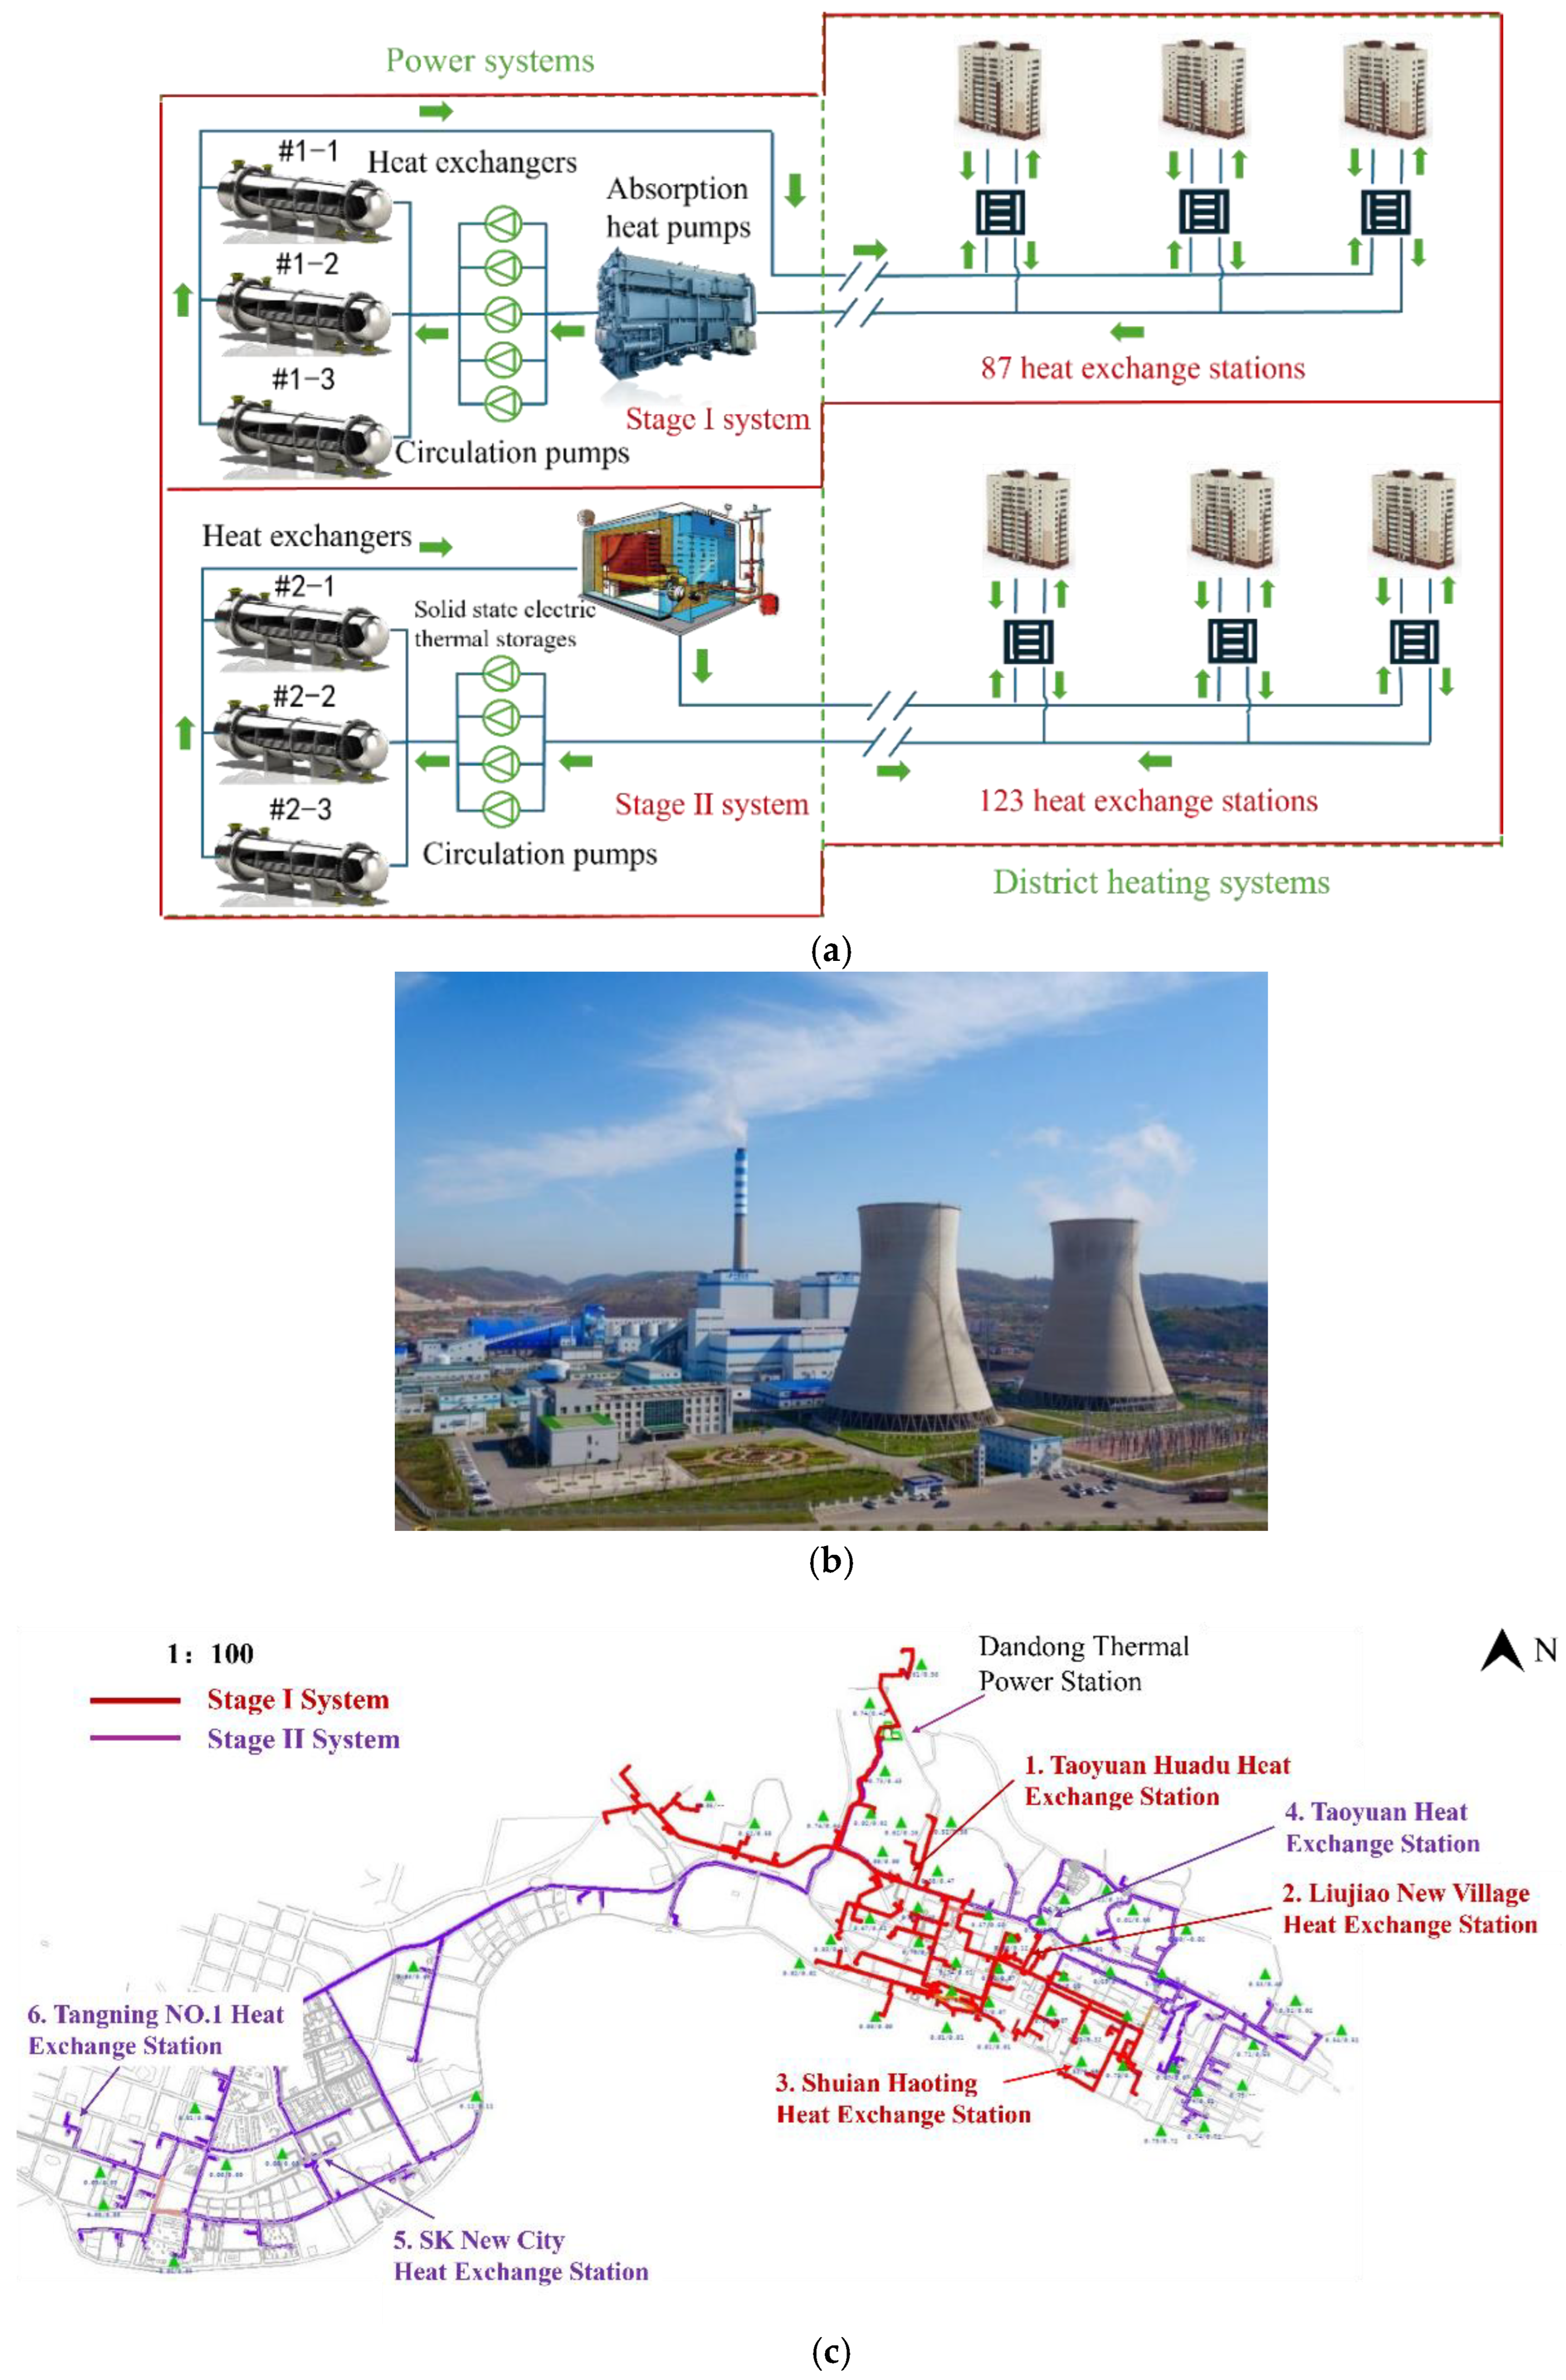
2.1. System Overview

2.1.1. History of Thermal Power Plant Renovation

The construction of a thermal power plant in Liaoning began on 20 September 2009. The thermal power plant adopts a unit-based heating steam system, with each unit equipped with two high-efficiency shell-and-tube steam–water heat exchangers. Each of the two units (Units 1 and 2) has a first and second heat exchanger (#1-1 and 1-2, and 2-1 and 2-2, respectively). The single-turbine unit was designed for a rated heating extraction flow of 340 t/h and a maximum extraction flow of 550 t/h. Mechanical-limit butterfly valves were installed on the medium- and low-pressure connecting pipes to regulate the steam supply flow to the heat network and the steam inlet flow to the low-pressure cylinder. In 2012, the total heating capacity of the hot-spot plant reached 2.62 million GJ, equivalent to 6.5 million m2 of heating area.
Against the backdrop of the nation’s active promotion of thermal power participation in peak shaving, the Liaoning thermal power plant underwent major renovations in 2015. These renovations introduced six steam-driven lithium bromide AHPs, each with a capacity of 52.3 MW. The upgrade increased the heating area by 4.55 million m2, thus increasing the total heating area to 11.05 million m2. In response to the current peak-shaving challenges in the Liaoning Province power grid, a 260-MW solid-state electrical storage heating system was built in 2016 to achieve deep peak shaving during the winter heating season. The charging operation of the electrical storage heating system was successfully completed on 28 February 2017.
Subsequently, heating tasks were refined and allocated. The thermal power plant has an elongated heating area. The old district corresponds to the originally planned heating zone, whereas the new district represents an expanded heating area added later, categorized as Stages I and II of the projects, respectively. Heat exchangers #1-1 and #1-2 operated in conjunction with the AHPs to provide heating services to Stage I users. Heat exchangers #2-1 and #2-2 were connected to the solid-state electrical storage heating system to ensure flexibility and reliability for Stage II heating.
With the continued growth in heating demand, the operational flexibility of the units became severely restricted during the latter heating season stages. In 2017, the Liaoning thermal power plant implemented a low-pressure cylinder-heating technology retrofit. The retrofit involved replacing the low-pressure cylinder cooling flow control valve with a fully sealed zero-leakage hydraulic butterfly valve and adding a bypass system to precisely control the cooling steam parameters of the low-pressure cylinder. In addition, a third heat exchanger was added to units #1 (#1-3) and #2 (#2-3) of the thermal power plant. By 2017, the total heating supply reached 17 million GJ, equivalent to a heating area of 19 million m2, and the cumulative electricity generation was 26,226,500,000 kW·h. With these upgrades, deep peak-shaving retrofitting of the thermal power plant was completed.

2.1.2. Current Operation of the Thermal Power Plant Heating System

Since the start of its operation, the Liaoning thermal power plant has accommodated an annual increase in heating users and heating area. By the end of 2023, the connected area reached approximately 25.31 million m2, with 210 heat exchange stations and a primary pipeline network length of approximately 212 km. Currently, the heating system of the thermal power plant employs a dual-phase independent main-pipe layout. In particular, the 87 heat exchanger stations in Stage I are fed by AHPs and heat exchangers #1-1, #1-2, and #1-3 to meet the heat demand; the AHPs are responsible for the base heat load, and the heat exchangers provide the additional heat required by heat users. The second-phase heat load is shared among heat exchangers #2-1, #2-2, and #2-3 and the solid-state electric heat storage units, which provide heat to 123 heat exchanger stations. The electrical and district heating systems are shown in Figure 1.
Typical heat exchange stations at the near, middle, and far ends of the primary pipeline network were selected as case studies to conduct a comparative analysis of heat exchange stations at various locations along the primary pipeline network of the district heating system. In particular, six representative heat exchange stations were chosen: Taoyuan Huadu, Liujiao New Village, and Shuian Haoting in Stage I and Taoyuan, SK New City, and Tangning No. 1 in Stage II. The specific locations of these heat exchange stations are shown in Figure 1c, and their detailed parameters are listed in Table 1.

2.2. Environmental Benefit Assessment Method for AHPs

To quantitatively evaluate the environmental advantages of the AHP system compared to traditional heating systems, a series of calculations were conducted based on Equations (1)–(7). The analysis encompassed key performance indicators including the increase in heating capacity, savings in standard coal consumption, expansion of the heating area, and the amount of waste heat recovered, thereby providing a comprehensive assessment of the improvements in system performance.
α = Q N Q M Q M × 100 %
A = Q N Q M ω × 10 2
Q C = m c × c × ( t in t out ) 10 6
m 1 = Q c h
m 2 = Q c η φ
E CO 2 = Q c η E F CO 2
q c = Q c Q N

2.3. Heat Exchanger Efficiency Calculation Method in Heat Exchanger Stations

The heat exchanger station is a crucial segment of the heat supply system, as the heat exchanger efficiency directly influences the operating effectiveness of the heating system and energy utilization efficiency. Heat exchanger efficiency refers to the efficiency of the heat exchanger equipment in transferring heat from the heat source side to the user side; that is, the ratio of actual heat transferred to the theoretically transferable heat during the heat exchange process. The log mean temperature difference (LMTD) quantifies the average temperature difference between the fluids on either side of the heat exchanger, offering a more precise measure of the heat transfer driving force in the system.
Δ t m = Δ t max Δ t min ln Δ t max Δ t min
t 1 t 1 = ε ( t 1 t 2 )
From the heat balance of the system, Equation (10) can be derived as follows:
( t 1 t 2 ) ( t 1 t 2 ) = ( 1 + q m 1 c 1 q m 2 c 2 ) ( t 1 t 2 )
Combining Equations (9) and (10) yields Equation (11) as follows:
1 t 1 t 2 t 1 t 2 = ε ( 1 + q m 1 c 1 q m 2 c 2 )
Equation (11) simplifies to Equation (12) as follows:
ε = 1 t 1 t 2 t 1 t 2 1 + q m 1 c 1 q m 2 c 2

3. Results and Discussion

3.1. AHP Waste Heat Recovery System

3.1.1. Analysis of Actual AHP Operation

The Liaoning thermal power plant uses lithium bromide AHPs for waste heat recovery to conserve low-grade heat lost to the environment and reduce irreversible loss in the original system, as shown in Figure 2. In the improved system, waste heat from the cooling water is used to heat the AHP evaporator, with some steam serving as the thermal input to the AHP generator. Figure 3 shows the load distribution of the Stage I system. AHPs can preheat the heat network return water from 50 to 70 °C. The preheated return water is further heated by steam to 90 °C and transported to the heating network. When the waste heat water flow rate is 6596.16 m3/h and the inlet and outlet temperatures of the waste heat water are 34.91 and 31.58 °C, respectively, the heat pump absorbs 25.49 MW of waste heat from the power plant. At this point, the total heat load required for Stage I is 308.37 MW, of which the AHP bears 147.81 MW, and the steam–water heat exchanger bears 160.56 MW. Therefore, the AHP accounts for approximately 48% of the heat load in the Stage I heating network, whereas the remaining 52% is handled by the steam–water heat exchanger. On 7 January 2021, because the AHP was out of service, the thermal power unit bore the entire 327 MW heat load required by heat users.

3.1.2. Analysis of the Environmental Benefits of AHPs

When the steam extraction rate of the AHP unit is the same as that of the traditional heating system, the AHP system provides a heating capacity of 260.39 MW and recovers 55.64 MW of waste heat. According to actual system operation data, the waste heat recovery system recovers approximately 7.3 × 10⁷ GJ of waste heat during the heating season. Previously, this heat dissipated into the environment by evaporative cooling in cooling towers. Considering that the latent heat of water is approximately 2400 kJ/kg, the condensation of 7.3 × 10⁷ GJ of heat would require approximately 3.04 × 10⁸ kg of water for evaporation. The coal required to generate 7.3 × 10⁷ GJ of thermal energy, with a coal evaporation value of 29.31 MJ/kg and a conversion efficiency of 90%, amounts to 2.77 × 10⁷ kg of coal. In addition, with a CO₂ emission factor of 96 t CO₂/TJ, defined based on the recovered useful thermal energy output [29], the corresponding CO₂ emissions would be 0.78 × 10⁸ kg. Therefore, by recovering 7.3 × 10⁷ GJ of waste heat through the system, water consumption can be reduced by 3.04 × 10⁸ kg and CO2 emissions by 0.78 × 10⁸ kg annually. This corresponds to approximately 0.21 MW of waste heat recovered per megawatt of heating capacity.
To enhance the robustness of the environmental benefit assessment, a sensitivity analysis was conducted to examine the influence of variations in key parameters on the main quantitative outcomes. For the estimation of CO₂ emission reductions, variations in the emission factor of 90–100 t CO₂/TJ recovered 6.8 × 10⁷–7.6 × 10⁷ GJ of waste heat, and system efficiency of ±5% was considered. Under these conditions, the estimated annual CO₂ emission reductions ranged from 0.66 × 10⁸ to 0.89 × 10⁸ kg. Similarly, considering variations in the coal calorific value and conversion efficiency, the estimated standard coal savings ranged from 2.49 × 10⁷ to 3.03 × 10⁷ kg. For water savings, a 10% variation in latent heat and climatic conditions was applied, resulting in a water-saving range of 2.74 × 10⁸ to 3.34 × 10⁸ kg. This sensitivity analysis addresses uncertainties in operational conditions, fuel characteristics, and environmental factors, thereby improving the credibility and applicability of the results to broader regional or system-level implementations.

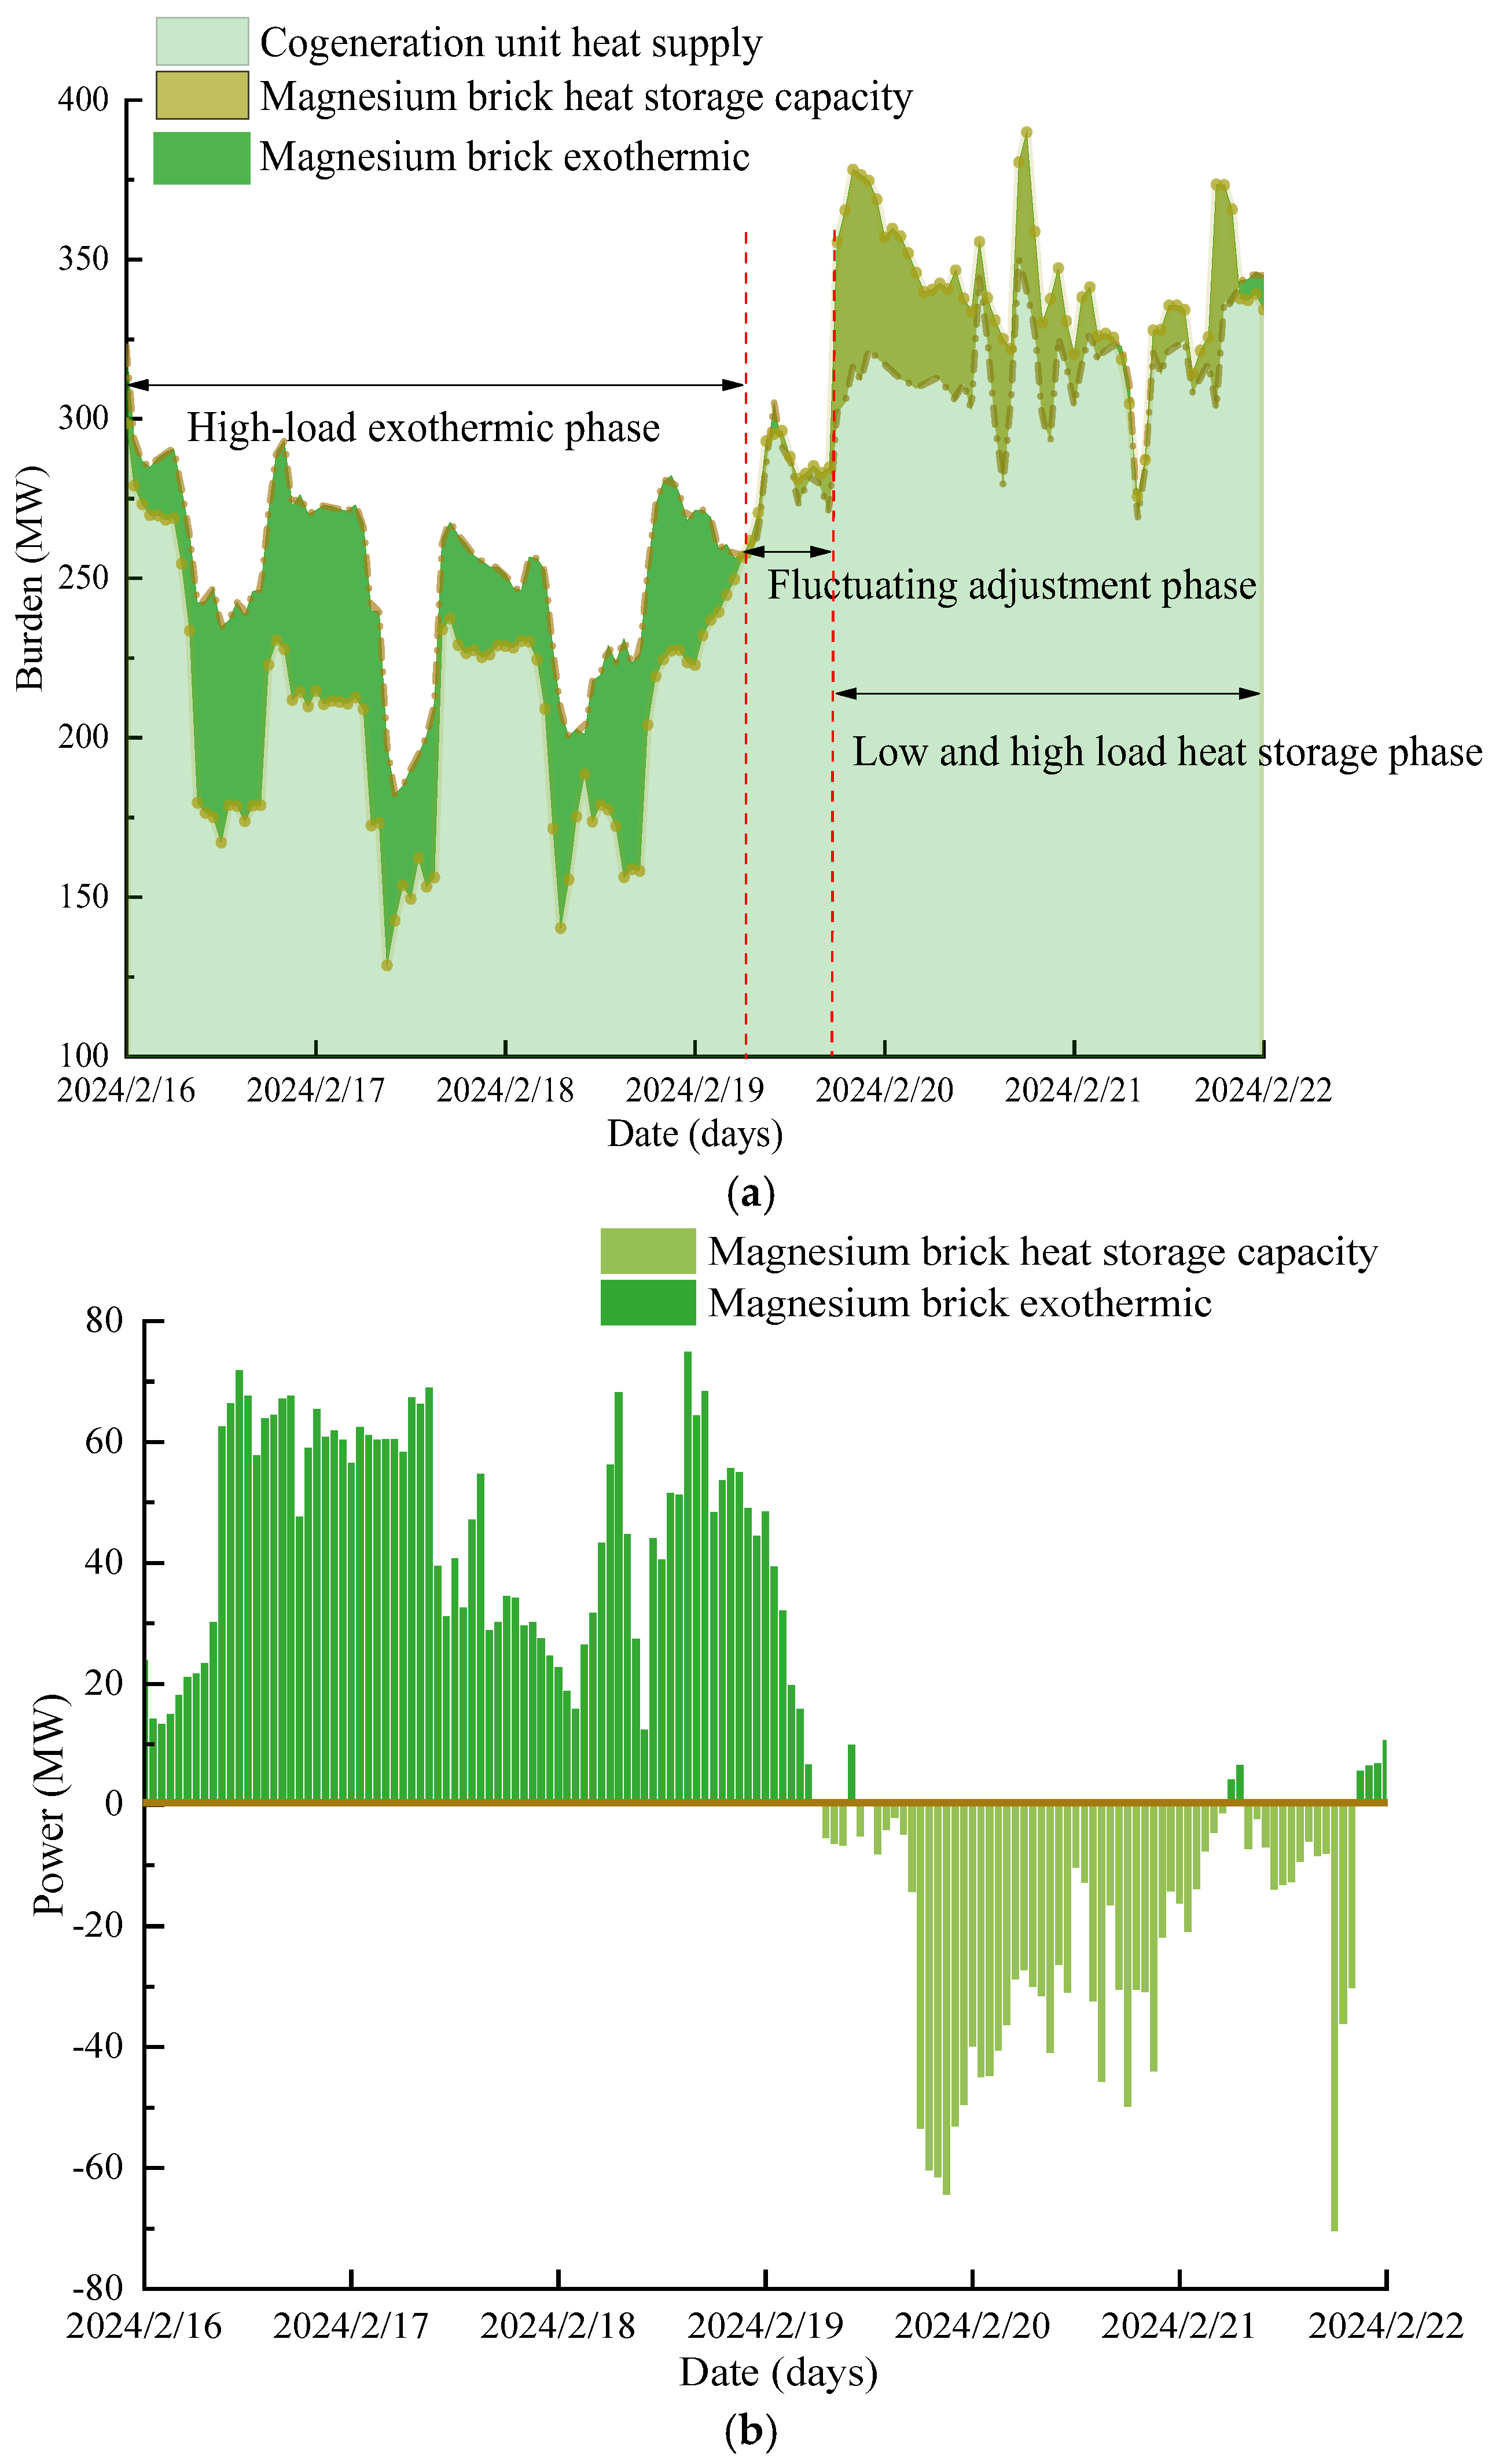
3.2. Application of Solid-State Electric Thermal Storage in Deep Peaking

The heat load distribution for Stage II is shown in Figure 4. Solid-state electric heat storage operation can be divided into three stages: high-load heat release, fluctuation adjustment, and low-load heat storage. Between 16 and 18 February 2024, the solid-state electric storage was in the high-load heat release phase. The average heating load of the cogeneration units was 201 MW, and the average load required for Stage II was 248 MW. The actual heat output was lower than the required load for Stage II, indicating that the unit supply was insufficient to meet the total heat demand.
In this case, electric thermal storage fills the gap between the CHP unit and the actual load by releasing stored heat. Between 17 and 18 February 2024, the solid-state electric storage was in a fluctuating adjustment phase. The actual heat output of the cogeneration unit was approximately equal to the required heat load for Stage II, with less fluctuation in the heat stored in the electric storage and discharge. From 17 to 21 February 2024, the solid-state electric storage system was in the low-load heat storage phase. The average heating load of the cogeneration units was 341 MW, compared with the 310 MW required for Stage II. The actual heat output of the cogeneration units exceeded the required Stage II load, with the electric thermal storage unit storing 31 MW to serve as a reserve for potential future load peaks. Overall, the electric thermal storage system ensures a reliable heat supply under load fluctuations through rational heat storage and release operations. This load-balancing strategy effectively relieves the pressure on CHP units during peak periods and improves the operational efficiency of the entire system.
Analyzing the indirect CO₂ emissions associated with operating the electric thermal storage system is necessary to enhance the accuracy and transparency of the environmental benefit assessment. Since the system requires electricity from the grid, the carbon intensity of the grid plays a crucial role in determining the overall carbon reduction benefits. In regions such as Liaoning Province, where coal-based power generation dominates, the average carbon intensity of the grid is approximately 700 g CO₂/kWh. Assuming that the total electricity consumption of the electric thermal storage system during the heating season is 2.08 × 10⁷ kWh, its indirect CO₂ emissions would be approximately 1.46 × 10⁷ kg CO₂. A sensitivity analysis was conducted considering variations in the carbon intensity of the grid, ranging from 500 to 900 g CO₂/kWh. The corresponding indirect CO₂ emissions were found to range from 1.04 × 10⁷ to 1.87 × 10⁷ kg. Although electricity input generates some carbon emissions, the overall net carbon reduction benefit remains positive owing to the significant waste heat recovery and CO₂ reduction achieved by the AHP system. The AHP system recovers approximately 7.3 × 10⁷ GJ of heat annually, reducing CO₂ emissions by approximately 0.66 × 10⁸–0.89 × 10⁸ kg. Therefore, despite the indirect carbon emissions from operating the ETS system, it still provides significant environmental benefits in terms of greenhouse gas emission reduction.

3.3. Analysis of District Heating Systems

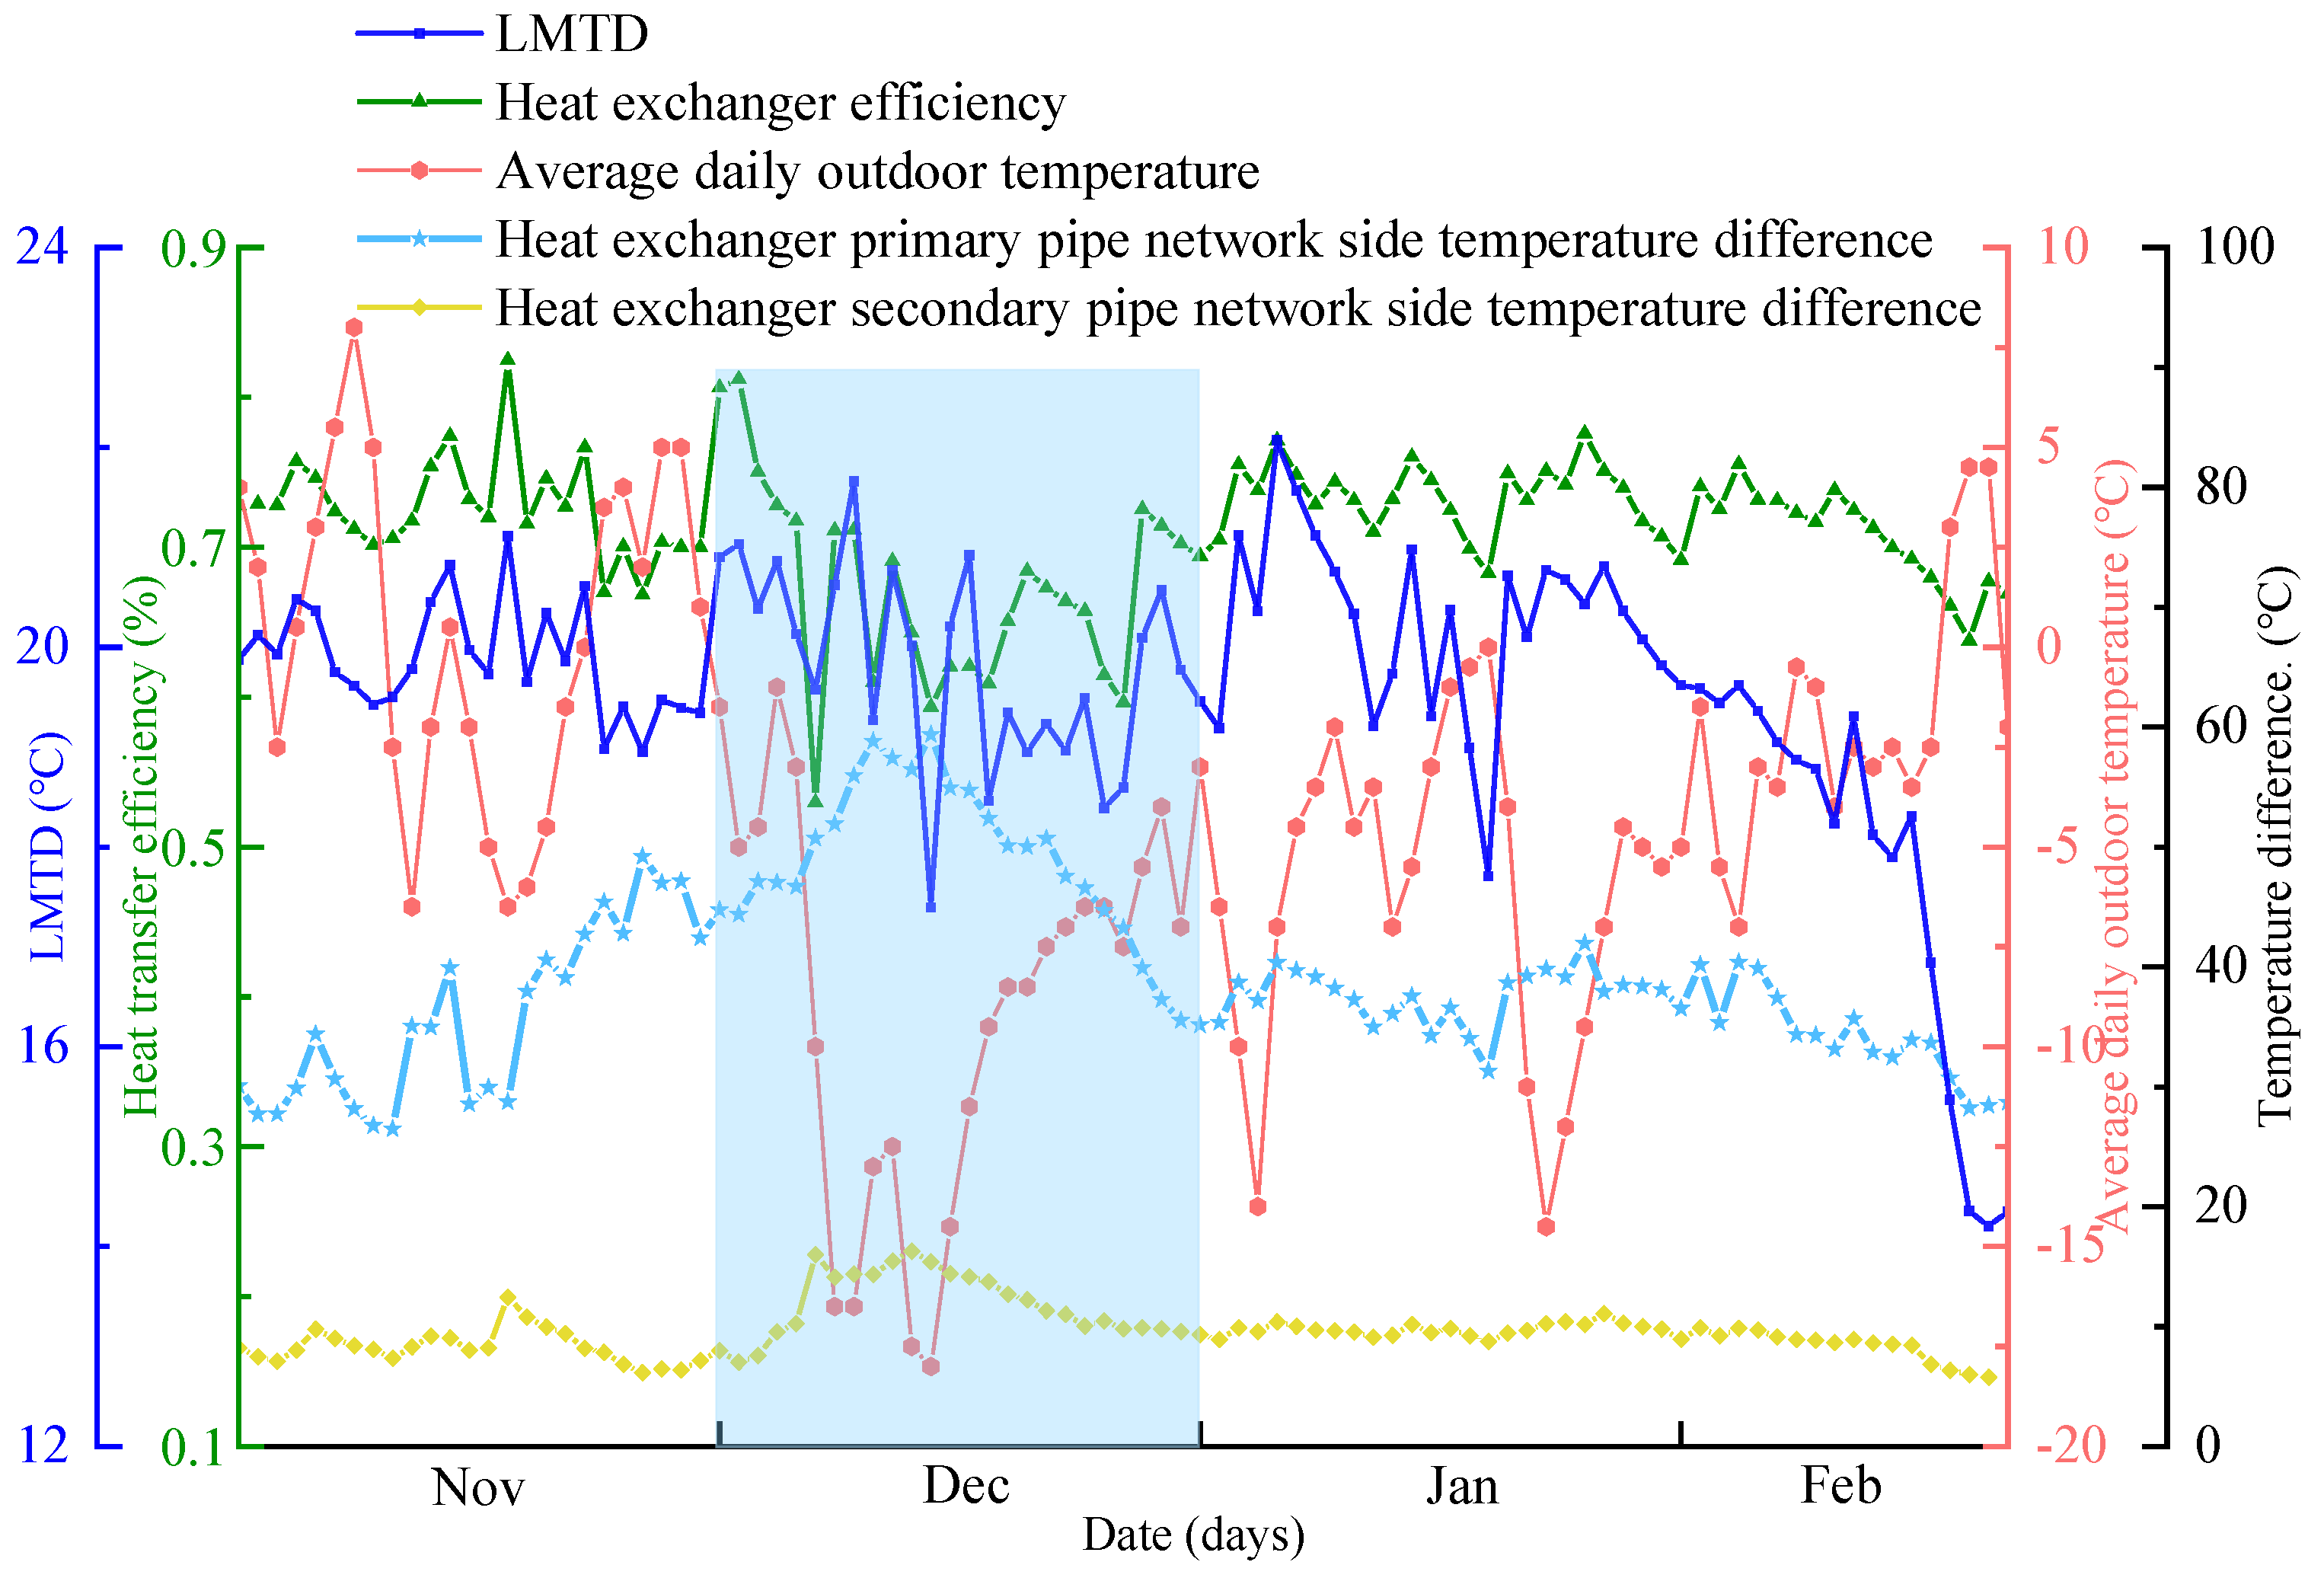
3.3.1. Heat Exchanger Efficiency in Heat Exchanger Stations

Figure 5 illustrates the correlation between the average daily outdoor temperature, the temperature differential between the primary and secondary pipe network inlets and outlets at the heat exchange station, and the corresponding heat exchange efficiency. The average daily outdoor temperature showed a negative correlation with both the temperature difference between the inlets and outlets of the primary pipe network and that of the secondary pipe network. As the outdoor temperature decreased, the user heat demand increased, prompting an increase in the water supply temperature or flow rate of the system to meet the heat load. The heat exchanger efficacy exhibited a positive correlation with the LMTD. As the outdoor temperature decreased, the heat transfer driving force within the heat exchanger decreased significantly, leading to a gradual decrease in the LMTD and a subsequent reduction in the heat exchanger efficiency.
In mid-December, the average daily outdoor temperature reached an annual low of −18 °C, and the heat exchanger efficiency decreased to 60%. The system operates inefficiently at extremely low temperatures. Although the system increases the heat input at low temperatures to satisfy the heating demand, the heat transfer efficiency is reduced, possibly owing to conditions such as system overloading, heat transfer coefficient reduction inside the heat exchanger, and increased heat loss at low temperatures. In addition, under extremely low-temperature conditions, the physical properties of the heat transfer fluid, such as viscosity, increase, further limiting the heat transfer capacity of the heat exchanger and decreasing the heat exchanger efficiency.

3.3.2. Temperature Decrease in the Primary Heating System Network

Figure 6 illustrates the relationship between the temperature decrease from the thermal power plant outlet to the heat exchange station inlet and pipeline length. Among the six selected heat exchange stations, the shortest distance is between the thermal power plant and the Taoyuan Huadu heat exchange station, with a pipeline length of 1175 m and a temperature decrease of 0.66 °C. Conversely, the Tangning No. 1 heat exchange station is the farthest from the thermal power plant, with a pipeline length of 14,665 m and a temperature decrease of 3.48 °C. These measurements indicate a direct proportional relationship between the temperature decrease in the water medium in the primary pipeline network and pipeline length.
Further calculations were performed to determine the temperature decrease per unit length of the primary heating pipeline network, as shown in Figure 6. The temperature decreases per unit length of the pipeline from the thermal power plant to Heat Exchange Stations 1 and 2 were 0.26 °C/km and 0.31 °C/km, respectively. At the end of the heating network, at Heat Exchange Station 3, the overall temperature decrease in the pipeline was reduced to 0.29 °C/km. This trend indicates that the temperature decrease per unit length did not increase linearly with pipeline length. Instead, the rate of temperature decrease per unit length first increased and then decreased along the pipeline. At Heat Exchange Stations 1 and 4, which are closer to the heat source, a significant temperature gradient led to intense heat conduction between the pipeline and surrounding soil. In addition, higher flow rates enhanced convective heat transfer, resulting in a higher temperature decrease. Further along the pipeline, particularly at Heat Exchange Stations 3 and 6, which are further from the heat source, the temperature of the pipeline surface gradually decreased. This resulted in a significant reduction in the heat transfer with the soil. Furthermore, the decreased flow velocity at the end of the network reduced convective heat transfer inside and outside the pipeline, causing a progressive decrease in temperature reduction. Consequently, during long-distance transportation, the combined effects of decreased temperature gradients, reduced soil heat transfer, and changes in operational parameters resulted in a notable reduction in temperature decrease. Therefore, optimizing these factors is crucial for enhancing the overall energy efficiency of heating systems.
In addition, in the Stage I system, which encompasses Heat Exchange Stations 1–3, the primary pipeline includes numerous branch lines, where hot water is continuously extracted at multiple points. This frequent lateral heat extraction significantly increases the overall thermal losses and accelerates the rate of the temperature drop. Consequently, the temperature decreases per unit length from the thermal power plant to Heat Exchange Station 1 were lower than those observed at Stations 2 and 3. By contrast, the Stage II system, comprising Heat Exchange Stations 4–6, features a long and continuous main pipeline with relatively few branches. This configuration results in lower thermal losses and a consistently decreasing trend in the temperature drop per unit length.

3.4. Overall Operational Analysis of Electricity and District Heating

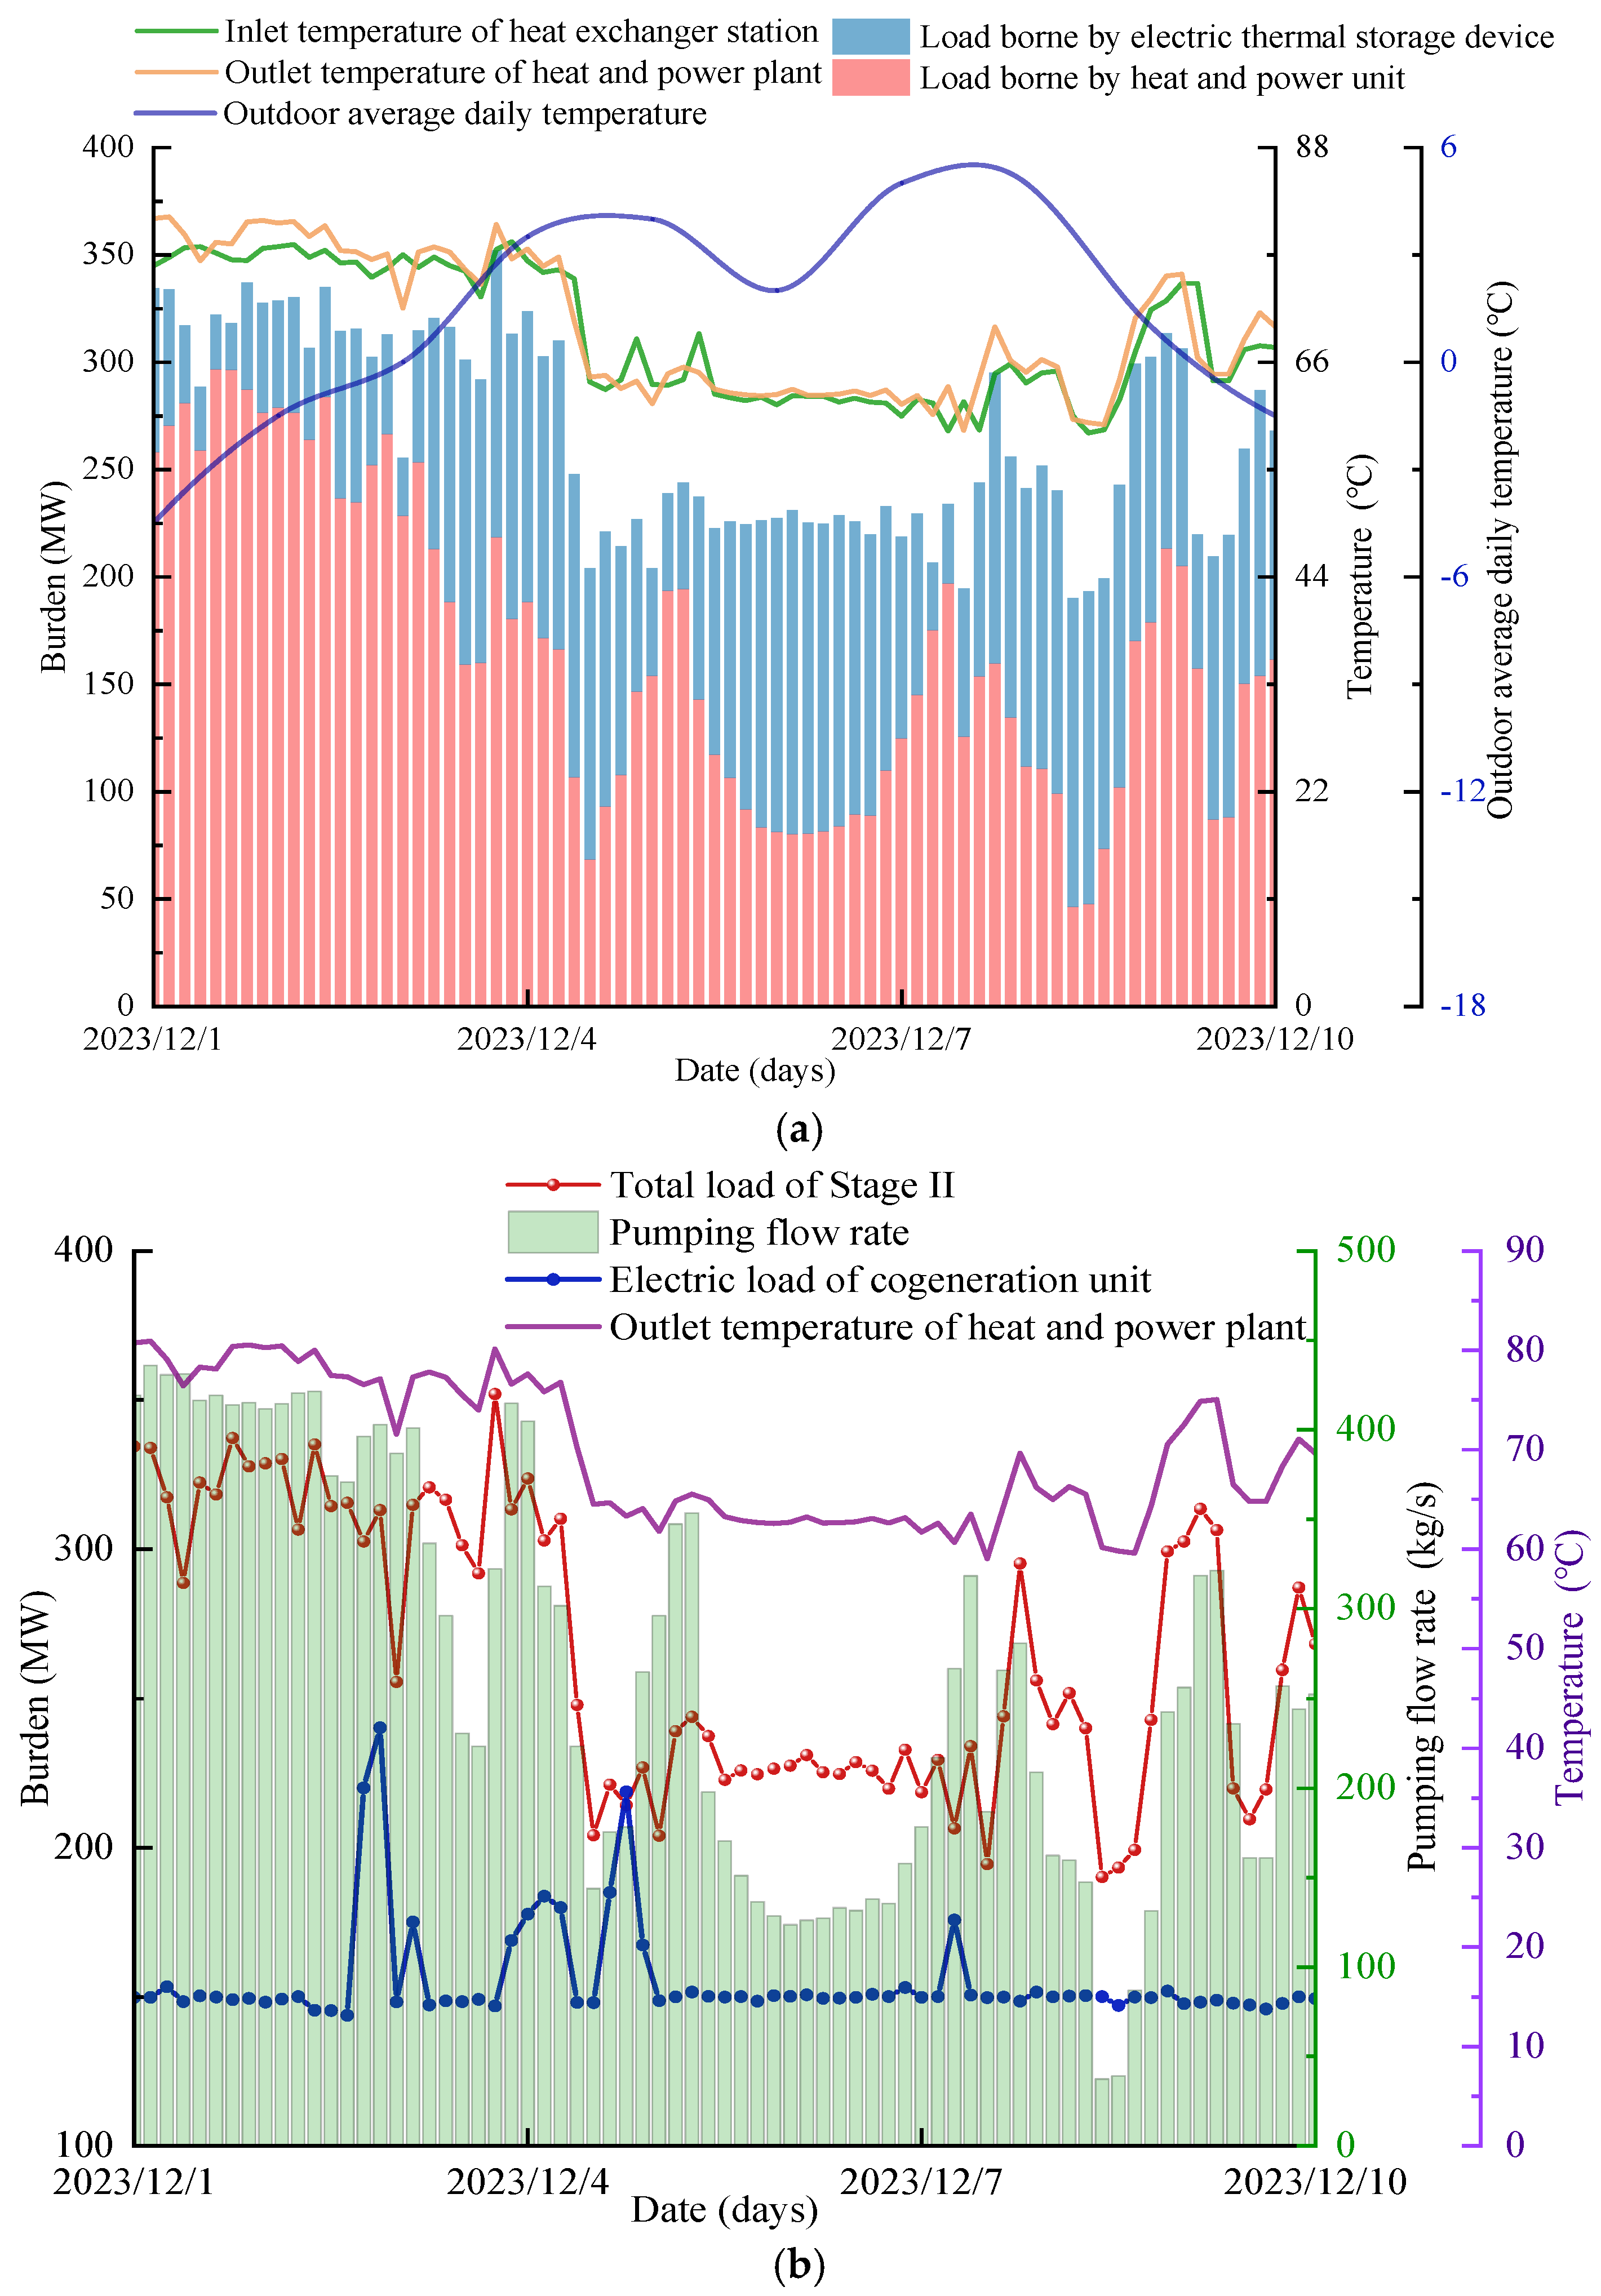
3.4.1. Analysis of Overall System Operations for Stage I

Figure 7 illustrates the actual operational data of the Stage I electricity and district heating systems. The load of the AHP fluctuated less during changes in the average daily outdoor temperature and stabilized at approximately 170 MW. The load stability indicates that the AHP does not require frequent operational adjustments under varying outdoor temperature conditions. On 15 December 2023, as the average daily outdoor temperature decreased sharply, both the outlet temperature of the thermal plant and the inlet temperature of the heat exchange station increased rapidly, leading to a significant increase in the system heat load. During this process, the load handled by the thermal power plant increased by 80 MW, whereas the AHP load increased by only 10 MW. The thermal power unit load fluctuated significantly with temperature variations. This phenomenon indicates that although the AHP can partially alleviate the load on the thermal power unit, the system continues to primarily rely on the thermal power unit to maintain heating stability during rapid thermal load increases.
As shown in Figure 8b, the trends in the electrical and thermal loads of the thermal power plant over time were consistent, indicating a positive correlation between the two. On 18 and 22 December, a sudden increase in the electrical load occurred, whereas the thermal load of the thermal power plant decreased. This suggests that the thermal power plant may have prioritized shifting to the power generation mode to meet the electricity demand. In this case, the AHP compensated for the reduced thermal supply owing to the shift toward power generation by increasing its thermal output to maintain the thermal balance of the system.

3.4.2. Analysis of Overall System Operations for Stage II

Figure 8 illustrates the Stage II PHS operation. Changes in the outdoor temperature significantly affected the operating mode of the thermal power plant and the heating system. From 1 to 8 December 2023, outdoor temperatures fluctuated upward, leading to a decrease in the heat demand from users. As the turbine steam extraction decreased, the heat load handled by the cogeneration unit also decreased, resulting in a gradual decrease in the outlet temperature of the cogeneration plant. The inlet temperature of the heat exchanger was lower than the outlet temperature of the cogeneration plant owing to the heat loss in the heat supply from the pipe network. On 8 December 2023, the average outdoor temperature peaked at 6 °C, with user heat demand reaching a minimum of 185 MW. The cogeneration unit supplied 125 MW of heat, handling 68% of the load, while the remaining 60 MW was provided by the electric thermal storage unit.
Outdoor temperature variations led to significant fluctuations in the thermal load, whereas the electrical load remained nearly constant at approximately 150 MW. On 9 December 2023, the thermal load surged from 190 to 310 MW; however, the electrical load remained stable. This stability was due to the electrical storage heating system, which stores thermal energy during periods of low demand and releases it during fluctuations, thereby smoothing out variations in the thermal load of the CHP system and preventing fluctuations in the electricity output caused by thermal load changes. Notably, between 1 and 10 December 2023, the electrical load underwent five significant fluctuations. For example, on 3 December, the electrical load rapidly increased from 150 to 250 MW, whereas the total thermal load for Stage II decreased significantly. This sudden increase in electricity demand may have been due to emergency grid dispatches or sudden spikes in external power requirements. During this period, the system scheduling strategy was adjusted to reallocate the resources originally intended for heat production to electricity generation. In a CHP system, the thermal power unit must dynamically adjust the thermal load output while ensuring a stable supply of electrical load, resulting in a temporary and significant decrease in the total thermal load in Stage II.
Moreover, regular maintenance measures, including periodic cleaning of heat exchangers and descaling processes, were implemented to mitigate performance degradation caused by fouling. Therefore, the operational data used in this study were collected during stable periods following major system retrofits, under conditions where the effects of equipment aging and fouling were minimal.

4. Conclusions

In this study, real-world operational data were collected from a thermal power plant and district heating company based in Liaoning, China, during the heating season, and modifications to the thermal power plant systems were systematically reviewed to examine the heating system operational characteristics. An in-depth analysis of the overall performance of CHP and district heating systems was subsequently conducted, and the main conclusions are summarized as follows:
(1)
AHPs and solid-state electric thermal storage technologies effectively enhanced the thermal balance and load regulation capabilities of the system. The waste heat recovery system was used to recover approximately 7.3 × 10⁷ GJ of waste heat in one heating season, which can reduce 3.04 × 10⁸ kg of water consumption and 0.78 × 10⁸ kg of CO2 emissions. Solid-state electrical thermal storage can be divided into three phases: high-load heat release, fluctuation adjustment, and low-load heat storage. The implementation of effective heat storage and release strategies ensures reliable heating performance during load fluctuations.
(2)
In the combined heating system of AHPs and network heat exchangers, the thermal load output of the absorption heat pump remained stable, with the thermal power units continuing to serve as the core equipment for system peak load regulation. In the combined system of district heating network heat exchangers and electric thermal storage devices, the presence of electric thermal storage assists in smoothing out thermal load fluctuations. In addition, the electrical load exhibited minimal variation, maintaining a level of approximately 150 MW. Notably, significant fluctuations in the electrical load occur because of emergency grid dispatches and other external factors.
(3)
In district heating systems, particularly during long-distance pipeline transportation, significant thermal losses were observed. The temperature decrease in the water medium in the primary network is directly proportional to the pipeline distance. When the distance from the power plant outlet to the heat exchange station was 1175 and 14,665 m, the temperature decreased by 0.66 and 3.48 °C, respectively. The temperature decrease per unit pipe length was influenced by multiple factors, including the temperature gradient, reduced heat transfer to the surrounding soil, and operational parameters.
(4)
The ambient temperature significantly affected the LMTD and efficiency of heat exchangers in heat transfer stations, demonstrating a positive correlation between the two. When the outdoor temperature reached the annual minimum of −18 °C, the temperature difference between the supply and return of both the primary and secondary heating networks peaked, the efficiency of the heat exchanger decreased to 60%, and the LMTD decreased to 17.5 °C. Therefore, focusing on optimizing heat transfer stations and implementing energy-saving measures to ensure system efficiency is crucial for practical operations.
Finally, these findings offer practical guidance for implementing similar system modifications in other regions and provide supporting data analysis to address the required balance between the power supply and heating demand. For example, in regions with significant outdoor temperature fluctuations, absorption heat pumps can still maintain stable output. Electric thermal storage is effective in smoothing thermal load fluctuations, making it suitable for large-scale district heating networks facing variable thermal demands, thereby ensuring stable heating performance. Significant thermal losses were observed during long-distance pipeline transportation, which can be mitigated by optimizing pipeline design and enhancing thermal insulation. The results also contribute important insights into the deep coupling of PHS, aiming to enhance system stability and increase efficient renewable energy utilization. Future research will focus on long-distance pipeline and thermal energy storage technologies and investigate their application potential in large-scale district heating systems.

Author Contributions

Methodology, D.L., D.C., J.X. and C.L.; Writing—review & editing, P.Y.; Writing—original draft, H.C. All authors have read and agreed to the published version of the manuscript.

Funding

This work was supported by State Grid Corporation of China Headquarters Management of Science and Technology Project (5108-202328050A-1-1-ZN).

Data Availability Statement

The original contributions presented in this study are included in the article. Further inquiries can be directed to the corresponding author.

Conflicts of Interest

Authors Peng Yu, Dianyang Li, Dai Cui, Jing Xu, Chengcheng Li were employed by the company State Grid Liaoning Electric Power Supply Co., Ltd. The remaining authors declare that the research was conducted in the absence of any commercial or financial relationships that could be construed as a potential conflict of interest.

Nomenclature

A Additional heating area, m2
c Specific heat capacity of circulating cooling water, J/(kg·°C)
E CO 2 CO2 emissions, kg
E F CO 2 CO2 emission factor
h Latent heat of circulating water, kJ/kg
m c Circulating cooling water flow, kg/s
m 1 Circulating water dissipation, kg
m 2 Coal consumption, kg
Q c Waste heat recovery, MW
Q M Heating capacity of the original heating system, MW
Q N Total system heat supply after modification, MW
q c Waste heat recovery per unit heating capacity, MW/MW
q m 1 Primary network side flow rate, m3/h
q m 2 Secondary network side flow rate, m3/h
t in Circulating cooling water inlet temperature, °C
t out Circulating cooling water outlet temperature, °C
t 1 Primary pipe network side inlet water temperature, °C
t 1 Primary pipe network side outlet water temperature, °C
t 2 Secondary pipe network side inlet water temperature, °C
t 2 Secondary pipe network side outlet water temperature, °C
α Percentage increase in heat supply
ω Thermal indicators for heating area, W/m2
φ Calorific value of standard coal, kJ/kg
ε Heat exchanger efficiency
η Conversion efficiency
Δ t m Logarithmic mean temperature difference, °C

References

  1. Brown, M.A.; Herrera, V.S. Combined heat and power as a platform for clean energy systems. Appl. Energy 2021, 304, 117686. [Google Scholar] [CrossRef]
  2. Zhang, H.; Li, Z.; Zhao, H. Thermodynamic performance analysis of a novel electricity-heating cogeneration system (EHCS) based on absorption heat pump applied in the coal-fired power plant. Energy Convers. Manag. 2015, 105, 1125–1137. [Google Scholar] [CrossRef]
  3. Li, P.; Wang, H.; Lv, Q.; Li, W. Combined Heat and Power Dispatch Considering Heat Storage of Both Buildings and Pipelines in District Heating System for Wind Power Integration. Energies 2017, 10, 893. [Google Scholar] [CrossRef]
  4. Li, X.; Li, W.; Zhang, R.; Jiang, T.; Chen, H.; Li, G. Collaborative scheduling and flexibility assessment of integrated electricity and district heating systems utilizing thermal inertia of district heating network and aggregated buildings. Appl. Energy 2020, 258, 114021. [Google Scholar] [CrossRef]
  5. Su, W.; Han, Y.; Liu, Z.; Jin, X.; Liu, Z.; Yang, D.; Zhang, X. Absorption heat pumps for low-grade heat utilization: A comprehensive review on working pairs, classification, system advances and applications. Energy Convers. Manag. 2024, 315, 118760. [Google Scholar] [CrossRef]
  6. Xu, Z.; Wang, R. Absorption heat pump for waste heat reuse: Current states and future development. Front. Energy 2017, 11, 414–436. [Google Scholar] [CrossRef]
  7. Xu, Z.; Mao, H.; Liu, D.; Wang, R. Waste heat recovery of power plant with large scale serial absorption heat pumps. Energy 2018, 165, 1097–1105. [Google Scholar] [CrossRef]
  8. Parham, K.; Khamooshi, M.; Tematio, D.B.K.; Yari, M.; Atikol, U. Absorption heat transformers—A comprehensive review. Renew. Sustain. Energy Rev. 2014, 34, 430–452. [Google Scholar] [CrossRef]
  9. Zhao, Z.; Zhang, X.; Ma, X. Thermodynamic performance of a double-effect absorption heat-transformer using TFE/E181 as the working fluid. Appl. Energy 2005, 82, 107–116. [Google Scholar] [CrossRef]
  10. Su, W.; Han, Y.; Jin, X.; Liu, Z.; Zhang, X. Energy, economic, and environmental evaluation of a GAX-based cross-type absorption-resorption heat pump. Energy Convers. Manag. 2024, 300, 117952. [Google Scholar] [CrossRef]
  11. Jia, T.; Dou, P.; Chen, E.; Dai, Y. Feasibility and performance analysis of a hybrid GAX-based absorption-compression heat pump system for space heating in extremely cold climate conditions. Energy 2022, 242, 122936. [Google Scholar] [CrossRef]
  12. Jia, T.; Chu, P.; Dou, P.; Dai, Y. Working domains of a novel solar-assisted GAX-based two-stage absorption-resorption heat pump with multiple internal heat recovery for space heating. Energy Convers. Manag. 2020, 220, 113060. [Google Scholar] [CrossRef]
  13. Bourouisa, M.; Coronas, A.; Romero, R.J.; Siqueiros, J. Purification of seawater using absorption heat transformers with water-(LiBr+LiI+LiNO3+LiCl) and low temperature heat sources. Desalination 2004, 166, 209–214. [Google Scholar] [CrossRef]
  14. Wu, W.; Zhang, X.; Li, X.; Shi, W.; Wang, B. Comparisons of different working pairs and cycles on the performance of absorption heat pump for heating and domestic hot water in cold regions. Appl. Therm. Eng. 2012, 48, 349–358. [Google Scholar] [CrossRef]
  15. Li, X.; Wu, W.; Zhang, X.; Shi, W.; Wang, B. Energy saving potential of low temperature hot water system based on air source absorption heat pump. Appl. Therm. Eng. 2012, 48, 317–324. [Google Scholar] [CrossRef]
  16. Sun, F.; Fu, L.; Sun, J.; Zhang, S. A new waste heat district heating system with combined heat and power (CHP) based on ejector heat exchangers and absorption heat pumps. Energy 2014, 69, 516–524. [Google Scholar] [CrossRef]
  17. Chen, Y.; Xu, J.; Zhao, D.; Wang, J.; Lund, P.D. Exergo-economic assessment and sensitivity analysis of a solar-driven combined cooling, heating and power system with organic Rankine cycle and absorption heat pump. Energy 2021, 230, 120717. [Google Scholar] [CrossRef]
  18. Rana, M.; Uddin, M.; Sarkar, R.; Meraj, S.T.; Shafiullah, G.; Muyeen, S.; Islam, A.; Jamal, T. Applications of energy storage systems in power grids with and without renewable energy integration—A comprehensive review. J. Energy Storage 2023, 68, 107811. [Google Scholar] [CrossRef]
  19. Ji, H.; Wang, H.; Yang, J.; Feng, J.; Yang, Y.; Okoye, M.O. Optimal schedule of solid electric thermal storage considering consumer behavior characteristics in combined electricity and heat networks. Energy 2021, 234, 121237. [Google Scholar] [CrossRef]
  20. Cisek, P.; Taler, D. Numerical analysis and performance assessment of the Thermal Energy Storage unit aimed to be utilized in Smart Electric Thermal Storage (SETS). Energy 2019, 173, 755–771. [Google Scholar] [CrossRef]
  21. Ma, Y.; Wang, S.; Yang, H.; Zhang, D.; Shen, Y. Two-stage optimization model for day-ahead scheduling of electricity- heat microgrids with solid electric thermal storage considering heat flexibility. J. Energy Storage 2024, 95. [Google Scholar] [CrossRef]
  22. Guruprasad, A.; Yaxue, L.; Guiyin, F. An overview of thermal energy storage systems. Energy 2018, 144, 341–378. [Google Scholar]
  23. Dai, Y.; Chen, L.; Min, Y.; Mancarella, P.; Chen, Q.; Hao, J.; Hu, K.; Xu, F. Integrated Dispatch Model for Combined Heat and Power Plant with Phase-Change Thermal Energy Storage Considering Heat Transfer Process. IEEE Trans. Sustain. Energy 2018, 9, 1234–1243. [Google Scholar] [CrossRef]
  24. Meng, F.; Lu, Z.; Li, X.; Han, W.; Peng, J.; Liu, X.; Niu, Z. Demand-side energy management reimagined: A comprehensive literature analysis leveraging large language models. Energy 2024, 291, 130303. [Google Scholar] [CrossRef]
  25. Behrangrad, M. A review of demand side management business models in the electricity market. Renew. Sustain. Energy Rev. 2015, 47, 270–283. [Google Scholar] [CrossRef]
  26. Saffari, M.; de Gracia, A.; Fernández, C.; Belusko, M.; Boer, D.; Cabeza, L.F. Optimized demand side management (DSM) of peak electricity demand by coupling low temperature thermal energy storage (TES) and solar PV. Appl. Energy 2018, 211, 604–616. [Google Scholar] [CrossRef]
  27. Yifan, Z.; Wei, H.; Le, Z.; Yong, M.; Lei, C.; Zongxiang, L.; Ling, D. Power and energy flexibility of district heating system and its application in wide-area power and heat dispatch. Energy 2020, 190, 116426. [Google Scholar] [CrossRef]
  28. Zhang, M.; Wu, Q.; Wen, J.; Lin, Z.; Fang, F.; Chen, Q. Optimal operation of integrated electricity and heat system: A review of modeling and solution methods. Renew. Sustain. Energy Rev. 2021, 135, 110098. [Google Scholar] [CrossRef]
  29. Konstantinaviciute, I.; Bobinaite, V. Comparative analysis of carbon dioxide emission factors for energy industries in European Union countries. Renew. Sustain. Energy Rev. 2015, 51, 603–612. [Google Scholar] [CrossRef]
Figure 1. Liaoning power and district heating system; (a) electricity and district heating system; (b) panoramic view of the thermal power plant; (c) district heating systems.
Energies 18 02211 g001
Figure 2. Stage I heating system improvement using lithium bromide AHP.
Energies 18 02211 g002
Figure 3. Stage I heat load assumption.
Energies 18 02211 g003
Figure 4. Stage II system heat load assumption, (a) cogeneration unit and solid-state electric storage unit load-bearing conditions, (b) magnesium brick heat storage and release.
Energies 18 02211 g004
Figure 5. Seasonal trend of each heat exchanger station parameter.
Energies 18 02211 g005
Figure 6. Relationship between the primary heating network length and temperature drop.
Energies 18 02211 g006
Figure 7. Actual operational data of electricity and district heating systems for Stage I, (a) effect of outdoor temperature on each parameter, (b) thermal power unit load variations with respect to electrical and heat pump loads.
Energies 18 02211 g007
Figure 8. Electricity and district heating Stage II system operational data, (a) effect of outdoor temperature on each parameter, (b) relationship between steam extraction, unit load, and the outlet temperature of the thermal plant.
Energies 18 02211 g008
Table 1. Heat exchange station and primary pipeline network data.
RegionIDHeat Exchange StationConnected Area (m2)Primary Pipeline Length (m)
Stage I1Taoyuan Huadu83,086.392275
2Liujiao New Village38,350.865448
3Shuian Haoting44,246.147899
Stage II4Taoyuan162,380.514389
5SK New City107,406.1711,236
6Tangning No. 1176,043.0114,665
Disclaimer/Publisher’s Note: The statements, opinions and data contained in all publications are solely those of the individual author(s) and contributor(s) and not of MDPI and/or the editor(s). MDPI and/or the editor(s) disclaim responsibility for any injury to people or property resulting from any ideas, methods, instructions or products referred to in the content.

