Article

Parametric Sensitivity of a PEM Electrolyzer Mathematical Model: Experimental Validation on a Single-Cell Test Bench

by
Pouya Beigzadeh Arough
,
Arianna Moranda
,
Ataollah Niyati
and
Ombretta Paladino
*
Department of Civil, Chemical and Environmental Engineering, University of Genoa (UNIGE-DICCA), Via Opera Pia 15, 16145 Genoa, Italy
*
Author to whom correspondence should be addressed.
Energies 2025, 18(9), 2217; https://doi.org/10.3390/en18092217
Submission received: 26 March 2025 / Revised: 18 April 2025 / Accepted: 25 April 2025 / Published: 27 April 2025

Abstract

:
Water electrolysis for hydrogen production is of great importance for the reliable use of renewable energy sources to have a clean environment. Electrolyzers play a key role in achieving the carbon-neutral target of 2050. Among the different types of water electrolyzers, proton exchange membrane water electrolyzers (PEMWEs) represent a well-developed technology that can be easily integrated into the smart grid for efficient energy management. In this study, a discrete dynamic mathematical model of a PEMWE was developed in MATLAB/Simulink to simulate cell performance under various operating conditions such as temperature, inlet flow rate, and current density loads. A lab-scale test bench was designed and set up, and a 5 cm2 PEMWE was tested at different temperatures (40–80 °C) and flow rates (3–12 mL/min), obtaining Linear Sweep Voltammetry (LSV), Cyclic Voltammetry (CV), Chrono-potentiometry (CP), and Electrochemical Impedance Spectroscopy (EIS) results for comparison and adjustment of the dynamic model. Sensitivity analysis of different operating variables confirmed that current density and temperature are the most influential factors affecting cell voltage. The parametric sensitivity of various chemical–physical and electrochemical parameters was also investigated. The most significant ones were estimated via non-linear least squares optimization to fine-tune the model. Additionally, strong correlations between these parameters and temperature were identified through regression analysis, enabling accurate performance prediction across the studied temperature range.

1. Introduction

Over the last decade, global energy demand has increased due to rapid population growth and industrial expansion. Reliance on fossil fuels like coal and oil to produce energy has resulted in severe environmental problems, so there is an urgent need to shift toward renewable energy sources (RESs), such as solar and wind power.
Countries around the world are working to increase the amount of energy produced through RESs. However, despite all the progress in using renewables, their unpredictability remains a significant challenge. In this situation, storing energy can help to address this issue and ensure a better balance between energy supply and demand.
Among the various solutions, Power-to-Gas (P2G) technologies—such as the production of energy vectors like hydrogen (H2) and ammonia (NH3) using electricity—offer a promising pathway [1,2]. Compared to other energy carriers, hydrogen has attracted considerable attention due to its high mass energy density (with a Higher Heating Value (HHV) of 140 MJ/kg).
Hydrogen is the most abundant element in the universe; however, it does not occur naturally in its pure elemental form, so multiple methods have been developed to produce it. For instance, grey hydrogen can be produced through steam methane reforming (SMR) or gasification of coal or other fossil fuels, both of which emit significant amounts of CO2 during production. However, by integrating carbon capture and storage (CCS), it can be transformed into blue hydrogen. On the other hand, green hydrogen is produced via water electrolysis powered by renewable energy. This approach not only makes the production of pure hydrogen feasible but also can result in a zero-carbon production process [3,4].
Water electrolyzers produce high-purity hydrogen, which can be used for power generation, ammonia synthesis, metal and steel production, and transportation [4,5,6,7]. They can be classified based on their operating temperature into two categories: high-temperature electrolyzers, such as solid oxide electrolysis cells (SOECs), which typically operate between 600 °C and 850 °C [8,9], and low temperatures ones, such as alkaline electrolyzers (AWEs) [10,11], anion exchange membrane water electrolyzers (AEMWEs) [12,13], and proton exchange membrane water electrolyzers (PEMWEs) [14,15].
PEMWEs have gained significant attention compared to other low-temperature electrolysis technologies, due to their high efficiency, fast response time, and ability to operate at high current densities. Additionally, PEMWEs produce hydrogen with very high purity; however, they require the use of noble metals such as platinum and iridium as electrocatalysts. Anion exchange membrane water electrolyzers (AEMWEs), on the other hand, are considered a promising alternative due to the potential use of less expensive catalysts, such as transition metal oxides (e.g., Ni, Fe, Co) [16].
Water electrolyzers are complex systems with various internal processes, such as electrochemical reactions, water and gas transport, and membrane hydration, which are difficult to investigate experimentally. In this context, developing models is considered a handy tool for studying, simulating, optimizing performance, and predicting the phenomena occurring within these systems. The complexity and type of model developed depend on the specific application requirements.
Over the last decades, a variety of models have been developed to describe PEMWEs by adopting different approaches, ranging from data-based modeling [17,18,19], describing the overall performances based on experimental data, to physically-based ones [20,21,22,23], which rely on mathematical modeling.
Choi et al. [24] proposed a simplified mathematical model of PEM water electrolysis based on mass balances, transport phenomena, and electrochemical kinetics to relate the applied voltage to the current density. In their model, diffusion overvoltages were considered negligible, as they assumed there were no mass transport limitations. They then compared the simulated results with experimental data, in which they achieved a voltage of 2.1 V at 80 °C with a current density of 1 A/cm2 using Pt as the anode catalyst.
In another study, Marangio et al. [22] evaluated a high-pressure PEM water electrolyzer prototype manufactured by Giner Inc. (Boston, MA, USA) by developing and experimentally validating a detailed electrochemical model that predicts polarization curves based on thermodynamic and overvoltage analyses. In this work, they modeled the open-circuit voltage, representing the condition under which the cell operates reversibly; the activation overvoltage, accounting for the kinetics of the charge transfer reaction using the Butler–Volmer equation; the diffusion overvoltage, estimated using the Nernst equation while considering mass transport limitations, particularly at high current densities; and the ohmic overvoltage, which reflects resistance losses within the cell components.
Ma et al. [25] developed a computational fluid dynamics (CFD) model of a PEM water electrolyzer using ANSYS/Fluent, which integrated multi-scale electrochemical, thermal-fluid, and species transport simulations.
Tawalbeh et al. [26] developed a model based on an artificial neural network (ANN), and they implemented the Levenberg–Marquardt backpropagation (LMBP) algorithm to train the model using over 450 data points related to the PEM water electrolysis (PEMWE) to predict the hydrogen production rate (HPR). The performance of the ANN model was evaluated using key metrics, including mean squared error (MSE), coefficient of determination (R2), and mean absolute error (MAE).
In this study, a physically-based, discrete dynamic mathematical model of a proton exchange membrane water electrolyzer (PEMWE) is developed in MATLAB/Simulink R2024a, built on the equations described in [22,27]. This model considers three primary electrical variables—current, voltage, and power—which enables the analysis of the electrolyzer’s dynamic behavior and allows the simulation of various inputs that can be applied using a potentiostat during experimental tests. It incorporates key thermodynamic and operational variables such as temperature, pressure, and inlet/outlet flow rates, providing a comprehensive understanding of the electrolyzer’s performance. A sensitivity analysis is conducted in order to identify the influence of each operating variable on the cell’s performance.
The chemical–physical and electrochemical parameters affecting the performance of the cell are also investigated, and the most influential ones are identified through sensitivity analysis. These parameters are then estimated using optimization techniques that minimize the Sum of Squared Errors (SSE) between the model output and the experimental results.
To support the development and validation of the model, the authors designed and built a dedicated test bench for single-cell PEM electrolyzers with active areas ranging from 5 to 25 cm2. Specifically, a 5 cm2 PEMWE cell was tested at various temperatures (40, 60, and 80 °C) and flow rates (3, 6, 9, and 12 mL/min). Polarization curves obtained under these conditions were used to estimate the most influential parameters inside the dynamic model.
A distinctive aspect of this work is the sensitivity analysis performed to examine the influence of both the operating conditions and the electrochemical parameters, as well as the exploration of correlations between electrochemical parameters and temperature, an important relationship that is often overlooked or not explicitly discussed in the existing literature.

2. Materials and Methods
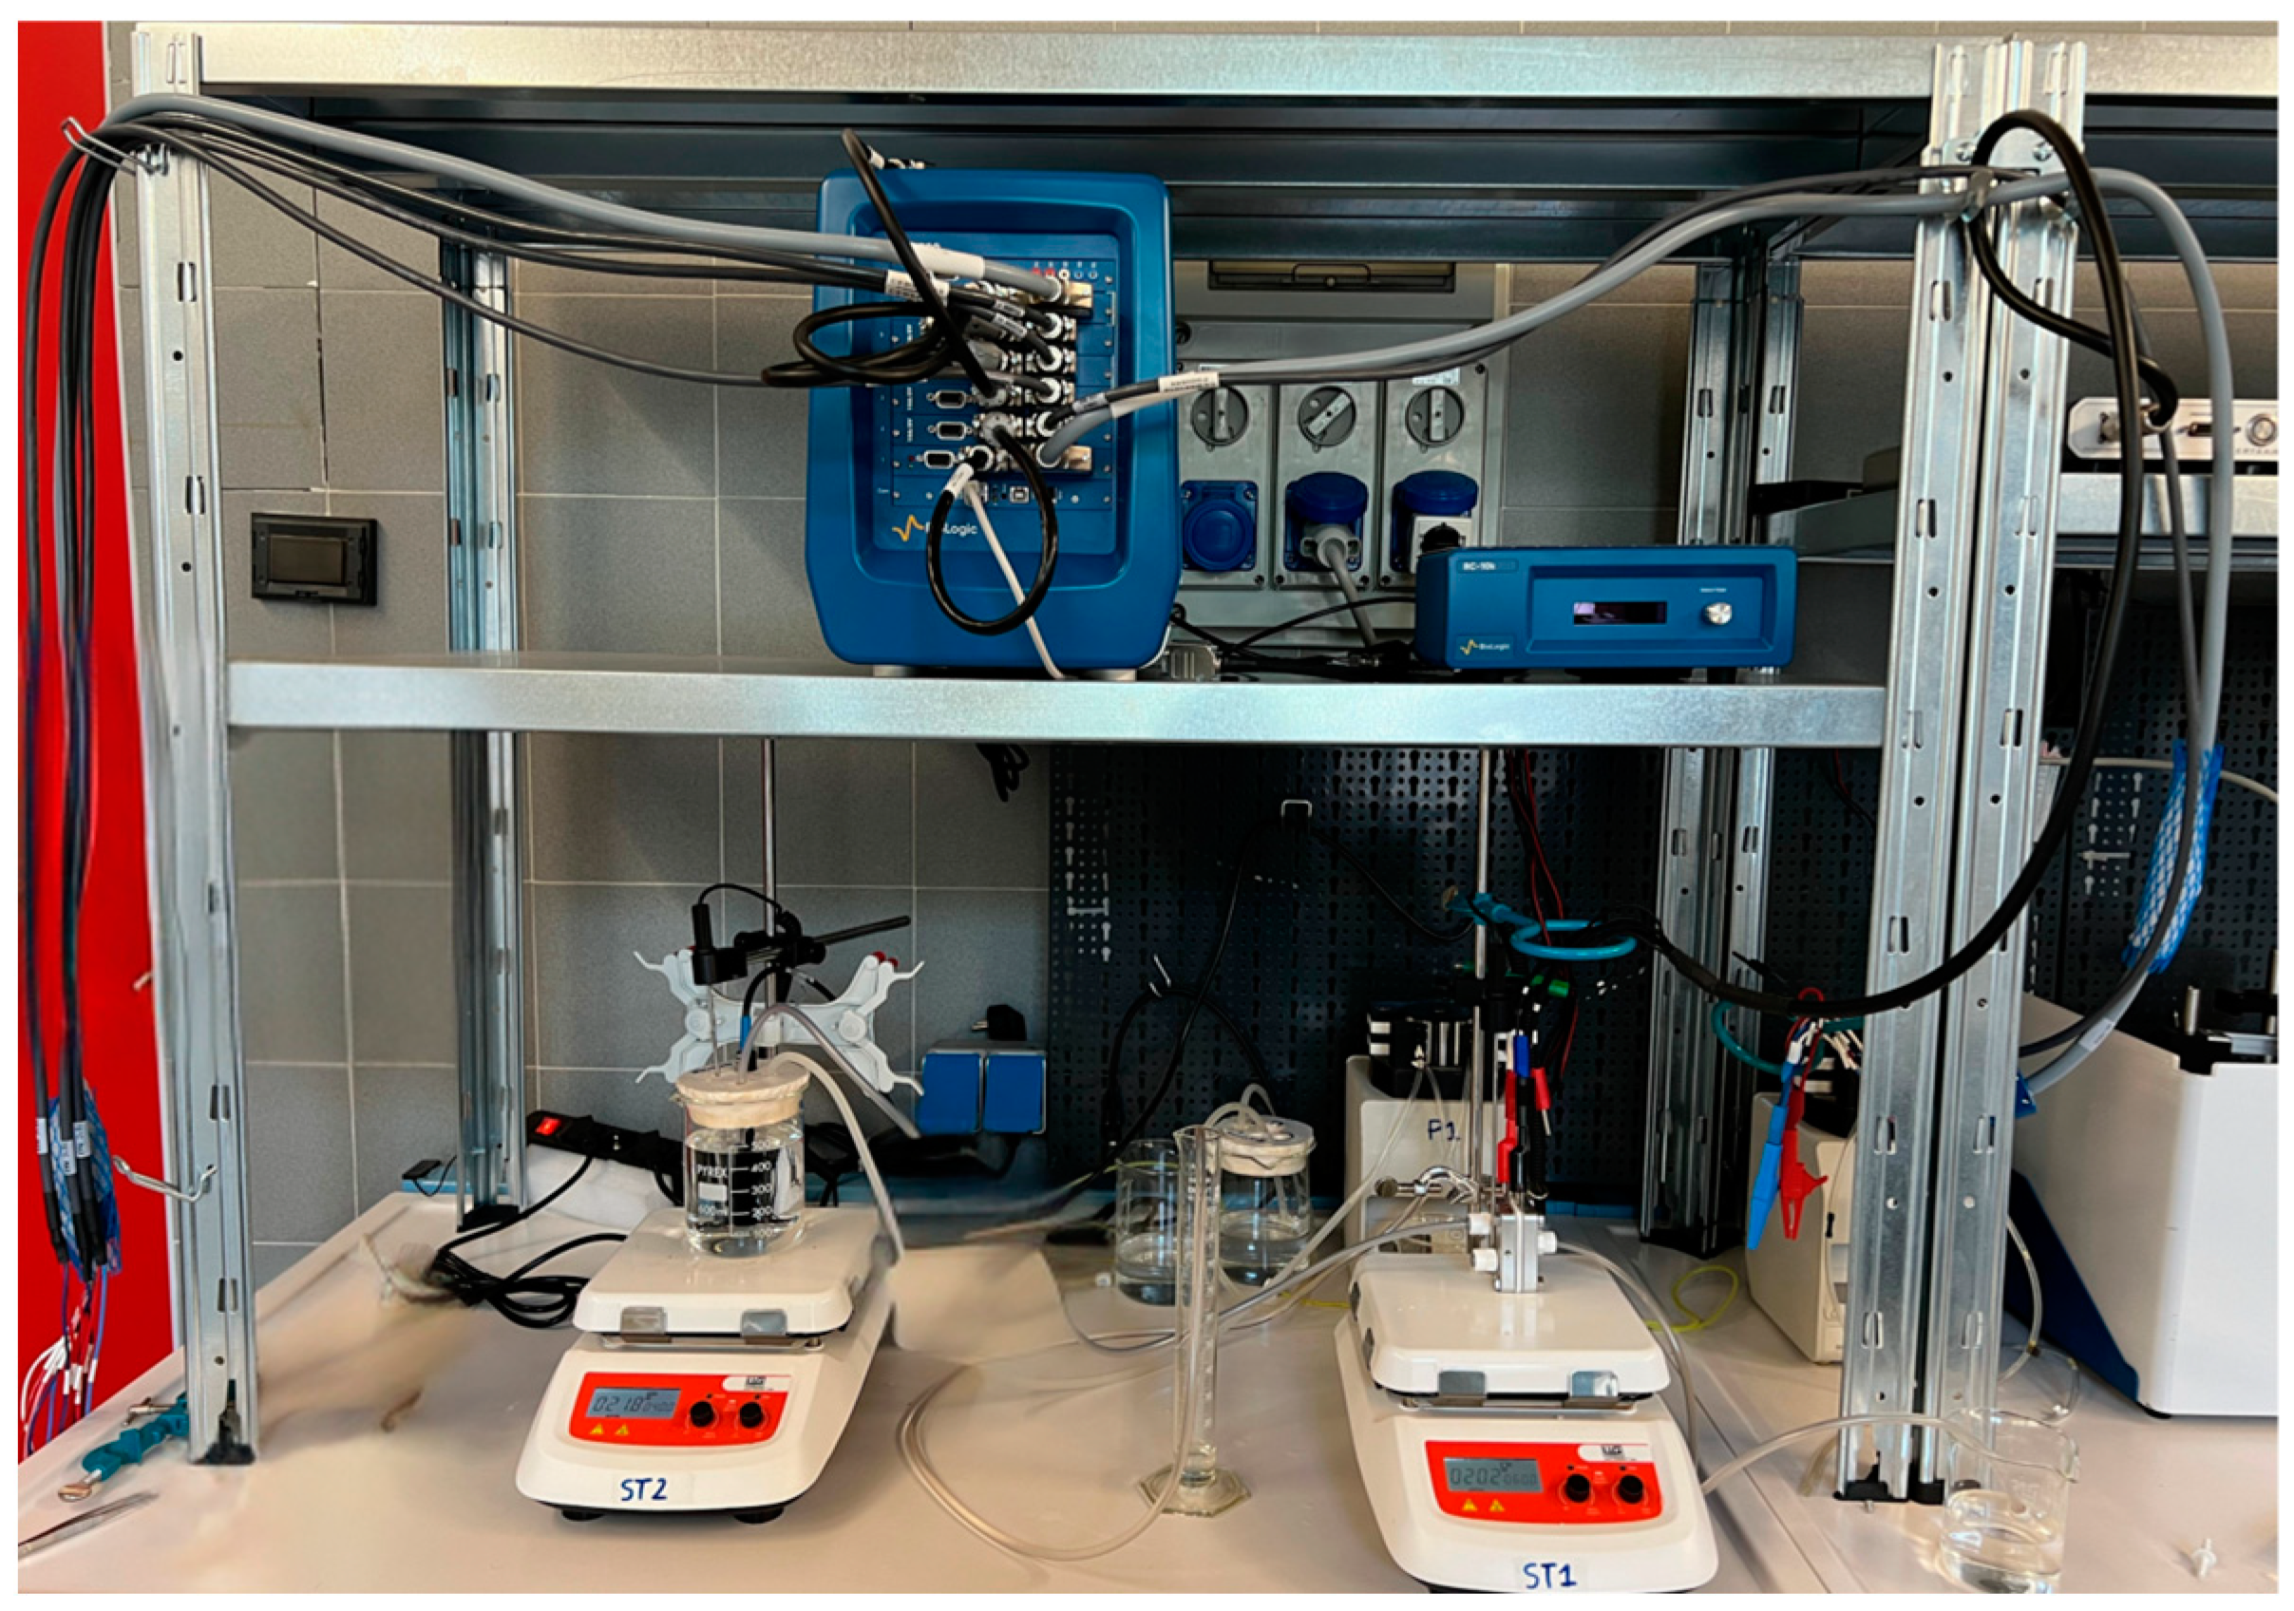
2.1. Test Bench

The test bench is equipped with an IVIUM Vertex 10A potentiostat workstation (Ivium Technologies B.V., Eindhoven, The Netherlands), a Biologic VSP-300 (Biologic Science Instruments, Grenoble, France), a commercially available 5 cm2 PEM water electrolyzer (SUNRISEETECH, Xi’an, China), two Gilson Minipuls 3 peristaltic pumps (Gilson Inc., Middleton, WI, USA), and two hot plates (Lab Logistic Group, LLG, Meckenheim, Germany) (Figure 1).
A data acquisition system, on the MATLAB/Simulink platform and using both open SW/HW (Arduino 1) and commercial B&C process controllers pH 7685.010 and C 7685 (B&C Electronics, Carnate, Italy), allows for the online collection, filtering, and recording of the following operating variables: flow rates, temperature, pH, and conductivity of the feeding solution, as well as the temperature of the hot plates and cell backplates. The flow rate input to the PEMWE and the temperature of the cell can be controlled.

2.2. Testing Protocols

To compare and validate the proposed model with experimental data, electrochemical analyses were conducted on a proton exchange membrane water electrolyzer (PEMWE).
Deionized water was pumped into the PEMWE at different inlet flow rates and temperatures, and various electrochemical techniques were carried out, including Linear Sweep Voltammetry (LSV), Cyclic Voltammetry (CV), and Chronopotentiometry (CP). Electrochemical Impedance Spectroscopy (EIS) was conducted at the beginning of the test to extract specific cell characteristics.
At each chosen operating temperature (40, 60, and 80 °C), four polarization curves were taken by changing the inlet flow rate (3, 6, 9, and 12 mL/min). These curves were measured over a voltage range of 0 to 1.8 V, corresponding to a current density range from 0 to 1.2 A·cm−2, which is the maximum current density recommended by the manufacturer. The resulting curves were used for parameter estimation with the proposed model.
A Chronopotentiometry (CP) test was conducted as a galvanostatic method to analyze the potential response of the PEMWE under a constant current density of 1 A/cm2. Additionally, EIS was performed at 1.5 A with 20 mV perturbation over a frequency range from 100 kHz to 100 mHz, using 10 measurement points per decade.
The experimental tests reported in this study were carried out on a PEMWE cell that had already undergone many Accelerated Stress Tests (ASTs) and durability tests, in order to verify if a theoretical model can still be applied to a real, previously operated PEMWE.

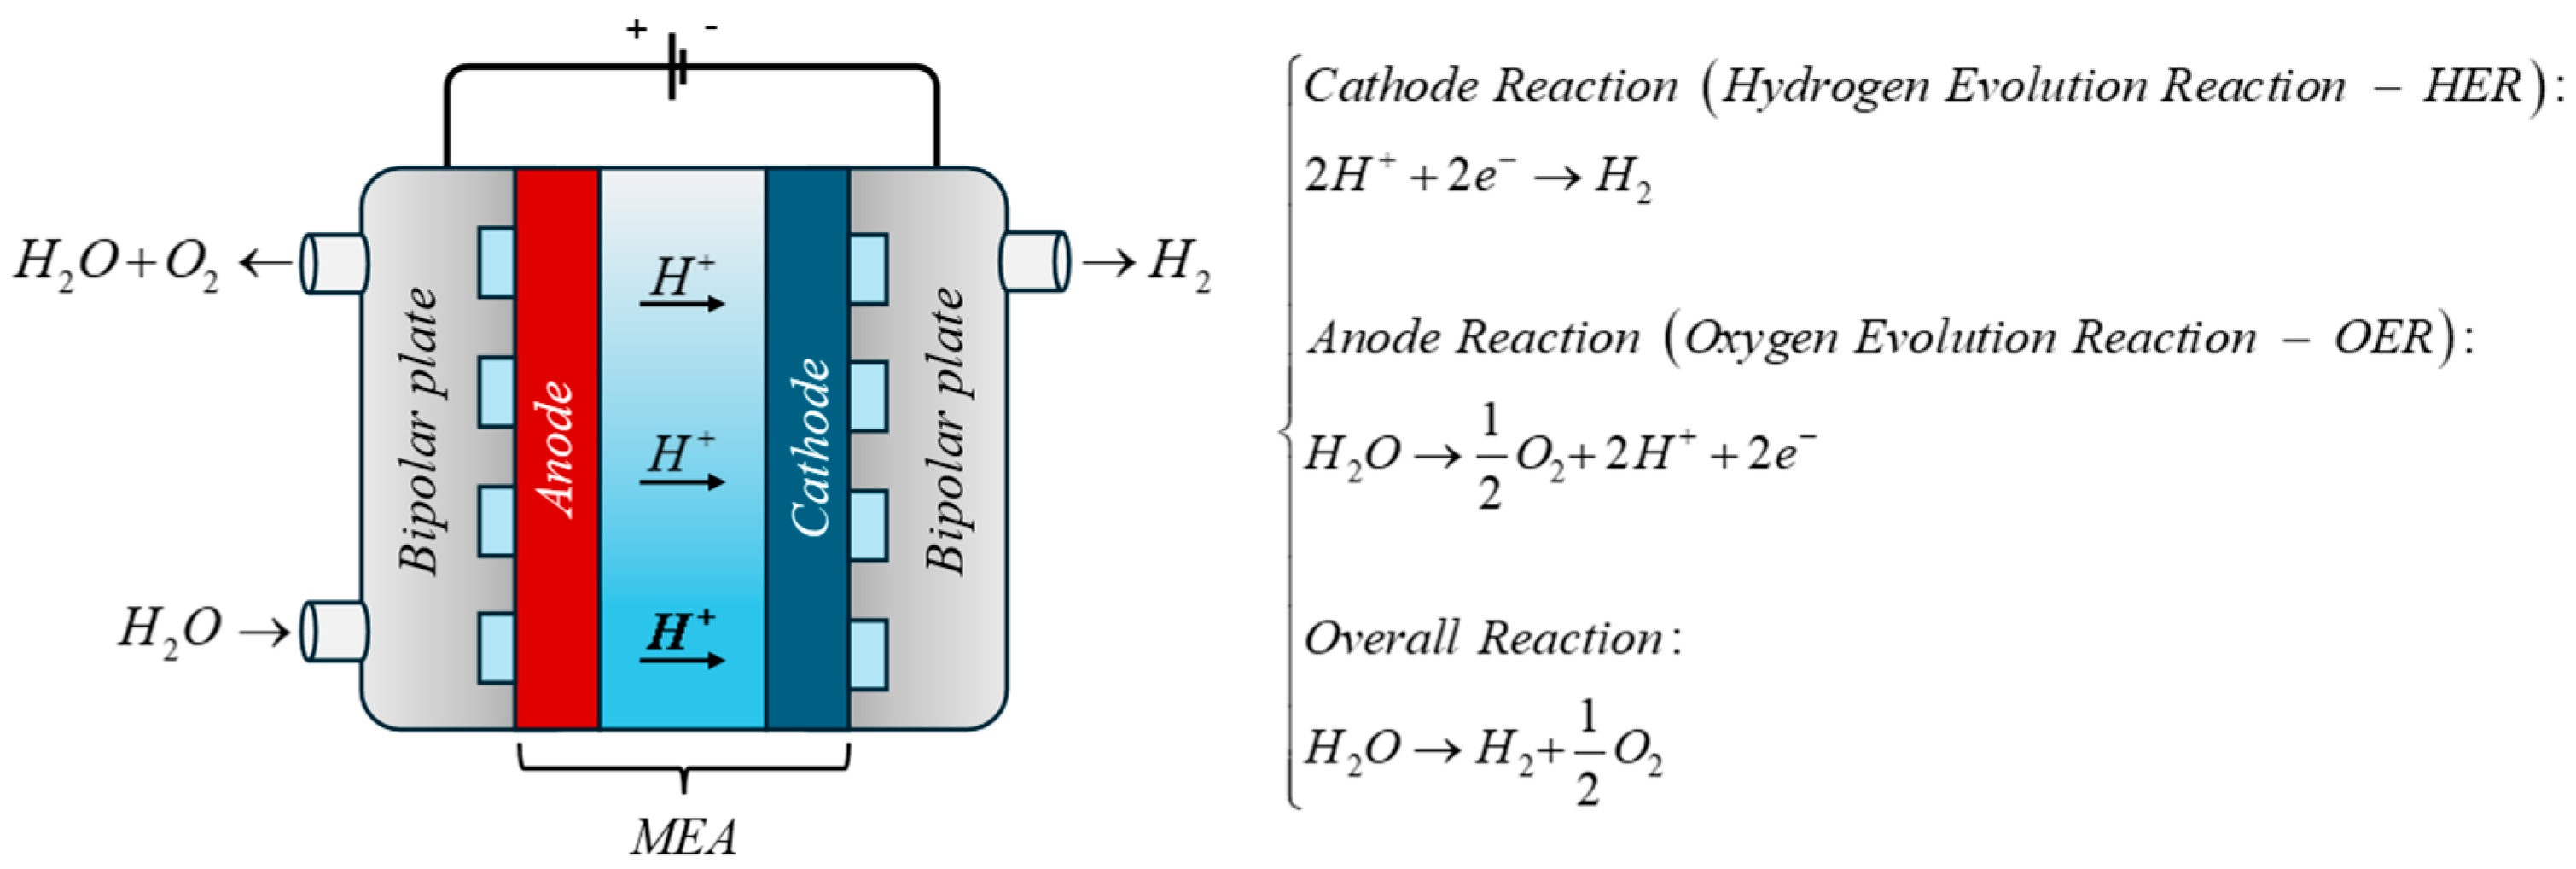
3. Mathematical Model

3.1. Model Description

A simplified scheme of the PEMWE configuration and reactions is shown in Figure 2; however, the processes occurring inside the cell are much more complex. Therefore, the model developed in this work considers mass transport, kinetic effects from electrochemical reactions, ohmic overvoltage, charge transport, and overvoltage caused by pressure differences. It also includes the main single-cell components, such as the anode diffusion layer, anode catalyst layer, cathode diffusion layer, cathode catalyst layer, proton exchange membrane, and electrolyte.
The cell voltage of an electrolyzer often exceeds the open-circuit voltage, which corresponds to the thermodynamic equilibrium potential. To accurately represent this behavior, the model defines the total cell voltage, Ucell, as the sum of the reversible voltage, Urev, defined as the minimum voltage required for chemical reactions to occur, and the main irreversible overvoltages, Uirr. These overvoltages can be mathematically expressed as the sum of the activation overpotential ηact [V], the ohmic overvoltage ηohm [V], which accounts for losses proportional to the current, and the diffusion overvoltage ηdiff [V], which represents the overpotential due to mass transport phenomena that limit performance at high current densities.
U c e l l = U r e v + U i r r
U i r r = η a c t + η o h m + η d i f f

3.1.1. Open-Circuit Voltage

Water splitting is the electrochemical reaction that occurs inside the electrolyzer. To make it happen, it is necessary to provide electricity between the anode and the cathode. Urev can be expressed using the Nernst equation (Equation (3)), as pressure and temperature conditions may deviate from standard values.
U r e v = U r e v 0 + R T c e l l n F ln p H 2 p O 2 1 2 a H 2 O
In this equation, R is the universal gas constant [8.3145 Jmol−1K−1], T is the operating temperature of the cell [K], n refers to the number of electrons involved in the electrochemical reaction, and F is the Faraday’s constant [96,485 C mol−1]. p H 2 and p O 2 are the partial pressures of hydrogen and oxygen, respectively, while a H 2 O is the activity of water between the electrode and the membrane [17]. U r e v 0 is the reversible cell voltage, i.e., the energy required to drive the hydrolysis in reversible and standard conditions, and it can be expressed as a function of the temperature through the following empirical equation [28]:
U r e v 0 = 1.229 0.9 · 10 3 ( T 298 )

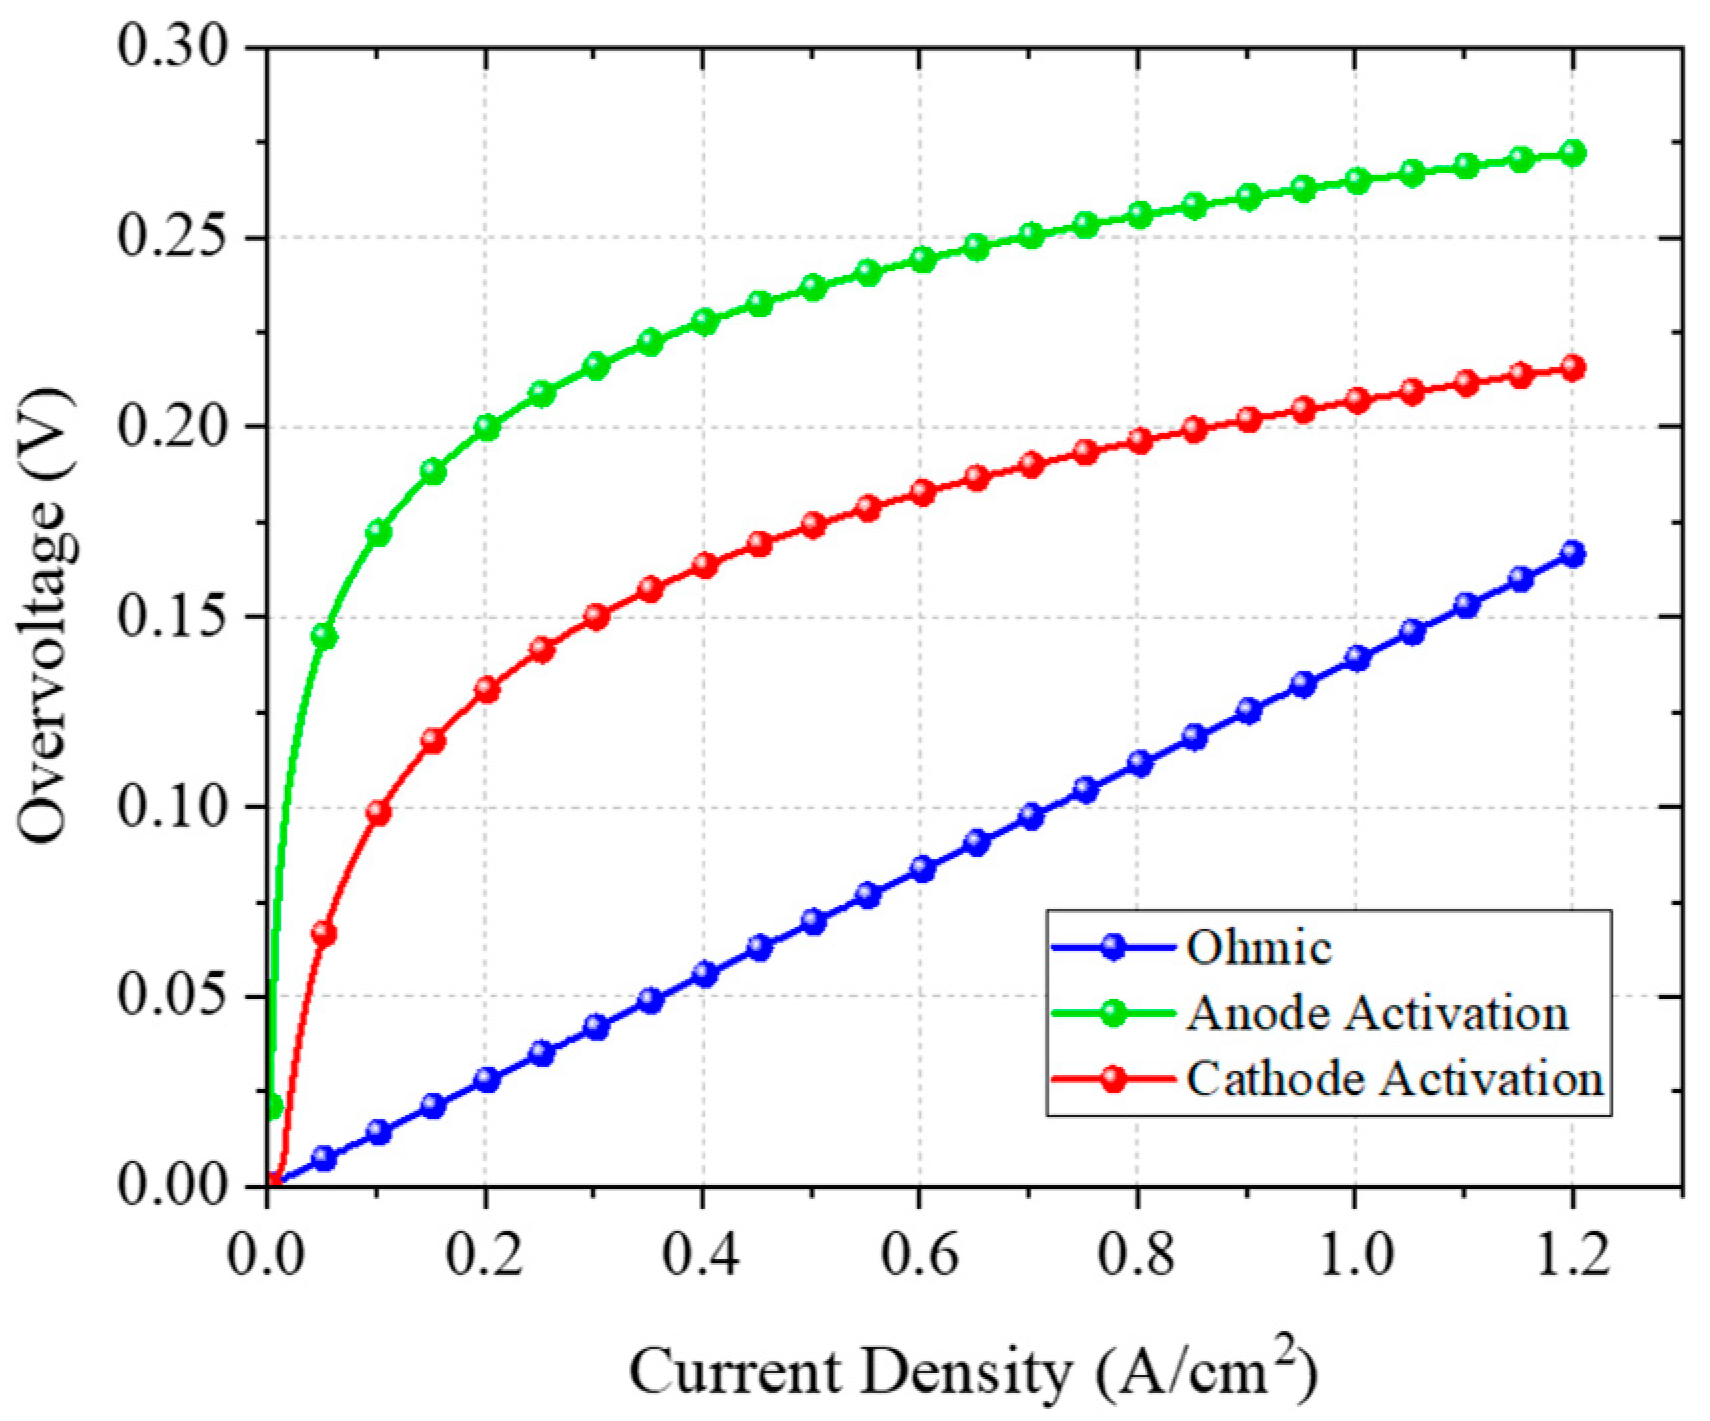
3.1.2. Activation Overvoltage

The activation overvoltage reflects the kinetic behavior of the electrochemical reaction, indicating how quickly it proceeds at the electrode surface.
Since the reaction rate depends on different factors such as temperature, the type of electrodes, and the composition of the electrolyte solution [29], the transfer of electrons between the electrode and the electrolyte can lead to the dissipation of a portion of the applied voltage. This loss is defined as the activation overvoltage, and it can be expressed through the Butler–Volmer equation, which relates the overpotential to the current density on both the anode and cathode sides [17,30].
For the anodic and cathodic reactions, the current densities can be expressed as:
j a = j 0 , a e 1 α a n F η a R T e α a n F η a R T
j c = j 0 , c e 1 α c n F η c R T e α c n F η c R T
The total activation overpotential is given by:
η a c t = R T α a F arcsinh j a 2 j 0 , a + R T α c F arcsinh j c 2 j 0 , c
Here, ja and jc are the anode and cathode operating current densities [A·cm−2], j0,a and j0,c refer to the exchange current density [A·cm−2]. These values are so important in determining the activation overvoltage and are strongly influenced by factors such as electrode porosity, type of catalyst, concentration, geometry, and operating temperature [17]. The symbols αa and αc represent the anodic and cathodic charge transfer coefficients, which are difficult to evaluate experimentally, as they depend on many chemical–physical factors, including the catalyst’s chemistry, the crystal structure, morphology, porosity, and the loading of the catalyst. In addition, they are also affected by the coating process, the type of binder used, and the porosity of the gas diffusion layer on which the catalyst is deposited to fabricate the electrode.

3.1.3. Ohmic Overvoltage

The ohmic overvoltage is due to the resistive losses within the electrolyzer components, including the bipolar plates, current collectors, and electrode surfaces [23]. It can be expressed using Ohm’s law, since it is considered linearly proportional to the current [21].
V o h m = ( r e l e + r m e m + r p l ) i
where rele, rmem, and rpl represent the resistances of the electrolyte, membrane, and bipolar plates, respectively, all expressed in ohms [Ω], and i is the current flowing through the system, expressed in amperes [A]. Resistance due to the electrolyte and the membrane, respectively, can be defined as:
r e l e = 1 σ d a m S a + d c m S c
r m e m = δ m A m σ m
Here, dam and dcm are the distances between the membrane and the anode, and the membrane and the cathode, respectively [m]. Furthermore, Sa and Sc are the anode and cathode cross-section areas [m2]. σ represents the ionic conductivity of the electrolyte [S·cm−1], while δm is the membrane thickness [m], and Am is the total area of the membrane [m2]. Finally, σm is the membrane conductivity, expressed in siemens per meter [S·m−1].

3.1.4. Diffusion Overvoltage

The reactant concentration changes along with the electrochemical reaction. The diffusion overvoltage occurs when the current reaches a value at which gas bubbles accumulate on the membrane surface, slowing down the reaction [31]. Fick’s law can be used to describe mass transport for binary mixtures as a diffusion phenomenon. In the context of water electrolysis, it is reasonable to assume an O2/H2O mixture at the anode and an H2/H2O mixture at the cathode.
The flux J can be determined by the following expression:
J = D e f f ( C i x )
Here, Deff is the overall effective diffusion coefficient, accounting for the presence of different phases within the mixture. Additionally, C i is the molar concentration of the species i , and x is the direction of diffusion.
As mentioned, diffusion overvoltage is due to the accumulation of reaction products on the catalyst surface as a result of the applied current. To describe this overvoltage, it is necessary to combine Fick’s law with the Nernst equation, resulting in the following expression:
η d i f f = V 1 V 0 = ( E 0 + R T n F l n C 1 ) ( E 0 + R T n F l n C 0 ) = R T n F l n C 1 C 0
where n is the number of electrons participating in the reaction, and C0 is the reference concentration in the working condition. The overall overpotential due to diffusion can be expressed as the sum of the diffusion overvoltage at the anode and the cathode side.
η d i f f = R T 4 F l n C O 2 , m e m C O 2 , m e m , 0 + R T 2 F l n C H 2 , m e m C H 2 , m e m , 0
Here, C O 2 , m e m and C H 2 , m e m are the oxygen and hydrogen concentrations at the membrane–electrode interface, respectively. Based on the mass flow balance within the electrolyzer [22], the molar concentrations of O2 and H2 at the membrane–electrode interface can be written as a function of the concentrations in the channels:
C O 2 ,   m e m = C O 2 , c h + δ e l , a n n O 2 D e f f ,   a n
C H 2 ,   m e m = C H 2 , c h + δ e l , c a t n H 2 D e f f ,   c a t
In these expressions, δel,an and δel,cat are the electrode thicknesses of the anode and cathode, respectively, expressed in centimeters [cm]. Additionally, Deff,an and Deff,cat represent the effective binary diffusion coefficients [m2·s−1], which can be described as a function of the porosity of the electrodes, critical temperatures, and pressures of a mixture A/B as explained by Marangio et al. [22]. Moreover, n O 2 and n H 2 are the specific molar flows of oxygen and hydrogen [mol·s−1·m−2].
The molar concentration of each gas species in the channel can be calculated using the ideal gas law and the molar fractions:
C H 2 , c h = P c a t x H 2 , c h R T c a t
C O 2 , c h = P a n x O 2 , c h R T a n
The mathematical model developed in this section is used for the discrete dynamic simulation of a PEMWE in MATLAB/Simulink. By incorporating electrochemical equations, mass transport phenomena, and thermodynamic relationships, the model can simulate the key physical processes that govern electrolyzer performance under a variety of operating conditions.

3.2. Model Identification

In this work, cell voltage is considered as the main output of the model, and it depends on several internal parameters and input variables, such as current, anode and cathode operating pressure and temperature, inlet and outlet flow rates, and the cell’s active area.
Since the cell has a small active surface area of only 5 cm2, it was assumed that the anode and cathode have the same temperature during the experimental operation. Moreover, since the cell is thermally isolated and temperature is a controlled variable, the cell temperature is considered equal to the water temperature, i.e., T = TW. Additionally, the operating pressure was assumed to be atmospheric on both the anode and cathode sides, i.e., P = PA = PC.
Table 1 and Table 2 list the operating variables and the internal parameters of the cell model, respectively. The intervals reported in Table 1 refer to the operating conditions tested experimentally.
As shown in Table 2, some of the parameters must be estimated; however, the number of unknown or partially unknown parameters is quite high. As a result, their reliable estimation using classical parameter estimation procedures, such as maximum likelihood, is impractical, even if multiple experimental tests are carried out on the single cell and CV curves are recorded at various currents and operating conditions. Moreover, some of the parameters listed in Table 2, such as the cathode and anode charge transfer coefficients (αA and αC), the exchange current densities (jA0 and jC0), and the electro-osmotic drug coefficient (nd), are difficult to determine experimentally.
For these reasons, a sensitivity analysis of the model output was first performed, considering the effect of the main operating variables. Subsequently, the parametric sensitivity of the model was evaluated. From the first analysis, the most influential operating variables were identified. These variables should be varied during electrochemical tests in order to obtain meaningful experimental data. From the second analysis, the electrochemical parameters affecting the model output (cell voltage) more significantly than the others were distinguished and selected for a robust estimation.

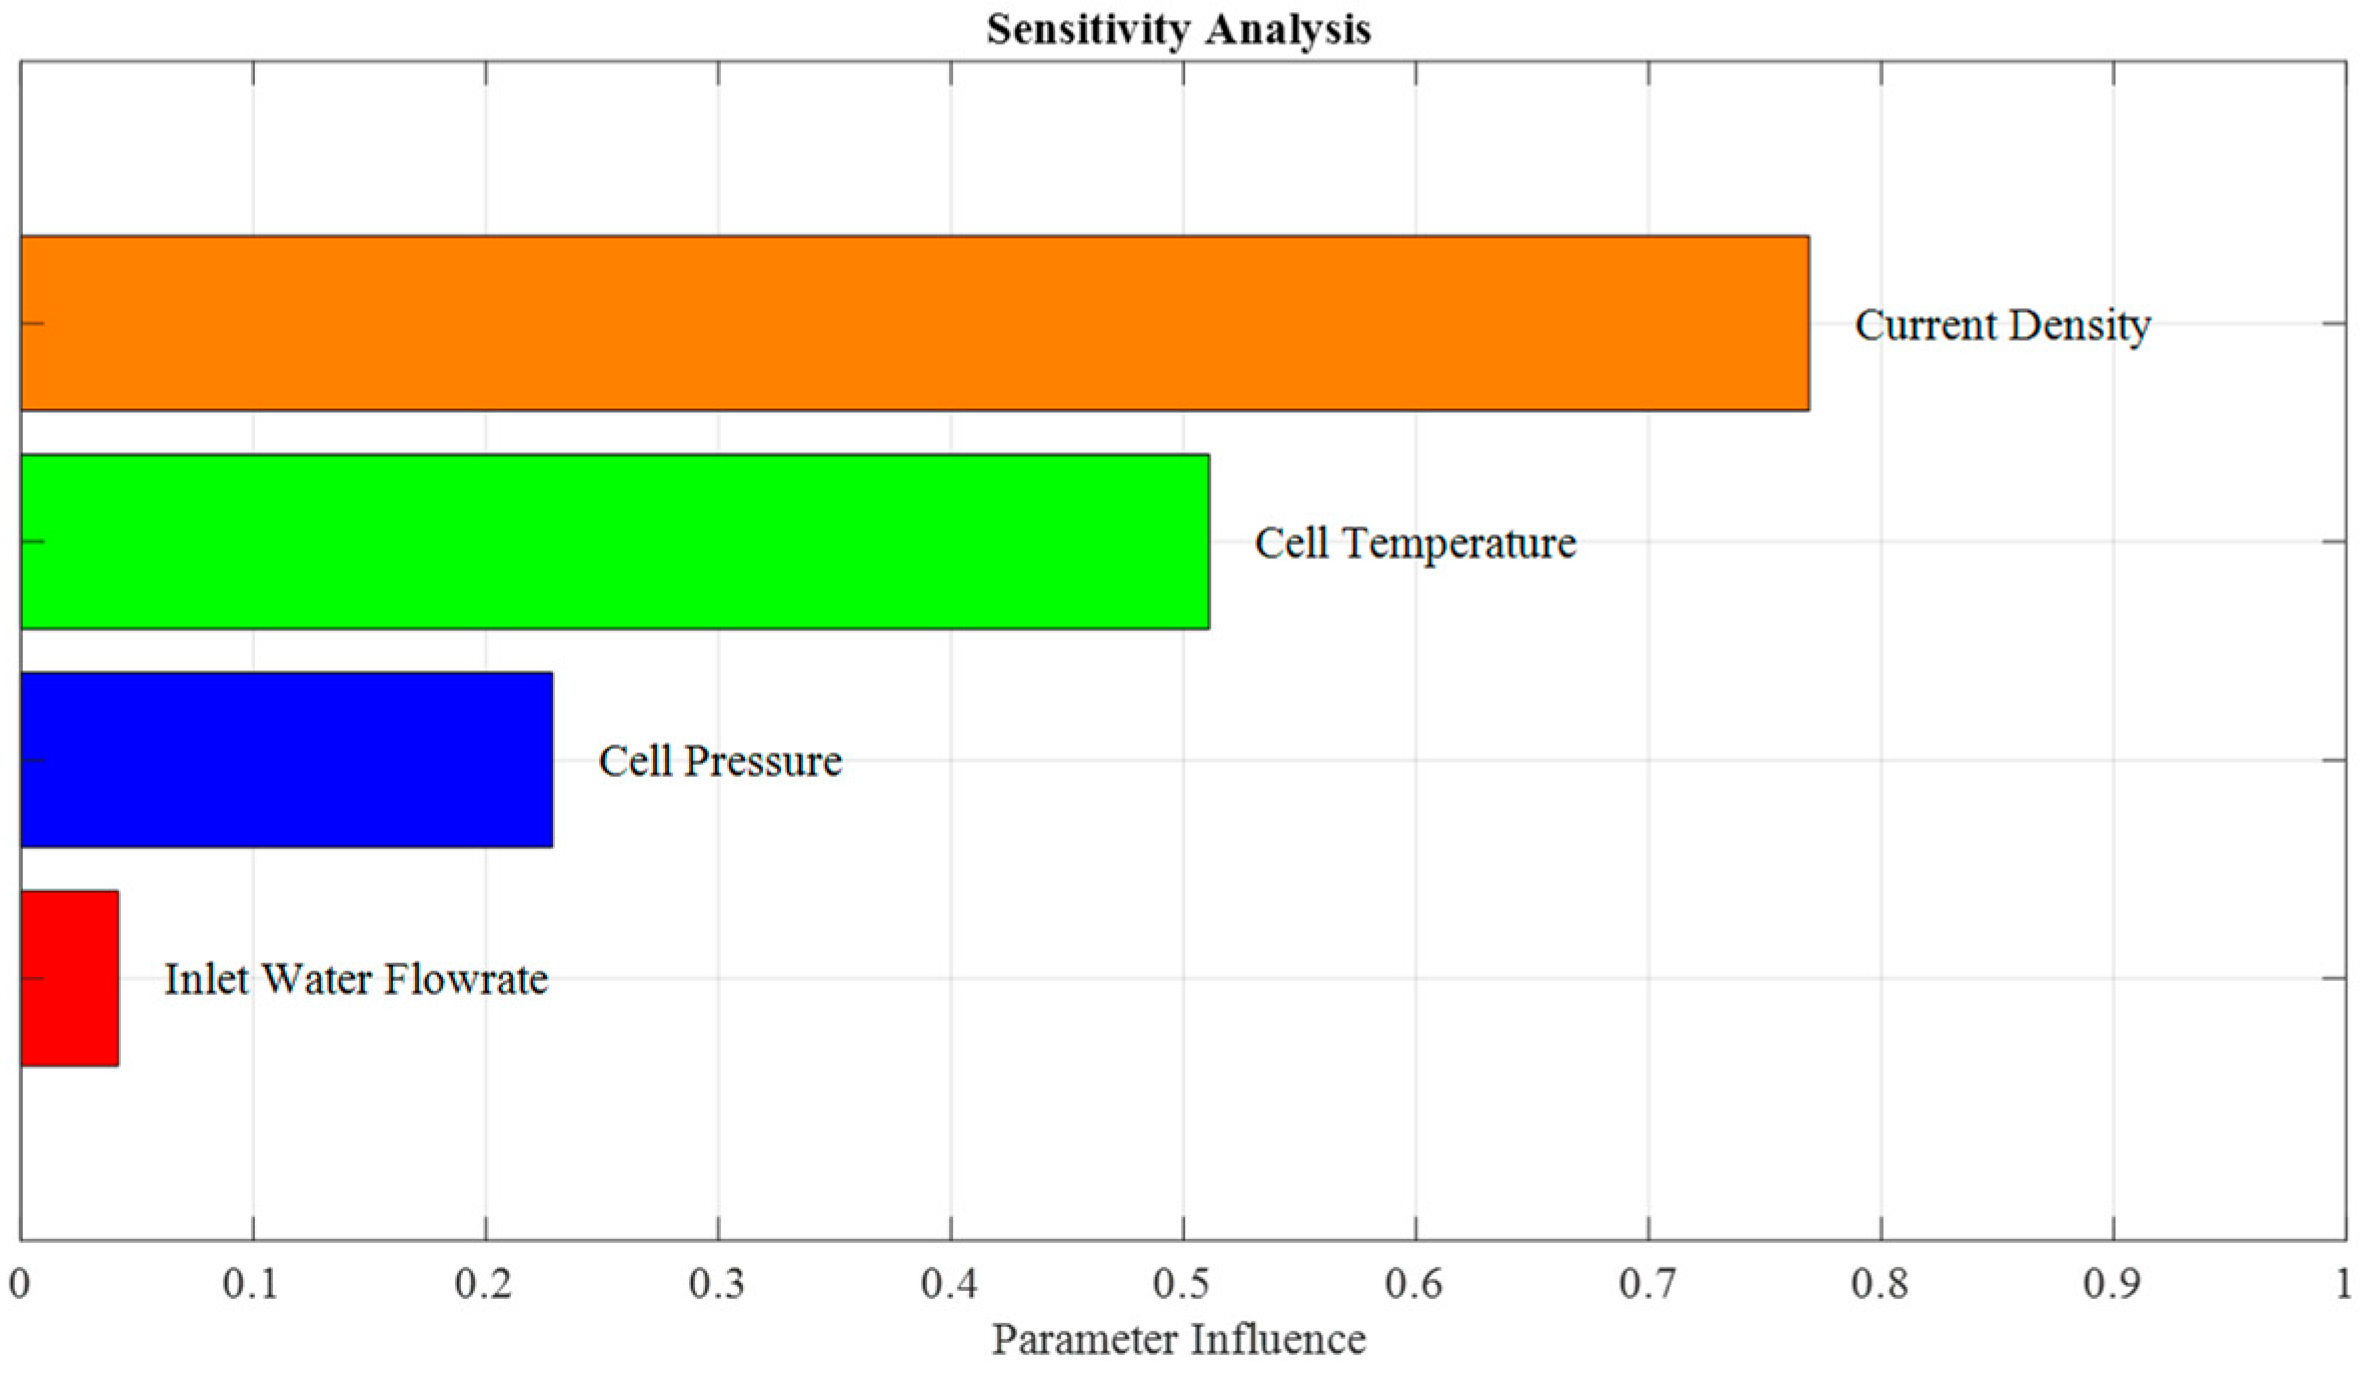
3.2.1. Sensitivity Analysis of Model Output

With reference to Table 1, the considered operating variables were cell temperature, cell pressure, inlet water flow rate, and cell current. The outlet water flow rate was not included as it was not measured during the experiments.
The Sensitivity Analysis of Model Output (SAMO) was performed using MATLAB R2024a Sensitivity Analyzer tool to investigate the influence of each operating variable on the cell voltage. To achieve this, a Gaussian distribution was applied to each operating variable to generate a set of random values for it. The adopted procedure is described as follows:
(1)
At fixed values of parameters contained in Table 2, SAMO was run by considering the cell voltage as the output of the model and operating variables as the input vector. Input values were generated using a Gaussian distribution with a 5% standard deviation around their nominal values. The input variables were then sorted based on their influence on the cell voltage.
(2)
No correlations were considered among these four variables.

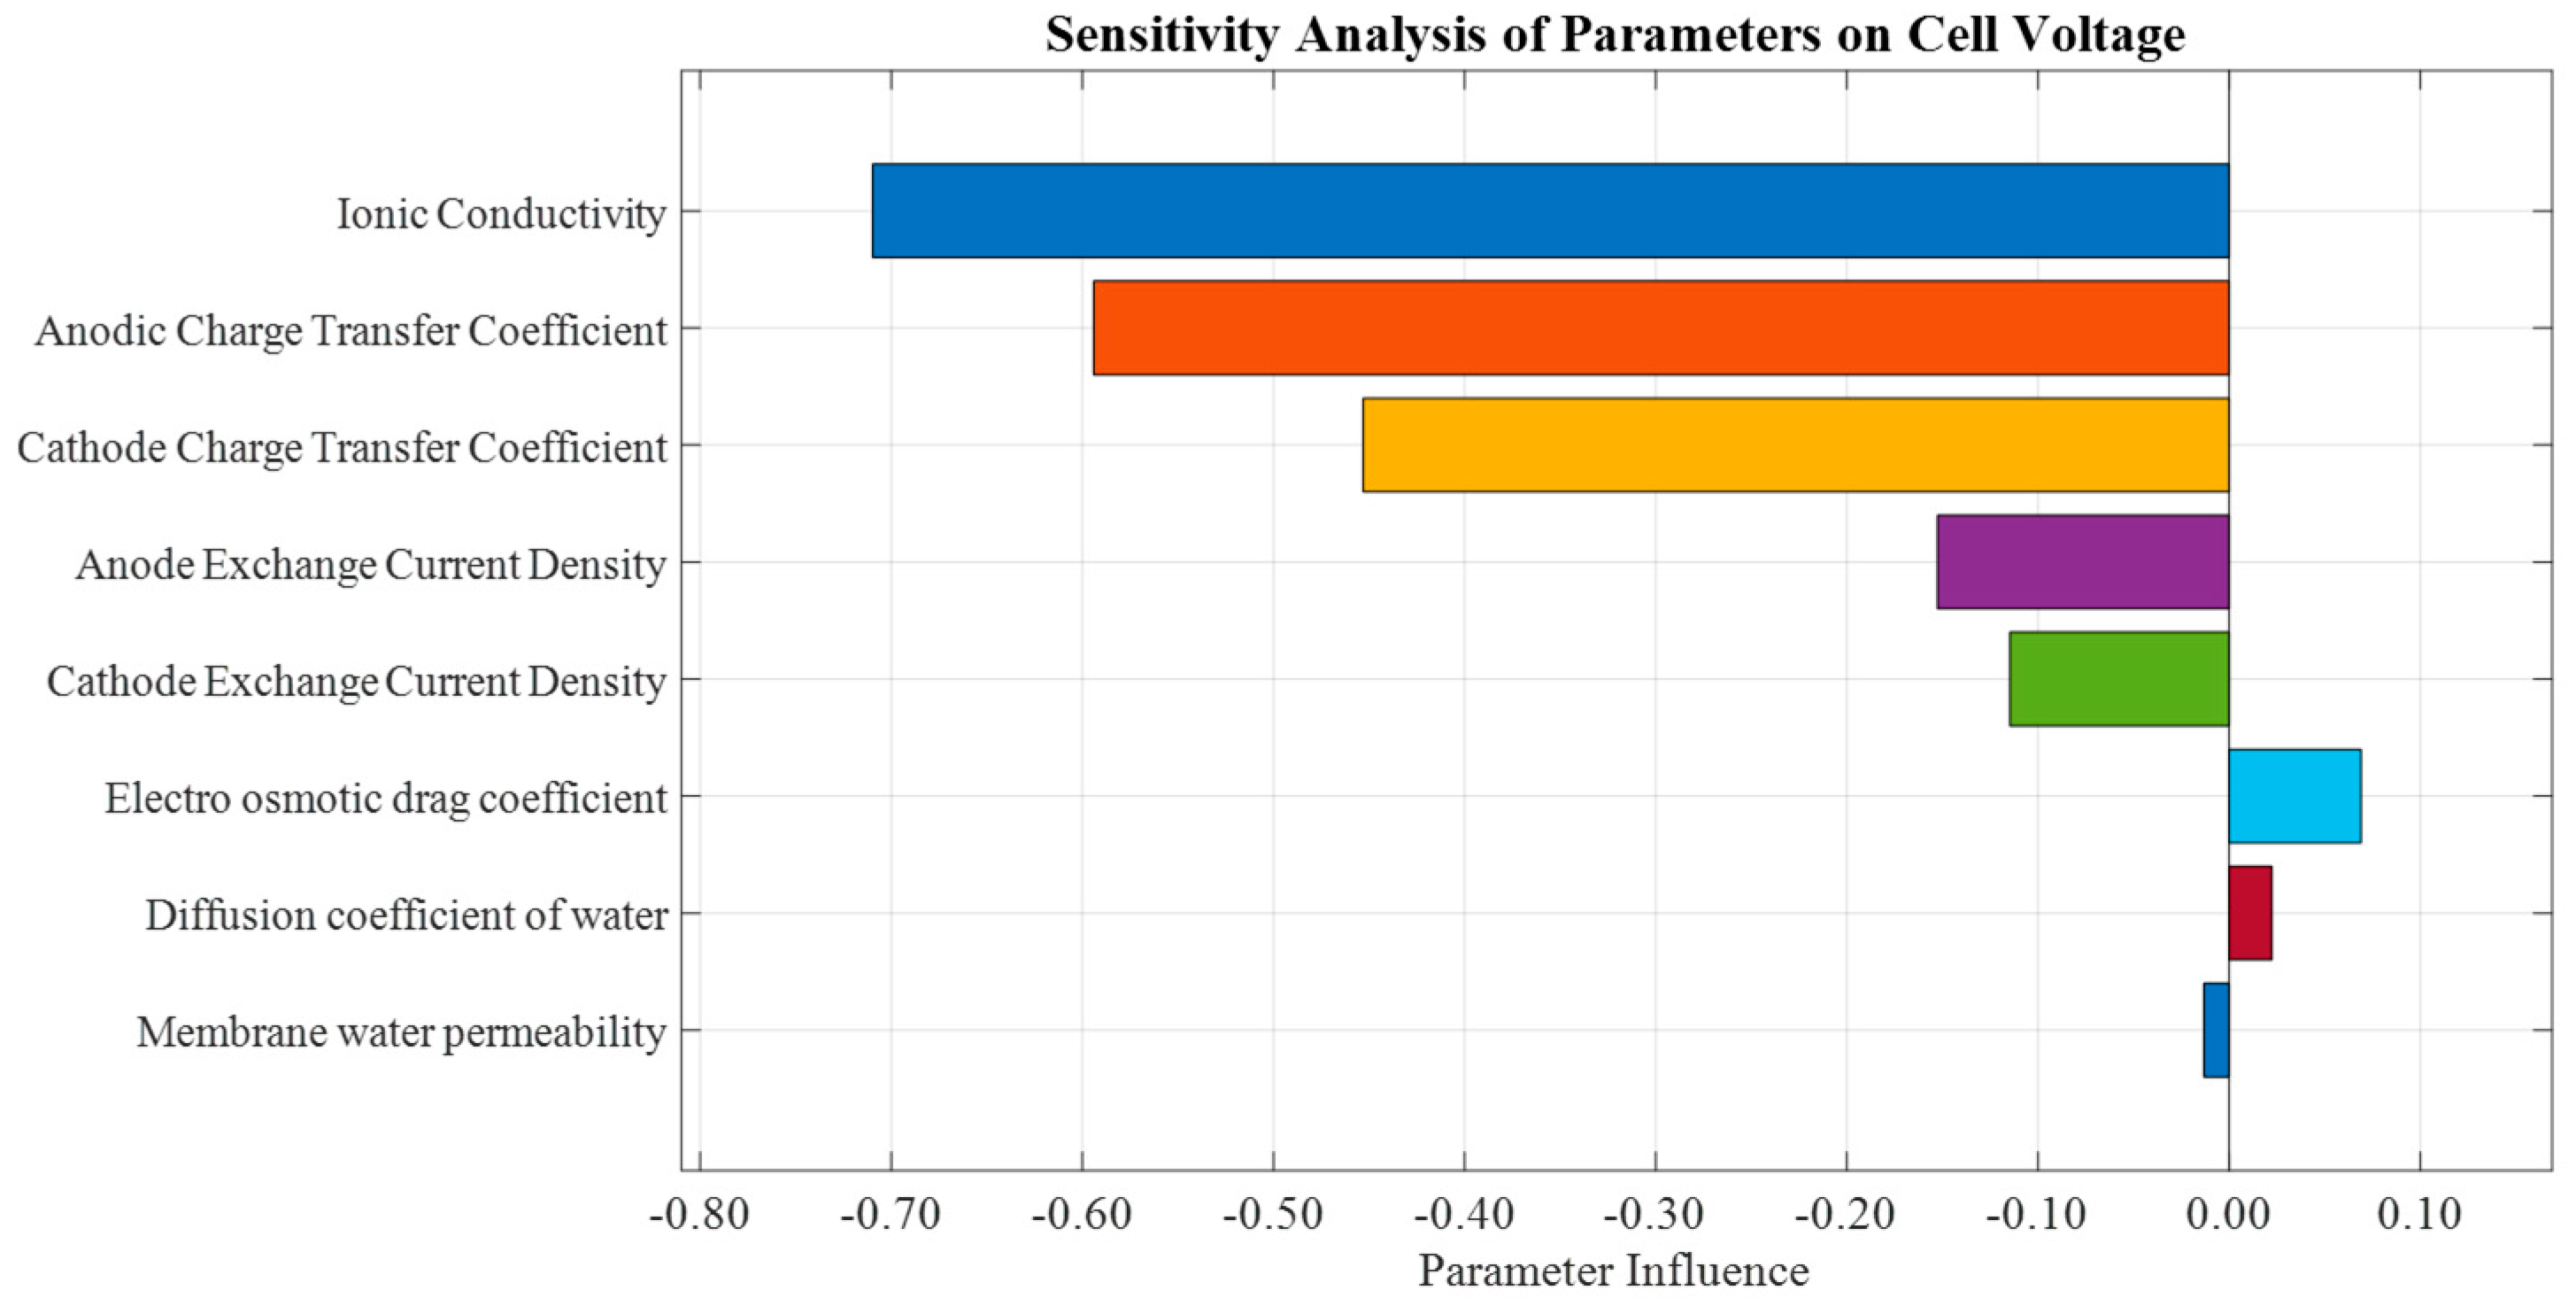
3.2.2. Parametric Sensitivity

The parametric sensitivity analysis was carried out with reference to Table 2, and taking into account the following eight parameters: cathode and anode charge transfer coefficients, ionic conductivity, cathode and anode exchange current densities, membrane water permeability, electro-osmotic drag coefficient, and diffusion coefficient of water. These are the main parameters commonly cited in the literature.
At fixed nominal values of the input variables (Table 1), Parametric Sensitivity Analysis was performed by generating random values for each parameter using a Gaussian distribution with a standard deviation of 10% around their guess values, and by considering the cell voltage as the output variable.

4. Results

4.1. Sensitivity Analysis of the Model

Figure 3 shows the results of SAMO, i.e., the correlation of each input operating variable with cell voltage, as model output.
Looking at these results, the current density and temperature of the cell are the most influential operating variables, with their weights being approximately double and triple that of cell pressure, respectively. In addition, the inlet water flow rate was found to have the least effect on the cell voltage. These findings suggest that, for designing effective experimental tests for PEMWE model identification, applied current density and temperature should be varied and thoroughly investigated. Although cell pressure is the third in the list of the most influential variables, the available setup does not allow for operating at pressures different from the atmospheric one, so the inlet water flow rate was chosen as the third influencing input variable. Subsequently, a full experimental campaign was designed at three levels of the cell temperature (40 °C, 60 °C, and 80 °C) and four levels of the inlet water flow rate (3 mL/min, 6 mL/min, 9 mL/min, and 12 mL/min).

4.2. Parametric Sensitivity of the Model

Figure 4 illustrates the sensitivity of the PEMWE performance to key electrochemical and transport parameters, ranked by their absolute impact on cell voltage. The results show that ionic conductivity has the highest influence (−0.70968), indicating that improving membrane conductivity significantly reduces ohmic losses and enhances system performance.
The Anodic Charge Transfer Coefficient (ACTC) and Cathode Charge Transfer Coefficient (CCTC) also show strong effects, with values of −0.59416 and −0.45301, respectively, highlighting the critical role of electrode kinetics in minimizing activation losses. In addition, the Anode Exchange Current Density (AECD) and Cathode Exchange Current Density (CECD) have smaller influences with respect to charge transfer coefficients.
The electro-osmotic drag coefficient has a moderate effect, emphasizing the importance of water transport in maintaining membrane hydration and proton conductivity. Other parameters, such as the water diffusion coefficient through the membrane (0.022338) and membrane water permeability (−0.013232), have minimal influence, indicating a lesser role in voltage variation under the operating conditions. These findings indicate that optimizing membrane properties and electrode kinetics should be prioritized to enhance PEM electrolyzer performance, while water transport-related parameters with lower sensitivity may have a secondary effect.

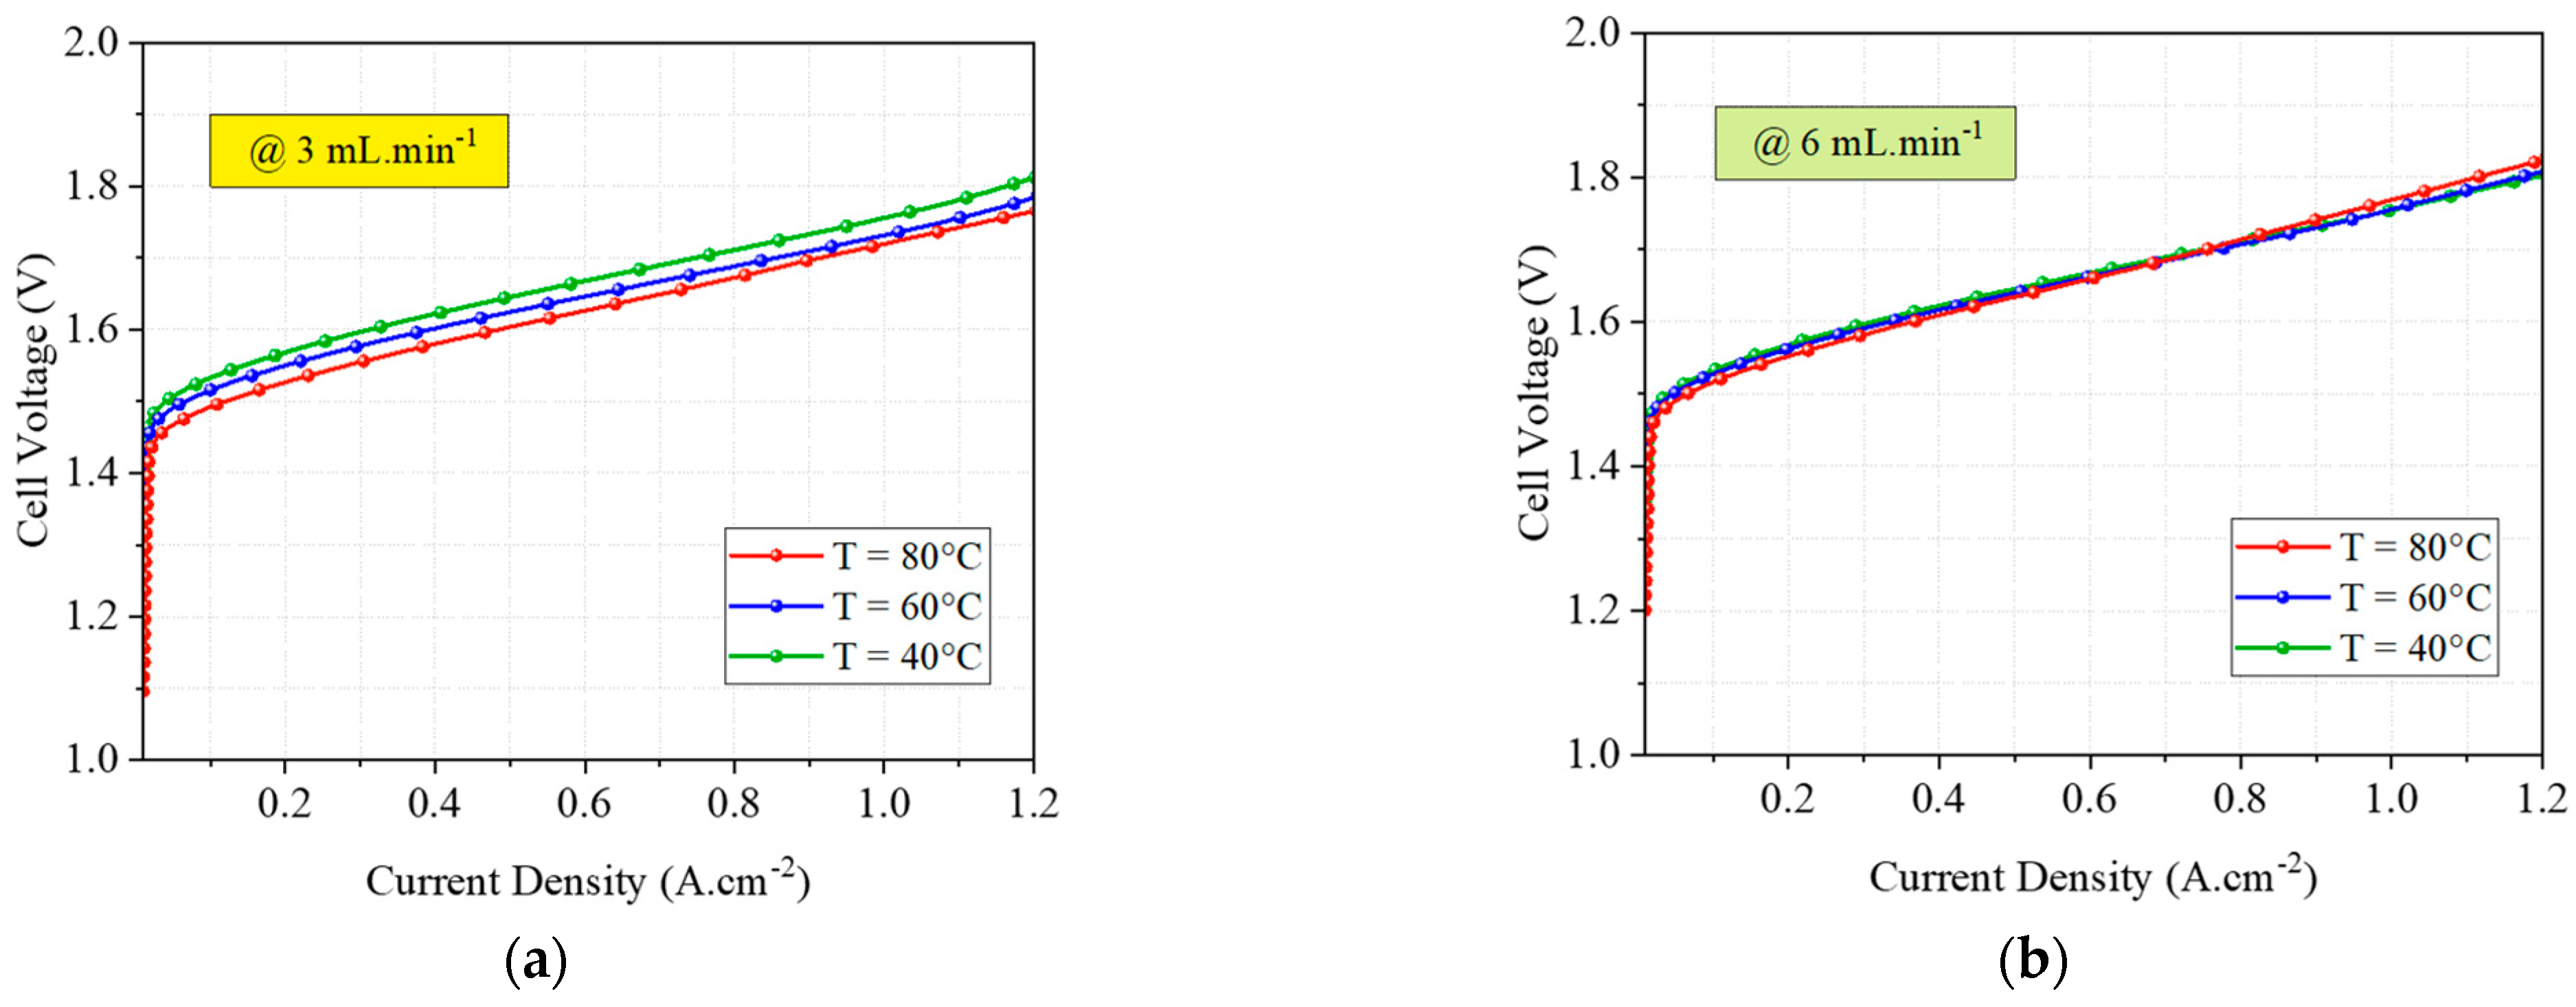
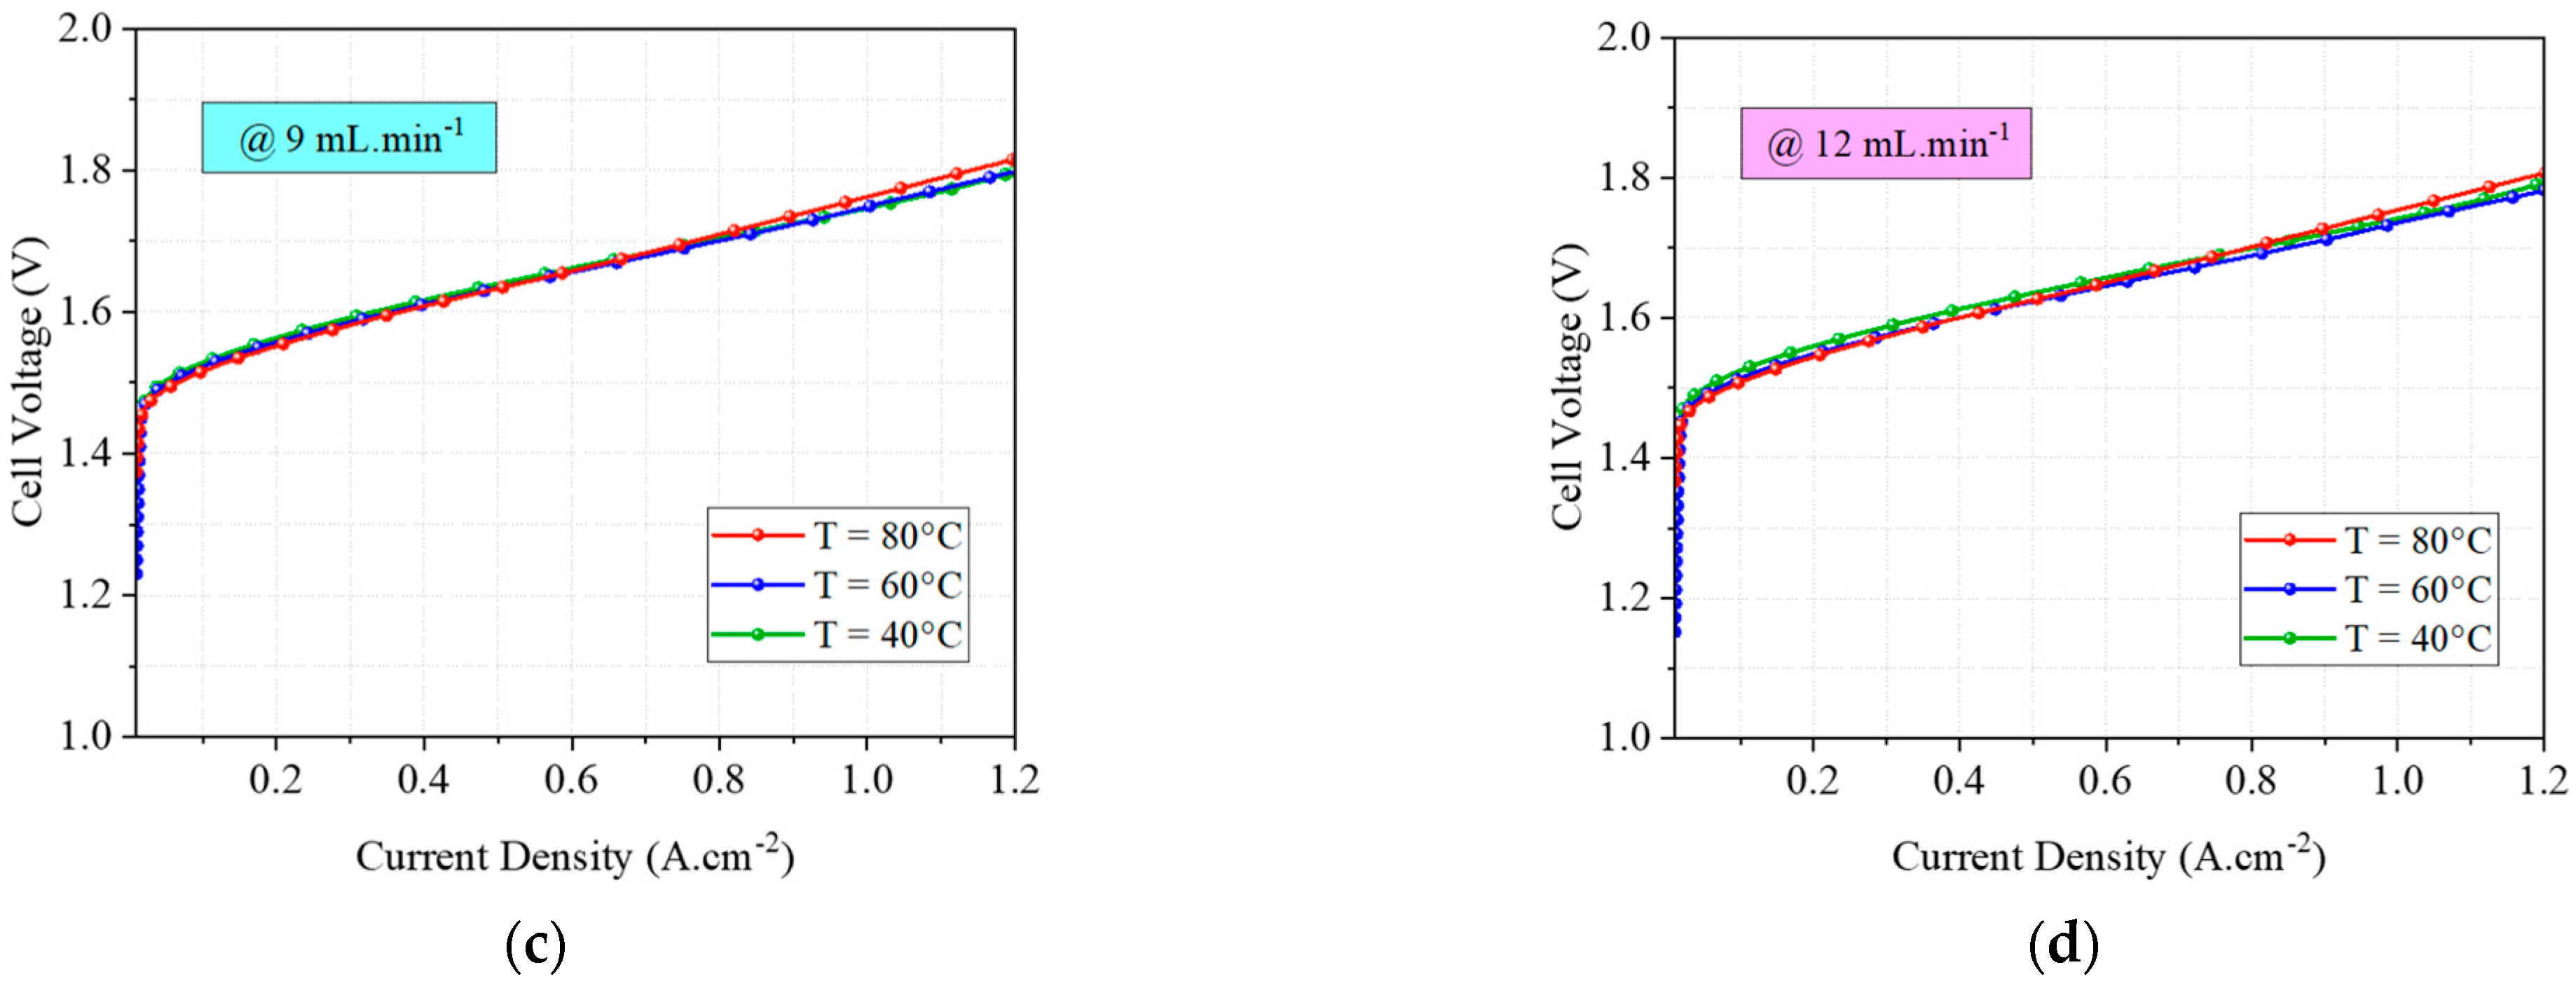
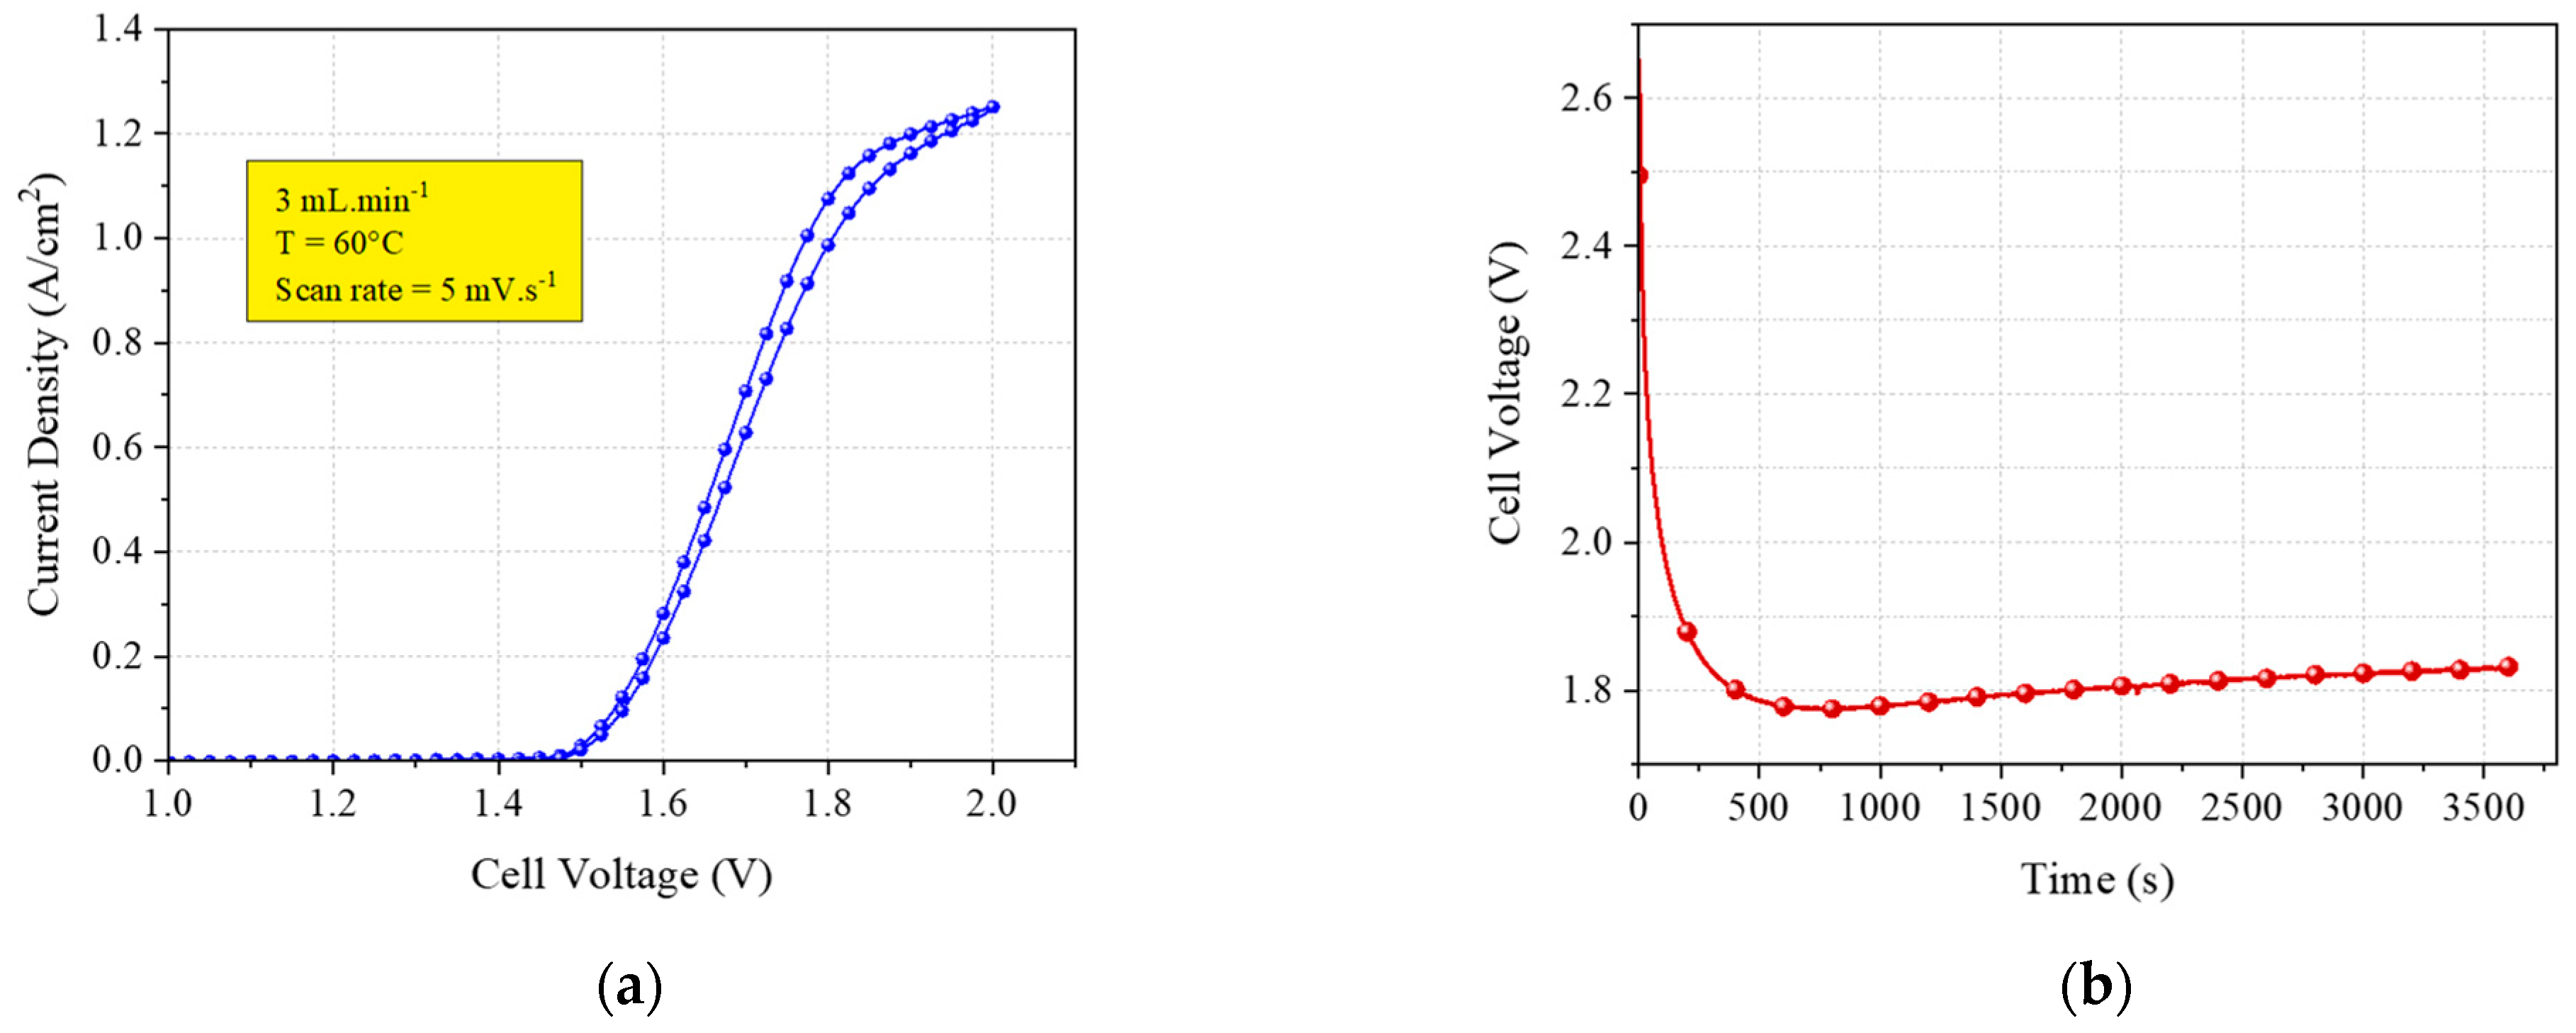
4.3. Experimental Tests

Experimental tests for model identification were carried out on a PEMWE that had already undergone many Accelerated Stress Testing (AST) and durability tests, in order to verify if the theoretical model (all the adopted equations describe ideal mechanisms) can still be used for real and already operated cells. The entire campaign was designed on the results of the Sensitivity Analysis of Model Output (SAMO) presented in Section 4.1.
Figure 5 shows polarization curves obtained at different cell temperatures and inlet water flow rates. These experimental data were collected by testing the PEMWE cell (after 100 h AST test, five start-ups/shutdowns, and 24 h durability test) at the chosen experimental conditions, i.e., different levels of cell current, cell temperature, and inlet water flow rate. It can be observed that the polarization curves do not show the classical behavior of a new cell, since even at very low current densities, a rapid increase in cell voltage is seen. Moreover, at the maximum cell current of the chosen interval, i.e., 6 A, the potential reached about 1.8 V.
As expected, Figure 5a shows that increasing cell temperature leads to a decrease in cell potential, since higher electrolyzer temperatures reduce overpotentials by enhancing reaction kinetics, improving ionic conductivity, decreasing electrolyte viscosity, lowering charge transfer resistance, and reducing the reversible cell potential, thereby improving efficiency. For instance, at a current density of 1 A/cm2 and a flow rate of 3 mL/min, the cell potential reached 1.812 V, 1.786 V, and 1.766 V at 40 °C, 60 °C, and 80 °C, respectively. However, as observed in Figure 5, at higher inlet water flow rates, cell temperature does not significantly affect the cell performance.
The Cyclic Voltammetry (CV) of the PEMWE at a flow rate of 3 mL/min, a temperature of 60 °C, and a scan rate of 5 mV/s from 1 V to 2 V is shown in Figure 6a. At 2 V, the current density reaches approximately 1.25 A/cm2, which is aligned with the results obtained from the model developed in this study.
Figure 6b presents the Chronopotentiometry at a constant current density of 1 A/cm2, with the same flow rate and temperature, conducted over a 1-h duration. As illustrated in the figure, there is an initial sharp voltage drop (related to the activation and AST test of the PEMWE at higher voltages), followed by a relatively steady state, where the voltage is primarily governed by ohmic losses, activation overpotentials, and mass transport limitations. Additionally, a gradual increase in voltage over time is observed, indicating the dynamic behavior of the cell throughout the 1-h duration, in which it became stable at the end.
Figure 7 presents the Electrochemical Impedance Spectroscopy (EIS) analysis of the cell, displaying its Nyquist plot. In the upper portion of the figure, a corresponding equivalent circuit model is illustrated. This model is commonly used to describe electrode/electrolyte interfaces and charge transfer mechanisms in electrochemical systems. By observing the equivalent circuit, different resistance components can be compared, further confirming the non-ideal behavior of the cell.
To the right of the Nyquist plot, a parameter table summarizes the fitted circuit elements. The constant phase elements (CPE1 and CPE2) are represented by the parameters Q and N, where Q indicates the magnitude of the CPE, and N represents its exponent, signifying the deviation from ideal capacitive behavior.

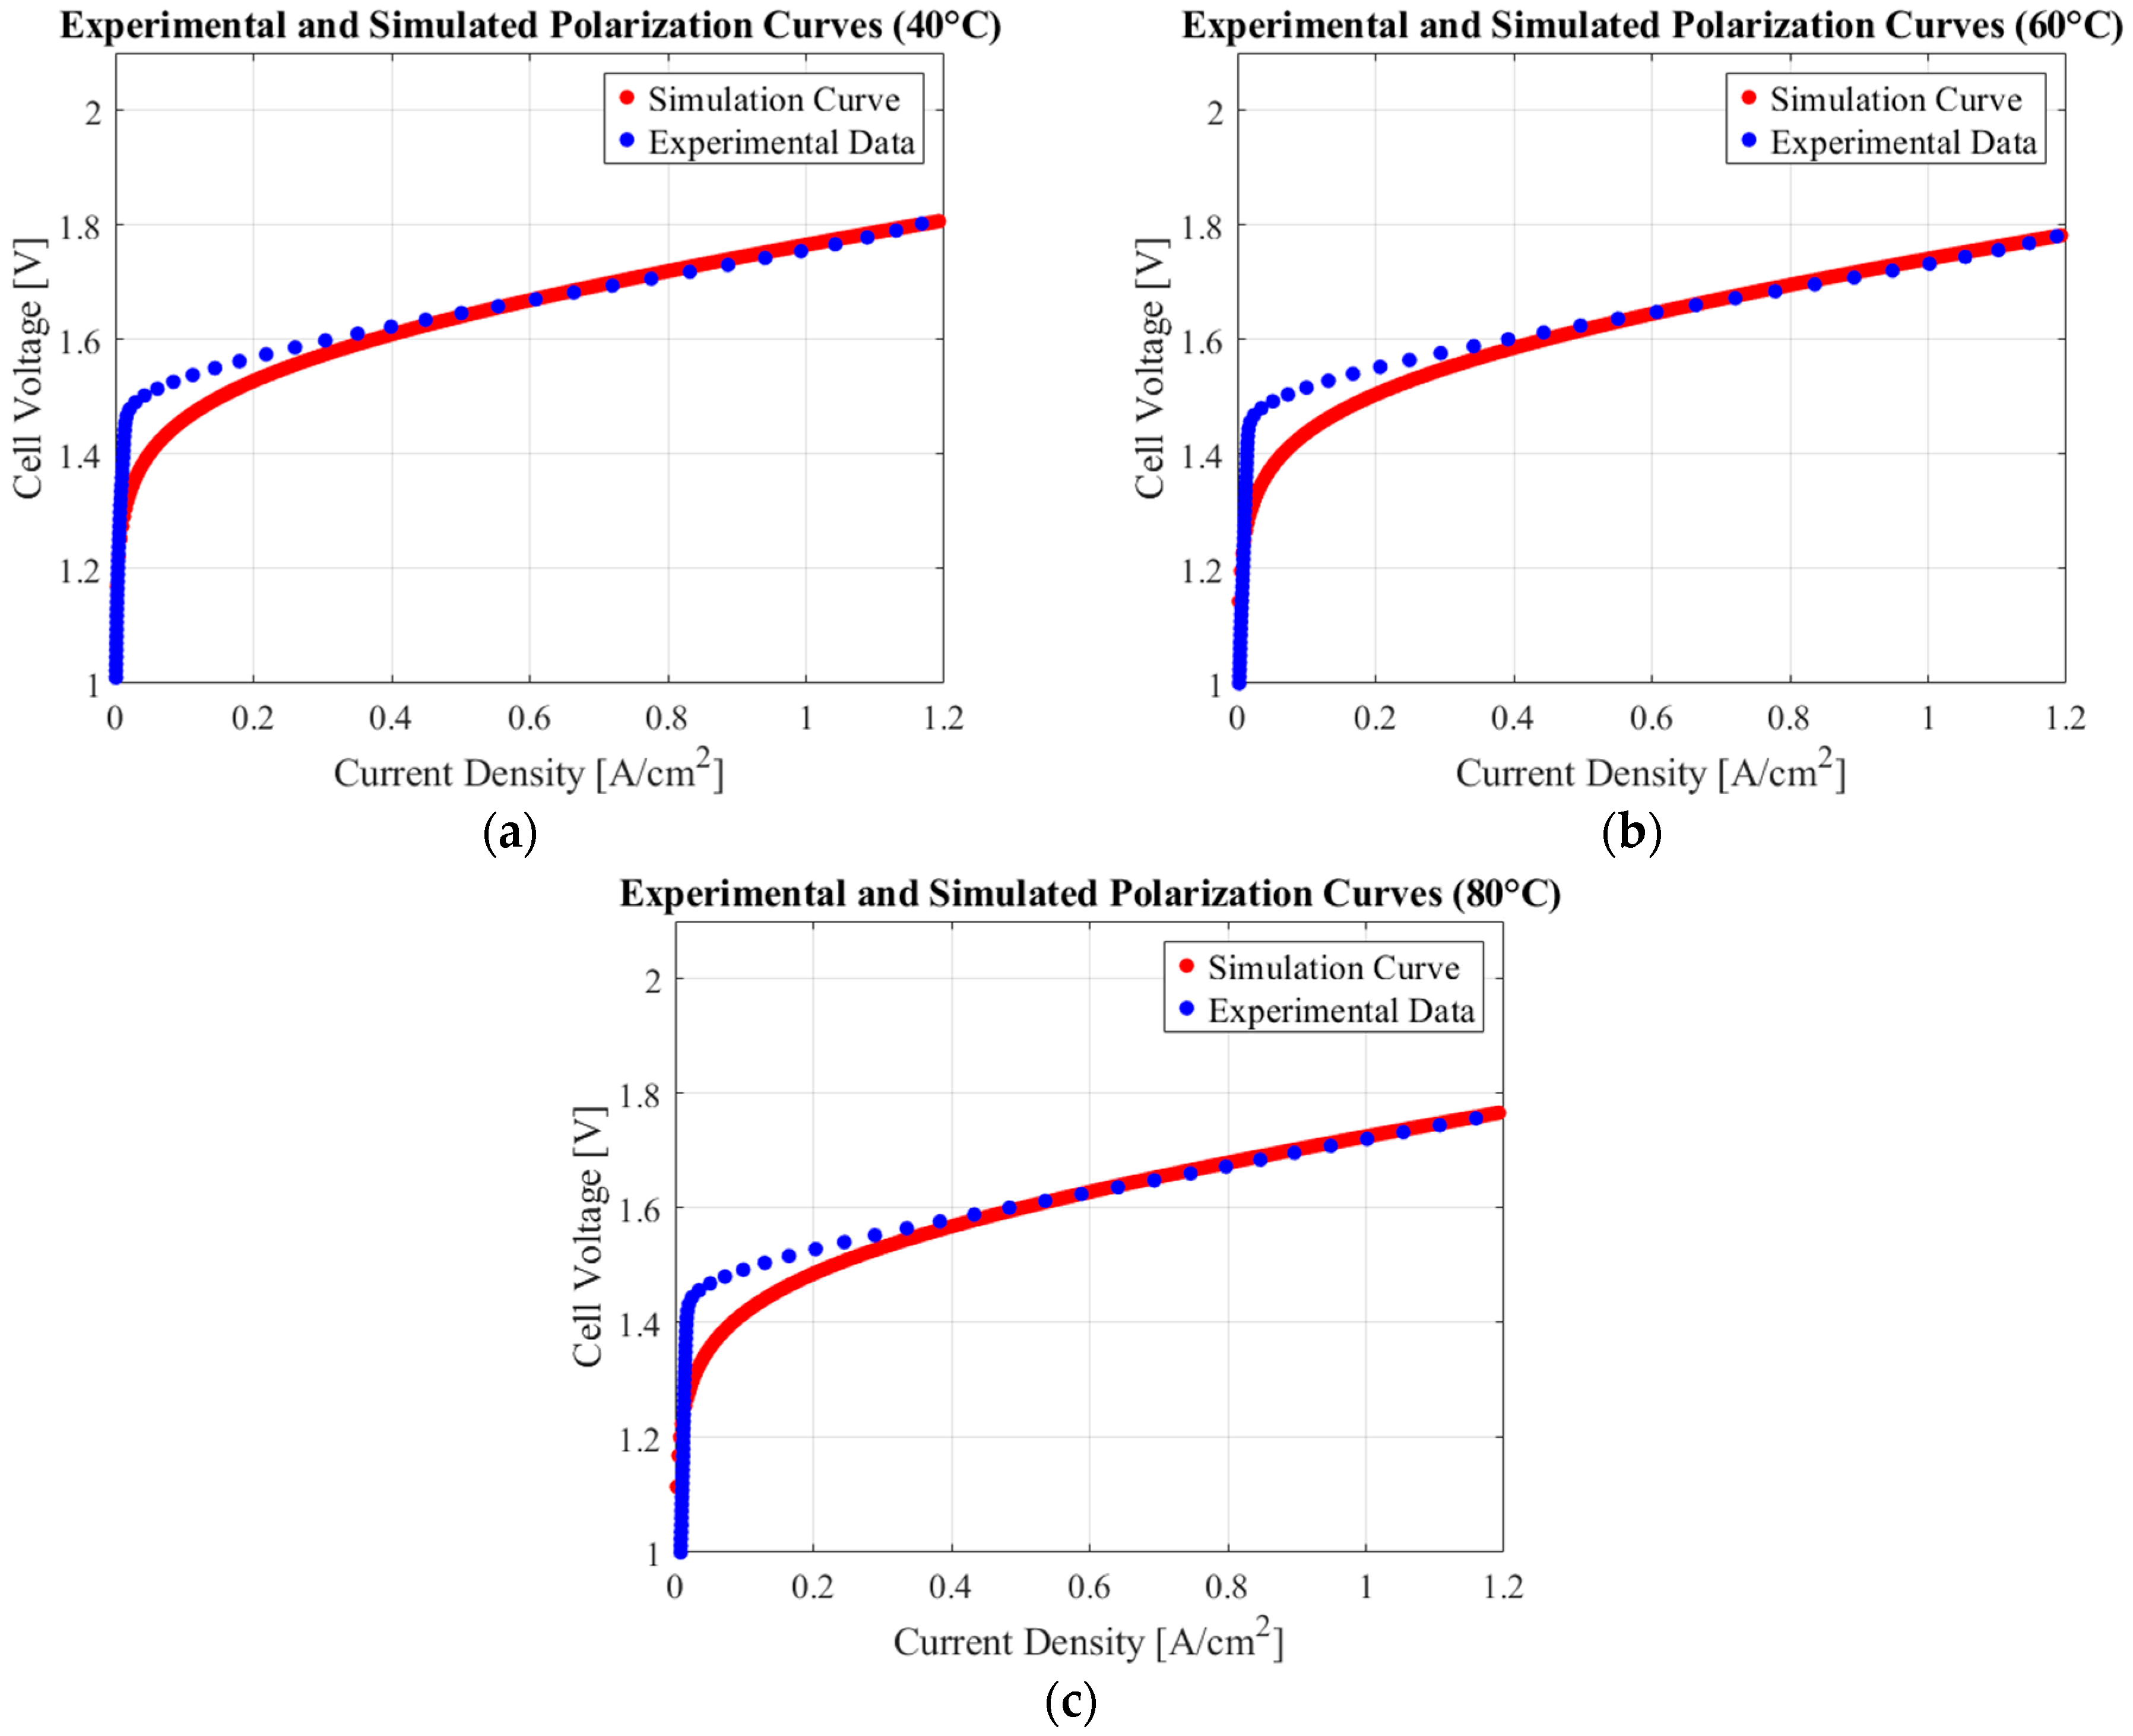
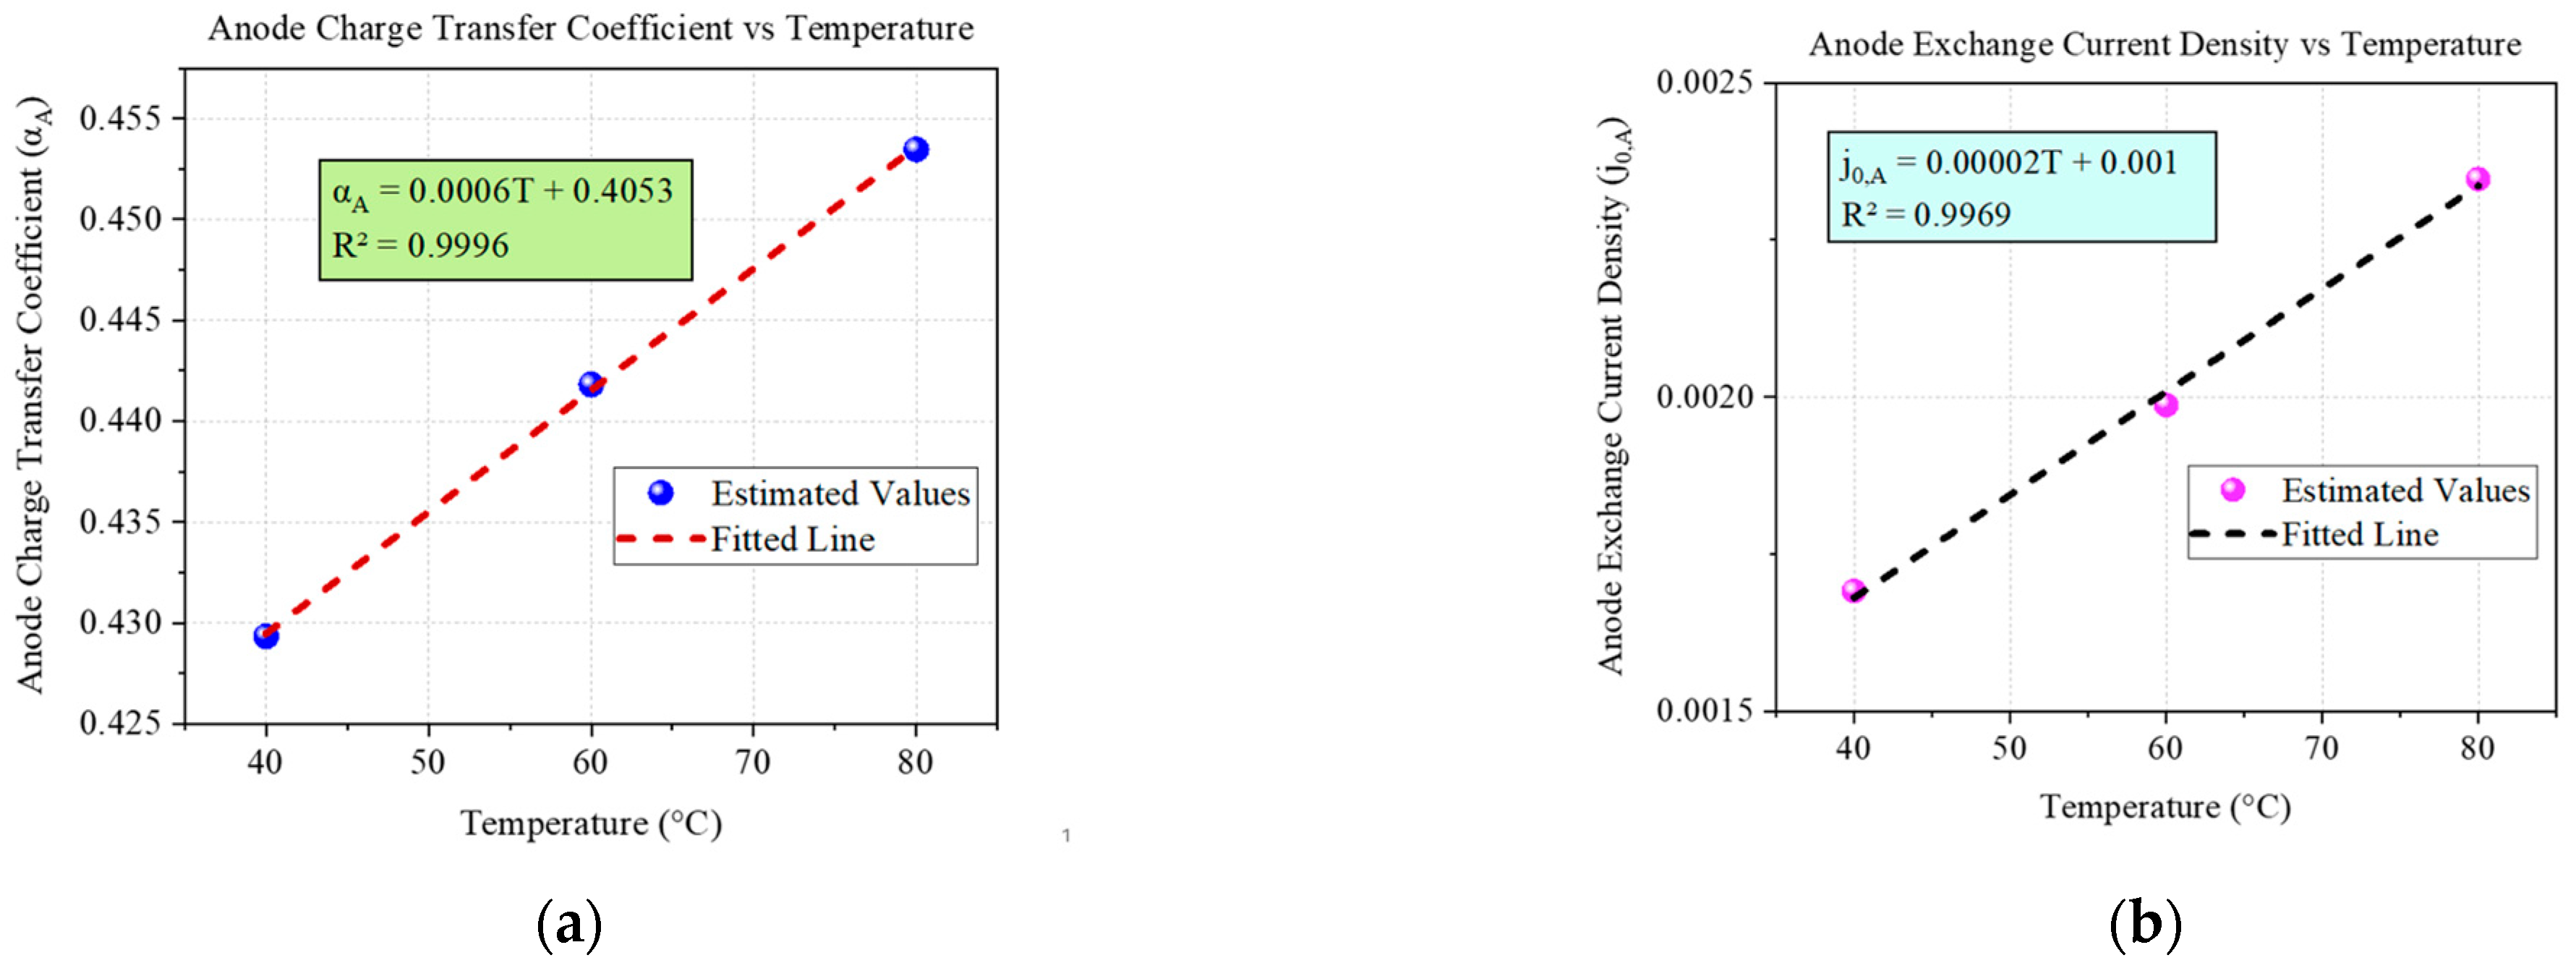
4.4. Parameter Estimation

Parameter estimation was performed to determine the values of the five most influential parameters identified in Figure 4, i.e., Anodic Charge Transfer Coefficient (ACTC), Cathode Charge Transfer Coefficient (CCTC), Anode Exchange Current Density (AECD), Cathode Exchange Current Density (CECD), and ionic conductivity of the membrane.
To achieve this, a non-linear least squares optimization approach was employed, utilizing the trust-region reflective algorithm to minimize the objective function, defined as the Sum of Squared Errors (SSE) between the model output and the experimental data shown in Figure 5. The SSE is calculated as follows:
S S E = i = 1 n ( V e x p , i V m o d e l , i )   2
where V e x p , i   is the experimental cell voltage at data point i , V m o d e l , i   is the corresponding model-predicted voltage, and n is the total number of data points.
To carry out the parameter estimation, initial guesses along with lower and upper bounds for each parameter were defined, as summarized in Table 3.
In this study, parameter estimation was performed using the experimental data collected at 40 °C, 60 °C, and 80 °C with a constant flow rate of 3 mL/min, in order to find correlations between the selected parameters and temperature. The estimated values resulting from this process are summarized in Table 4.
It can be observed that in all cases, the CECD is significantly lower than the AECD. This trend is consistent with previously reported findings in similar electrochemical systems, where cathodic reactions generally exhibit higher intrinsic reaction rates due to more favorable electrode kinetics [33]. In addition, the ACTC in the PEMWE is higher than the CCTC because the oxygen evolution reaction (OER) at the anode requires a larger overpotential to initiate the kinetics of the reaction.
Figure 8 compares the model output with the experimental data using the estimated parameters listed in Table 4. As previously discussed, the Sum of Squared Errors (SSE), defined in Equation (18), is used as a metric to evaluate the accuracy of the model relative to the experimental results. Although the model does not capture degradation mechanisms or long-term aging effects, it still achieves a good level of accuracy when compared to the experimental data. The resulting SSE values are 0.31022, 0.32925, and 0.30818 at a flow rate of 3 mL/min for temperatures of 40 °C, 60 °C, and 80 °C, respectively, indicating a consistent match across the tested conditions. This result can be considered acceptable, keeping in mind that a physically-based model describing an ideal cell behavior is adopted here to simulate a cell near the end of its lifetime. Hence, the resulting SSE can be viewed as the maximum error obtainable using this model to simulate the dynamic behavior of the PEMWE.
Using the validated model, the main overpotentials can be analyzed separately. Figure 9 shows the simulated overpotentials at 40 °C and a flow rate of 3 mL/min. As can be seen, the overpotentials due to ohmic losses, derived from Equation (8), are lower than both anodic and cathodic activation losses. The ohmic losses increase linearly with current density, reaching a maximum value of 0.17 V at a current density of 1.2 A/cm2.
Additionally, comparing the values of AECD and CECD from Table 4, it is evident that the reaction at the cathode occurs more easily, while the anode reaction is slower, leading to higher energy losses at the anode, which could contribute to increased polarization losses.
By estimating the five most influential parameters at different temperatures, it becomes possible to identify their linear correlation with temperature. A linear regression analysis was performed, and the results revealed a strong linear relationship for all parameters, as indicated by the coefficient of determination (R2), which measures how well the regression line fits the data. All the coefficient of determination values were above 0.96, confirming the validity of the linear approximations. Specifically, the R2 values were 0.9996 for the ACTC, 0.9969 for the AECD, 0.9992 for the CECD, 0.9995 for the CCTC, and 0.9634 for the membrane ionic conductivity. The results obtained at an inlet water flow rate of 3 mL/min are shown in Figure 10. Additionally, the polarization curves of the PEMWE at different values of the ACTC, CCTC, AECD, and CECD are provided in Figure S1 (Supplementary Material).
Using the linear equations derived for the ACTC, AECD, CECD, CCTC, and membrane ionic conductivity, the model was used to predict the cell voltage across the full temperature range of 40 °C to 80 °C. Figure 11 illustrates the resulting polarization surface as a function of current density and temperature, based on parameters estimated in Figure 10. The simulation was performed at 1 °C intervals, producing a high-resolution map of cell performance under varying thermal conditions.

5. Discussion

Many models of water electrolyzers are available in the literature. Among them, physically based models are particularly valuable due to their ability to describe in detail the electrochemical and transport phenomena governing cell behavior. These models typically compute individual overvoltages by coupling electrochemical kinetics with mass and energy balances, offering a mechanistic understanding of how internal processes affect performance.
However, a key limitation of such models lies in their complexity. They often have a large number of internal parameters and variables, with only one independent (cell voltage or power) measurable output. These Multiple Input Single Output (MISO) system models, when applied to simulate electrolyzer performance, often fail to make accurate predictions, since all the effects of many input variables and the time-varying nature of parameters can be observed only as a unique cumulated effect on one output variable. In short, in these physically-based dynamic models, parameter overestimation is frequent. Moreover, these models cannot predict cell degradation (constant parameters are considered instead of time-varying ones), and even if the large number of parameters seems to guarantee a good model tuning, this does not always happen.
In order to assess the model limitations, experimental data from a PEMWE cell that had already undergone extended operation were used. The model was still able to capture the steady-state performance of the aged cell, even if it does not explicitly account for long-term degradation mechanisms. The use of aged experimental data enables the model to implicitly reflect performance losses; however, it also introduces a limitation: the parameter fitting process cannot distinguish between intrinsic kinetic properties and degradation effects.
Experimental data confirmed the results of SAMO, outlining that temperature is the main operating variable that visibly affects the cell voltage. It was also observed that the used PEMWE cell shows polarization curves that highly differ from the ideal ones, showing a sharp voltage increase at very low current densities, and an almost crushed Cyclic Voltammetry. For these reasons, although the model can predict the polarization curve well at most current densities, its accuracy is reduced at low currents, under dynamic conditions, where the degradation of active materials is a dominant factor. To improve predictive capabilities in long-term simulations, future modeling efforts should incorporate explicit aging mechanisms or time-dependent parameters to more accurately capture the evolving performance of the cell.

6. Conclusions

In this work, a physically-based, dynamic model of a proton exchange membrane water electrolyzer (PEMWE) was developed in MATLAB/Simulink, incorporating detailed descriptions of electrochemical kinetics, ohmic losses, and mass transport phenomena.
To address the challenges associated with the large number of internal parameters common in these kinds of models, a structured sensitivity analysis was performed. The Sensitivity Analysis of Model Output (SAMO) identified current density and temperature as the most influential operating variables. These insights guided the design of an experimental campaign at three temperature levels (40 °C, 60 °C, and 80 °C) and four inlet water flow rates ranging from 3 mL/min to 12 mL/min, during which CV, EIS, and polarization curves were acquired.
A second sensitivity analysis was carried out to evaluate the parametric sensitivity of the model. Eight key parameters were selected, including charge transfer coefficients, exchange current densities, membrane conductivity, water permeability, and diffusion properties. Following this analysis, the five most influential parameters, ACTC, CCTC, AECD, CECD, and membrane ionic conductivity, were estimated via non-linear least squares optimization, minimizing the sum of squared errors (SSE) between simulated and experimental data. The interesting result of this study is that the developed model, based on assumptions of ideal cell behavior, also showed an acceptable agreement with experimental polarization curves taken with a cell near its end-of-life, confirming the model’s validity at all the tested temperatures.
To further generalize the model, linear regression was used to establish relationships between temperature and the five key parameters. The resulting correlations exhibited high coefficient of determination (R2) values exceeding 0.96, allowing the model to accurately generate polarization curves across the 40–80 °C range. As expected, increasing the temperature led to lower cell voltages due to improved reaction kinetics and membrane conductivity.

Supplementary Materials

The following supporting information can be downloaded at: https://www.mdpi.com/article/10.3390/en18092217/s1, Figure S1: Polarization curves at different values of ACTC, CCTC, AECD, and CECD.

Author Contributions

Conceptualization, P.B.A. and O.P.; methodology, O.P., P.B.A. and A.M.; software, P.B.A. and A.M.; validation, P.B.A. and A.N.; investigation, P.B.A. and A.N; resources, O.P.; data curation, P.B.A., A.M. and A.N.; writing—original draft preparation P.B.A. and A.M.; writing—review and editing, O.P.; supervision, O.P.; project administration, O.P.; funding acquisition, O.P. All authors have read and agreed to the published version of the manuscript.

Funding

This research was partially funded by NextGeneration EU, PNRR, M2C213.5, project NEMESI: Nuovi Elettrodi e Membrane per Elettrolizzatori a Scala Industriale, ID: RSH2B_000002. A. Niyati is supported by a PhD grant FSE+2021-2027, ESO 4.6.

Data Availability Statement

The original contributions and data presented in the study are included in the article material; further inquiries can be directed to the corresponding author.

Conflicts of Interest

The authors declare no conflicts of interest. The funders had no role in the design of the study; in the collection, analyses, or interpretation of data; in the writing of the manuscript; or in the decision to publish the results.

References

  1. Kopp, M.; Coleman, D.; Stiller, C.; Scheffer, K.; Aichinger, J.; Scheppat, B. Energiepark Mainz: Technical and Economic Analysis of the Worldwide Largest Power-to-Gas Plant with PEM Electrolysis. Int. J. Hydrogen Energy 2017, 42, 13311–13320. [Google Scholar] [CrossRef]
  2. Boudellal, M. Power-to-Gas: Renewable Hydrogen Economy for the Energy Transition; De Gruyter: Berlin, Germany, 2018; ISBN 978-3-11-055981-1. [Google Scholar]
  3. Hermesmann, M.; Müller, T.E. Green, Turquoise, Blue, or Grey? Environmentally Friendly Hydrogen Production in Transforming Energy Systems. Prog. Energy Combust. Sci. 2022, 90, 100996. [Google Scholar] [CrossRef]
  4. Liu, W.; Zuo, H.; Wang, J.; Xue, Q.; Ren, B.; Yang, F. The Production and Application of Hydrogen in Steel Industry. Int. J. Hydrogen Energy 2021, 46, 10548–10569. [Google Scholar] [CrossRef]
  5. Feng, Q.; Yuan, X.-Z.; Liu, G.; Wei, B.; Zhang, Z.; Li, H.; Wang, H. A Review of Proton Exchange Membrane Water Electrolysis on Degradation Mechanisms and Mitigation Strategies. J. Power Sources 2017, 366, 33–55. [Google Scholar] [CrossRef]
  6. El-Shafie, M. Hydrogen Production by Water Electrolysis Technologies: A Review. Results Eng. 2023, 20, 101426. [Google Scholar] [CrossRef]
  7. Qazi, U.Y. Future of Hydrogen as an Alternative Fuel for Next-Generation Industrial Applications; Challenges and Expected Opportunities. Energies 2022, 15, 4741. [Google Scholar] [CrossRef]
  8. Xu, Y.; Cai, S.; Chi, B.; Tu, Z. Technological Limitations and Recent Developments in a Solid Oxide Electrolyzer Cell: A Review. Int. J. Hydrogen Energy 2024, 50, 548–591. [Google Scholar] [CrossRef]
  9. Lahrichi, A.; El Issmaeli, Y.; Kalanur, S.S.; Pollet, B.G. Advancements, Strategies, and Prospects of Solid Oxide Electrolysis Cells (SOECs): Towards Enhanced Performance and Large-Scale Sustainable Hydrogen Production. J. Energy Chem. 2024, 94, 688–715. [Google Scholar] [CrossRef]
  10. Marini, S.; Salvi, P.; Nelli, P.; Pesenti, R.; Villa, M.; Berrettoni, M.; Zangari, G.; Kiros, Y. Advanced Alkaline Water Electrolysis. Electrochim. Acta 2012, 82, 384–391. [Google Scholar] [CrossRef]
  11. Zeng, K.; Zhang, D. Recent Progress in Alkaline Water Electrolysis for Hydrogen Production and Applications. Prog. Energy Combust. Sci. 2010, 36, 307–326. [Google Scholar] [CrossRef]
  12. Vincent, I.; Bessarabov, D. Low Cost Hydrogen Production by Anion Exchange Membrane Electrolysis: A Review. Renew. Sustain. Energy Rev. 2018, 81, 1690–1704. [Google Scholar] [CrossRef]
  13. Xu, Q.; Zhang, L.; Zhang, J.; Wang, J.; Hu, Y.; Jiang, H.; Li, C. Anion Exchange Membrane Water Electrolyzer: Electrode Design, Lab-Scaled Testing System and Performance Evaluation. EnergyChem 2022, 4, 100087. [Google Scholar] [CrossRef]
  14. Carmo, M.; Fritz, D.L.; Mergel, J.; Stolten, D. A Comprehensive Review on PEM Water Electrolysis. Int. J. Hydrogen Energy 2013, 38, 4901–4934. [Google Scholar] [CrossRef]
  15. Wallnöfer-Ogris, E.; Grimmer, I.; Ranz, M.; Höglinger, M.; Kartusch, S.; Rauh, J.; Macherhammer, M.-G.; Grabner, B.; Trattner, A. A Review on Understanding and Identifying Degradation Mechanisms in PEM Water Electrolysis Cells: Insights for Stack Application, Development, and Research. Int. J. Hydrogen Energy 2024, 65, 381–397. [Google Scholar] [CrossRef]
  16. Niyati, A.; Moranda, A.; Beigzadeh Arough, P.; Navarra, F.M.; Paladino, O. Electrochemical Performance of a Hybrid NiCo2O4@NiFelt Electrode at Different Operating Temperatures and Electrolyte pH. Energies 2024, 17, 3703. [Google Scholar] [CrossRef]
  17. Abdin, Z.; Webb, C.J.; Gray, E.M. Modelling and Simulation of a Proton Exchange Membrane (PEM) Electrolyser Cell. Int. J. Hydrogen Energy 2015, 40, 13243–13257. [Google Scholar] [CrossRef]
  18. Folgado, F.J.; González, I.; Calderón, A.J. Simulation Platform for the Assessment of PEM Electrolyzer Models Oriented to Implement Digital Replicas. Energy Convers. Manag. 2022, 267, 115917. [Google Scholar] [CrossRef]
  19. Awasthi, A.; Scott, K.; Basu, S. Dynamic Modeling and Simulation of a Proton Exchange Membrane Electrolyzer for Hydrogen Production. Int. J. Hydrogen Energy 2011, 36, 14779–14786. [Google Scholar] [CrossRef]
  20. Marefatjouikilevaee, H.; Auger, F.; Olivier, J.-C. Static and Dynamic Electrical Models of Proton Exchange Membrane Electrolysers: A Comprehensive Review. Energies 2023, 16, 6503. [Google Scholar] [CrossRef]
  21. Han, B.; Mo, J.; Kang, Z.; Yang, G.; Barnhill, W.; Zhang, F.-Y. Modeling of Two-Phase Transport in Proton Exchange Membrane Electrolyzer Cells for Hydrogen Energy. Int. J. Hydrogen Energy 2017, 42, 4478–4489. [Google Scholar] [CrossRef]
  22. Marangio, F.; Santarelli, M.; Cali, M. Theoretical Model and Experimental Analysis of a High Pressure PEM Water Electrolyser for Hydrogen Production. Int. J. Hydrogen Energy 2009, 34, 1143–1158. [Google Scholar] [CrossRef]
  23. Hwang, J.J.; Lai, L.K.; Wu, W.; Chang, W.R. Dynamic Modeling of a Photovoltaic Hydrogen Fuel Cell Hybrid System. Int. J. Hydrogen Energy 2009, 34, 9531–9542. [Google Scholar] [CrossRef]
  24. Choi, P. A Simple Model for Solid Polymer Electrolyte (SPE) Water Electrolysis. Solid State Ion. 2004, 175, 535–539. [Google Scholar] [CrossRef]
  25. Ma, Z.; Witteman, L.; Wrubel, J.A.; Bender, G. A Comprehensive Modeling Method for Proton Exchange Membrane Electrolyzer Development. Int. J. Hydrogen Energy 2021, 46, 17627–17643. [Google Scholar] [CrossRef]
  26. Tawalbeh, M.; Shomope, I.; Al-Othman, A.; Alshraideh, H. Prediction of Hydrogen Production in Proton Exchange Membrane Water Electrolysis via Neural Networks. Int. J. Thermofluids 2024, 24, 100849. [Google Scholar] [CrossRef]
  27. Brezak, D.; Kovač, A.; Firak, M. MATLAB/Simulink Simulation of Low-Pressure PEM Electrolyzer Stack. Int. J. Hydrogen Energy 2023, 48, 6158–6173. [Google Scholar] [CrossRef]
  28. Harrison, K.W.; Hernández-Pacheco, E.; Mann, M.; Salehfar, H. Semiempirical Model for Determining PEM Electrolyzer Stack Characteristics. J. Fuel Cell Sci. Technol. 2005, 3, 220–223. [Google Scholar] [CrossRef]
  29. Gomez Vidales, A.; Millan, N.C.; Bock, C. Modeling of Anion Exchange Membrane Water Electrolyzers: The Influence of Operating Parameters. Chem. Eng. Res. Des. 2023, 194, 636–648. [Google Scholar] [CrossRef]
  30. Milewski, J.; Guandalini, G.; Campanari, S. Modeling an Alkaline Electrolysis Cell through Reduced-Order and Loss-Estimate Approaches. J. Power Sources 2014, 269, 203–211. [Google Scholar] [CrossRef]
  31. Biaku, C.Y.; Dale, N.V.; Mann, M.D.; Salehfar, H.; Peters, A.J.; Han, T. A Semiempirical Study of the Temperature Dependence of the Anode Charge Transfer Coefficient of a 6 kW PEM Electrolyzer. Int. J. Hydrogen Energy 2008, 33, 4247–4254. [Google Scholar] [CrossRef]
  32. Sezer, N.; Bayhan, S.; Fesli, U.; Sanfilippo, A. A Comprehensive Review of the State-of-the-Art of Proton Exchange Membrane Water Electrolysis. Mater. Sci. Energy Technol. 2025, 8, 44–65. [Google Scholar] [CrossRef]
  33. García-Valverde, R.; Espinosa, N.; Urbina, A. Simple PEM Water Electrolyser Model and Experimental Validation. Int. J. Hydrogen Energy 2012, 37, 1927–1938. [Google Scholar] [CrossRef]
Figure 1. Test bench.
Energies 18 02217 g001
Figure 2. Scheme of the PEMWE configuration and reactions.
Energies 18 02217 g002
Figure 3. Most relevant operating variables and their correlation with cell voltage.
Energies 18 02217 g003
Figure 4. Parametric sensitivity of the PEMWE model.
Energies 18 02217 g004
Figure 5. Polarization curves at different cell temperatures and inlet water flow rates. (a) PL at 3 mL min−1, (b) PL at 6 mL min−1, (c) PL at 9 mL min−1, (d) PL at 12 mL min−1.
Energies 18 02217 g005aEnergies 18 02217 g005b
Figure 6. (a) CV at 60 °C and 3 mL/min with a scan rate of 5 mV/s, (b) the CP for 1 h at a current density of 1 A/cm2 at 60 °C and 3 mL/min.
Energies 18 02217 g006
Figure 7. EIS and the estimated equivalent circuit of the PEM cell.
Energies 18 02217 g007
Figure 8. Comparison of the model and experimental data. (a) cell operating at 40 °C, (b) cell operating at 60 °C, (c) cell operating at 80 °C.
Energies 18 02217 g008
Figure 9. Main overpotentials as a function of the current density.
Energies 18 02217 g009
Figure 10. Linear correlation of estimated parameters with temperature. (a) ACTC, (b) AECD, (c) CECD, (d) CCTC, (e) Membrane Conductivity.
Energies 18 02217 g010aEnergies 18 02217 g010b
Figure 11. Polarization curves generated using the model with parameters from the derived linear equations.
Energies 18 02217 g011
Table 1. Operating variables of the PEMWE model.
VariableValueUnitType
Cell temperature T313.15–353.15KInput
Cell pressure P1.013 × 105PaInput
Inlet water flow rate 3–12mL min−1Input
Outlet water flow rate 0–12mL min−1Input
Inlet water temperature Tw313.15–363.15KInput (considered = T)
Cell Current 0–6AInput
Cell Voltage0–1.82VOutput
Cell power 0–11WOutput (correlated)
Cathode current density jC0–1.2A cm−2State
Anode current density jA0–1.2A cm−2State
Anode pressure pA1.013 × 105PaState
Cathode pressure pC1.013 × 105PaState
Table 2. Initial geometry and physicochemical parameters of the PEMWE model.
ParameterValueUnit
Universal gas constant R8.314J mol−1 K−1-
Faraday’s constant F96,485.3A s mol−1-
Water density H2O ρH2O1000kg m−3fixed value (correlations with T)
Cathode thickness δel,cat0.045–0.05cmfixed value, measured
Anode thickness δel,an0.045–0.05cmfixed value, measured
Water molar mass Mm,H2O18g mol−1-
Oxygen molar mass Mm,O232g mol−1-
Water viscosity μH2O1.1 × 10−2g cm−1 sfixed value (correlations with T)
Membrane water permeability Kdarcy1.58 × 10−14 ± 10%cm2to be estimated
Membrane thickness δm1.27 × 10−2Cmfixed value, measured
Cathode exchange current density j0,c1 × 10⁻3–3.03 × 10⁻¹A cm−2 [32]to be estimated
Anode exchange current density j0,a1 × 10−10–5.93 × 10⁻³A cm−2 [32]to be estimated
Ionic conductivity σ0.075–0.097S cm−1 [27]to be estimated
Critical pressure of H21.28 × 106Pafixed value
Critical temperature of H233.3Kfixed value
Critical pressure of O24.97 × 106Pafixed value
Critical temperature of O2154.4Kfixed value
Critical pressure of H2O21.83 × 106Pafixed value
Critical temperature of H2O647.3Kfixed value
Empirical coefficient a3.640 × 10−4[27]fixed value, previously estimated
Empirical coefficient b2.334[27]fixed value, previously estimated
Empirical coefficient c0.785[27]fixed value, previously estimated
Cathode charge transfer coefficient αC0.25–0.5[32]to be estimated
Anode charge transfer coefficient αA0.2–2[32]to be estimated
Diffusion coefficient of water through the membrane Dw1.28 × 10−10 ± 10%m2 s−1fixed value, previously estimated
Electro osmotic drag coefficient nd3 ± 10%molH2O molH+−1to be estimated
Hydrogen gas partial pressure pH2(0.5–1)⋅pcPa
Oxygen gas partial pressure pO2(0.2–1)⋅pAPa
Water vapor partial pressure pH2O(0–1) pAPa
Anode and cathode cross-sectional surface area SA and SC6.25cm2fixed value, measured
Active cell surface and total area of the membrane Am5cm2fixed value, measured
Porosity of the electrode ε0.3 fixed value, measured
Percolation threshold of the electrode εp0.11 fixed value, estimated
Distance between the anode or cathode and the membrane dam, dcm0.00001mfixed value, measured
Table 3. Initial guesses and lower and upper bounds for the parameters [32,33].
ParameterInitial GuessLower BoundUpper Bound
Cathode exchange current density (j0,C)10−3 (A·cm−2)1 × 10⁻3 (A·cm−2)3.03 × 10⁻1 (A·cm−2)
Anode exchange current density (j0,A)10−7 (A·cm−2)1 × 10⁻10 (A·cm−2)5.93 × 10⁻3 (A·cm−2)
Cathode charge transfer coefficient (αC)0.50.250.5
Anode charge transfer coefficient (αA)0.50.22
Ionic conductivity0.08 (S·cm−1)0.07 (S·cm−1)0.097 (S·cm−1)
Table 4. Estimated parameters.
TemperatureAnode Charge Transfer Coefficient (αA)Cathode Charge Transfer Coefficient (αC)Anode Exchange Current Density (j0,A)Cathode Exchange Current Density (j0,C)Ionic Conductivity
40 °C0.429330.307820.00169120.00994110.087375
60 °C0.441820.326020.00198730.011170.088853
80 °C0.453470.34290.00234650.0125280.089585
Disclaimer/Publisher’s Note: The statements, opinions and data contained in all publications are solely those of the individual author(s) and contributor(s) and not of MDPI and/or the editor(s). MDPI and/or the editor(s) disclaim responsibility for any injury to people or property resulting from any ideas, methods, instructions or products referred to in the content.

