


Abstract
Persistent supply–demand mismatches pose major obstacles to deploying green electricity. As a critical marketization reform instrument, the electricity spot market (ESM) is expected to optimize power resource allocation. This paper examines whether ESM pilots contribute to the growth of green electricity generation, and further tests their moderating role in the relationships between urbanization, industrial structure, and green electricity generation. To this end, we treat the ESM pilot as a quasi-natural experiment and employ a difference-in-differences (DID) model to empirically assess the impact of the ESM on green electricity generation, using provincial data from 1998 to 2021. The results show that establishing the ESM significantly promotes green electricity generation. This positive impact remains robust across a series of robustness checks, including parallel trend tests, alternative regression approaches, variable re-measurement, and placebo tests. Further mechanism analysis confirms that the ESM enhances green electricity generation by reducing government intervention and reshaping the energy consumption structure. Additionally, our analysis of moderating effects reveals that the ESM helps mitigate the negative impacts of urbanization and the expansion of secondary industries. These findings provide empirical implications for emerging and developing economies on using market reform to ease electricity constraints and scale up green electricity generation.
1. Introduction
In the presence of severe energy security challenges and environmental pollution, governments worldwide are actively exploring policies to promote green energy transition and mitigate climate change to achieve sustainable development goals [1]. A key focus of these efforts is the expansion of clean energy and the reduction in fossil fuel dependence [2,3]. The power industry, as the primary sector for energy consumption and pollutant emissions, plays a crucial role in the modern energy system and urgently needs transformation [4]. Transitioning from thermal power to green electricity generated from renewables such as hydro, wind, solar, and tidal power has become a strategic priority for many countries [5].
As the largest developing country in the world, China is also the largest consumer of coal and the biggest emitter of greenhouse gases, facing an urgent need to accelerate the development of a secure and efficient energy system centered on clean energy [6]. In recent years, China has proposed “2030 Carbon Peak” and “2060 Carbon Neutrality” goals, signaling a significant rise in demand for green electricity. A successful transition from fossil fuels to renewable energy in China has the potential to significantly enhance global energy security and climate change mitigation, while also providing valuable empirical insights for other countries pursuing similar transitions.
However, the promotion of green electricity in China faces significant challenges, primarily due to its continued reliance on fossil energy, which accounted for about 63.19% of electricity generation in 2024 (Data source: National Bureau of Statistics of China: https://data.stats.gov.cn/dg/website/page.html#/pc/national/yearData, accessed on 11 August 2026). The intermittency of renewable energy sources and associated curtailment issues further complicate the transition [7,8]. As renewable energy capacity expands rapidly, the grid’s limited ability to integrate this power becomes even more difficult. In response, China has initiated electricity spot market (ESM) pilots to enhance system efficiency. Unlike the traditional vertically integrated model, the ESM introduces market-based mechanisms that treat electricity as a tradable commodity, allowing price signals to guide the efficient allocation of resources and reduce monopoly-induced inefficiencies [9].
Despite growing interest in electricity marketization reform, existing research on the relationship between the ESM and green electricity generation faces three key limitations. First, few studies have assessed the impact of the ESM. Rather than evaluating policy outcomes, most current research focuses on refining its operation, such as stabilizing prices [10], improving efficiency [11], and designing clearing mechanisms [12,13]. Second, macro-level studies on green electricity tend to emphasize the impact of political incentives [14], carbon emissions [15], economic growth [16], green finance [17,18,19], and technological progress [20,21], but rarely consider market mechanisms like the ESM. Third, despite growing recognition of green electricity as essential to sustainable development [1], empirical research on the impact of the ESM remains limited. Most studies focus on theoretical insights. For example, Xu et al. (2018) emphasize the role of market mechanisms in efficient resource allocation for renewable energy [9]. Heggarty et al. (2020) highlight that improved markets enhance system reliability and flexibility [22]. Spot trading enables real-time price discovery [23], potentially accelerating green electricity growth. Chen et al. (2021) suggest that the ESM can help balance regional supply–demand and promote clean energy use, thereby advancing the nationwide growth of green electricity [24]. The empirical evaluation of the impact of the ESM focuses on its carbon reduction effect, such as that carried out by Li et al. (2024) [25]. Overall, despite growing attention in electricity marketization reform and energy transition, empirical studies using quasi-natural experiments to assess policy effects on energy green transformation remain scarce.
Therefore, given that China’s ESM pilot policy, launched in late 2018, provides quasi-natural experimental conditions, this paper employs a difference-in-differences (DID) model to evaluate its impact on green electricity generation. By comparing changes between treatment and control groups before and after the policy, the DID method estimates the policy’s effect while alleviating potential endogeneity [26]. Using provincial data from 1998 to 2021, we identify the causal relationship between the ESM and the growth of green electricity generation in China.
This study contributes to the existing literature in several significant ways. First, it assesses the effectiveness of China’s ESM pilot policy using a DID model, addressing the impact of electricity marketization reform on promoting green electricity generation. Second, it constructs mediation models to identify how the ESM influences green electricity generation, providing insights into how the ESM facilitates the national green-energy transition. Third, by exploring moderating effects, this study deepens the analysis and shows how the ESM helps offset the negative impacts of urbanization and secondary industry on green electricity generation. These findings provide valuable empirical insights for policymakers designing targeted energy transition strategies. As global pressures mount from resource constraints and extreme weather, the study is particularly relevant for countries grappling with green electricity consumption challenges and seeking to balance government planning with market efficiency while navigating complex cross-subsidies across regions, users, and power sources.
The rest of this article is structured as follows. Section 2 describes institutional background and research hypotheses. Section 3 outlines the methodology and data. Section 4 gives the benchmark results and a detailed discussion. Section 5 focuses on mechanism tests and moderating effects. Section 6 presents the conclusion and policy implications.
2. Background and Hypotheses
2.1. Institutional Background
China has developed mature technologies for green power generation, such as wind, hydro, and solar, and overall green electricity output continues to grow. However, green electricity consumption remains a major bottleneck [24], driven by mismatches in regional energy supply and demand, uneven resource endowments, and the intermittent nature of renewables, which often leads to energy waste. In this context, it is essential for the government to strengthen nationwide coordination of energy allocation and establish a responsive market for green electricity consumption.
In 2018, China launched the ESM pilot. As a short-term real-time electricity trading market, the ESM comprises day-ahead, intra-day, and real-time markets. Electricity generators and end-users submit bids, and system operators determine time-of-use electricity prices through the uniform marginal pricing mechanism. By signaling power shortages or surpluses through fluctuating electricity prices, the ESM incentivizes electricity generators, energy storage facilities, and end-users to adjust generation and consumption behaviors, ensuring real-time supply–demand balance across the power grid [9,22]. Eight regions, Guangdong, Zhejiang, Inner Mongolia, Shanxi, Shandong, Sichuan, Fujian, and Gansu, were selected as the first batch of the pilot, with trial operations scheduled to begin by the end of 2018. On 31 August 2018, Guangdong launched its ESM trial, followed sequentially by the other provinces. By June 2019, Inner Mongolia’s trial completed the rollout of the first batch of ESM pilots. Further details of China’s first batch of ESM pilot operations are provided in Table A1.
Since the launch of the ESM pilot, spot trading has become a key mechanism for optimizing electricity allocation. Clear trading guidelines help activate the market and foster healthy competition in the electricity market. The ESM also facilitates price discovery, promotes competition, and helps correct generation-consumption imbalances, making it especially valuable in addressing regional energy disparities and improving clean energy consumption [23].
2.2. Research Hypothesis
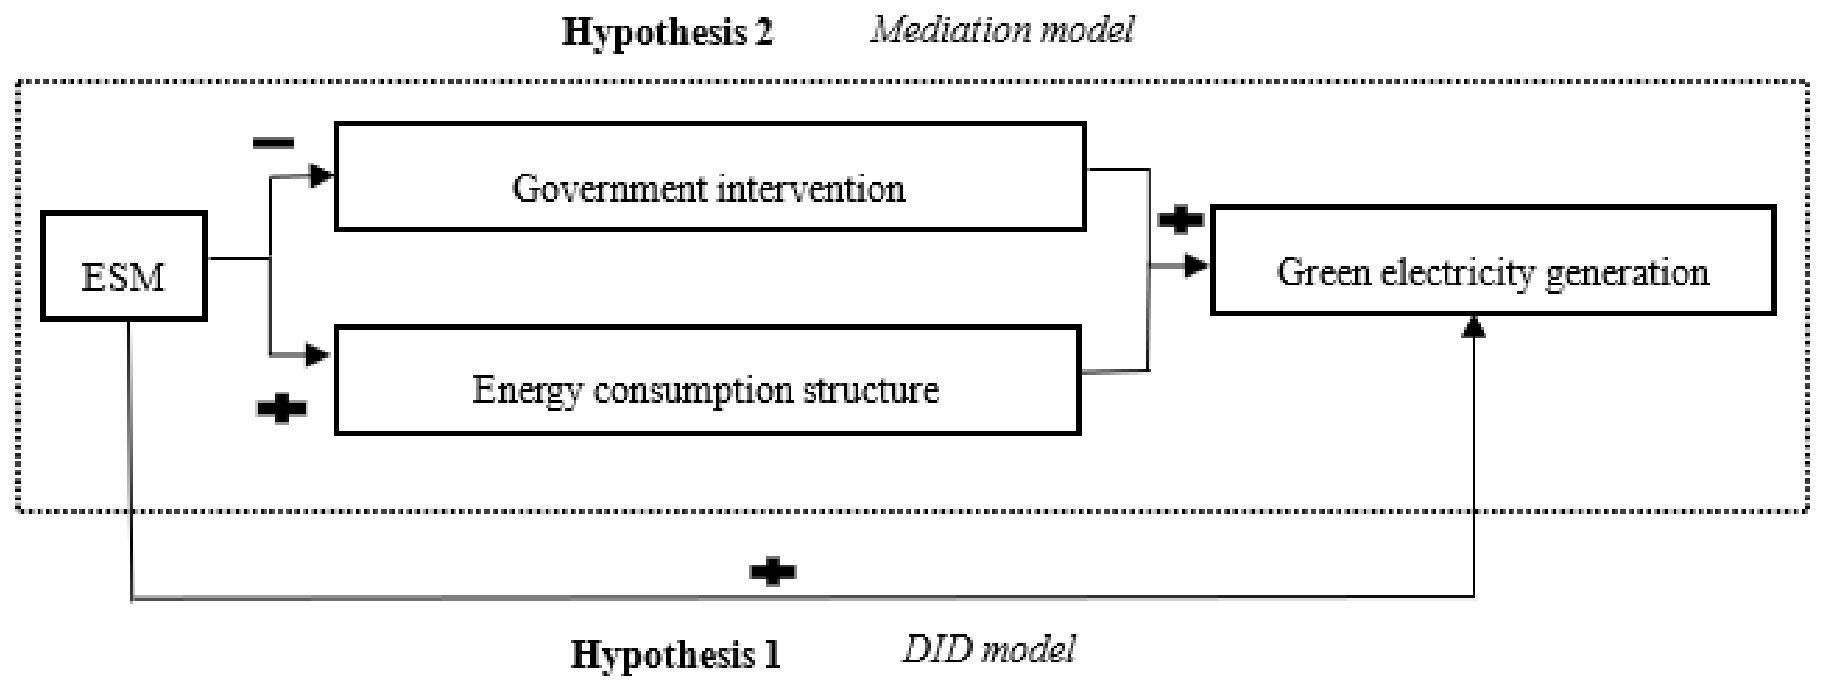
The construction of the ESM has positive significance for green electricity generation as part of China’s broader electricity marketization reform. First, ESM price signals mirror real-time electricity supply and demand conditions, incentivizing consumers to adjust consumption flexibly and improving energy utilization efficiency [23]. More fundamentally, while batteries and ultra-high voltage (UHV) infrastructure tackle the physical storage and transmission of green electricity, hardware alone cannot ensure cross-link coordination. With fixed prices, western and middle regions in China lack incentive to export surplus power, eastern users are unwilling to reduce consumption, and storage operators hesitate to charge low and discharge high. The ESM resolves this coordination problem through real-time pricing.
Second, the ESM promotes market competition by centralizing market clearing. This allows low-cost renewable generators to submit competitive bids, thereby facilitating the efficient allocation of green electricity resources and increasing the market penetration of wind and solar power. In addition, the ESM provides a market-oriented instrument to balance short-term electricity supply and demand. It enhances the power dispatch flexibility and mitigates the inherent output volatility of variable renewable power such as wind and solar [24]. Based on this, we propose the following hypothesis:
Hypothesis 1.
The ESM can significantly promote green electricity generation.
The ESM enables energy complementarity across regions by applying market-based mechanisms. It lets electricity supply and demand interact freely, make independent choices, and trade at any time, helping reduce idle capacity and power shortages from seasonal climate fluctuations. Under the spot trading model, standardized market rules constrain undue administrative intervention. Market operators independently execute clearing algorithms and settlements. Generators, storage assets, and eligible users submit bids within predefined price caps, and spot electricity prices are determined jointly by supply–demand balance and grid security constraints. Government intervention is limited to legally defined emergencies with mandatory public disclosure, and routine price control is prohibited. Instead of administratively assigning generation schedules, the market determines output dispatch and electricity prices through competitive bidding. This fosters price discovery, promotes full competition, and enhances resource allocation efficiency. The dynamic spot price mirrors real-time power scarcity, creating economic incentives for wind and solar power to enter the market and promoting green electricity generation.
Additionally, the ESM facilitates green electricity consumption and thereby stimulates green electricity generation. Its short-term, high-frequency clearing mechanism accommodates the volatility and intermittency inherent to renewable energy, creating ample room for green electricity consumption. Within this market, green generators can flexibly adjust their strategies based on real-time supply–demand conditions, reducing curtailment and maximizing utilization. Meanwhile, its price discovery function reflects electricity scarcity and value, supporting fairer profit distribution and strengthening incentives to invest in and generate green electricity. Together, these effects expand consumption, improve operational flexibility, and enhance profit incentives, thereby driving higher green electricity generation. Accordingly, we propose the following hypothesis:
Hypothesis 2.
The ESM promotes green electricity generation by influencing government intervention and the energy consumption structure.
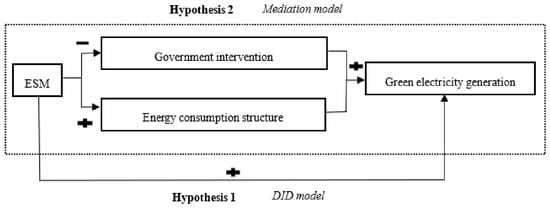
As shown in Figure 1, this study empirically tests Hypotheses 1 and 2.
Figure 1.
Research framework structure.
3. Methodology and Data
3.1. Model Specification
The launch of China’s ESM pilot policy in 2018 provides a quasi-natural experiment for applying a DID model to evaluate the impact of electricity marketization reform on green electricity generation. Widely used in policy analysis, the DID model effectively addresses endogeneity issues arising from omitted variables and other confounding factors. To test Hypothesis 1, we define the eight provinces implementing the ESM as the treatment group and the remaining provinces as the control group. Following Sanz et al. (2022) [27], the benchmark model is set as follows:
where ge is the dependent variable, representing the level of green electricity generation. The core explanatory variable is dudt, which characterizes whether a pilot of the ESM has been operated. The subscripts i and t denote provinces and years, respectively. v and θ are the fixed effect of individuals that controls the time-invariant individual effect and the fixed effect of time that controls the effects that are constant across provinces but vary over time, respectively. X is a set of control variables that may affect the green electricity generation, including carbon dioxide emission, energy consumption structure, energy intensity, technological progress, government intervention, industrial structure, economic growth, and environmental regulation. The residual error term is indicated by ε. β0~β2 are the parameters to be estimated. If β1 is significantly positive, it indicates Hypothesis 1 is supported, suggesting that the ESM plays a significant role in promoting green electricity generation.
geit = β0 + β1dudtit + β2Xit + vi + θt + εit
3.2. Data Description
3.2.1. Variable Processing
Considering data integrity and availability, we take the natural logarithm of clean energy (including hydropower, wind energy, nuclear energy, and solar energy) generation to measure the explained variable. The explanatory variable, representing the ESM, is assigned a value of 1 for the pilot provinces (Guangdong, Inner Mongolia, Gansu, Zhejiang, Fujian, Sichuan, Shanxi, and Shandong) starting from 2019; otherwise, it is assigned a value of 0. We also introduce several control variables, including carbon dioxide emission, energy consumption structure, energy intensity, technological progress, government intervention, industrial structure, economic growth [16], and environmental regulation [28].
Specifically, for the controlling variables, carbon dioxide emission is measured with the natural logarithm of total carbon dioxide emissions in each province. Excessive carbon emissions have raised environmental concerns and prompted government initiatives to increase green electricity generation [15,29]. Energy consumption structure is calculated as the ratio of total electricity consumption to total energy consumption, reflecting the degree to which electricity is used as a primary energy source. Since electricity demand influences green electricity supply, this variable captures the demand-side pressure [15]. Energy intensity, indicating energy efficiency, is defined as the ratio of total energy consumption to GDP. Improvements in energy efficiency help address challenges in green electricity consumption by reducing overall energy demand. Technological progress, economic growth, government intervention, and environmental regulation are proxied by the natural logarithms of internal expenditure on Research and Experimental Development (R&D), real GDP, government fiscal expenditures, and investment in industrial pollution control, respectively. Technological progress and economic growth are generally expected to increase green electricity generation by fostering innovation and increasing investment capacity [20,21]. Environmental regulation reflects the government’s emphasis on green development. However, at the same time, the investment in industrial pollution control will crowd out the investment in the green transformation of electricity. In contrast, government intervention may distort market signals and hinder the efficient allocation of green electricity resources [30]. Industrial structure is measured as the ratio of value added by the secondary industry to that of the tertiary industry. A higher share of secondary industry, which is typically more energy-intensive and polluting, implies greater fossil fuel consumption. At the same time, it may strengthen the urgency and policy pressure for energy transformation. Detailed definitions and sources of all variables used in the paper are provided in Table A2.
3.2.2. Data Sources and Descriptive Statistics
All data used in this empirical study are from a balanced panel comprising 30 provinces and municipalities in mainland China from 1998 to 2021. The data mainly comes from the China Statistical Yearbook, China Energy Statistical Yearbook. Carbon dioxide emissions data is sourced from the CEADs database. We supplemented the missing data by consulting the statistical yearbooks of various provinces and using the interpolation method. The descriptive statistical results of the relevant variables are shown in Table 1.
Table 1.
Descriptive statistics.
Regarding the green electricity generation capacity, the mean is 34,671.1 million kWh, with values ranging from 386,354 million kWh to 0 million kWh, respectively. This wide range highlights a substantial disparity in green electricity generation across different provinces. The dummy variable dudt has a value of 1 for the specified condition and 0 otherwise. As for the control variables, carbon dioxide emission and energy efficiency exhibit significant variation across different provinces, as indicated by their minimum and maximum values. The average R&D expenditure is RMB 30.545 billion, while the average real GDP of the sample is about RMB 107.588 million. The mean value of enes is 0.117, which is lower than 0.5, indicating that China’s current energy consumption structure is still dominated by fossil fuels. On the contrary, the mean value of ind exceeds 0.5, showing that the secondary industry is the predominant sector of China’s overall industrial structure. The maximum value of ind is 2.134, revealing that some provinces have successfully upgraded their industrial structure. In addition, the mean value of the government fiscal expenditures and investment in industrial pollution control completed are RMB 291,353.3 million and RMB 157,799.4, respectively.
It can be found that by combining Table 1 and Table A2, we take the natural logarithm of several variables in regressions, including ge, co2, tec, gov, gdp, and reg, so that the estimated coefficients can be interpreted as growth rates and the ranges of data can be processed more appropriately. All other variables are used in their original form.
4. Results and Discussion
4.1. Benchmark Results
Table 2 reports the estimation results of the benchmark model, where columns (1) to (3) provide the estimates of the unconditional regressions without incorporating control variables, and columns (4) to (6) show the corresponding results with all control variables included. Given the diverse terrain and landforms across different regions of China, there is substantial regional disparity in terms of resource endowments and the potential for green electricity generation. Therefore, this paper considers regional differences and applies the group regression method to assess pilot policy effects at the national level, and for the eastern and non-eastern regions [31].
Table 2.
The impact of the ESM on green electricity generation.
It can be seen that the impacts of the ESM on green electricity generation vary across regions. Specifically, in the non-eastern region, the positive correlation between the ESM and green electricity generation is significantly positive and robust, as evidenced by the ESM increasing green electricity generation by 0.480 units at a significance level of 1%. In contrast, the effects of the pilot initiative on green electricity generation obtained with the full sample are insignificant. Both the unconditional regression results and those incorporating control variables indicate the same outcome.
The outcome that the ESM promotes green electricity generation in non-eastern areas is in line with expectations. To illustrate, the non-eastern region, endowed with abundant hydropower, wind power, and solar energy resources, coupled with sparse populations and lower land costs [32], is well-suited for constructing hydropower, wind power, and photovoltaic power stations. Specifically, wind energy in China is mainly distributed in Inner Mongolia, Gansu, Xinjiang, and other non-eastern places. Qinghai, Xizang, Sichuan, Yunnan, and other non-eastern places are abundant in solar energy, suitable for photovoltaic power generation. The southwestern regions, such as the Jinsha River, Yalong River, and others, have luxuriant hydropower resources and are major zones for hydropower development. Meanwhile, China faces wind and solar power curtailment primarily in non-eastern regions such as Xinjiang, Gansu, and Inner Mongolia, and confronts abandoned water issues in Sichuan and Yunnan. Given that electricity spot trading can effectively mitigate challenges related to green electricity consumption [24], this estimation outcome is reasonable.
The nationwide impact of the ESM on green electricity generation is positive, yet it has not passed the significance test. While the ESM hinders green electricity generation in the eastern region, both the regression results with control variables and the unconditional regression results fail to achieve significance, suggesting that the negative impact on green electricity in the eastern region lacks robustness. This implies that the ESM may not have uniformly improved supply–demand balance across all regions. The reason is that the eastern region has an enormous population, prosperous industries, and advanced technology, resulting in a stronger ability to absorb green electricity compared to other regions. However, this does not mean that the eastern region can relax its vigilance in the ESM construction and green-energy transition. With the further increase in installed capacity of green electricity, especially nuclear power, the uncertainty of source and load is further enhanced. Against the backdrop of ensuring supply–demand balance, the demand to optimize resource allocation to a greater extent through market-oriented means will intensify. Furthermore, the estimation results in the eastern region may be attributed to limited room for improvement, given the high level of market competition in China’s eastern areas [33]. The overall insignificant impact across the country could be explained by the pilot’s failure to significantly influence the supply–demand balance in the eastern regions. Therefore, China should draw on the mature experience of the international electricity market to unify the national electricity market and promote cross-provincial and cross-regional electricity spot trading.
4.2. Robustness Checks
Given that the ESM significantly influences green electricity generation solely in non-eastern regions, this paper primarily focuses on verifying the robustness of this conclusion. We conduct a series of robustness checks, including examining parallel trends, applying alternative regression methods, and conducting placebo tests.
4.2.1. Parallel Trend Test
The premise for using the DID model is that the treatment group and the control group have the same time trend before the policy occurs. Hence, we need to perform parallel trend testing first. This paper uses the event study method to examine the impact of the ESM on green electricity generation, following Angrist and Pischke (2008) [34]. The test model is shown in Equation (2):
where Di,t+j is a dummy variable indicating the period before and after the pilot operation of the ESM. Specifically, if region i conducts pilot projects during period t + j, the value of this variable is 1; otherwise, it is 0. A negative value of j represents the j years before the pilot operation of the ESM. a0, bj and a1 are the parameters to be estimated in Equation (2). Other symbols are the same as previously mentioned. In addition, 2018 has been chosen as the benchmark group to avoid collinearity issues.
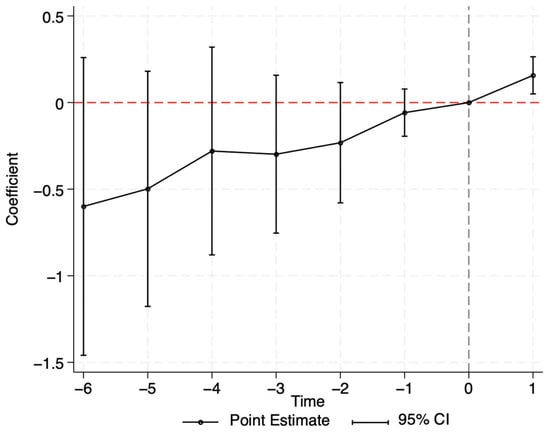
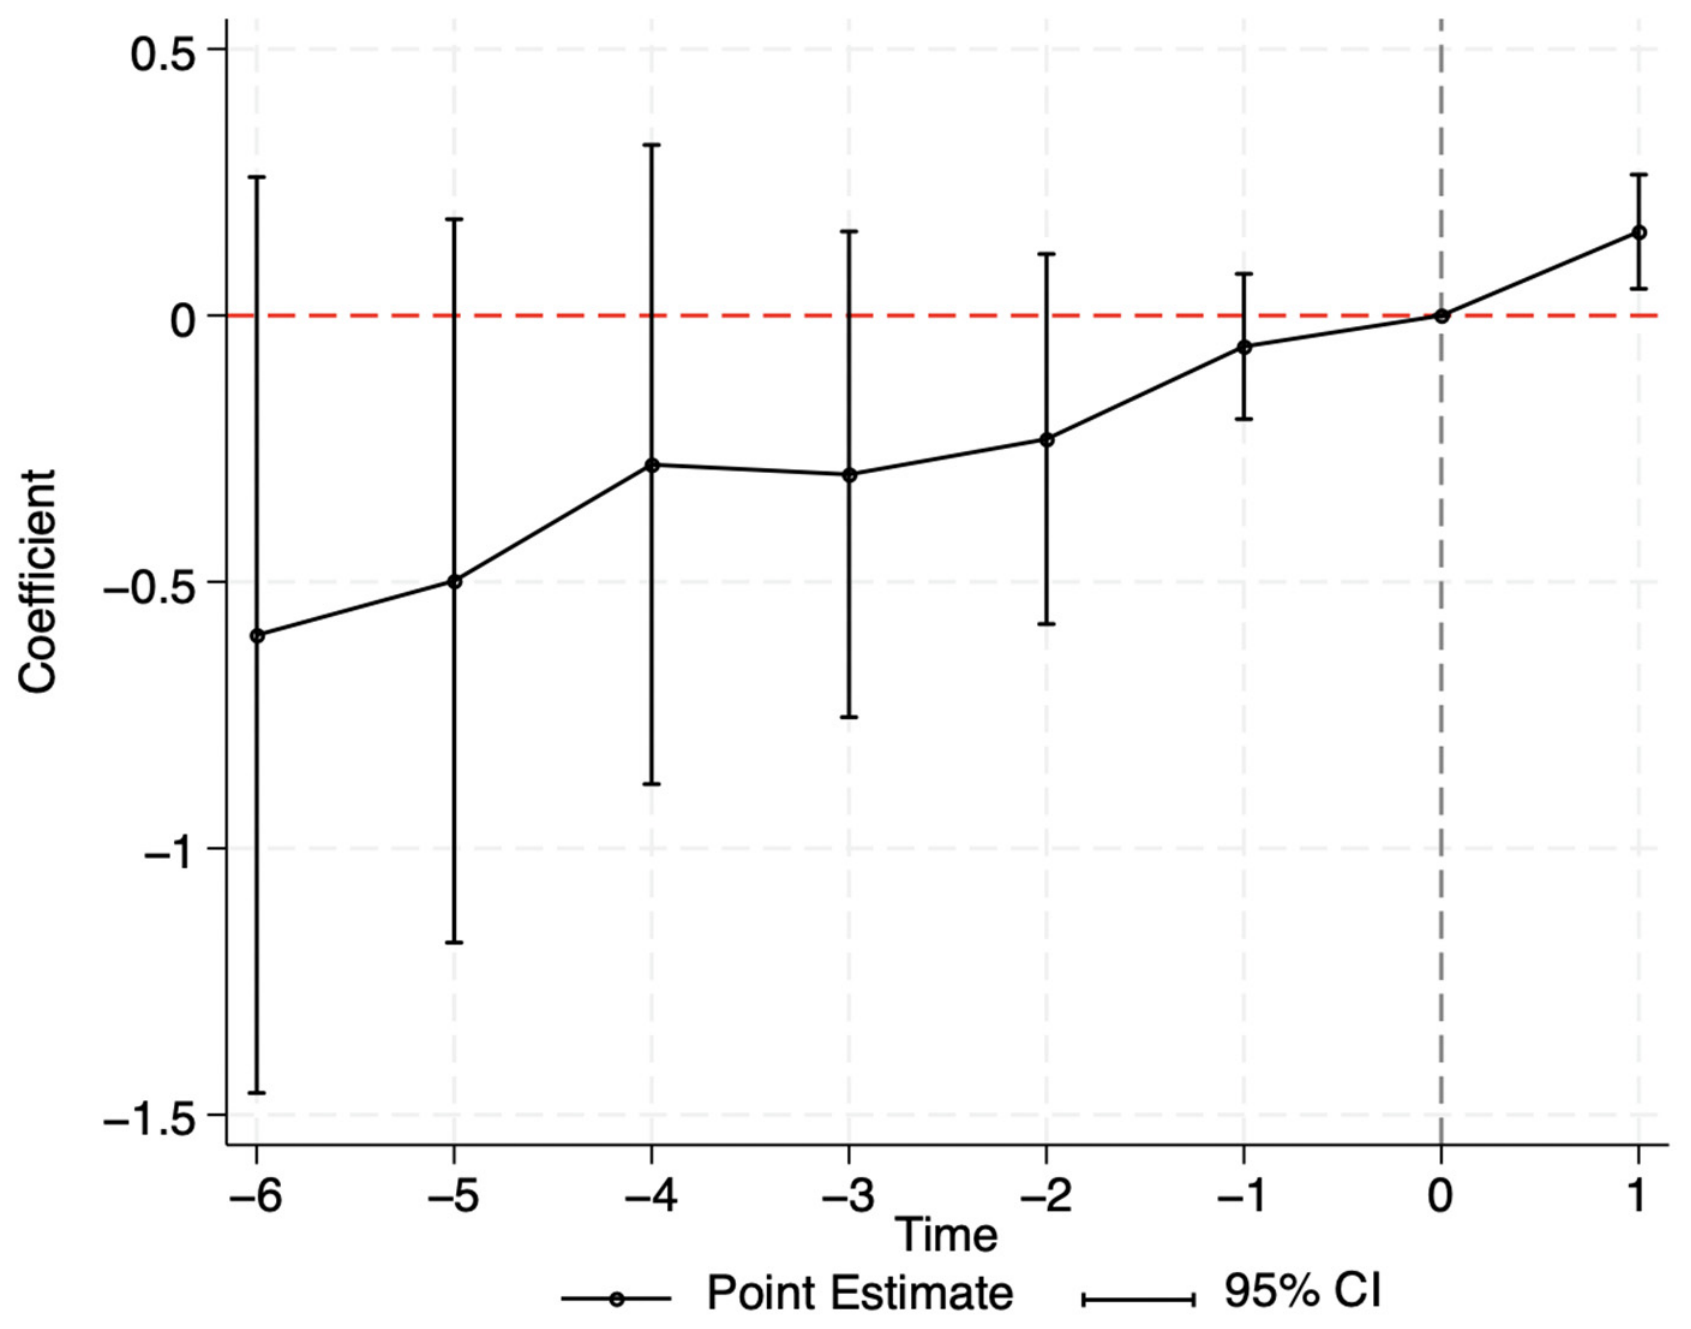
According to Beck et al. (2010) [35], parallel trends are concentrated before policy implementation. Thus, if the coefficient of Di,t+j before the operation of the pilot policy for the ESM is not significant, it demonstrates that the date passes the parallel trend test [36]. From Figure 2, the 95% confidence interval contains a value of 0, indicating that the coefficients of Di,t+j in the 6 years before the pilot operation do not pass the significance test. In other words, the pilot regions and non-pilot regions displayed a similar trend in green electricity generation; therefore, the data in this paper passes the parallel trend test.
Figure 2.
Parallel trend test.
4.2.2. Verification Based on the Psm-Did Method
In this part, we employ the PSM-DID model to verify the robustness of the benchmark results and address the selection bias inherent in the DID model when the government selects the pilot list of the ESM. This model comprehensively considers the differences in control variables across provinces and matches samples year by year to obtain the control group and treatment group with minimal systematic differences. This approach not only mitigates the sample selection bias but also solves potential endogeneity issues that may exist in the benchmark model [37]. Specifically, we first regress the dummy variable indicating the inclusion in the electricity spot trading pilot list against each control variable using a logit model to calculate the propensity score [38]. We then remove from the sample the provinces with unqualified propensity scores and conduct the regression again.
The matching results, detailed in Table A4, suggest that the absolute values of the standard bias for all covariates, except the industrial structure factor, fall below 10% after being matched. This indicates that both matching covariates and matching approach are reasonably selected. Additionally, the results of the t-test confirm the null hypothesis that there is no systematic difference between the treatment group and the control group, implying that this matching result is desirable.
The regression results obtained with these matched data are presented in column (1) of Table 3. The estimation results by the PSM-DID model reveal that the sign of the coefficients for the ESM in the non-eastern region is significantly positive. This robust finding further indicates that the implementation of the ESM has had a favorable impact on green electricity in these regions.
Table 3.
Robustness checks: PSM-DID model and remeasuring variables.
4.2.3. Variables Remeasured with Alternative Methods
To further verify the robustness of the above findings, we reexamine the estimation results using alternative methods for measuring variables. Firstly, we remeasure the dependent variable. Specifically, we replace ge with the decarbonization rate of power generation (represented with dec). The dec is calculated as the ratio of total clean energy generation to total power generation. Then the causal relationship between dec and GE is checked based on the benchmark model (1). The associated estimates are reported in column (2) of Table 3, where the results are consistent with those in Table 2, which displays the estimation results of the benchmark model. After re-evaluating the explanatory variables, the positive correlation between the ESM and green electricity generation is robust at a significance level of 1%.
Furthermore, we have also replaced the control variables that could be measured differently. Specifically, we use the ratio of the added value of the secondary industry to GDP (denoted as rind) to replace ind and apply the natural logarithm of per capita domestic patent application authorization (represented with lnrd) to substitute tec. Based on this, we conduct the matching again with the updated control variables and run the regressions using the DID method. The findings are detailed in Table 3, where column (3) illustrates that the regression coefficient of the core explanatory variable is still positive, at least at the 1% level. After re-evaluating the control variables, the ESM still significantly promoted green electricity generation by 0.45 units.
4.2.4. Placebo Test
When using the DID model to evaluate the effects of the ESM on green electricity generation, it is crucial to rule out spurious regression results caused by unobservable confounding factors or selection bias. To ensure this, we conduct a placebo test to verify whether the observed effect in non-eastern regions can genuinely be attributed to the pilot policy. Following the methodology of Zheng et al. (2022) [39], we construct a fictitious treatment group and re-estimate the causal relationship using the same specification as in Equation (1). To minimize the influence of omitted variables, we draw 400 random samples from the original dataset when fabricating the treatment group. If the estimated effect of the placebo treatment is statistically insignificant, this suggests that the results in Table 2 are reliable. Conversely, significant results would imply potential issues such as omitted variable bias or selection bias.
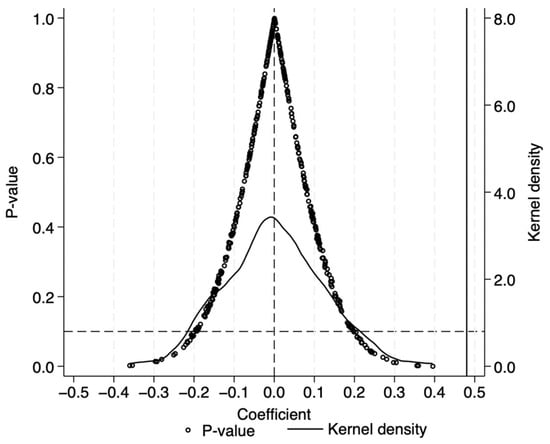
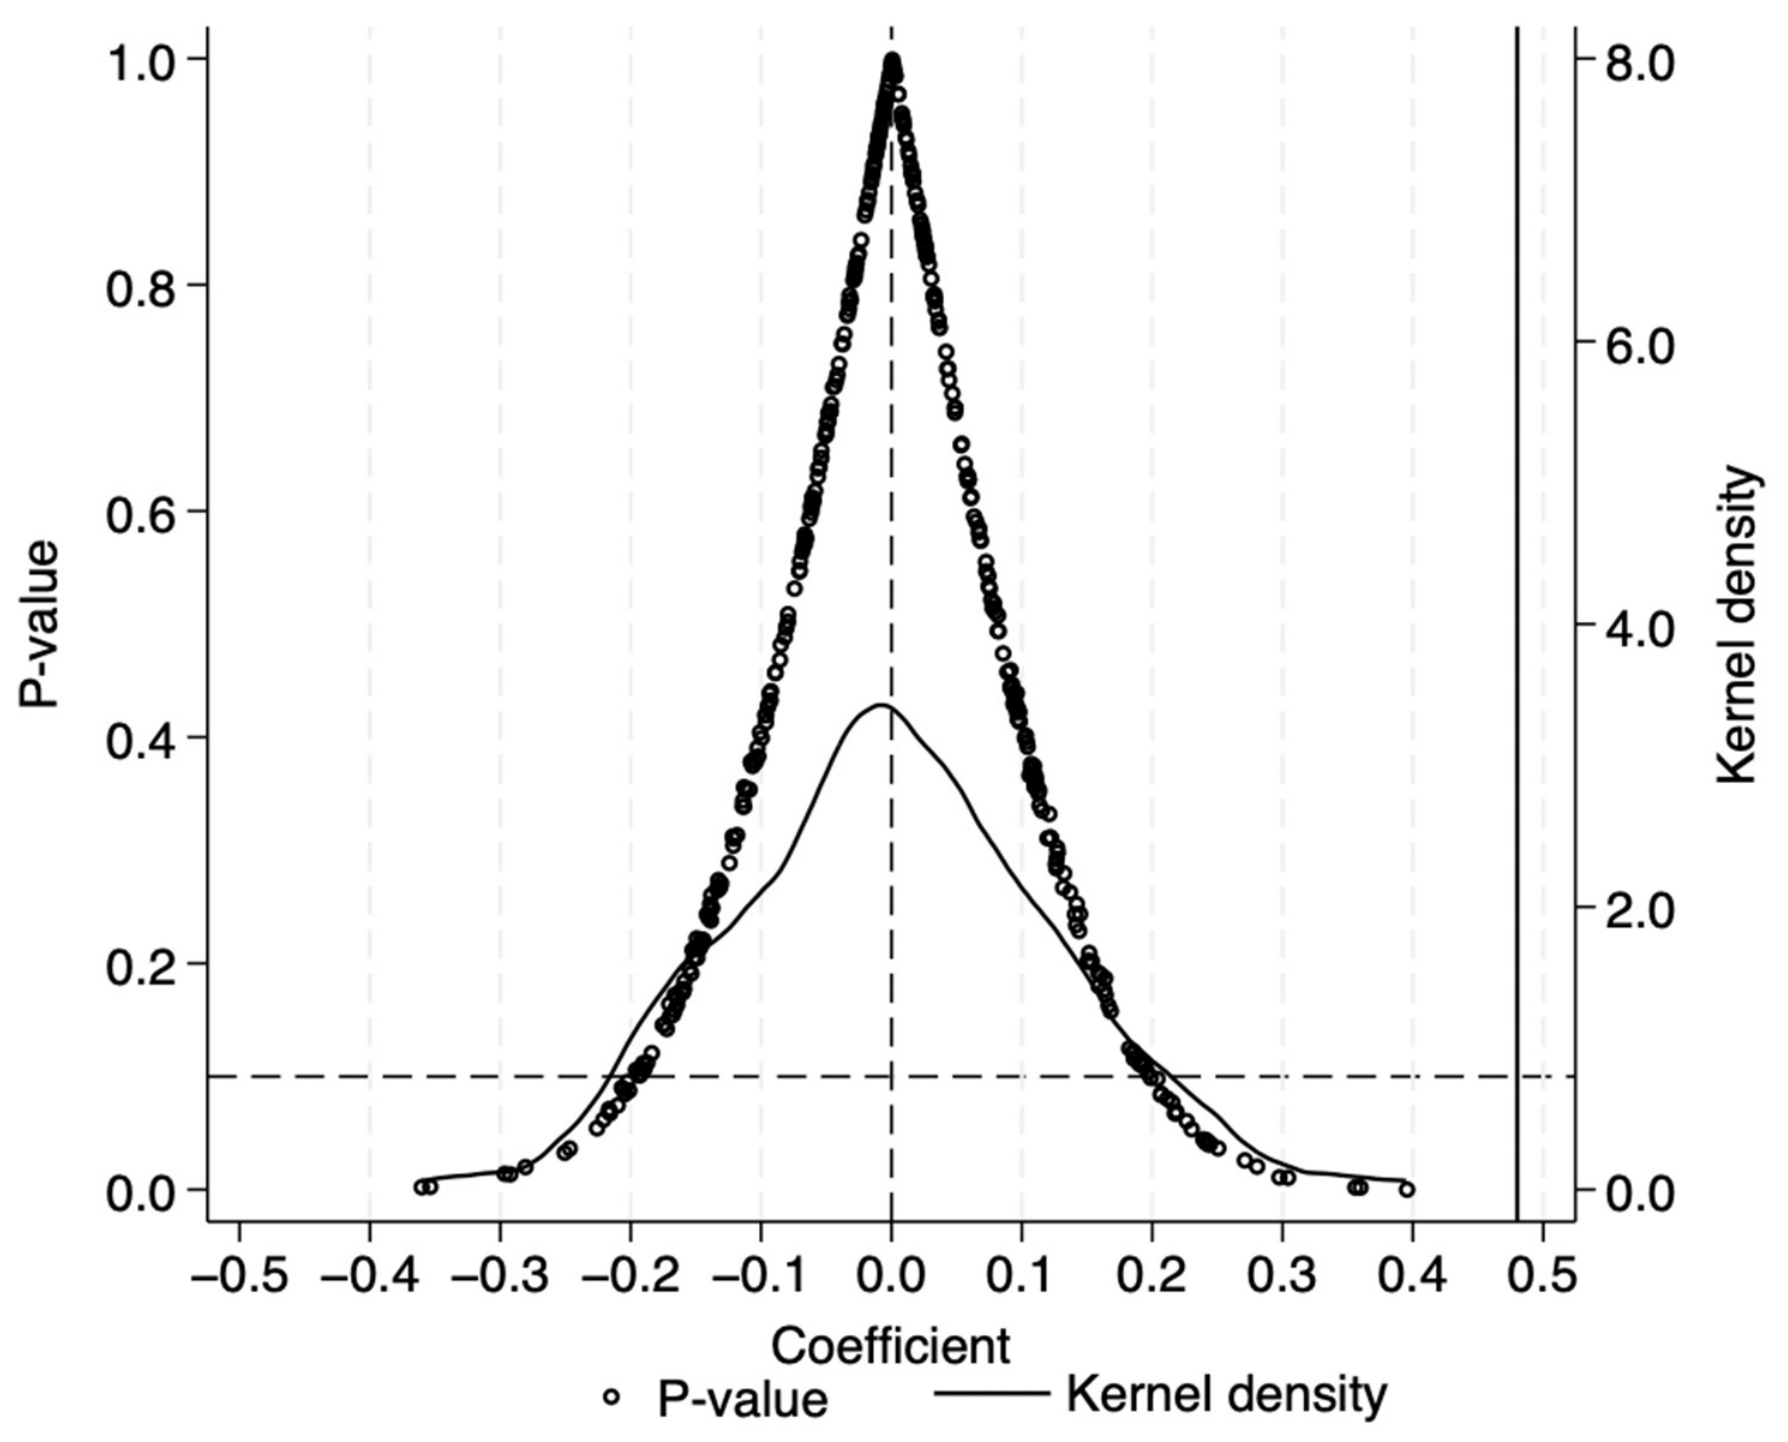
Figure 3 presents the regression results of the ESM on green electricity generation using the fabricated treatment group. In the figure, the hollow circles represent the regression coefficients, while the curve illustrates the kernel density distribution. The solid vertical line marks the true estimated value (i.e., 0.480) from column (6) of Table 2. The dashed vertical line indicates the 10% significance level. The left Y-axis shows the p-values associated with the regression coefficients, while the right Y-axis corresponds to their kernel density. The X-axis represents the regression coefficients.
Figure 3.
Placebo test.
According to Figure 3, the coefficients from the 400 placebo samples generally follow a normal distribution. Most p-values exceed 0.1, indicating that the placebo estimates are not statistically significant. Moreover, the actual coefficient of 0.480 appears as a clear outlier relative to the distribution of placebo estimates. These results collectively suggest that the baseline findings in Table 2 are unlikely to be driven by unobservable confounding factors or selection bias, thereby reinforcing the robustness of our conclusions.
5. Further Discussions
5.1. Possible Mechanisms
5.1.1. The Mediation Model Used in Mechanism Tests
To check if Hypothesis 2 holds true, we will apply the mediation model, the primary method for testing impact mechanisms. This model allows us to examine how the mediator explains the relationship between the independent and dependent variables, as described by Zheng et al. (2024) [40]. This model is set as follows:
where Y is a set of control variables, including all control variables in the benchmark model of Equation (1) except the mediator variables M. M represents possible mediator variables, including enes and gov. αk, γk, and βk (k = 0, 1, 2 in the third and fourth equations, and 0, 1, 2, 3 in the fifth equation) denote the parameters to be estimated in Equations (3), (4), and (5), respectively. The residual error terms are indicated by μ, τ, and ε. The meanings of other symbols are the same as above. If α1, γ1, and β2 are significant, and the absolute value of β1 is smaller than that of α1 or the significance level of β1 is lower than that of α1, the mechanism tests pass [41]. In other words, the ESM affects green electricity generation by influencing mediator variables.
geit = α0 + α1dudtit + α2Yit + vi + θt + μit
Mit = γ0 + γ1dudtit + γ2Yit + vi + θt + τit
5.1.2. Mechanism Test Results
It is evident that Equation (5) is equivalent to Equation (1), so the value of β1 corresponds to the coefficient of 0.480 for dudt in Table 2. If M = enes, the value of β2 is equal to 5.515 in Table 2; if M = gov, the value of β2 is equal to −1.114 in Table 2. Hence, we will not provide the estimation results of Equation (5) in Table 4 again. The estimation results in column (1) of Table 4 show that the value of α1 is 0.524, surpassing the threshold 0.480 and passing the 1% significance test. Meanwhile, column (2) of Table 4 indicates the ESM significantly reduces government intervention by 0.133 units. The results in columns (1) and (2) confirm the presence of a mediating effect. Therefore, government intervention mediates the impact of the ESM on green electricity generation. This finding is reasonable, as spot trading shifts power to the market, reducing government intervention, and less government intervention promotes green electricity generation.
Table 4.
Mechanism tests of the impact of the ESM on green electricity generation.
Similarly, the adjustment of the energy consumption structure also serves as the mechanism through which the ESM affects green electricity generation in the non-eastern region. As indicated in column (3) of Table 4, the ESM positively affects green electricity generation, leading to promotion of green electricity production (0.510 > 0.480). In addition, the results in column (4) illustrate that the creation of ESM results in a rise in electricity demand, consequently increasing the proportion of electricity consumption to total energy consumption by 0.009 units. This outcome is understandable, as the ESM can bridge regional information gaps and resolve temporary supply–demand imbalances, leading to a higher share of green electricity in total energy consumption.
5.2. Moderating Effects of the ESM
5.2.1. The Model for Moderating Effects Tests
Green electricity generation is closely related to urbanization [42] and industrial structure [43], as these factors underpin it by providing robust infrastructure, advanced technologies, skilled labor, and project-specific investments. Notably, urbanization and industrial structure exert heterogeneous impacts on green electricity generation across electricity trading markets. In the ESM, real-time pricing reconciles the intermittency of green electricity with rapid growth in urban electricity demand, supplying low-cost clean energy for urban use and mitigating energy and environmental pressures driven by urbanization. Moreover, price signals and trading mechanisms help alleviate constraints on green electricity consumption in high-energy-consuming regions, while inter-provincial trading and capacity compensation mechanisms strengthen the supply of green electricity to support regional industrial upgrading. Hence, we will examine whether the ESM moderates the impacts of urbanization and industrial structure on green electricity generation.
To achieve this goal, we incorporate interaction items into the benchmark model in Equation (1), following Balli et al. (2013) [44]. First, we perform mean centering on the continuous variables (i.e., urbanization level and industrial structure denoted with urb and ind, respectively), resulting in processed variables (denoted as nurb and nind, respectively), to address collinearity issues between interaction terms and main effects. Next, we multiply these processed variables (i.e., nurb and nind) by dudt. The models are specified as follows:
where βk and αk (k = 0, 1, 2, 3, 4) denote the parameters to be estimated in Equations (6) and (7), respectively. The residual error terms are indicated by ε and μ. Other symbols retain the same meanings as in Equation (1). The estimates are reported in Table 5 and discussed in Section 5.2.2.
Table 5.
Moderating effects: urbanization and industrial structure.
5.2.2. Estimation Results of Moderating Effects
Column (1) of Table 5 shows that in non-pilot areas, the green electricity generation decreases due to urbanization development. Specifically, for every 1 unit increase in urbanization level, the green electricity generation decreases by 2.540 units. This may be because urbanization progress crowds out efforts to accelerate clean energy development and hinders the green-energy transition [45]. However, the coefficient of nurb.dudt is significantly positive at the 1% level, indicating that green electricity in pilot areas benefits from urbanization level compared to non-pilot areas (6.554 − 2.540 > 0). This outcome is reasonable, as in pilot areas, trading electricity in spot mode requires advanced equipment and trading mechanisms to ensure timely delivery for sudden orders, all of which depend on urban infrastructure. Moreover, higher urbanization levels lead to greater negative externalities, such as environmental pollution, increasing the demand for clean energy [46]. When the complementary effects and the demand for clean energy overweigh the crowding-out effect, urbanization in pilot areas increases green electricity generation.
As revealed in column (2) of Table 5, the increase of 1 unit in the proportion of added value in the secondary industry hinders green electricity generation in non-pilot areas by 0.554 units. The coefficient of 2.732 for the nind.dudt is also significantly positive at the 1% level, indicating that the operation of the ESM mitigates the secondary industry’s negative impact on green electricity generation. A higher output value in the secondary industry consumes more fossil energy, thereby hindering regional energy transformation. However, the ESM alters the relationship between energy supply and consumption through market-oriented mechanisms, reducing the dependence of regional industrial development on fossil energy. This change ultimately affects the relationship between industrial structure and green electricity generation.
6. Conclusions and Policy Implications
6.1. Conclusions
In theory, the ESM guides the optimal allocation of electricity resources through a pricing mechanism, providing a broader space for the consumption of green electricity, which is conducive to promoting national energy transformation and achieving its economic and environmental benefits. Despite this theoretical basis, empirical testing in the literature remains limited. The ESM pilot policy provides quasi-natural experimental conditions for empirical examination. This study aims to assess whether the ESM effectively promotes green electricity generation by constructing a DID model based on provincial panel data from 1998 to 2021. The key conclusions are outlined as follows. Firstly, the ESM can promote green electricity generation, yet this effect varies across regions. Due to differences in resource endowments and the characteristics of participants in the pilot regions, this initiative exhibits a significant positive impact solely in China’s non-eastern region. Secondly, the mediation models indicate that the ESM in the non-eastern region primarily fosters green electricity generation by reducing government intervention and altering the energy consumption structure. Thirdly, employing interaction terms, it is demonstrated that the ESM mitigates the adverse effects of urbanization and secondary industry growth on green electricity generation.
6.2. Policy Implications
The implications for policymakers based on the highlighted findings are given as follows.
First, the positive effects of the ESM highlight the merits of scaling up such pilot initiatives. This offers persuasive evidence for policymakers, particularly in other nations facing energy consumption challenges and yet to complete marketization reforms, to consider large-scale implementation. Gradually broadening pilot coverage enables a more comprehensive assessment of the ESM’s performance in advancing energy transition, laying solid groundwork for future efforts to overcome resource and environmental constraints and deliver sustainable development.
Second, to advance sustainable energy development, it is essential to reduce excessive government intervention and optimize energy consumption structures. Specifically, unified national market standards should be established while fully accommodating regional heterogeneity to guarantee fair market competition and facilitate a steady transition toward a green energy economy. On the one hand, policymakers should encourage and support new energy firms to participate in green electricity trading and cross-regional energy consumption, thereby realizing the market value of green power through market-oriented mechanisms. On the other hand, power grid enterprises need to optimize green power dispatching strategies and grid-connection procedures to ensure the effective integration and efficient utilization of renewable electricity.
Third, competent authorities should coordinate the interplay between the ESM and urbanization, as well as between the ESM and industrial structure, so that positive interactions can yield complementary benefits. On the one hand, authorities need to strengthen distribution network resilience by expanding power grid capacity in alignment with urban planning and charging infrastructure development. Rural energy absorption capacity also merits attention. Accelerated upgrading and retrofitting of rural power grids alongside continuous grid structure optimization can boost local consumption of distributed green energy resources. On the other hand, fostering high-efficiency clean industries plays an irreplaceable role in scaling up green power consumption. Accordingly, governments ought to support enterprises in pursuing transformation and upgrading. Policymakers should build institutional mechanisms that reconcile energy transition with industrial upgrading, and promote integrated planning and deployment of high-end industries and green energy projects to achieve concurrent optimization of industrial structure and cleaner energy consumption patterns.
Author Contributions
Conceptualization, L.W. and X.F.; methodology, L.W.; validation, L.W. and X.F.; formal analysis, L.W.; investigation, L.W. and X.F.; resources, X.F.; data curation, L.W.; writing—original draft preparation, X.F.; writing—review and editing, L.W.; funding acquisition, X.F. All authors have read and agreed to the published version of the manuscript.
Funding
This research was funded by the National Natural Science Foundation of China, grant number 72003156.
Data Availability Statement
Carbon dioxide emissions data are sourced from the China Emission Accounts and Datasets (CEADs) (https://www.ceads.net.cn). Other data supporting the findings of this study are openly available in the China Statistical Yearbook, China Energy Statistical Yearbook, China Electric Power Statistical Yearbook, and China Science and Technology Statistical Yearbook. These statistical yearbooks are accessible for download via China National Knowledge Infrastructure (https://www.cnki.net).
Conflicts of Interest
The authors declare no conflicts of interest.
Appendix A
Table A1.
The provinces, times and roles of China’s first batch of the ESM.
Table A2.
Variables symbols and data processing.
Table A3.
The robustness analysis: staggered DID.
Table A4.
Propensity score matching of controlled variables.
References
- Dhayal, K.S.; Giri, A.K.; Esposito, L.; Agrawal, S. Mapping the significance of green venture capital for sustainable development: A systematic review and future research agenda. J. Clean. Prod. 2023, 396, 136489. [Google Scholar] [CrossRef] [Scilit]
- Moore, M.R.; Lewis, G.M.D.; Cepela, D.J. Markets for renewable energy and pollution emissions: Environmental claims, emission-reduction accounting, and product decoupling. Energy Policy 2010, 38, 5956–5966. [Google Scholar] [CrossRef] [Scilit]
- Gu, J.; Renwick, N.; Xue, L. The BRICS and Africa’s search for green growth, clean energy and sustainable development. Energy Policy 2018, 120, 675–683. [Google Scholar] [CrossRef] [Scilit]
- Mewton, R.T.; Cacho, O.J. Green Power voluntary purchases: Price elasticity and policy analysis. Energy Policy 2011, 39, 377–385. [Google Scholar] [CrossRef] [Scilit]
- Peng, X.; Tao, X.; Feng, K.; Hubacek, K. Drivers toward a Low-Carbon Electricity System in China’s Provinces. Environ. Sci. Technol. 2020, 54, 5774–5782. [Google Scholar] [CrossRef] [Scilit]
- Zhang, J.; Zheng, Y. The flexibility pathways for integrating renewable energy into China’s coal dominated power system: The case of Beijing-Tianjin-Hebei Region. J. Clean. Prod. 2020, 245, 118925. [Google Scholar] [CrossRef] [Scilit]
- Liu, L.; Zhao, Y.; Chang, D.; Xie, J.; Ma, Z.; Sun, Q.; Yin, H.; Wennersten, R. Prediction of short-term PV power output and uncertainty analysis. Appl. Energy 2018, 228, 700–711. [Google Scholar] [CrossRef] [Scilit]
- Yang, T.; Yang, Z.; Li, F.; Wang, H. A short-term wind power forecasting method based on multivariate signal decomposition and variable selection. Appl. Energy 2024, 360, 122759. [Google Scholar] [CrossRef] [Scilit]
- Xu, R.; Song, Z.; Tang, Q.; Yu, Z. The cost and marketability of renewable energy after power market reform in China: A review. J. Clean. Prod. 2018, 204, 409–424. [Google Scholar] [CrossRef] [Scilit]
- Bégin, J.-F.; Gómez, F.; Ignatieva, K.; Li, H. The stochastic behavior of electricity prices under scrutiny: Evidence from spot and futures markets. Energy Econ. 2025, 144, 108296. [Google Scholar] [CrossRef] [Scilit]
- Siddiki, J.; Singh, P. The cost of uncertainty: Analysing the influence of coal price changes, the Russia-Ukraine war and geopolitical risk on risk premiums in the Indian electricity spot market. Energy Econ. 2025, 141, 108129. [Google Scholar] [CrossRef] [Scilit]
- Hu, F.; Zhao, Y.; Huang, C.; Cui, S.; Ding, Q.; Li, Y. Market power detection and mitigation measures for the spot electricity market based on bidding equilibrium. Energy 2024, 305, 132184. [Google Scholar] [CrossRef] [Scilit]
- Song, J.; Zheng, W.; Chen, M.; Qi, L.; Zou, Q. Analysis of collusive bidding characteristics in the power spot market based on multi-agent reinforcement learning simulation. Electr. Eng. 2025, 107, 10069–10090. [Google Scholar] [CrossRef] [Scilit]
- Menz, F.C.; Vachon, S. The effectiveness of different policy regimes for promoting wind power: Experiences from the states. Energy Policy 2006, 34, 1786–1796. [Google Scholar] [CrossRef] [Scilit]
- Marques, A.C.; Fuinhas, J.A.; Pires Manso, J.R. Motivations driving renewable energy in European countries: A panel data approach. Energy Policy 2010, 38, 6877–6885. [Google Scholar] [CrossRef] [Scilit]
- Kılkış, Ş.; Krajačić, G.; Duić, N.; Rosen, M.A.; Al-Nimr, M.A. Advancements in sustainable development of energy, water and environment systems. Energy Convers. Manag. 2018, 176, 164–183. [Google Scholar] [CrossRef] [Scilit]
- Alharbi, S.S.; Al Mamun, M.; Boubaker, S.; Rizvi, S.K.A. Green finance and renewable energy: A worldwide evidence. Energy Econ. 2023, 118, 106499. [Google Scholar] [CrossRef] [Scilit]
- Du, J.; Shen, Z.; Song, M.; Vardanyan, M. The role of green financing in facilitating renewable energy transition in China: Perspectives from energy governance, environmental regulation, and market reforms. Energy Econ. 2023, 120, 106595. [Google Scholar] [CrossRef] [Scilit]
- Xu, L.; Wu, Y. Nexus between green finance, renewable energy and carbon emission: Empirical evidence from selected Asian economies. Renew. Energy 2023, 215, 118983. [Google Scholar] [CrossRef] [Scilit]
- Mi, R.; Ahammad, H.; Hitchins, N.; Heyhoe, E. Development and deployment of clean electricity technologies in Asia: A multi-scenario analysis using GTEM. Energy Econ. 2012, 34, S399–S409. [Google Scholar] [CrossRef] [Scilit]
- Su, X.; Zhao, Y. What has the strongest connectedness with clean energy? Technology, substitutes, or raw materials. Energy Econ. 2023, 128, 107169. [Google Scholar] [CrossRef] [Scilit]
- Heggarty, T.; Bourmaud, J.-Y.; Girard, R.; Kariniotakis, G. Quantifying power system flexibility provision. Appl. Energy 2020, 279, 115852. [Google Scholar] [CrossRef] [Scilit]
- Bichler, M.; Knörr, J. Getting prices right on electricity spot markets: On the economic impact of advanced power flow models. Energy Econ. 2023, 126, 106968. [Google Scholar] [CrossRef] [Scilit]
- Chen, Q.; Fang, X.; Guo, H.; Wang, X.; Yang, Z.; Cao, R.; Xia, Q. Progress and key issues in the construction of electricity spot market. Autom. Electr. Power Syst. 2021, 45, 3–15. (In Chinese) [Google Scholar] [CrossRef]
- Ly, Y.; Zhu, C.; Zhang, K.; Yang, Z. The Impact of Electricity Marketization Reform on Carbon Emission—A Quasi-Natural Experiment Based on Electricity Spot Market Construction. Pol. J. Environ. Stud. 2024, 10, 15244. [Google Scholar] [CrossRef] [Scilit]
- Kong, G.; Wang, S.; Wang, Y. Fostering firm productivity through green finance: Evidence from a quasi-natural experiment in China. Econ. Model. 2022, 115, 105979. [Google Scholar] [CrossRef] [Scilit]
- Sanz, C.; Solé-ollé, A.; Sorribas-navarro, P. Betrayed by the elites: How corruption amplifies the political effects of recessions. Comp. Polit. Stud. 2022, 55, 1095–1129. [Google Scholar] [CrossRef] [Scilit]
- Wang, Y. Renewable electricity in Sweden: An analysis of policy and regulations. Energy Policy 2006, 34, 1209–1220. [Google Scholar] [CrossRef] [Scilit]
- Van Ruijven, B.; Van Vuuren, D.P. Oil and natural gas prices and greenhouse gas emission mitigation. Energy Policy 2009, 37, 4797–4808. [Google Scholar] [CrossRef] [Scilit]
- Wang, W.; Moreno-Casas, V.; Huerta De Soto, J. A Free-Market Environmentalist Transition toward Renewable Energy: The Cases of Germany, Denmark, and the United Kingdom. Energies 2021, 14, 4659. [Google Scholar] [CrossRef] [Scilit]
- Yuan, L.; He, Y.; Li, S.; Zhou, J.; Tian, B. Channeling approach of prosumer connection costs considering regional differences in China—Evolutionary game among distributed photovoltaic entities. Energy 2024, 289, 129879. [Google Scholar] [CrossRef] [Scilit]
- Yang, Y.; Zhou, Y. Rising costs, industrial transfer, and structural upgrading: An empirical study based on large and medium-sized cities across the country. China Ind. Econ. 2013, 7, 147–159. (In Chinese) [Google Scholar] [CrossRef]
- Bai, M.; Wang, W. Role of green bonds in developing ESG projects in Eastern provinces of China. Humanit. Soc. Sci. Commun. 2024, 11, 1742. [Google Scholar] [CrossRef] [Scilit]
- Angrist, J.D.; Pischke, J.-S. Mostly Harmless Econometrics: An Empiricist’s Companion; Princeton University Press: Princeton, NJ, USA, 2008. [Google Scholar] [CrossRef] [Scilit]
- Beck, T.; Levine, R.; Levkov, A. Big Bad Banks? The Winners and Losers from Bank Deregulation in the United States. J. Finance 2010, 65, 1637–1667. [Google Scholar] [CrossRef] [Scilit]
- Nunn, N.; Qian, N. The Potato’s Contribution to Population and Urbanization: Evidence From A Historical Experiment. Q. J. Econ. 2011, 126, 593–650. [Google Scholar] [CrossRef] [Scilit]
- Zhou, B.; Zhang, C.; Song, H.; Wang, Q. How does emission trading reduce China’s carbon intensity? An exploration using a decomposition and difference-in-differences approach. Sci. Total Environ. 2019, 676, 514–523. [Google Scholar] [CrossRef] [Scilit]
- Heckman, J.J.; Ichimura, H.; Todd, P.E. Matching As An Econometric Evaluation Estimator: Evidence from Evaluating a Job Training Programme. Rev. Econ. Stud. 1997, 64, 605–654. [Google Scholar] [CrossRef] [Scilit]
- Zheng, X.; Wu, C.; Nepal, R. Did the administrative approval reform in China affect the productivity of energy firms?—A quasi-natural experimental approach. Energy Econ. 2022, 105, 105564. [Google Scholar] [CrossRef] [Scilit]
- Zheng, X.; Wang, L.; Hou, J.; Nepal, R. Capacity utilization rate and company performance before the COVID-19 economic crisis: Evidence from listed companies in China’s electricity industry. Energy Econ. 2024, 131, 107348. [Google Scholar] [CrossRef] [Scilit]
- Baron, R.M.; Kenny, D.A. The moderator–mediator variable distinction in social psychological research: Conceptual, strategic, and statistical considerations. J. Pers. Soc. Psychol. 1986, 51, 1173–1182. [Google Scholar] [CrossRef]
- Feng, Y.; Yuan, H.; Liu, Y.; Zhang, S. Does new-type urbanization policy promote green energy efficiency? Evidence from a quasi-natural experiment in China. Energy Econ. 2023, 124, 106752. [Google Scholar] [CrossRef] [Scilit]
- Xue, W.; Zhang, J.; Zhong, C.; Li, X.; Wei, J. Spatiotemporal PM2.5 variations and its response to the industrial structure from 2000 to 2018 in the Beijing-Tianjin-Hebei region. J. Clean. Prod. 2021, 279, 123742. [Google Scholar] [CrossRef] [Scilit]
- Balli, H.O.; Sørensen, B.E. Interaction effects in econometrics. Empir. Econ. 2013, 45, 583–603. [Google Scholar] [CrossRef] [Scilit]
- Pata, U.K.; Karlilar, S.; Kartal, M.T. On the road to sustainable development: The role of ICT and R&D investments in renewable and nuclear energy on energy transition in Germany. Clean Technol. Environ. Policy 2024, 26, 2323–2335. [Google Scholar] [CrossRef] [Scilit]
- Zhang, N.; Yu, K.; Chen, Z. How does urbanization affect carbon dioxide emissions? A cross-country panel data analysis. Energy Policy 2017, 107, 678–687. [Google Scholar] [CrossRef] [Scilit]
- Callaway, B.; Sant’Anna, P. Difference-in-Differences with multiple time periods. J. Econom. 2021, 225, 200–230. [Google Scholar] [CrossRef] [Scilit]

Disclaimer/Publisher’s Note: The statements, opinions and data contained in all publications are solely those of the individual author(s) and contributor(s) and not of MDPI and/or the editor(s). MDPI and/or the editor(s) disclaim responsibility for any injury to people or property resulting from any ideas, methods, instructions or products referred to in the content. |
© 2026 by the authors. Licensee MDPI, Basel, Switzerland. This article is an open access article distributed under the terms and conditions of the Creative Commons Attribution (CC BY) license.