Abstract
The power system islanding problem aims to divide the power system into several different islands after serious disturbances occur. The objective of this problem is to minimize the total generation-load imbalance of all islands while placing the coherent generators in the same island and maintaining the connectivity of each island. Two main challenges of solving this problem are the large scale of the power system and the requirement of a short computation time. In this study, we propose a tailored tabu search algorithm to solve this problem, which employs a novel initial solution generation procedure and a neighborhood operation based on the movement of the boundary nodes. The numerical experiments on 15 test instances show that this algorithm can deal with the power systems with up to 3120 nodes within 0.7 s. Then, the comparisons with some existing islanding methods based on the IEEE 39-bus system and the IEEE 118-bus system prove the validity and accuracy of our method. Finally, time-domain simulations based on three power systems demonstrate the importance of our tabu search algorithm in minimizing the impacts of the disastrous disturbances. The computational results imply that our tabu search algorithm is very effective and efficient and satisfies the requirements of islanding power systems of various sizes.
1. Introduction
As one of the most complex industry systems in the history of mankind, the modern interconnected power system has gradually evolved into a large-scale and sophisticated power intermediary, consisting of power stations, substations, transmissions, distributions and utilization. The security and reliability of the whole electric system are always the primary concern of the practitioners. Acting as an invisible carrier, the power grid transmits the power to factories and households. So far, the largest synchronous power grid in the world is the Eastern North America power grid, which is composed of the Eastern American Grid and part of the Canada Grid. With the development of the economy and the growing demand for electricity, the nation-wide power network of China has already been constructed. With the current construction pace, China will have a power grid with the largest scale worldwide.
The power systems easily suffer from various external disturbances, such as simultaneous failures of several generators or major transmission lines, human operation errors, control system failures, hidden failures in the protection system and malicious attacks. These disturbances may make the system lose stability and even lead to catastrophic blackout. As the cascaded events evolve, the angle instability, power oscillations and the significant imbalance between the generation and load are very likely to occur, resulting in a widespread voltage collapse and uncontrolled system partitioning [1].
Blackouts have an irretrievably disastrous impact on people’s life and social economy. Many previous studies on blackouts or outages in history, such as the 2003 blackout in North America [2], the 2003 blackout in Italy [3] and the 2006 blackout in Europe [4], indicate that proper and active system splitting could have prevented some blackouts from occurring and reduced the losses significantly [5,6]. When disturbances that can make the power system out of step occur, the control center would automatically and quickly split the interconnected system into several islands by simultaneously tripping the proper transmission lines [7,8]; the resultant islands can operate independently, must satisfy their internal synchronous requirements and must keep the balance of generation and load. Actually, power system splitting can be considered as the last defense to avoid the occurrence of catastrophic blackouts. The core of system splitting is to maintain a state of operating balance between generation power and load power. Each island has a generation-load difference, which is defined as the absolute value of the difference between the generation power and the load power. This generation-load difference is used to measure the imbalance of the island.
The system splitting is a very complicated procedure in the power system. Recently, Sun et al. [9] presented a new unified framework to answer three critical questions in the system splitting, which are: “when to separate?”, “where to separate?” and “what to do after separation?”. This unified framework provides a better idea for studying the system splitting, and the proposed methods in [9] can help either perform the system splitting or predict the unintentional separation. The focus of our paper is to answer the “where” question. Therefore, we are dedicated to finding optimal splitting strategies quickly and precisely given that we have known the coherent generator groups and the post-separation strategies, such as generation reduction and load shedding.
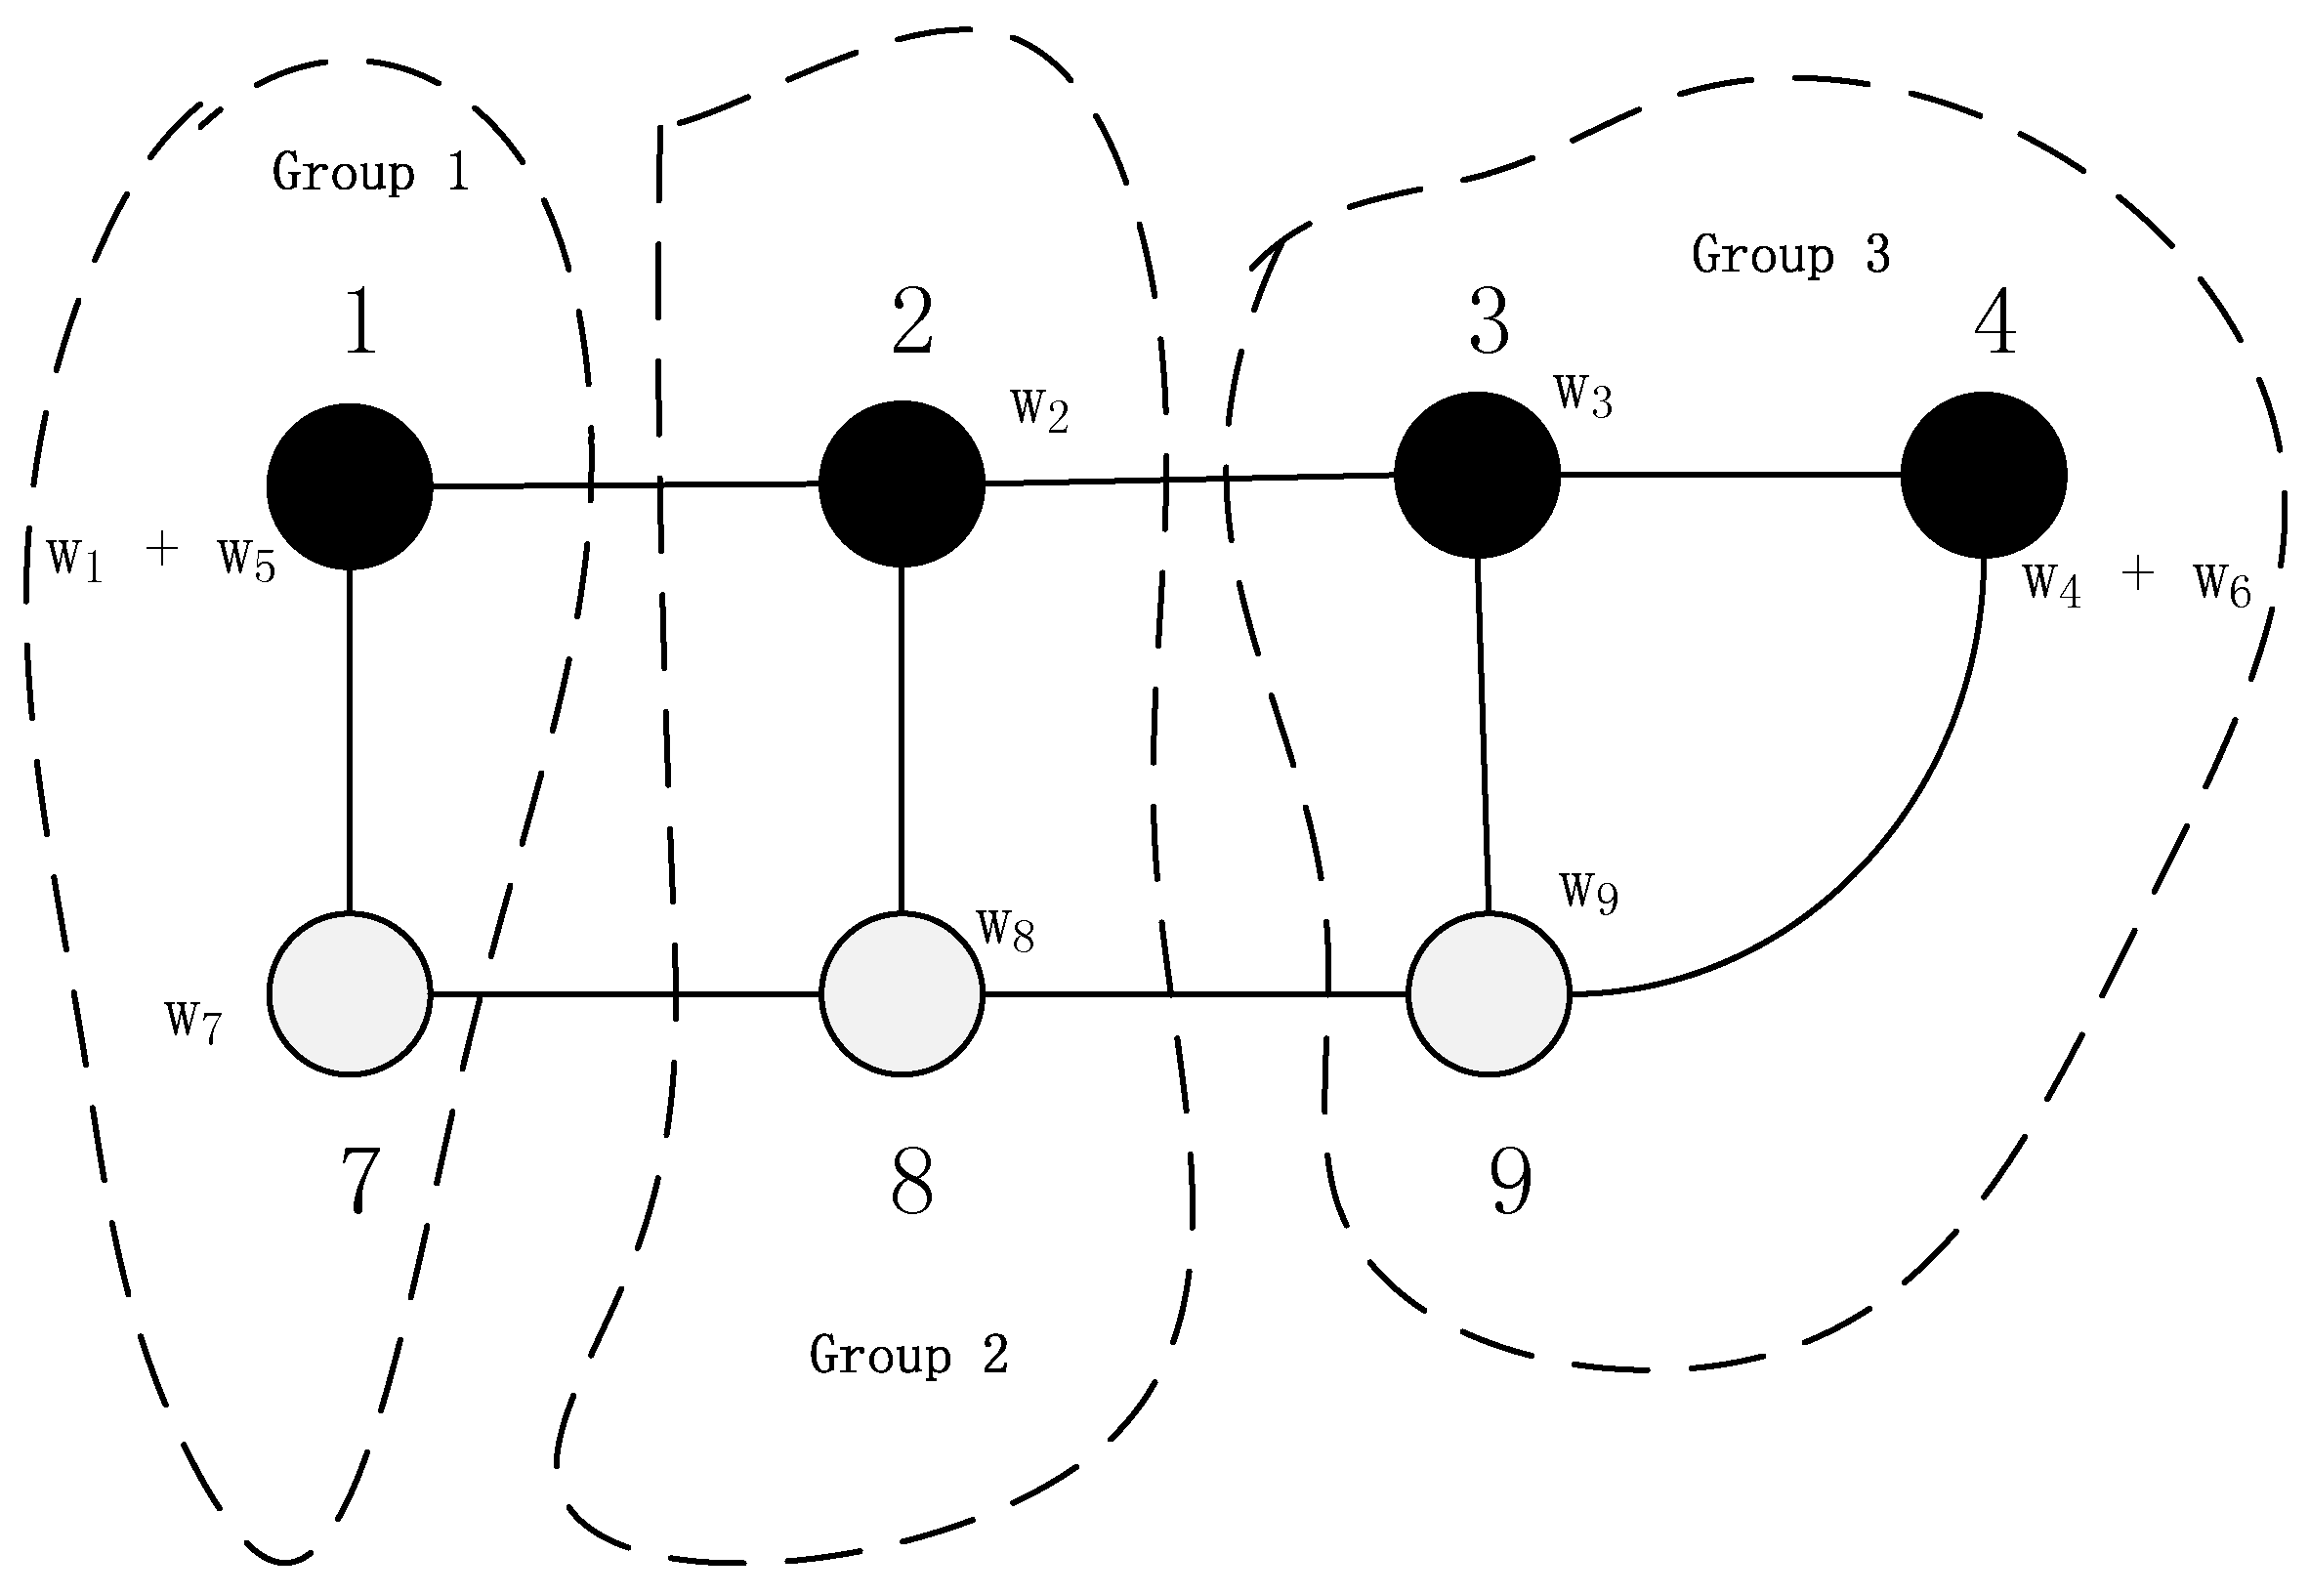
The power system can be converted into a graph, where the nodes represent the generators that produce power and the loads that consume power, and the edges denote the transmission lines of different voltage grades. Each node has an associated weight that indicates the generated or consumed power. A positive (respectively, negative) number is used to indicate the weight of the generator (respectively, load) node. For example, Figure 1 shows a system that includes four generators and seven buses, where – are loads, – are generators and – are associated weights. The corresponding topological graph is given in Figure 2, where the generators and loads are represented by black and white circles, respectively. The generators and loads that are connected to the same bus, e.g., and , can be simplified into an equivalent generator. The weights of the equivalent generators are the net output power; for example, the weight of Node 1 in Figure 2 is equal to –.
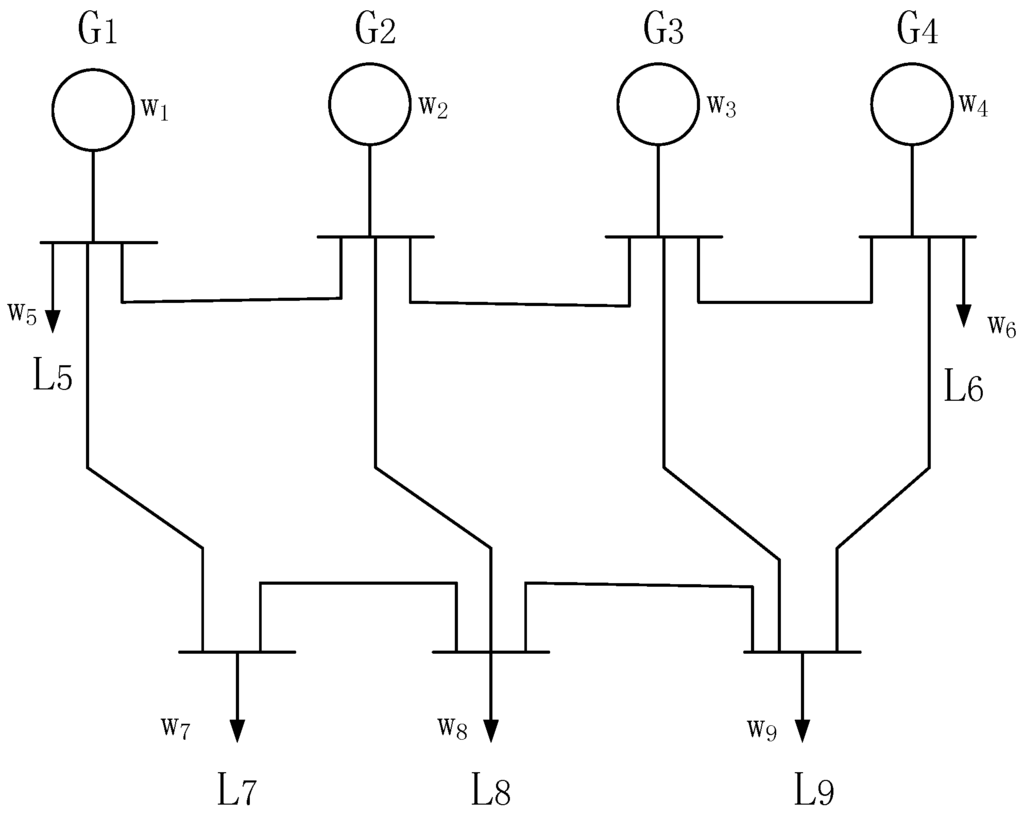
Figure 1.
A four-generator and seven-bus system.
Figure 1.
A four-generator and seven-bus system.
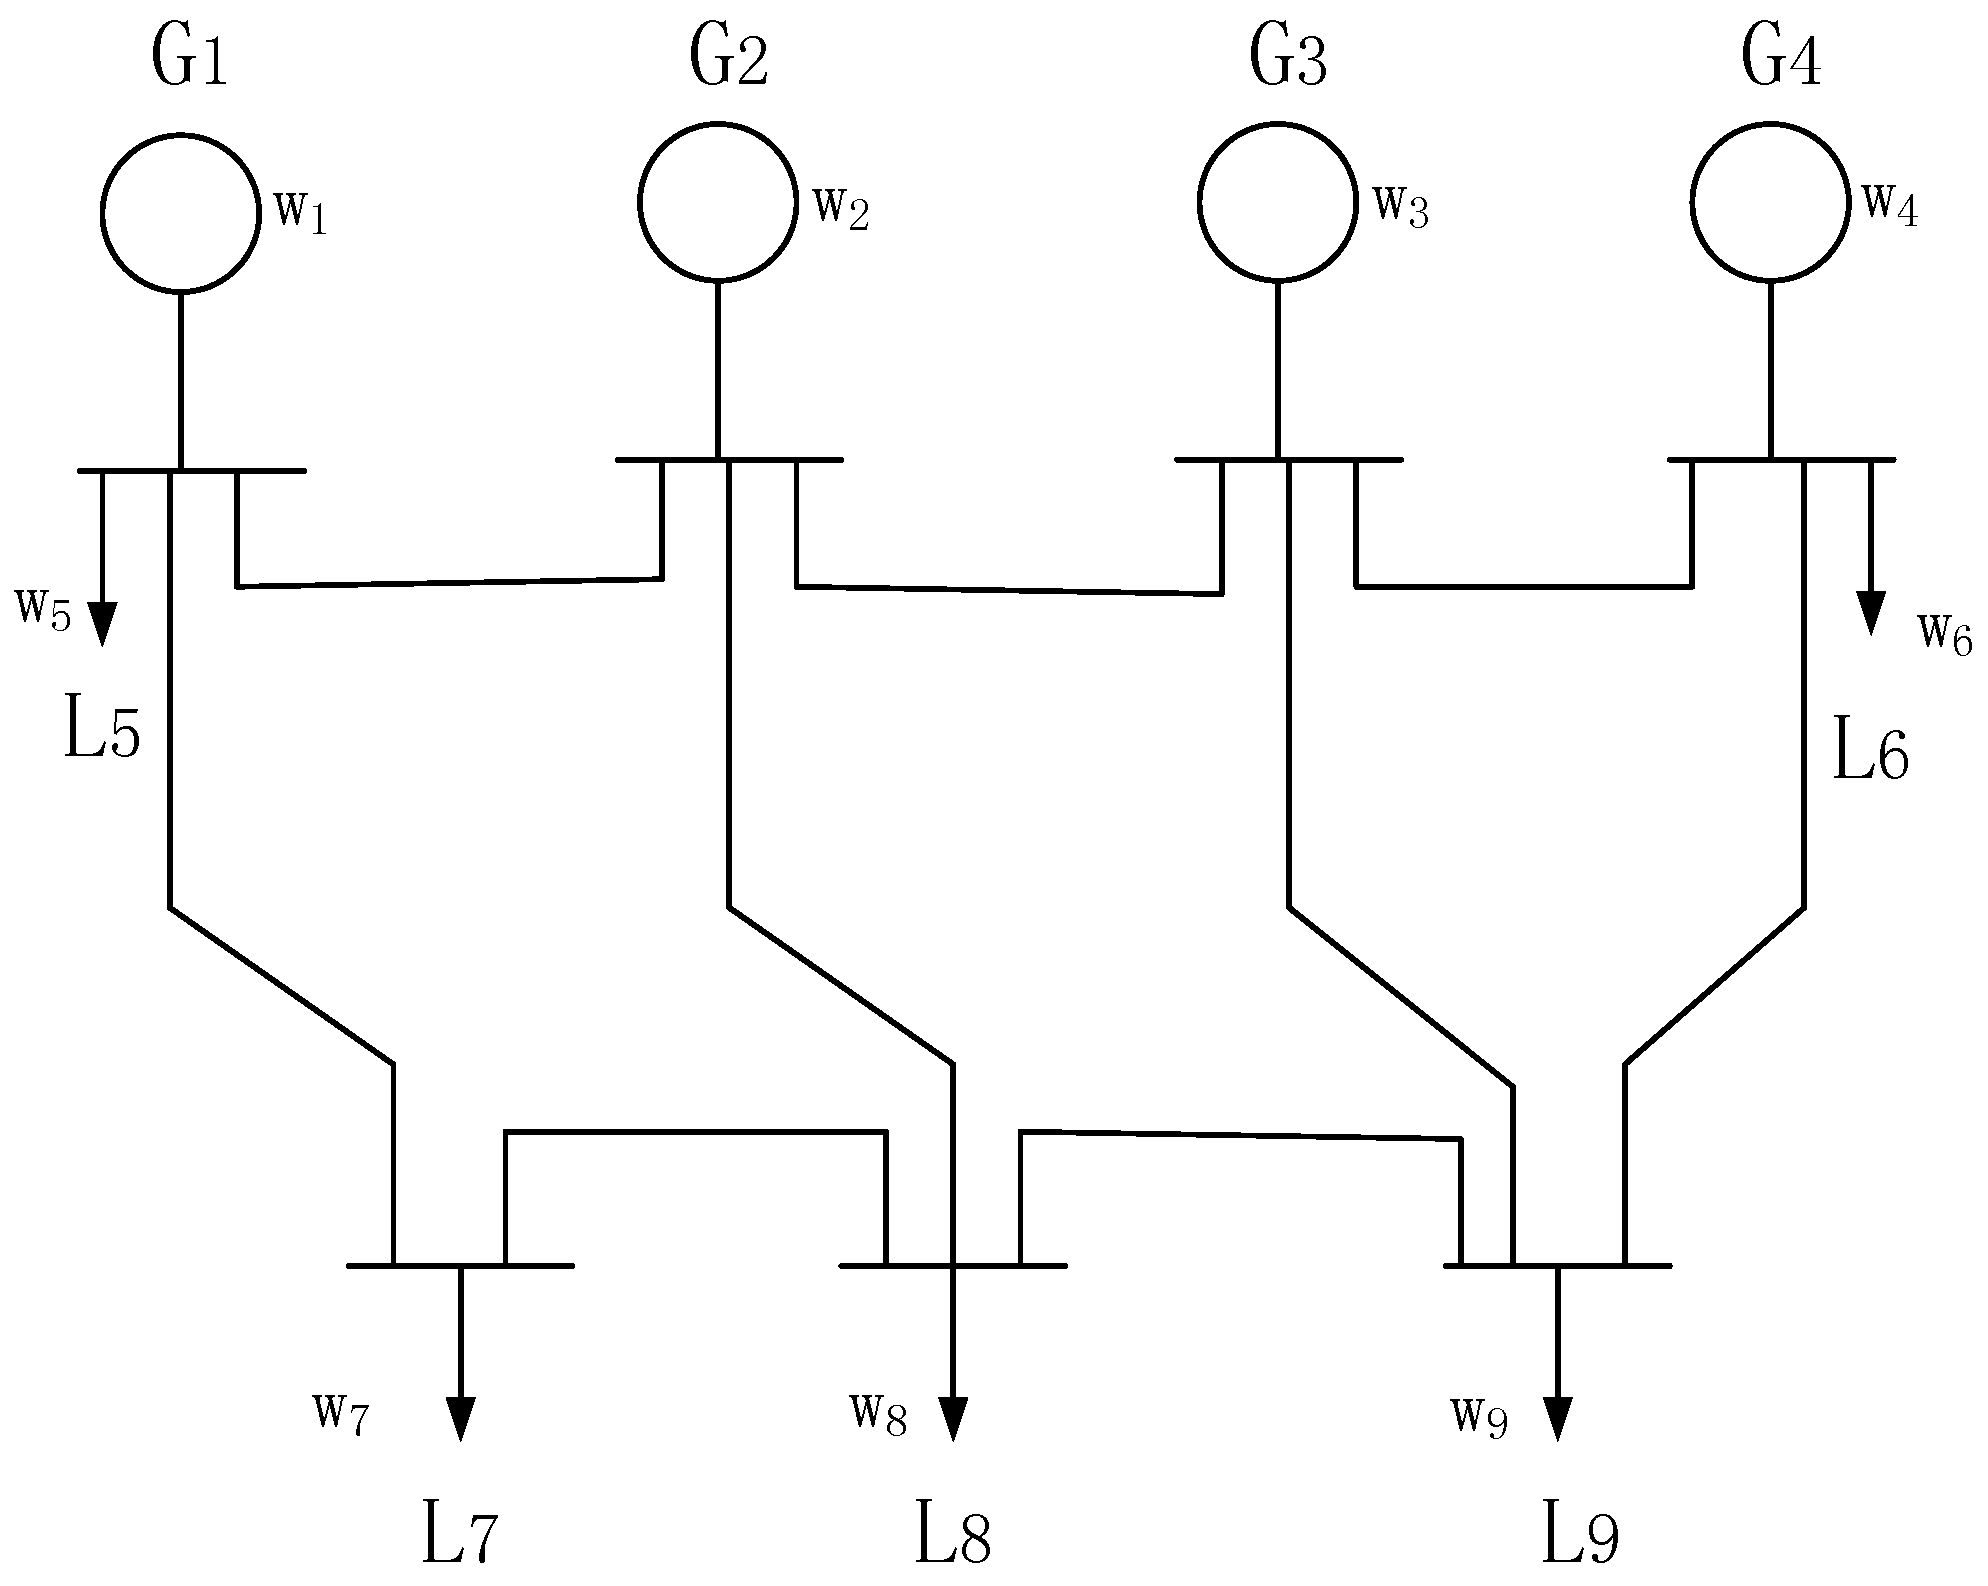

Figure 2.
The topological graph of the 4-generator and 7-bus system.
Figure 2.
The topological graph of the 4-generator and 7-bus system.
To split the system, the control center works as the following three steps. Firstly, it clusters all generators into different coherent groups based on their angle curves. The methods of identifying the coherent generators can be found in [10,11,12]. Secondly, it solves a power system islanding problem (PSIP) that aims to partition the system into several different islands while placing the coherent generators in one island and minimizing the generation-load imbalance of all islands. Finally, it checks whether the transmission lines are loaded above their capacity limits, e.g., thermal capacity limits and steady-state stability limits. If the capacity limits are violated, some loads will be removed from the island. In this study, we focus on solving the PSIP, where the coherent generator groups are given.
Although the PSIP has been investigated in the literature, few researchers have proposed meta-heuristics to solve it. In this study, we propose a tailored tabu search algorithm [13], which is one of the most successful meta-heuristics, to solve this problem. When handling the PSIP, we have to face two challenges. The first challenge is the large scale of the power system. The number of splitting strategies (i.e., feasible solutions) exponentially increases with the scale of the power system. The second one is that the splitting strategy must be generated in a very short time (less than one second in practical applications), as we need to react to the disturbance as quickly as possible. If the reaction speed is too slow, a catastrophic consequence may have occurred and the splitting strategy generated becomes meaningless. Our tabu search algorithm employs a novel two-stage approach to construct a good initial solution, which makes the improvement stage very effective. We introduce the concept of the boundary node and propose a neighborhood for the improvement stage based on the movement of boundary nodes. The numerical experiments show that our tabu search algorithm is capable of achieving high-quality solutions for the power systems with up to 3120 nodes within 0.7 s.
The remainder of this paper is structured as follows. We first provide an overview of related research in Section 2. In Section 3, we then formally describe the problem. Our proposed tabu search algorithm is detailed in Section 4. Section 5 demonstrates the effectiveness of our algorithm by numerical experiments, comparisons with some existing methods and simulations. Section 6 concludes this study with some closing remarks.
2. Related Work
The PSIP is essentially a type of graph partitioning problem (GPP) (e.g., see [14,15,16]). Theoretically, a power system made up of n transmission lines has possible choices for system splitting, since each line has two statuses, namely switching on and switching off. The solution approaches in the literature for the minimal generation-load imbalance generally combine graph representation of the power system with heuristics.
In [7], a two-stage ordered binary decision diagram (OBDD) method [17] was presented to find islands with minimal generation-load imbalance. However, this method can only deal with the small-scale power network that usually contains less than 40 nodes. As done by [8,18], the large-scale power system needs to be simplified before being split using this method. Based on slow coherency, You et al. [10] and Yang et al. [19] presented an islanding algorithm by first constructing a small subnetwork using the center bus. Then, a brute-force search is applied to the subnetwork to determine the edge set whose removal results in the islands with the minimum generation-load imbalance. A graph-based method was introduced, which first simplifies a large-scale power system into a smaller network and then applies a multi-level recursive bisection method to partition the reduced network into the sub-networks with the minimum generation-load imbalance [20]. They proved the effectiveness of their approach by simulation results on the 14 August 2003 blackout in North America. Recently, Trodden et al. [21] proposed a new method for controlled islanding that respects the voltage and reactive power constraints. In this paper, the authors approximated the AC power flow using a piecewise linear line and then split the network into islands using a mixed integer linear programming model.
Since 2009, more advanced heuristics were developed to solve power systems of a large scale. As pointed out by [6], most of the existing islanding algorithms are applied to a simplified version or a selected subset of the original power system. Since simplification may omit the optimal solutions, it is preferable to handle the original network directly. Therefore, they proposed a new islanding algorithm based on slow coherency [22] and angle-modulated particle swarm optimization (AMPSO) [23] for the large-scale power systems with up to 118 nodes. The work in [24] formulated the power network partitioning problem as the min-cut problems, where they used a new definition for the capacity of a cut, different from the traditional one. They solved their problems by simple heuristics that are built on the modified version of the approximation algorithm for the node-weighted Steiner tree problem [25]. The work in [26] designed the first neighborhood-based local search algorithm to generate the splitting solutions and tested this algorithm on the IEEE 118-bus system and a real 212-bus system in China. Ding et al. [27] proposed a constrained spectral clustering-based controlled islanding algorithm that can find islanding solution in polynomial time and has no need to simplify the original network. This algorithm converts the islanding problem into a graph-cut problem and tries to minimize the power-flow disruption.
The above-mentioned approaches have two obvious deficiencies. First, they are only capable of handling either the small-scale power system or the reduced version of the large-scale power system. Second, most of these approaches consumed too much time to solve the problem. For instance, the algorithm by [7] spent around 2.5 s in solving the problem with only 30 nodes, which is unacceptable in real practice. Therefore, it is necessary to develop an approach that can identify the high-quality solutions for the large-scale power system within a short computation time. As a very powerful and efficient meta-heuristic, tabu search has applications spanning a great variety of realms, such as resource planning, telecommunications, VLSI (Very Large Scale Integration) design, vehicle routing and graph optimization [28]. Regarding the graph partitioning problems, we can also find several applications of tabu search; examples include [29,30,31]. All of these successful applications motivate us to design a tailored tabu search algorithm for the PSIP.
3. Problem Description
The power system can be represented by an undirected, connected and node-weighted graph , where V is the set of n nodes, E is the edge set and W is the set containing the node weights. The node set V is composed of two mutually exclusive subsets and , i.e., and , where is the set of m generator nodes and includes the n–m load nodes. Let () denote a node in V and () be a generator node in . In a real situation, generators and loads may be situated at the same node. Thus, if the generation power exceeds the load power, we regard this node as a generator node; otherwise, it is a load node. The element is included in E only if there is a transmission line between nodes i and j. Each element is associated with a parameter , which represents the capacity of the corresponding transmission line. Actually, the splitting strategy is a set of edges belonging to E. If the node is a generator node, then its corresponding is a positive number; otherwise, is negative. For convenience, we view the that only acts as the connecting node without any power generation or consumption (i.e., ) as a load node.
The power system islanding problem is a graph partitioning problem that has to abide by the following two types of constraints. The first constraint is called the connectivity constraint (CC) [24], which requires that any pair of nodes in each resultant island is linked by at least one path. The second constraint is the generator coherency constraint (GCC). The generators that have similar operating states are called coherent generators. The generator set consists of u subsets of coherent generators, denoted by (). The power system must be split into u islands, where the generators in the same can only exist in the same island. We denote the k-th () island by , where is its node set, is its associated set of coherent generators, is the edge set and contains the weights of the nodes in . Let be the real active power on transmission line . The notational expression of the generator coherency constraint is given as follows:
When the system is partitioned after losing its stability, the imbalanced power will circulate between generators and loads within the isolated islands. If the imbalanced power is too large, cascading faults are very likely to occur within the islands. To resolve this issue, the load shedding and generator tripping measures must be performed, increasing the operational and social cost. Therefore, when splitting the power system, we aim to minimize the imbalance of the generation and load among all islands, lowering the needs of load shedding and generator tripping.
The objective of the PSIP is to minimize the sum of the power imbalance of all resultant islands. The power imbalance of the k-th island is computed as:
Thus, the objective value of the solution S is:
In [7], the authors set a tolerance on the power imbalance in each island and try to find feasible splitting strategies that satisfy for each . They proved that their problem is NP-complete. The PSIP can also be proven to be NP-complete in the same way. This implies that no polynomial-time algorithm exists for the PSIP.
4. Tabu Search
In this section, we detail the tabu search algorithm for the power system islanding problem. To illustrate the algorithm procedure, we employ an example of splitting a small power system that contains only 30 nodes into two islands [7]. The cases that generate more than two islands can be solved in a similar manner.
Let denote the island that includes node i. We define as the set of neighboring islands in which at least one node j is adjacent to , namely,
The load node i with nonempty is called the boundary node. All boundary nodes of an island constitute the boundary of that island.
During the tabu search process, the boundaries of the islands are changed by some neighborhood operations, which at the same time generates a series of solutions. We select the best solution encountered over the course of the search process as the final solution of the problem. The tabu search algorithm prevents search process from being trapped in local optima by employing the tabu list. We refer the reader to [13,28] for the framework of the tabu search algorithm. Our implementation of the tabu search algorithm includes the input data, the generation of the initial solutions, the simplification of the original graph, the local search, the management of the tabu list and the termination criterion.
4.1. Input Data
The input data of this algorithm are the information of graph G, which includes the set of nodes V, the set of generator nodes , the set of node weights W and the adjacency matrix A, the number u of islands to be divided and the coherent generator set in the k-th island. The 30-node power system used in our example is shown in Figure 3, where the load nodes (respectively, the generator nodes) are represented by circles (respectively, squares). Two coherent generator sets are assumed to be {1, 2, 5, 13} (coherent generator Set 1) and {8, 11} (coherent generator Set 2).
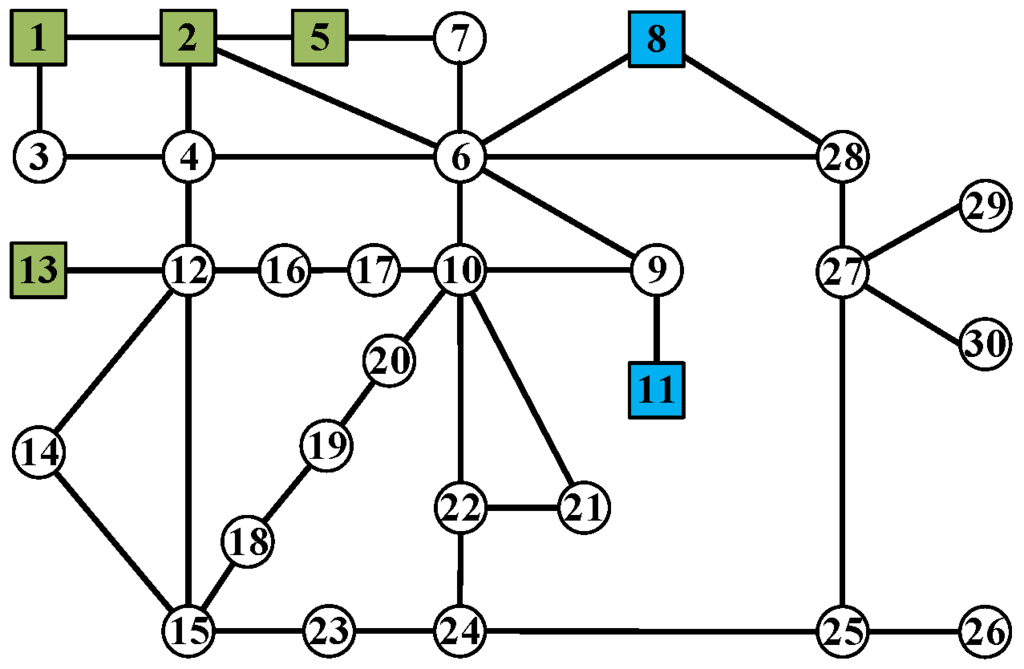
Figure 3.
The graph of the 30-node system.
Figure 3.
The graph of the 30-node system.

4.2. Initial Solution
We generate the initial solution using a two-stage approach. In the first stage, we construct a critical subgraph for each coherent generator set. In the second stage, we gradually connect the remaining load nodes to the critical subgraphs, such that the total power imbalance is minimized.
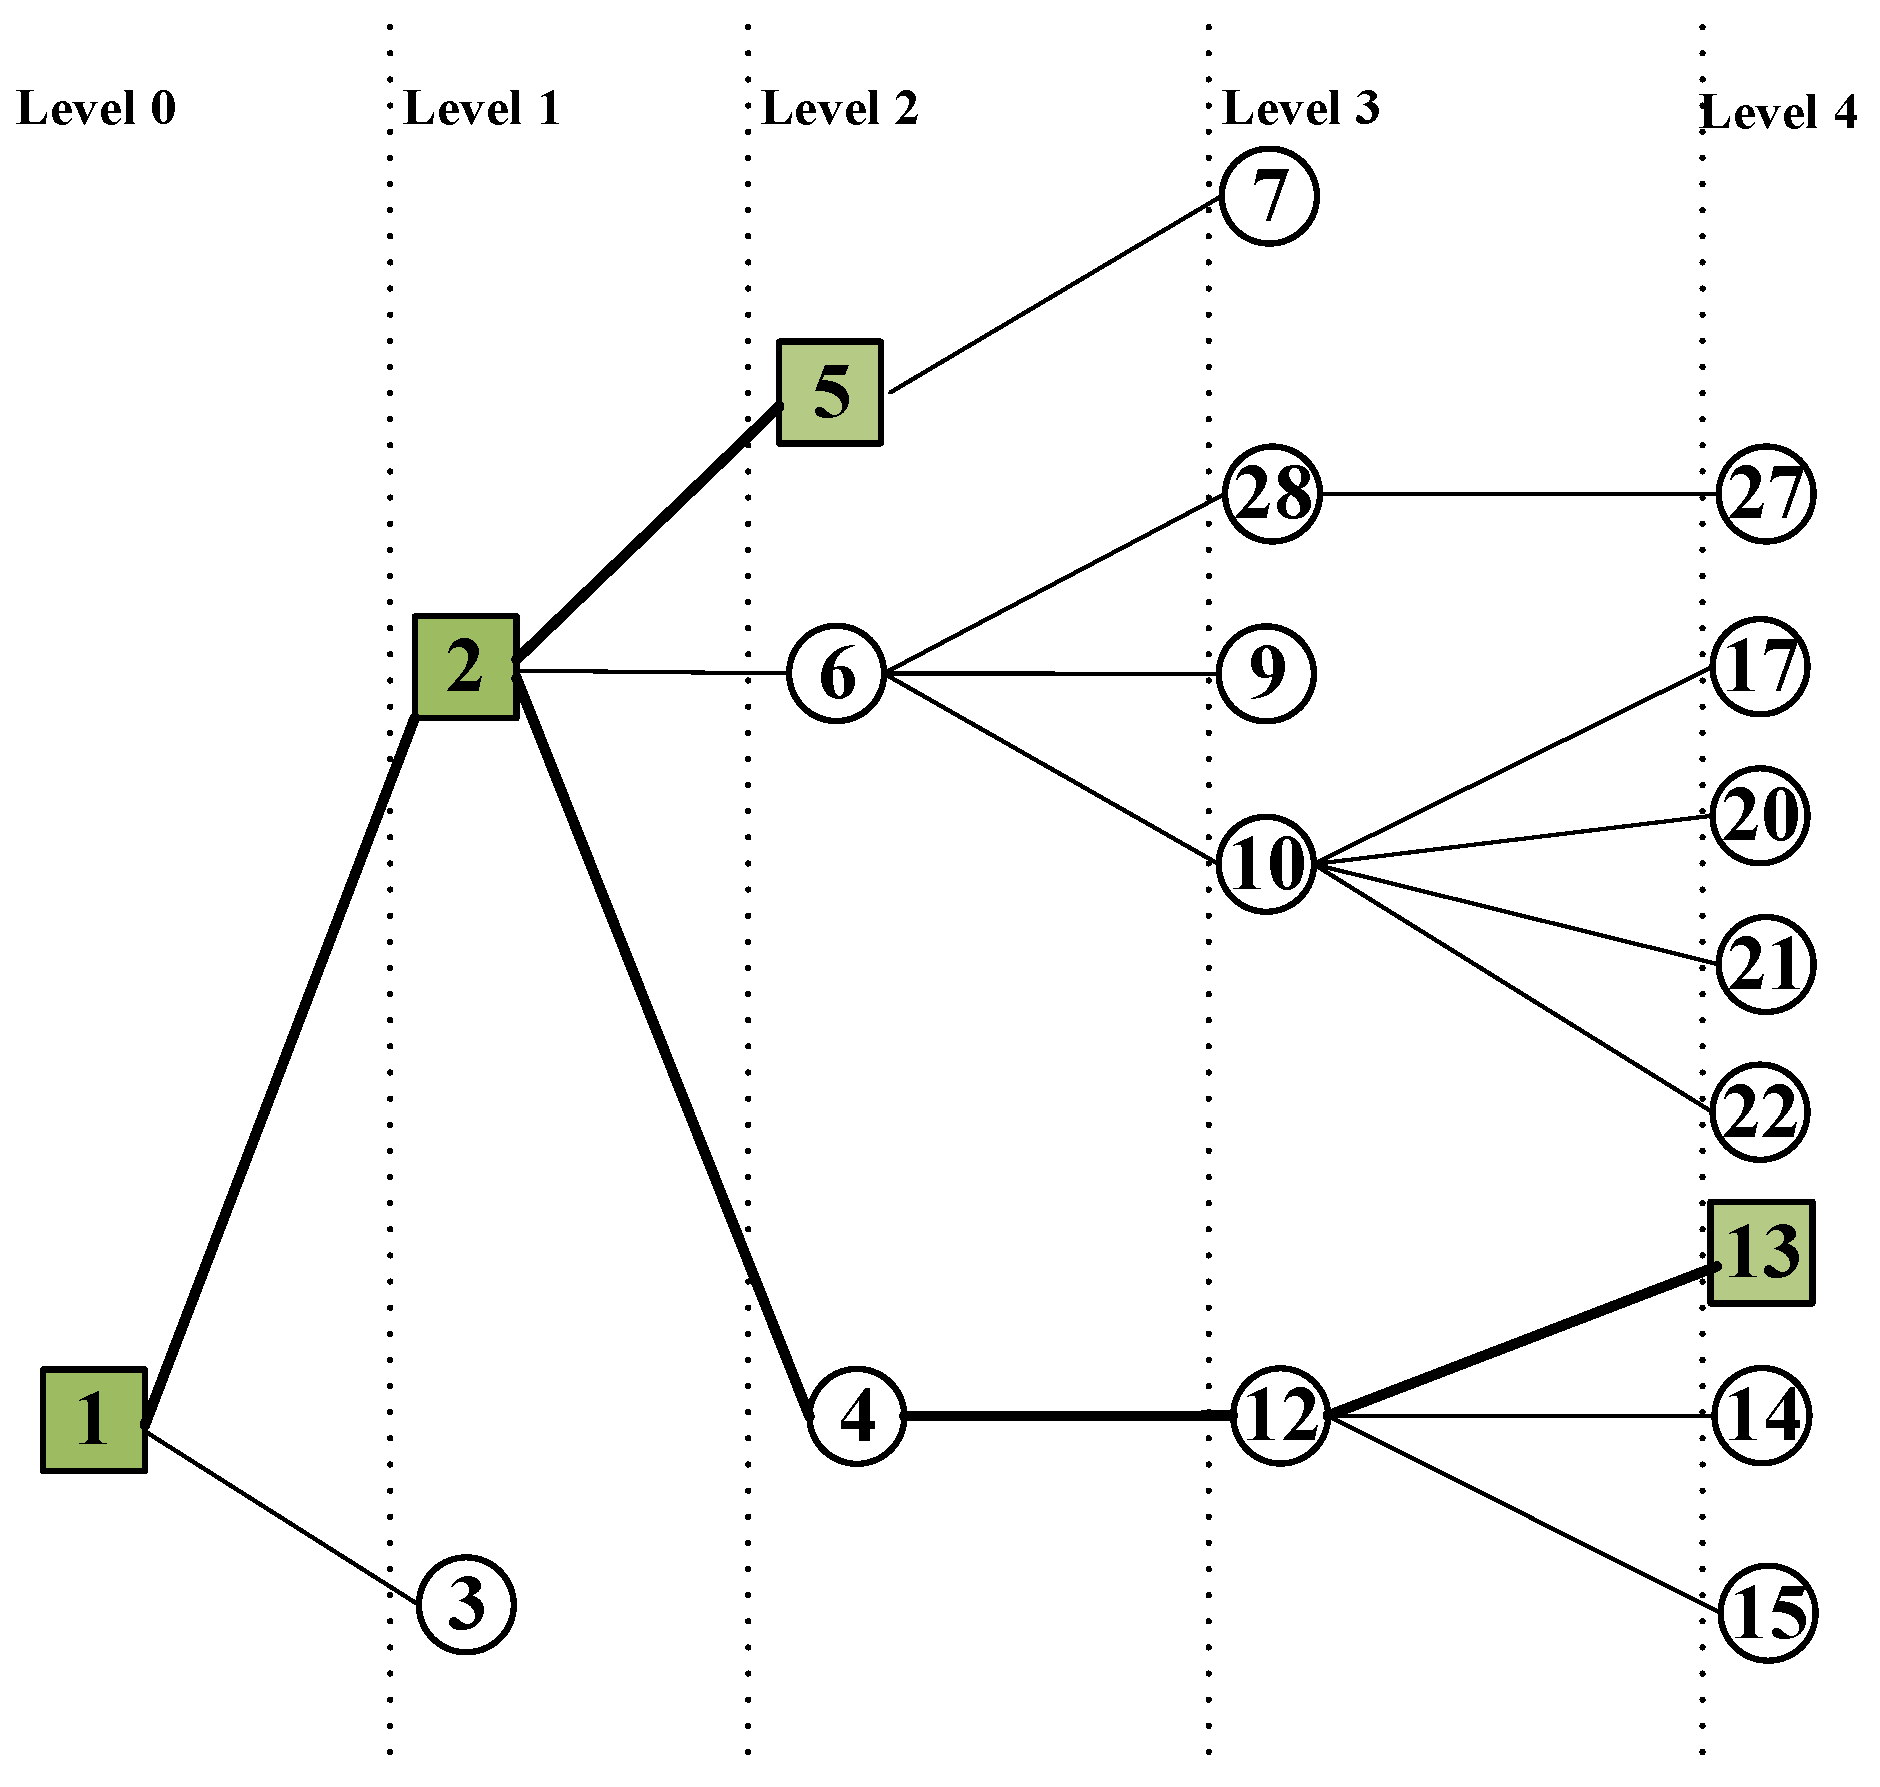
The critical subgraph is constructed as follows. For each coherent generator set, we arbitrarily select one generator as the root node and then construct a tree from the graph using a breadth-first search process, where every node on a level is visited before going to a lower level. The tree construction process has two characteristics: (1) the tree cannot include the generator node in other coherent generator sets; (2) the process stops as soon as the tree includes all generators in this coherent generator set.
Figure 4 shows the constructed tree associated with the coherent generator Set 1 with generator Node 1 being the root node, where the critical Subgraph 1 is highlighted by bold lines. Obviously, the nodes in the first level is generator Node 2 and load Node 3, since they are adjacent to generator Node 1. Then, the Level 2 nodes originated from generator Node 2 are generator Node 5 and load Nodes 4 and 6. Since load Node 4 already exists in the tree, it cannot be the child node of load Node 3. Since generator Node 8 belongs to the second coherent generator set, it cannot be the child of load Node 6. Following the above extension rules, we construct the tree until generator Node 13 is included. The critical subgraph contains all generator nodes and consists of all paths from the generator nodes to the root node. In Figure 4, the critical Subgraph 1 is composed of paths (1, 2, 5) and (1, 2, 4, 12, 13). Figure 5 presents the 30-node graph in which the critical subgraphs associated with all coherent generator sets are marked in bold.

Figure 4.
The tree associated with the coherent generator Set 1, where generator Node 1 is the root node and the critical subgraph is highlighted by bold lines.
Figure 4.
The tree associated with the coherent generator Set 1, where generator Node 1 is the root node and the critical subgraph is highlighted by bold lines.
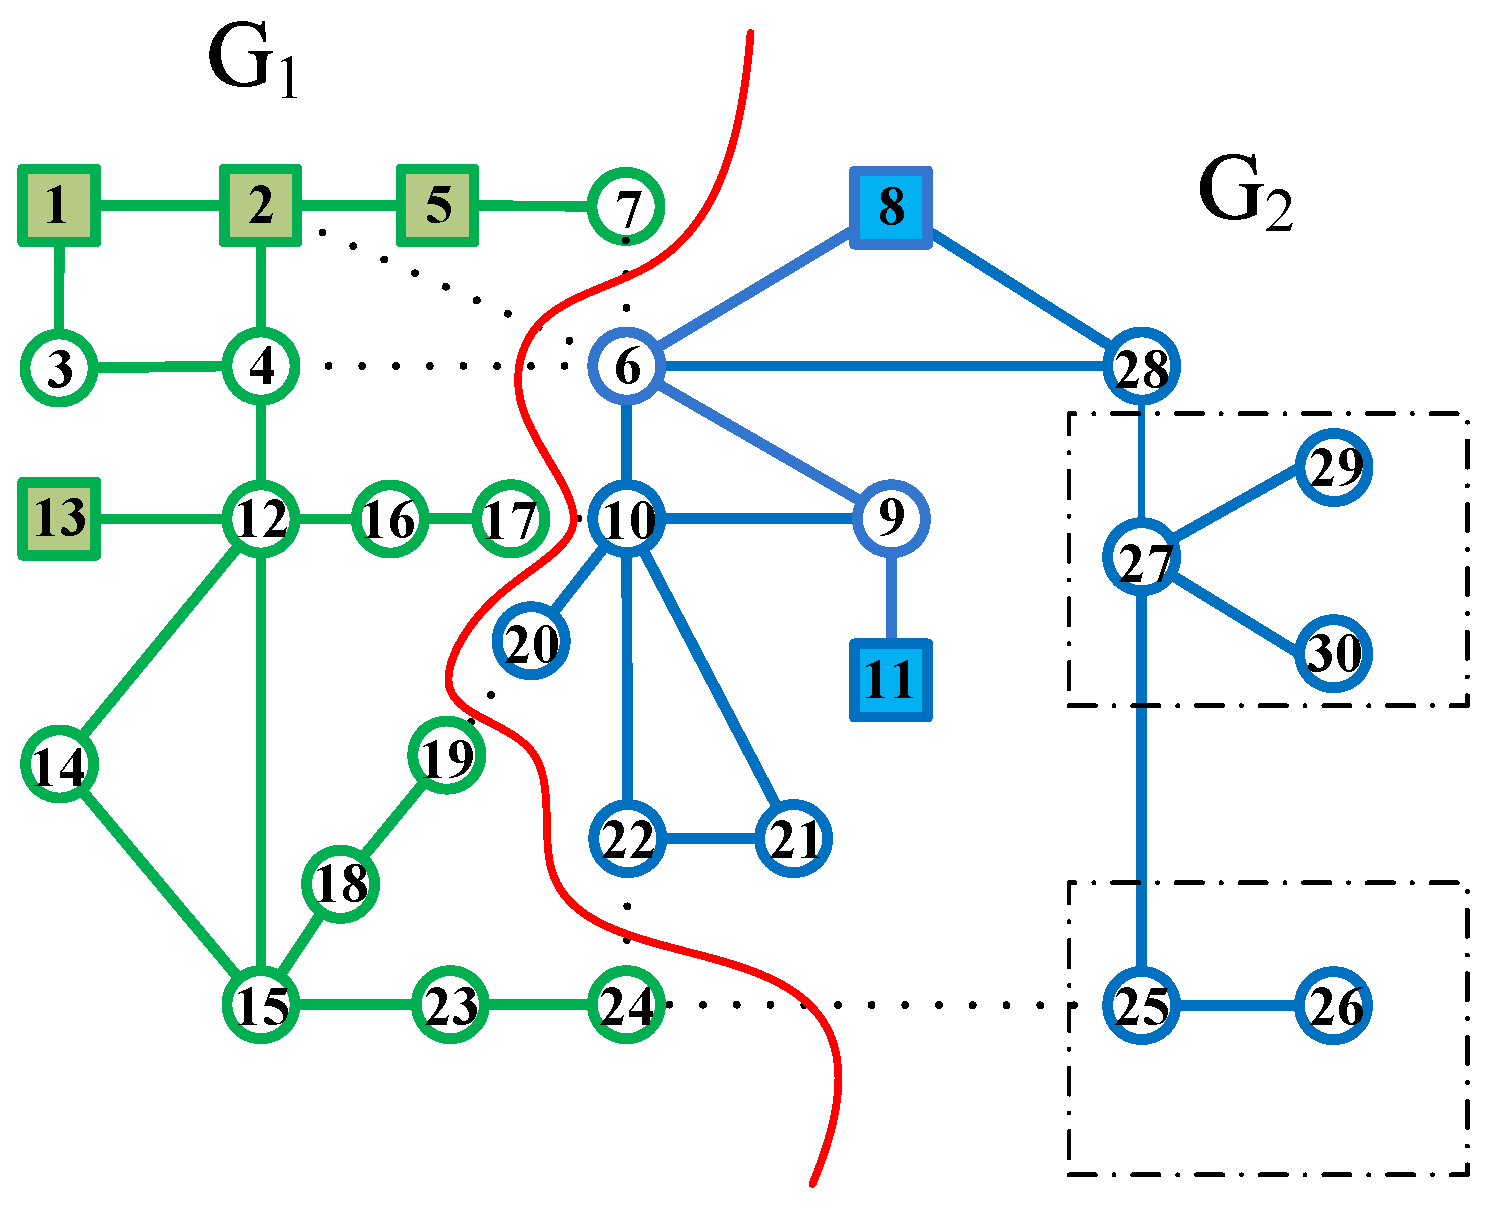
The island is constructed from the critical subgraph k by adding the remaining load nodes that are not included by the critical subgraphs. At the beginning, we denote the k-th island by , which is equivalent to the critical subgraph k. The set of nodes in , denoted by is called the Layer 0 nodes of . The remaining node adjacent to any node in is called the Layer 1 node of . In Figure 5, the sets of Layer 1 nodes of and are { 3, 7, 14, 15, 16} and {7, 10, 28}, respectively. Next, we generate by assigning the Layer 1 nodes to . If a node is a Layer 1 node of multiple islands (e.g., load Node 7 in Figure 5), we assign it to the island, such that the resultant total power imbalance of all islands is minimal. Figure 6 shows the 30-node graph in which and are marked in bold, and Load 7 is included in . The remaining nodes are {17, 18, …, 30}, and the sets of Layer 2 nodes of and are {17, 18, 23} and {17, 21, 22, 27}, respectively. In the following steps, the islands gradually grow until the expansion cannot be performed. We can get the initial solution for the 30-node power system as shown in Figure 7, where the boundary nodes are {4, 6, 7, 10, 17, 19, 20, 22, 24, 25}. In this solution, the transmission lines tripped are {(6, 7), (2, 6), (4, 6), (17, 10), (19, 20), (22, 24), (24, 25)}.

Figure 5.
The critical subgraphs.
Figure 5.
The critical subgraphs.
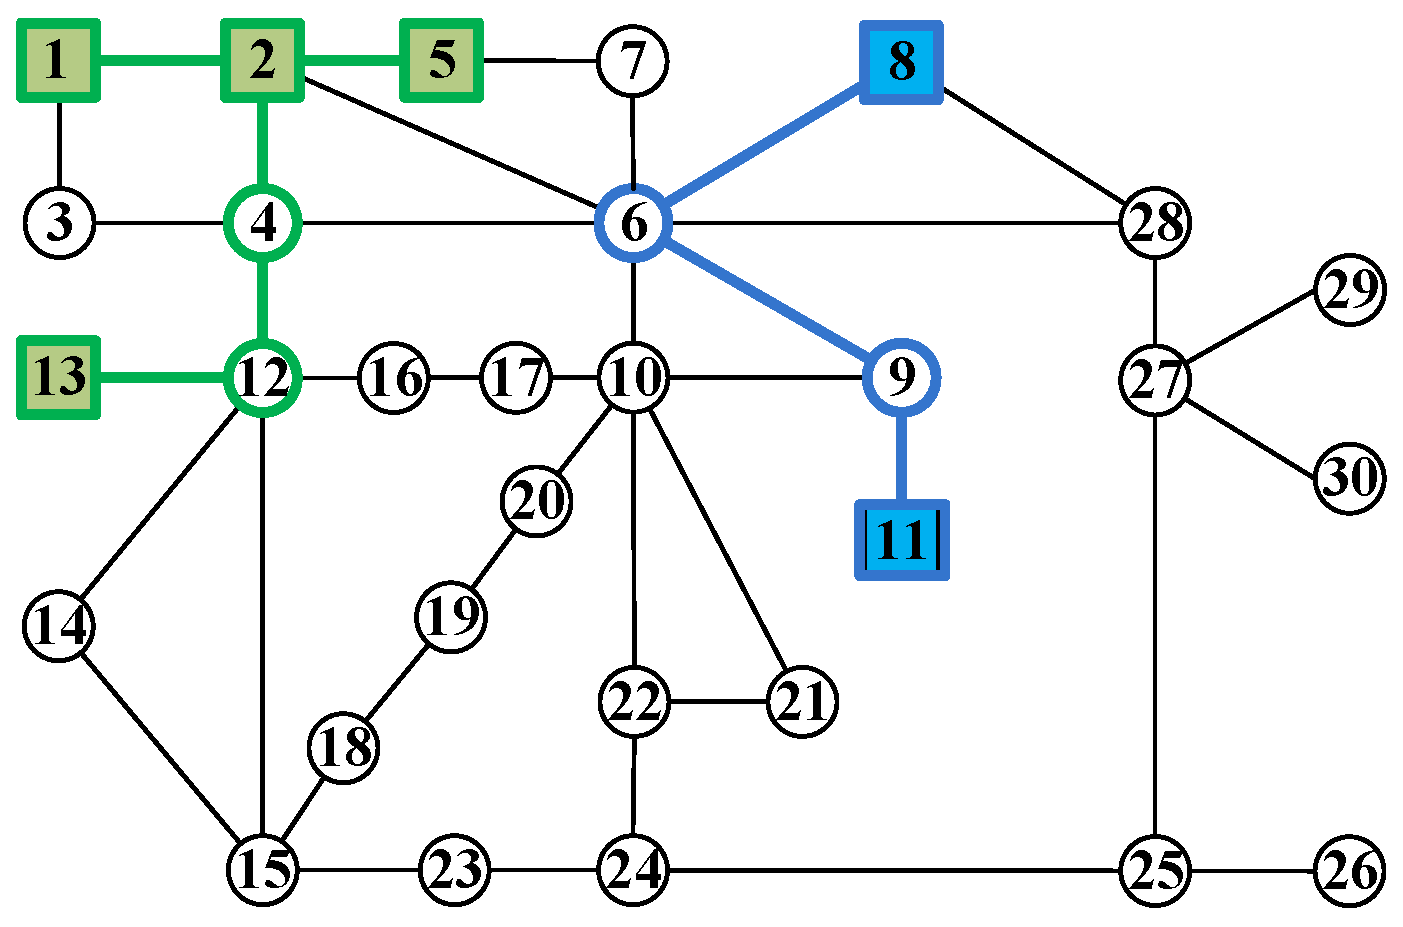
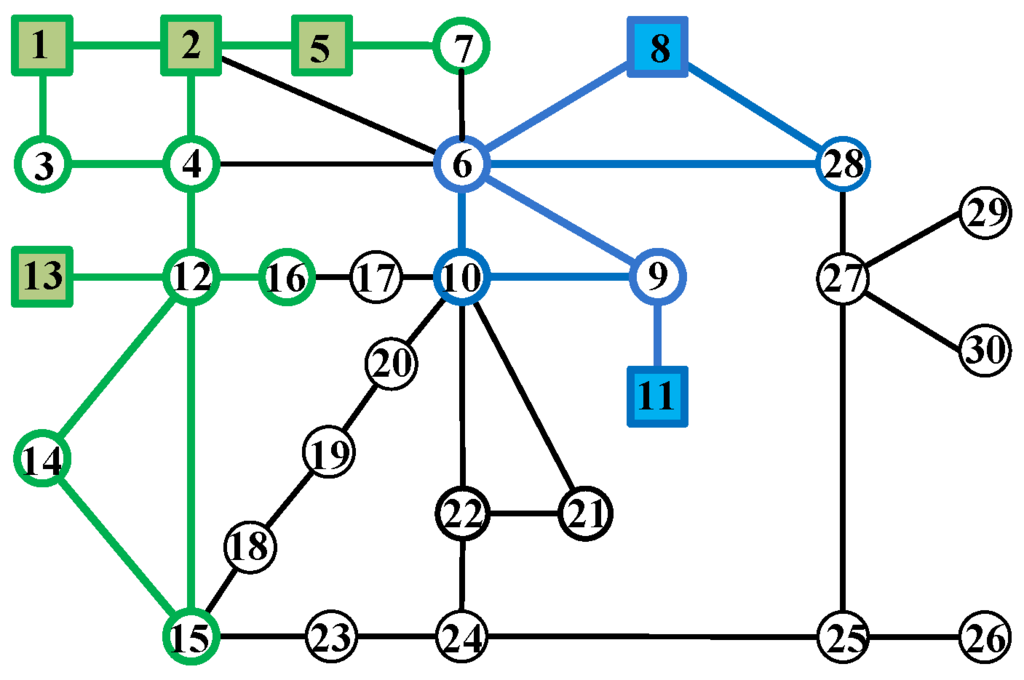
Figure 6.
The 30-node graph in which and are marked in bold.
Figure 6.
The 30-node graph in which and are marked in bold.


Figure 7.
The initial solution for the 30-node power system, where the dotted lines have been tripped.
Figure 7.
The initial solution for the 30-node power system, where the dotted lines have been tripped.
Finally, we simplify the initial solution by merging the leaf load nodes into their adjacent load nodes or generator nodes. For the graph in Figure 7, we can merge load Nodes 29 and 30 into load Node 27, and combine Node 26 with Node 25.
4.3. Neighborhood
A neighborhood move is defined as assigning a boundary node to one of its neighboring islands. Suppose that the boundary node i is currently in island ; its target neighboring island is , and the current power imbalance of islands and is and , respectively. After moving node i to island , we re-compute the power imbalance of these two islands, which are denoted by and . Thus, the cost of moving node i to island is defined by:
For each boundary node i and each island , we can generate a neighboring solution by the above operation. For example, after performing the operation of moving Node 17 to Island 2 for the solution in Figure 7, we can obtain a new solution shown in Figure 8. Note that Nodes 26, 29 and 30 are removed by the simplification step. All such solutions comprise the neighborhood of the current solution. The size of this neighborhood is small, since the number of boundary nodes is usually quite small, compared to the number of nodes in V. Thus, in each iteration, we can quickly evaluate all possible neighboring solutions and then select the best one.
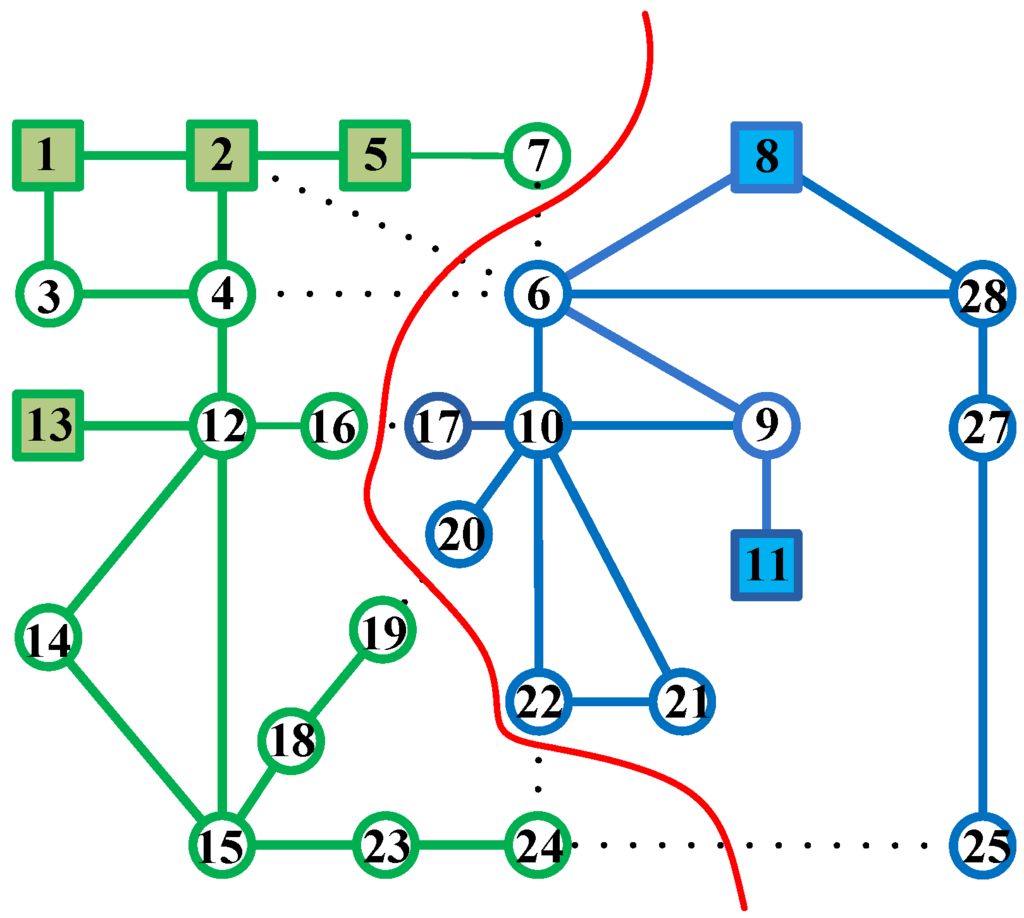
Figure 8.
The new solution generated by moving Node 7 to .
Figure 8.
The new solution generated by moving Node 7 to .

4.4. Tabu List, Aspiration and Termination
The tabu search algorithm employs a tabu list to forbid the recently visited solutions from being revisited. In our algorithm, the prohibition rule is: a node i that is removed from its current island cannot be assigned back to for the next L iterations, where L is called tabu tenure. In the tabu list, we store the nodes that have been moved within the previous L iterations. A move is considered as tabu if it attempts to move the nodes in the tabu list. The tabu restriction can be overridden if the move satisfies the following aspiration criterion: the solution resulting from the tabu move is better than the current best solution. The solutions in the neighborhood that are generated by the non-tabu moves or by the aspiration criterion are called allowable neighbors. We sort all allowable neighbors in ascending order of the values of their total power imbalance. The one ranked at the first place is selected to be the next incumbent solution. We terminate the tabu search process when maxIterconsecutive iterations are unable to update the current best solution.
4.5. The Framework of the Algorithm
The pseudocode of our tabu search algorithm is provided in Algorithm 1. The initial solution is generated by the procedure described in Section 4.2. Starting from the initial solution, in each iteration, the search process identifies the best allowable neighbor of and then replaces with this neighboring solution. Subsequently, it tries to update the current best solution . If the new best solution is encountered, then ξ is reset to zero; otherwise, ξ is increased by one. The iteration ends after updating the tabu list. Once no new best solution is found after maxIter consecutive iterations, the search process terminates and outputs as the final solution. The flow chart of the whole solution is shown in Figure 9.
| Algorithm 1 The tabu search algorithm. |
|
5. Experimental Results
Our tabu search algorithm was coded in C++, compiled using the gcc 4.6.1 compiler and was tested on a laptop with an Intel Xeon E3-1230 3.30 GHz CPU, 8-GB RAM and running the Windows 7 64-bit operating system. The algorithm was configured with the following two parameter settings: (1) , ; and (2) , . The 15 benchmark instances are given in Section 5.1. In Section 5.2, we report the results generated by our tabu search algorithm and then compare our algorithm to some existing islanding methods based on the IEEE 39-bus system and the IEEE 118-bus system. Finally, in Section 5.3, we conduct time-domain simulations based on the dynamic models of three power systems and demonstrate the importance of our tabu search algorithm in minimizing the impacts of the disastrous disturbances.
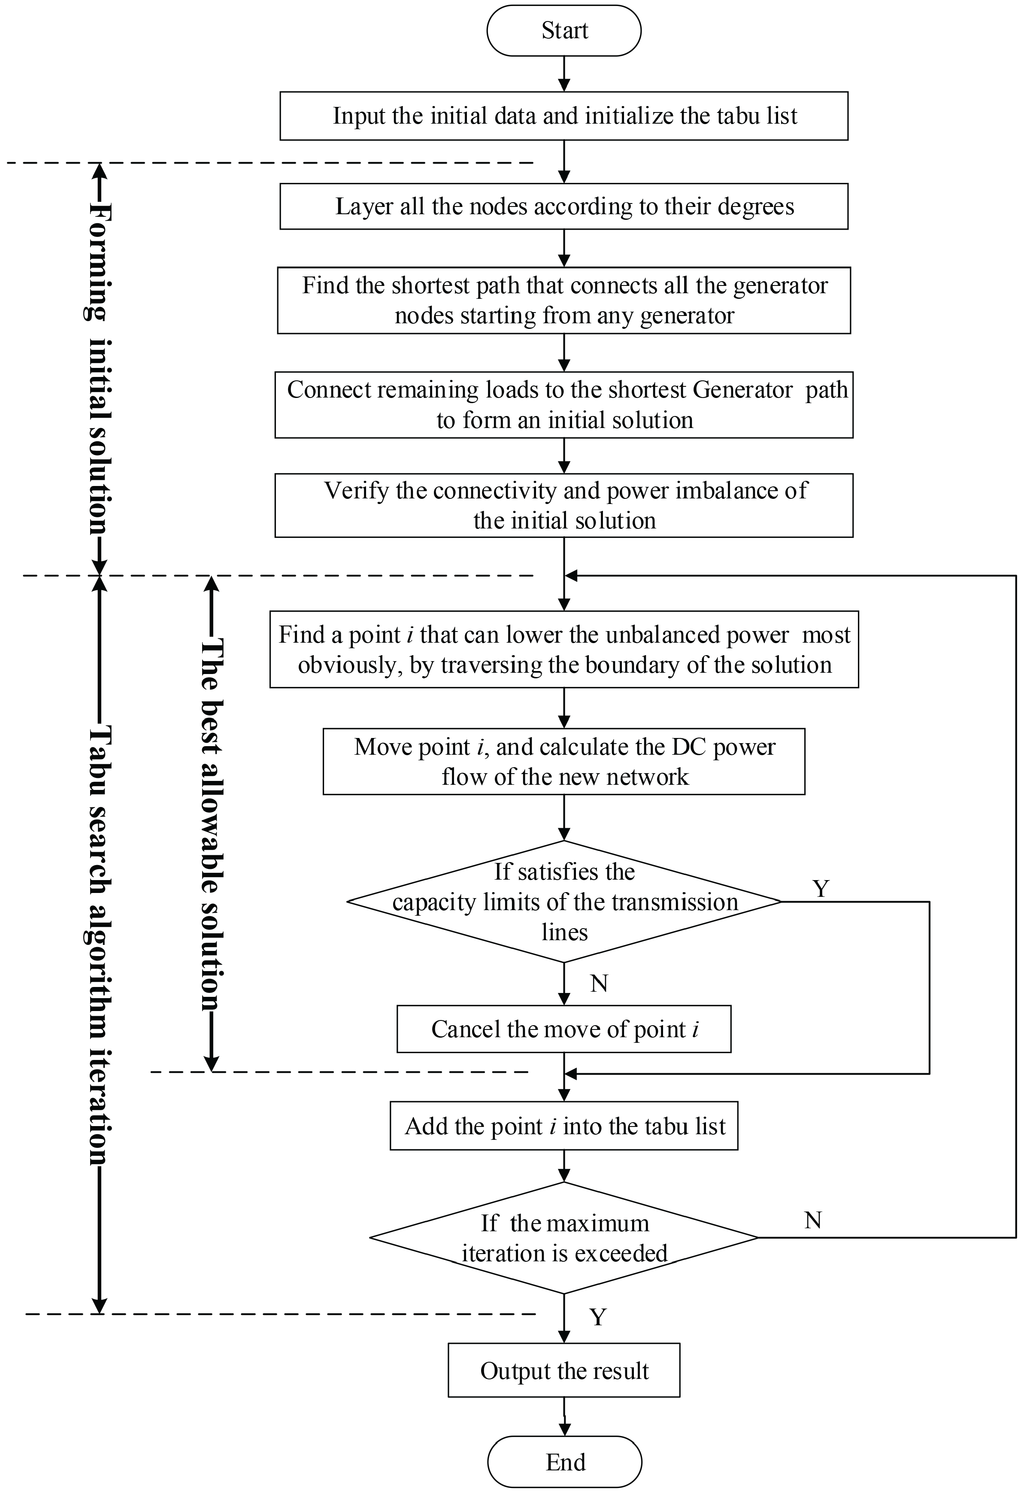
Figure 9.
The procedure of the islanding approach.
Figure 9.
The procedure of the islanding approach.

5.1. Benchmark Instances
We tested our algorithm on 15 instances derived from five power systems. Table 1 gives the information of these power systems, where the numbers of edges, power nodes and load nodes are displayed in the columns “# Edges”, “# Generation nodes” and “# Load nodes”, respectively. The names of the test instances are ieee118-2, ieee118-3-a, ieee118-3-b, sop2737-2, sop2737-3, sop2737-4, wop2746-2, wop2746-3, wop2746-4, wp3012-2, wp3012-3, wp3012-4, sp3120-2, sp3120-3 and sp3120-4.
The power system ieee118 represents a portion of the American electric power system (in the Midwestern USA) in 1962. Wang et al. [26] divided the generators of ieee118 into two and three groups and accordingly introduced two instances, namely ieee118-2 and ieee118-2-a, where the first part of the instance name denotes the name of the power system and the second part is the number of generator groups. Moreover, Ding et al. [32] also generated a three-island instance that differs from that of [26]; we call this instance ieee118-3-b. The power systems sop2737, wop2746, wp3012 and sp3120 are the Polish grid in 2007–2008 with different loading scenarios, which are summer off-peak season, winter off-peak season, winter peak season and summer peak season [33]. We randomly divided each of these power systems into two to four parts and specify that the generators in each part belong to the same coherent generator group, thereby generating 12 instances. The generators in each group may not be truly coherent, and these instances are only used to evaluate our algorithm. All instances and detailed solutions are available in the online supplement to this paper at [34].

Table 1.
The information of the five power systems.
| Name | # Edges | # Generation nodes | # Load nodes | Total generation power (Mega Watt) | Total load power (Mega Watts) |
|---|---|---|---|---|---|
| ieee118 | 186 | 19 | 99 | 3,966.93 | −3966.93 |
| sop2737 | 3506 | 185 | 2552 | 10,391.16 | −10,391.16 |
| wop2746 | 3514 | 336 | 2410 | 17,037.25 | −17,037.25 |
| wp3012 | 3572 | 292 | 2720 | 24,487.14 | −24,487.14 |
| sp3120 | 3693 | 241 | 2879 | 19,713.23 | −19,713.23 |
5.2. Results and Analyses
We report in Table 2 and Table 3 the computational results of the instances produced by our tabu search algorithm. In each table, the first column gives the names of the test instances. Each block corresponds to a certain number of iterations. For example, the values of “Ratio (%)” and “Time (s)” under the block “1000 iterations” is the ratio of the total power imbalance obtained at the end of the 1000th iteration to the total generation power and the corresponding computation time. The block “0 iteration” shows the results of the initial solutions generated by the two-stage approach (see Section 4.2). In the last row of each table, we present the average “Ratio (%)” and “Time (s)” of these instances.
To more clearly demonstrate the converging behavior of our algorithm, we graphically present the values of “Ratio (%)” in Figure 10, Figure 11, Figure 12 and Figure 13, where the x-axis indicates the number of iterations. As revealed in these figures, our tabu search algorithm improved the initial solutions significantly. We can get the same conclusion from the last rows of Table 2 and Table 3. At the end of 500 iterations, the algorithm reduced the average ratio from 16.04% down to 0.87%; this quality improvement reflects the effectiveness of our algorithm. Although we allow the algorithm to run 10,000 iterations, the results at the end of 500 iterations are very close to the final results, which can be easily observed from the above tables and figures. The ratios of these instances are very small. At the end of 500 iterations, the biggest ratio when (respectively, ) is only 6.86% (respectively, 6.73%); most of the ratios are less than one percent; and many ratios are equal to zero. The average and greatest computation times consumed by 500 iterations are 0.169 and 0.312 s, respectively. Moreover, at the end of 1000 iterations, our tabu search algorithm consumed less than 0.7 s for each instance. Therefore, we can say that our tabu search algorithm is able to deal with the instances with up to 3120 nodes well within 0.7 s. These observations imply that our tabu search converged quickly and is able to efficiently produce high-quality solutions. There is no clear difference between the algorithms with and , since their solution quality and computation time are almost the same.
Table 2.
Computational results generated by the tabu search algorithm with .
| Instance | 0 iterations | 500 iterations | 1000 iterations | 2000 iterations | 5000 iterations | 10,000 iterations | ||||||||||
|---|---|---|---|---|---|---|---|---|---|---|---|---|---|---|---|---|
| Ratio (%) | Time (s) | Ratio (%) | Time (s) | Ratio (%) | Time (s) | Ratio (%) | Time (s) | Ratio (%) | Time (s) | Ratio (%) | ||||||
| ieee118-2 | 2.59 | 0.004 | 0.00 | 0.008 | 0.00 | 0.016 | 0.00 | 0.042 | 0.00 | 0.087 | 0.00 | |||||
| ieee118-3-a | 3.83 | 0.003 | 3.01 | 0.005 | 3.01 | 0.011 | 3.01 | 0.028 | 3.01 | 0.055 | 3.01 | |||||
| ieee118-3-b | 4.60 | 0.001 | 0.26 | 0.016 | 0.26 | 0.015 | 0.26 | 0.032 | 0.26 | 0.062 | 0.26 | |||||
| sop2737-2 | 27.45 | 0.305 | 0.00 | 0.566 | 0.00 | 1.107 | 0.00 | 2.708 | 0.00 | 5.385 | 0.00 | |||||
| sop2737-3 | 10.90 | 0.131 | 0.00 | 0.255 | 0.00 | 0.495 | 0.00 | 1.231 | 0.00 | 2.448 | 0.00 | |||||
| sop2737-4 | 10.55 | 0.169 | 0.00 | 0.367 | 0.00 | 0.764 | 0.00 | 1.963 | 0.00 | 3.949 | 0.00 | |||||
| wop2746-2 | 20.83 | 0.259 | 0.00 | 0.529 | 0.00 | 1.084 | 0.00 | 2.695 | 0.00 | 5.397 | 0.00 | |||||
| wop2746-3 | 13.72 | 0.190 | 0.01 | 0.365 | 0.01 | 0.592 | 0.01 | 1.268 | 0.01 | 2.357 | 0.01 | |||||
| wop2746-4 | 27.68 | 0.236 | 0.75 | 0.482 | 0.01 | 0.842 | 0.01 | 1.901 | 0.01 | 3.639 | 0.01 | |||||
| wp3012-2 | 0.43 | 0.122 | 0.01 | 0.289 | 0.01 | 0.669 | 0.01 | 1.970 | 0.01 | 4.112 | 0.01 | |||||
| wp3012-3 | 23.39 | 0.295 | 0.33 | 0.692 | 0.33 | 1.469 | 0.33 | 3.814 | 0.33 | 7.706 | 0.33 | |||||
| wp3012-4 | 23.26 | 0.099 | 0.01 | 0.207 | 0.01 | 0.426 | 0.01 | 1.100 | 0.01 | 2.201 | 0.01 | |||||
| sp3120-2 | 2.49 | 0.150 | 0.00 | 0.275 | 0.00 | 0.552 | 0.00 | 1.374 | 0.00 | 2.710 | 0.00 | |||||
| sp3120-3 | 36.38 | 0.308 | 1.87 | 0.668 | 1.83 | 1.352 | 1.29 | 3.100 | 1.29 | 6.007 | 1.29 | |||||
| sp3120-4 | 32.56 | 0.189 | 6.86 | 0.440 | 6.86 | 0.983 | 6.73 | 3.123 | 6.73 | 6.597 | 6.73 | |||||
| Average | 16.04 | 0.164 | 0.87 | 0.344 | 0.82 | 0.692 | 0.78 | 1.757 | 0.78 | 3.514 | 0.78 | |||||
Table 3.
Computational results generated by the tabu search algorithm with .
| Instance | 0 iterations | 500 iterations | 1000 iterations | 2000 iterations | 5000 iterations | 10,000 iterations | ||||||||||
|---|---|---|---|---|---|---|---|---|---|---|---|---|---|---|---|---|
| Ratio (%) | Time (s) | Ratio (%) | Time (s) | Ratio (%) | Time (s) | Ratio (%) | Time (s) | Ratio (%) | Time (s) | Ratio (%) | ||||||
| ieee118-2 | 2.59 | 0.003 | 0.00 | 0.008 | 0.00 | 0.014 | 0.00 | 0.035 | 0.00 | 0.071 | 0.00 | |||||
| ieee118-3-a | 3.83 | 0.002 | 3.01 | 0.004 | 3.01 | 0.006 | 3.01 | 0.016 | 3.01 | 0.032 | 3.01 | |||||
| ieee118-3-b | 4.60 | 0.001 | 0.07 | 0.001 | 0.05 | 0.016 | 0.05 | 0.031 | 0.04 | 0.062 | 0.04 | |||||
| sop2737-2 | 27.45 | 0.272 | 0.00 | 0.488 | 0.00 | 0.922 | 0.00 | 2.187 | 0.00 | 4.298 | 0.00 | |||||
| sop2737-3 | 10.90 | 0.137 | 0.00 | 0.264 | 0.00 | 0.520 | 0.00 | 1.338 | 0.00 | 2.684 | 0.00 | |||||
| sop2737-4 | 10.55 | 0.171 | 0.00 | 0.400 | 0.00 | 0.806 | 0.00 | 2.085 | 0.00 | 4.207 | 0.00 | |||||
| wop2746-2 | 20.83 | 0.275 | 0.00 | 0.591 | 0.00 | 1.201 | 0.00 | 3.050 | 0.00 | 6.142 | 0.00 | |||||
| wop2746-3 | 13.72 | 0.214 | 0.01 | 0.445 | 0.01 | 0.889 | 0.01 | 2.284 | 0.01 | 4.694 | 0.01 | |||||
| wop2746-4 | 27.68 | 0.230 | 1.01 | 0.463 | 1.01 | 0.915 | 1.01 | 2.313 | 0.87 | 6.500 | 0.87 | |||||
| wp3012-2 | 0.43 | 0.193 | 0.01 | 0.432 | 0.01 | 0.878 | 0.01 | 2.241 | 0.01 | 4.441 | 0.01 | |||||
| wp3012-3 | 23.39 | 0.288 | 0.33 | 0.681 | 0.33 | 1.191 | 0.01 | 2.526 | 0.01 | 4.760 | 0.01 | |||||
| wp3012-4 | 23.26 | 0.106 | 0.01 | 0.211 | 0.01 | 0.435 | 0.01 | 1.076 | 0.01 | 2.164 | 0.01 | |||||
| sp3120-2 | 2.49 | 0.225 | 0.00 | 0.501 | 0.00 | 1.084 | 0.00 | 2.862 | 0.00 | 4.862 | 0.00 | |||||
| sp3120-3 | 36.38 | 0.312 | 1.87 | 0.697 | 1.29 | 1.335 | 1.29 | 3.028 | 1.29 | 5.856 | 1.29 | |||||
| sp3120-4 | 32.56 | 0.187 | 6.73 | 0.425 | 6.73 | 1.005 | 6.63 | 2.639 | 6.63 | 9.468 | 6.63 | |||||
| Average | 16.04 | 0.174 | 0.87 | 0.374 | 0.83 | 0.748 | 0.80 | 1.847 | 0.79 | 4.016 | 0.79 | |||||
We pictorially present the final solutions of instances ieee118-2, ieee118-3-a and ieee118-3-b in Figure 14, Figure 15, Figure 16 and Figure 17, where the black circles denote the generator nodes, the white circles are load nodes and the names of the tripped edges are shown at the bottom of each figure. The algorithms with and produced the same solutions for instances ieee118-2 and ieee118-3-a, which are shown in Figure 14 and Figure 15.
Assuming the generator coherence after the disturbances is known, we compared our algorithm with some existing approaches on the IEEE 39-bus system and the IEEE 118-bus system. Aghamohammadi and Shahmohammadi [35] split the IEEE 39-bus system into four islands using their proposed ant search algorithm. Table 4 presents the performance comparison between the ant search algorithm and our tabu search algorithm on the IEEE 39-bus system. The power imbalances created by our tabu search algorithm and the ant search algorithm are 1026.8 and 1670.3 MW, respectively. The time consumed by the ant search algorithm on a machine with a 2.6-GHz CPU is 1 s, while our tabu search algorithm only used 0.001 s (500 iterations) on a machine with a 3.3-GHz CPU. Our tabu search algorithm is a kind of single core algorithm whose time consumption is equivalent to about 0.0013 s on a machine with a 2.6-GHz CPU. Therefore, our algorithm is superior to the ant search algorithm in terms of the computation time and solution quality on this power system.

Figure 10.
The convergence curves of the first six instances generated by the algorithm with .
Figure 10.
The convergence curves of the first six instances generated by the algorithm with .
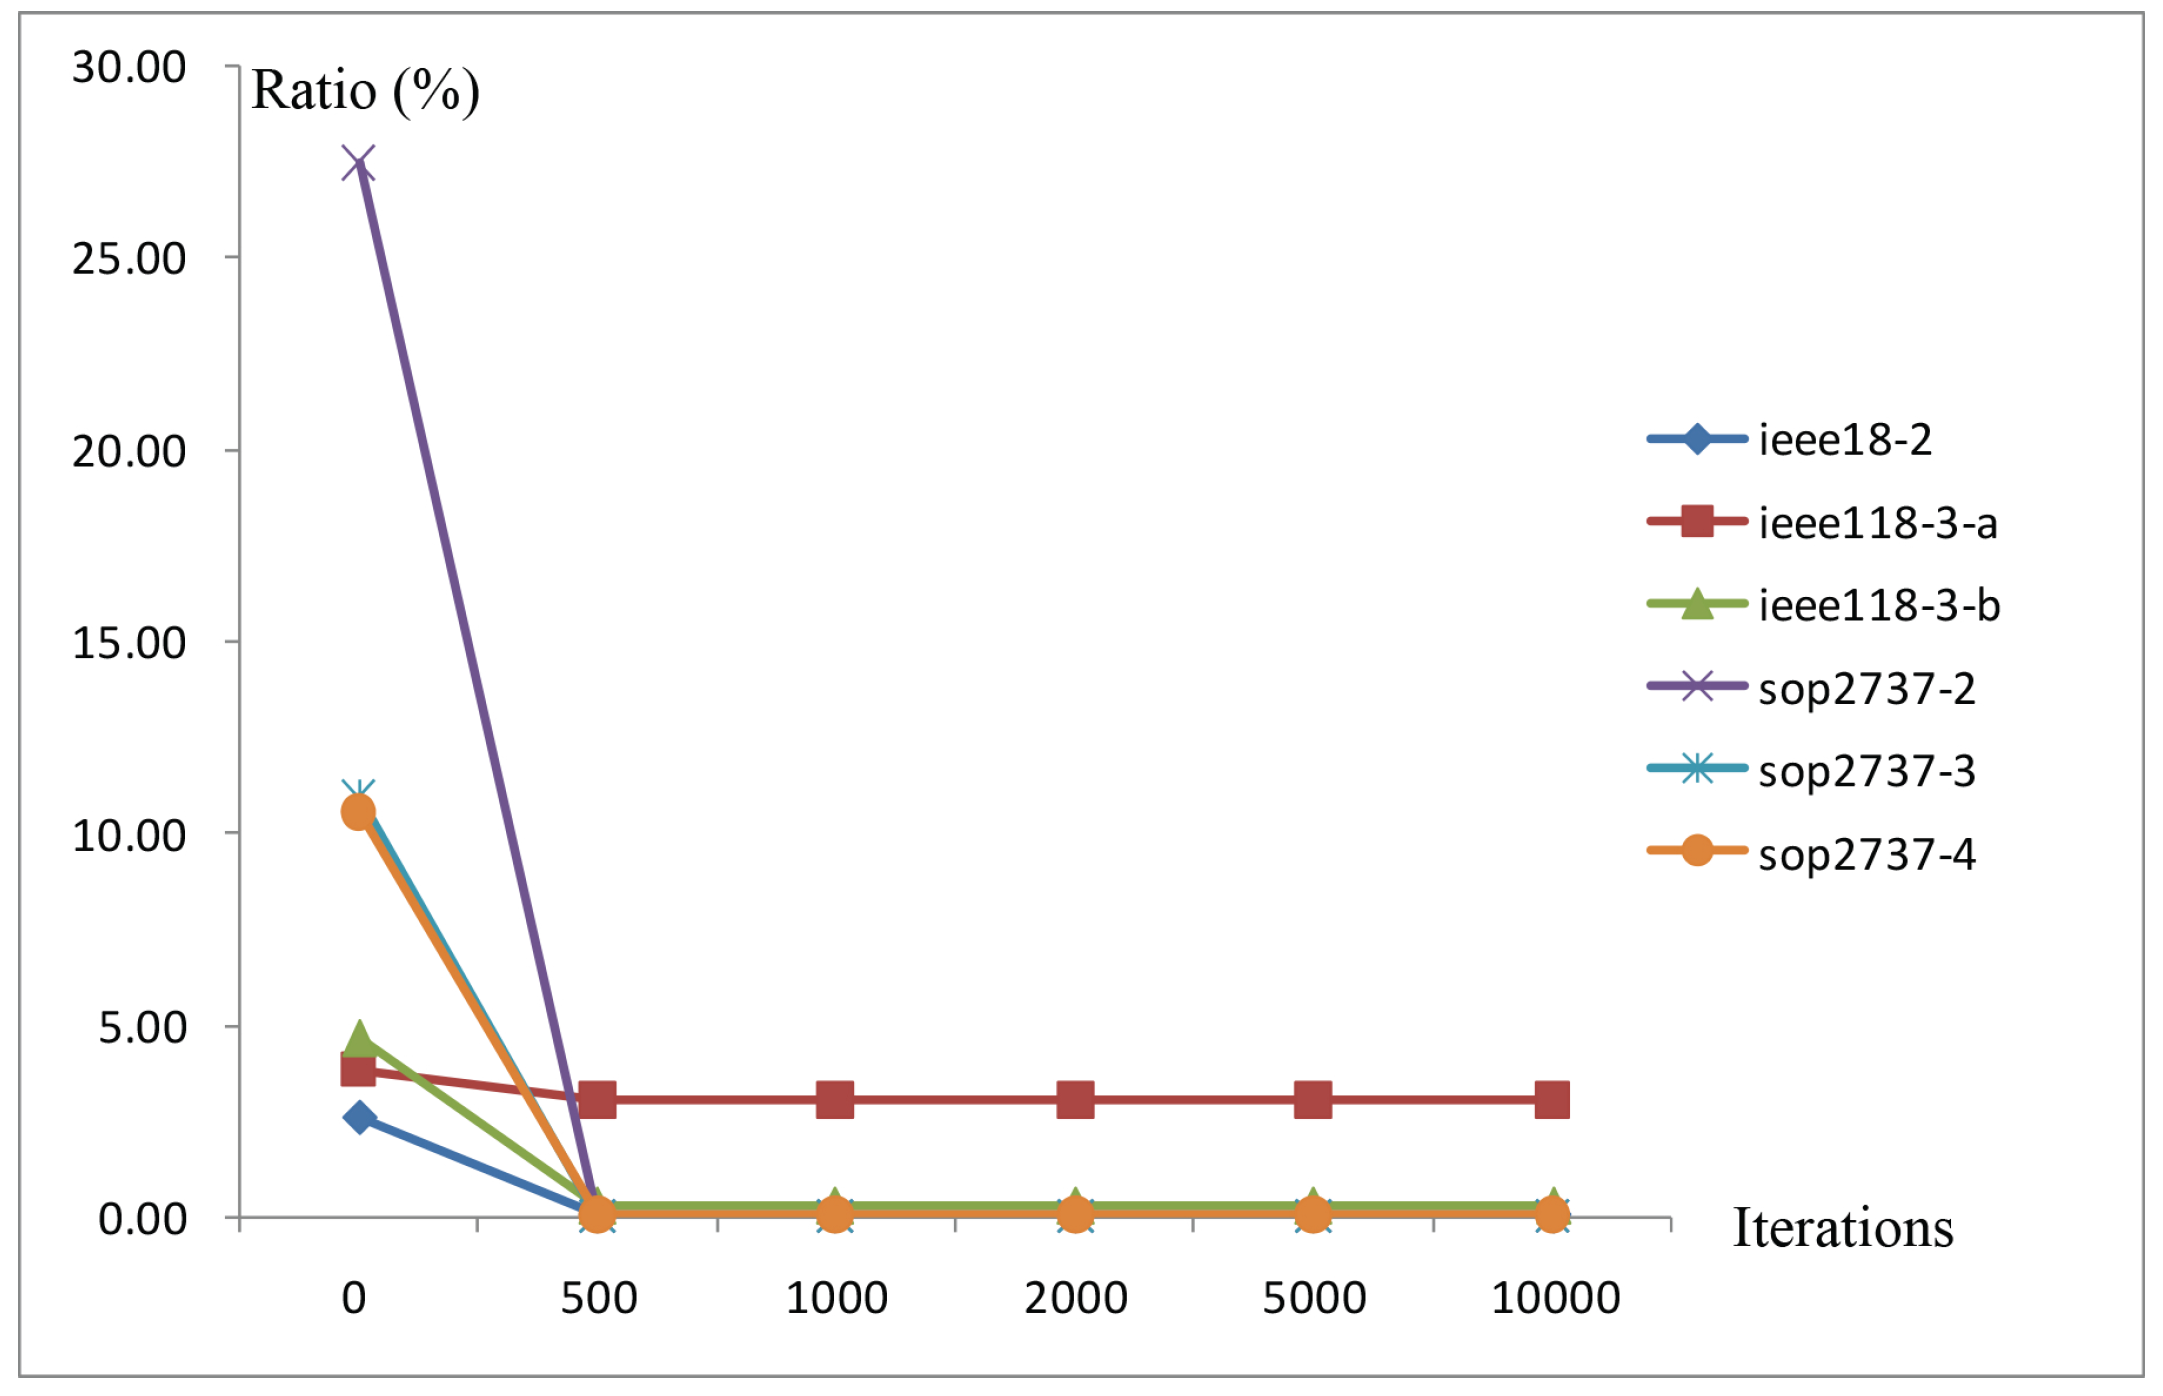
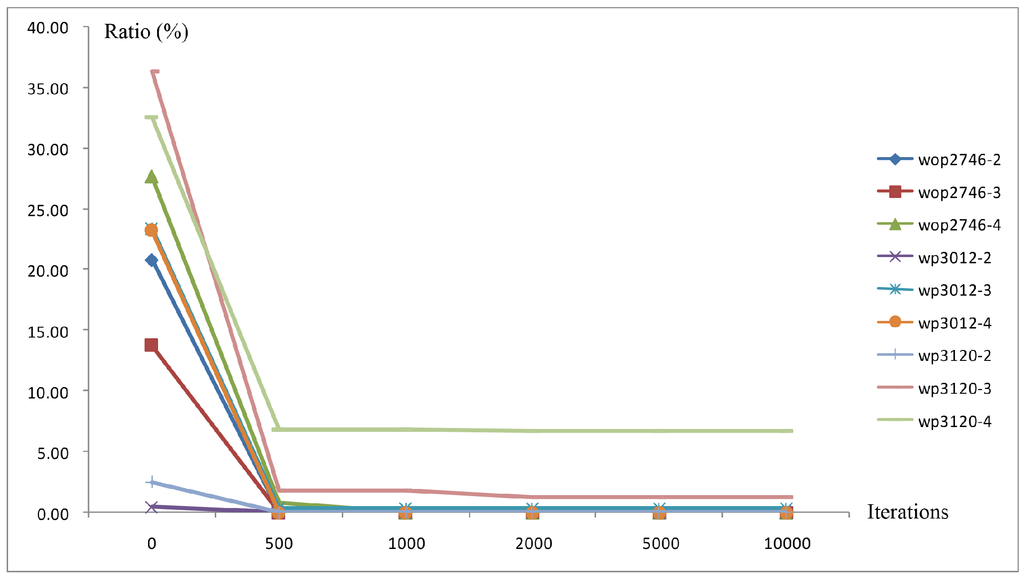
Figure 11.
The convergence curves of the remaining nine instances generated by the algorithm with .
Figure 11.
The convergence curves of the remaining nine instances generated by the algorithm with .
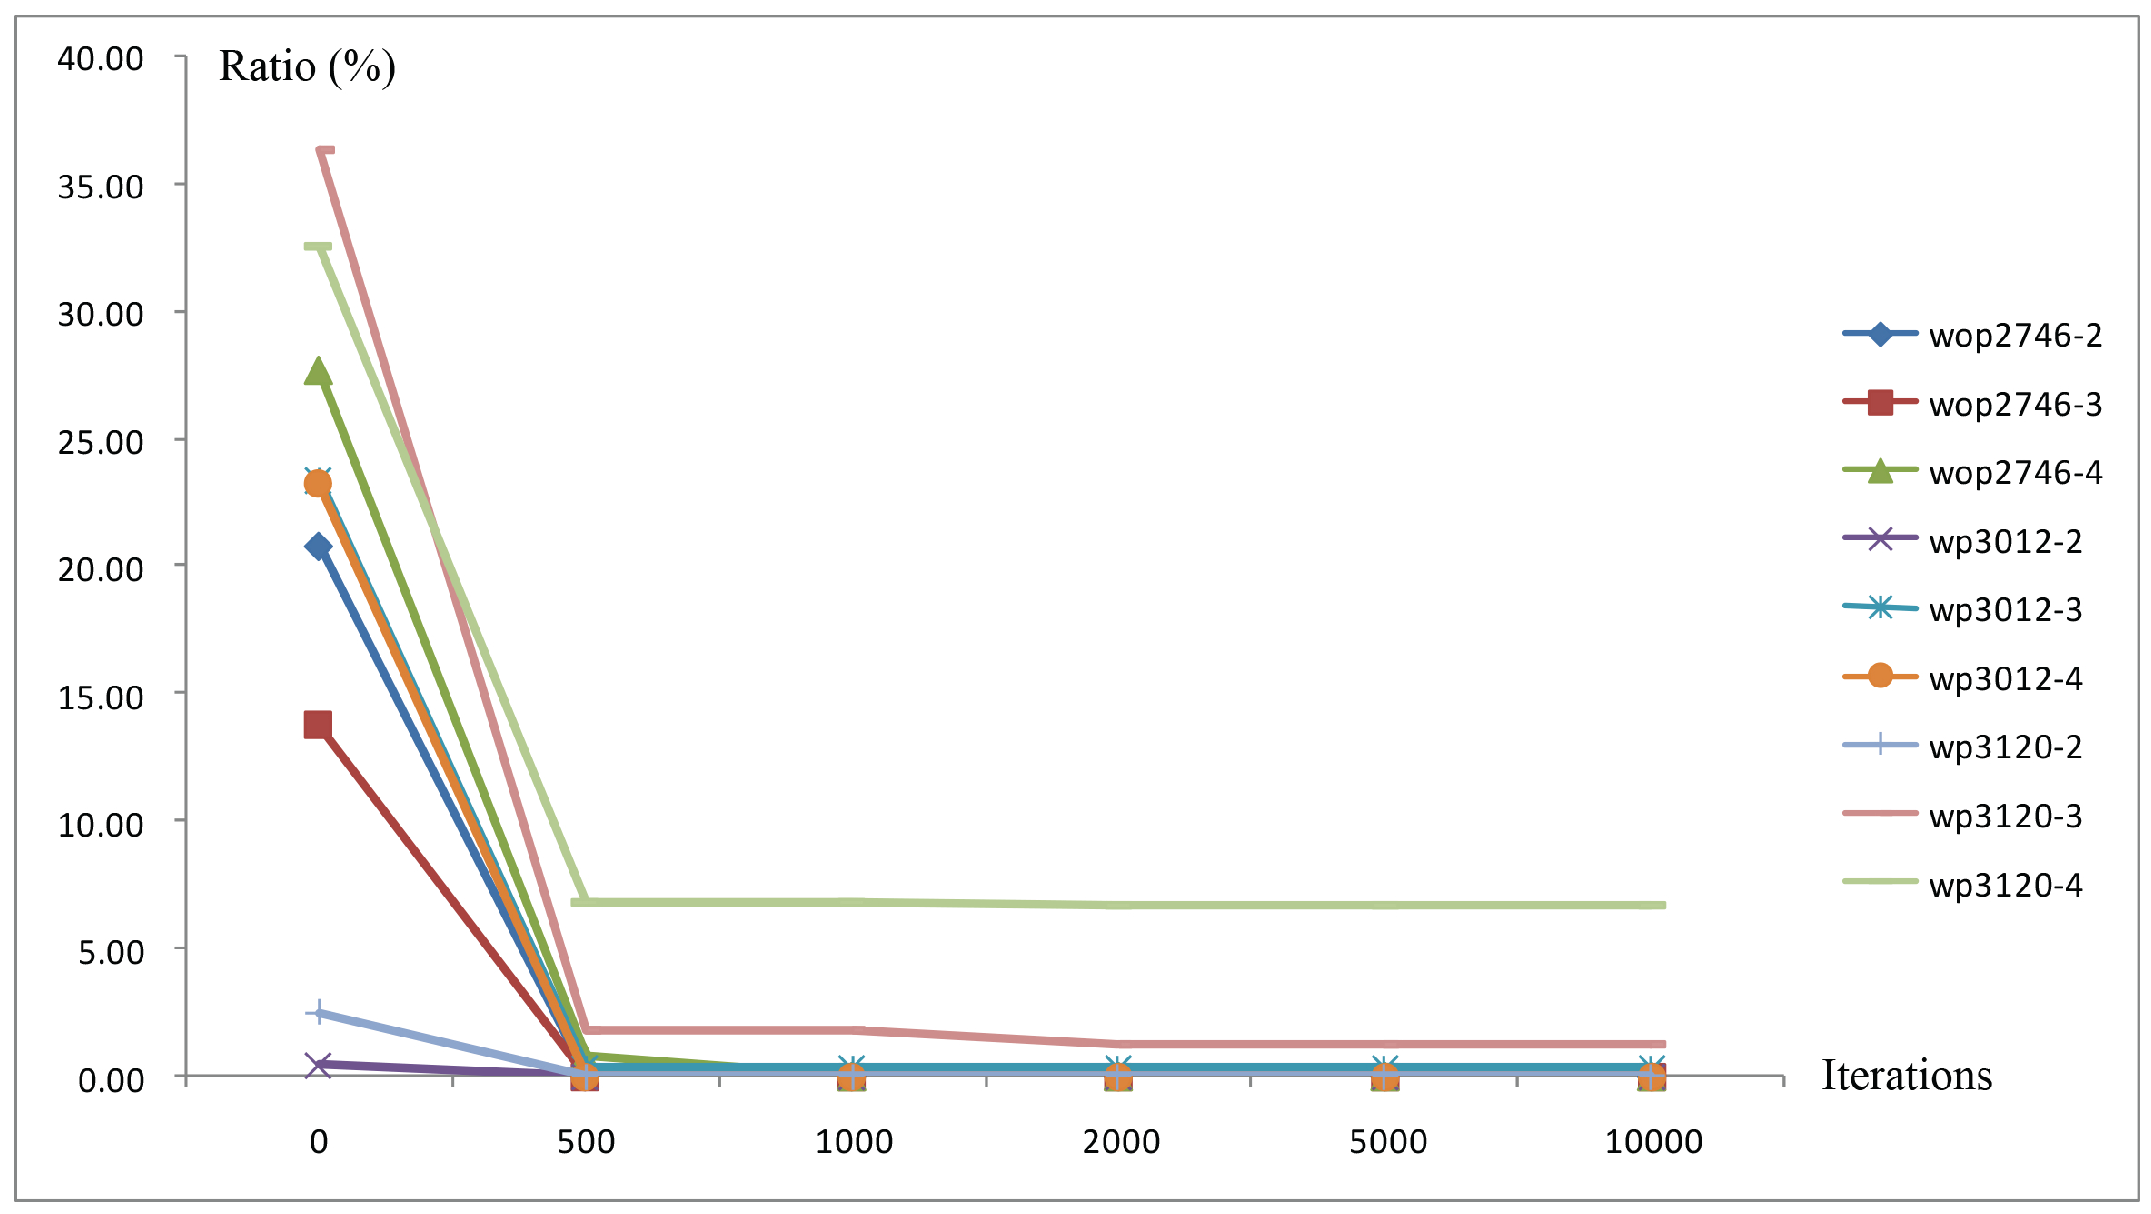
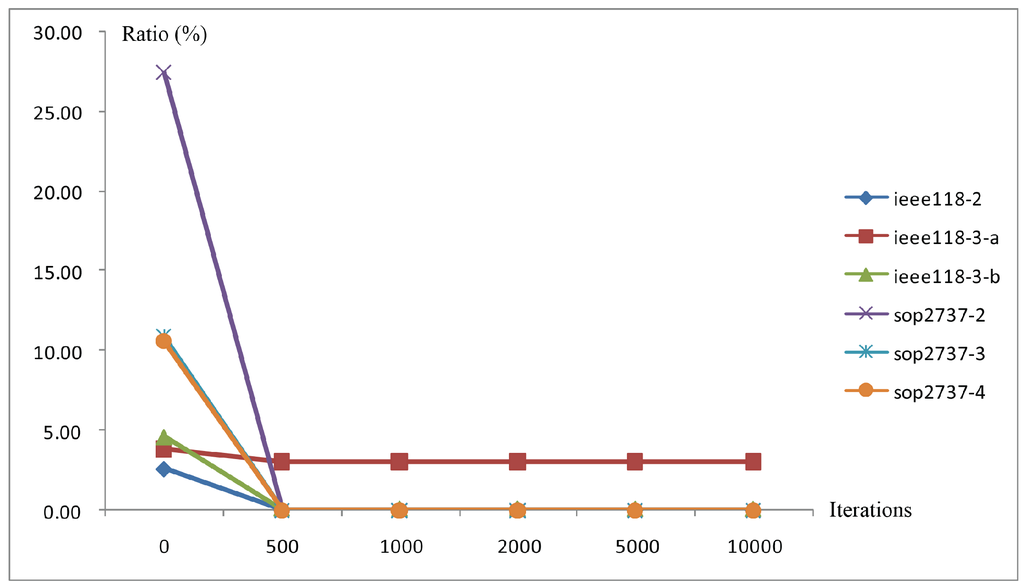
Figure 12.
The convergence curves of the first six instances generated by the algorithm with .
Figure 12.
The convergence curves of the first six instances generated by the algorithm with .
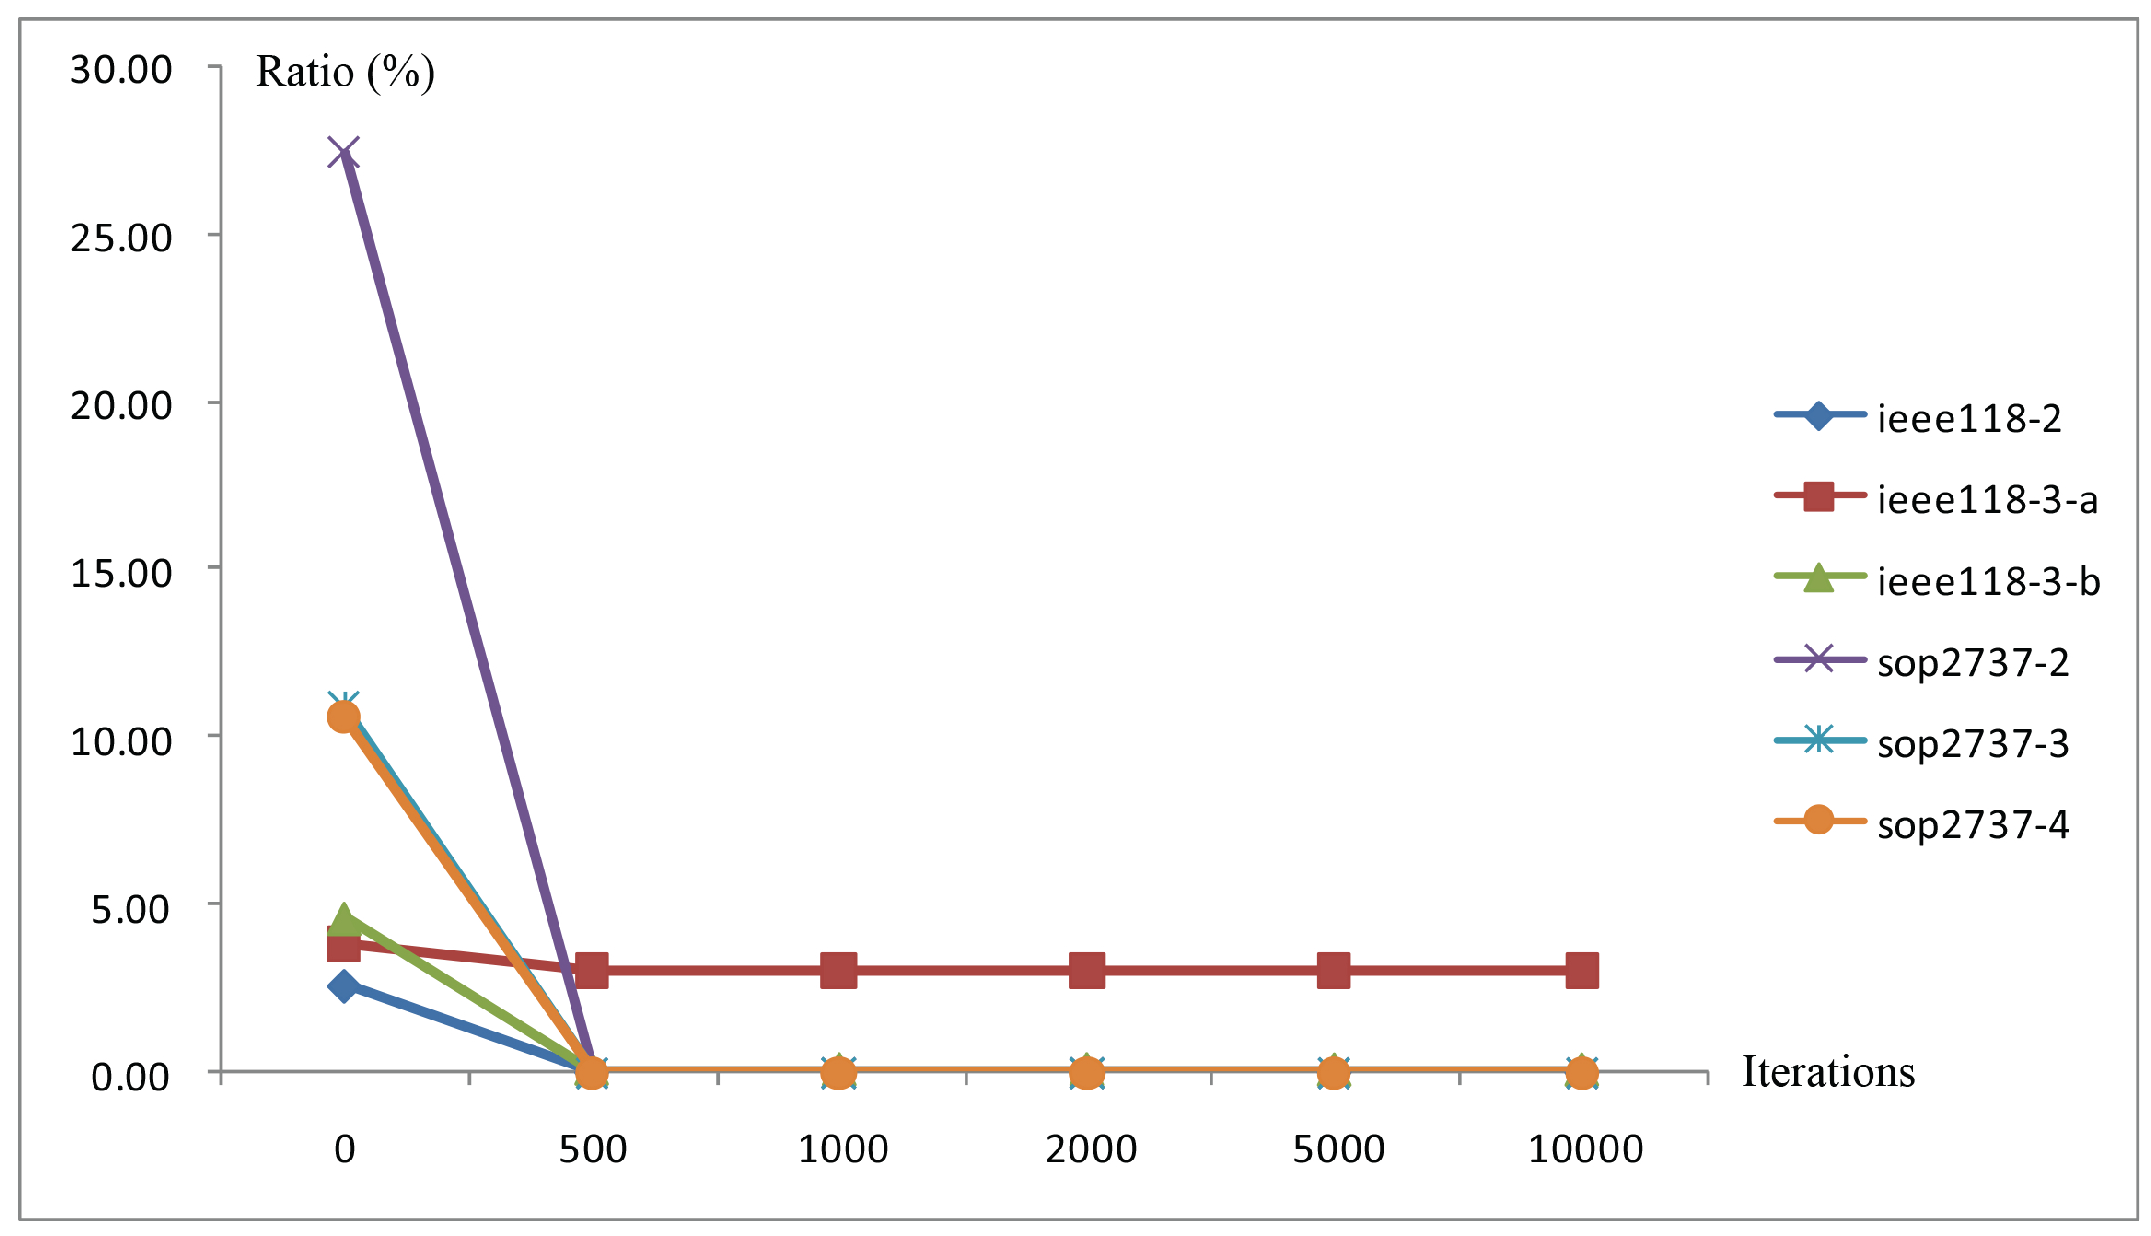

Figure 13.
The convergence curves of the remaining nine instances generated by the algorithm with .
Figure 13.
The convergence curves of the remaining nine instances generated by the algorithm with .
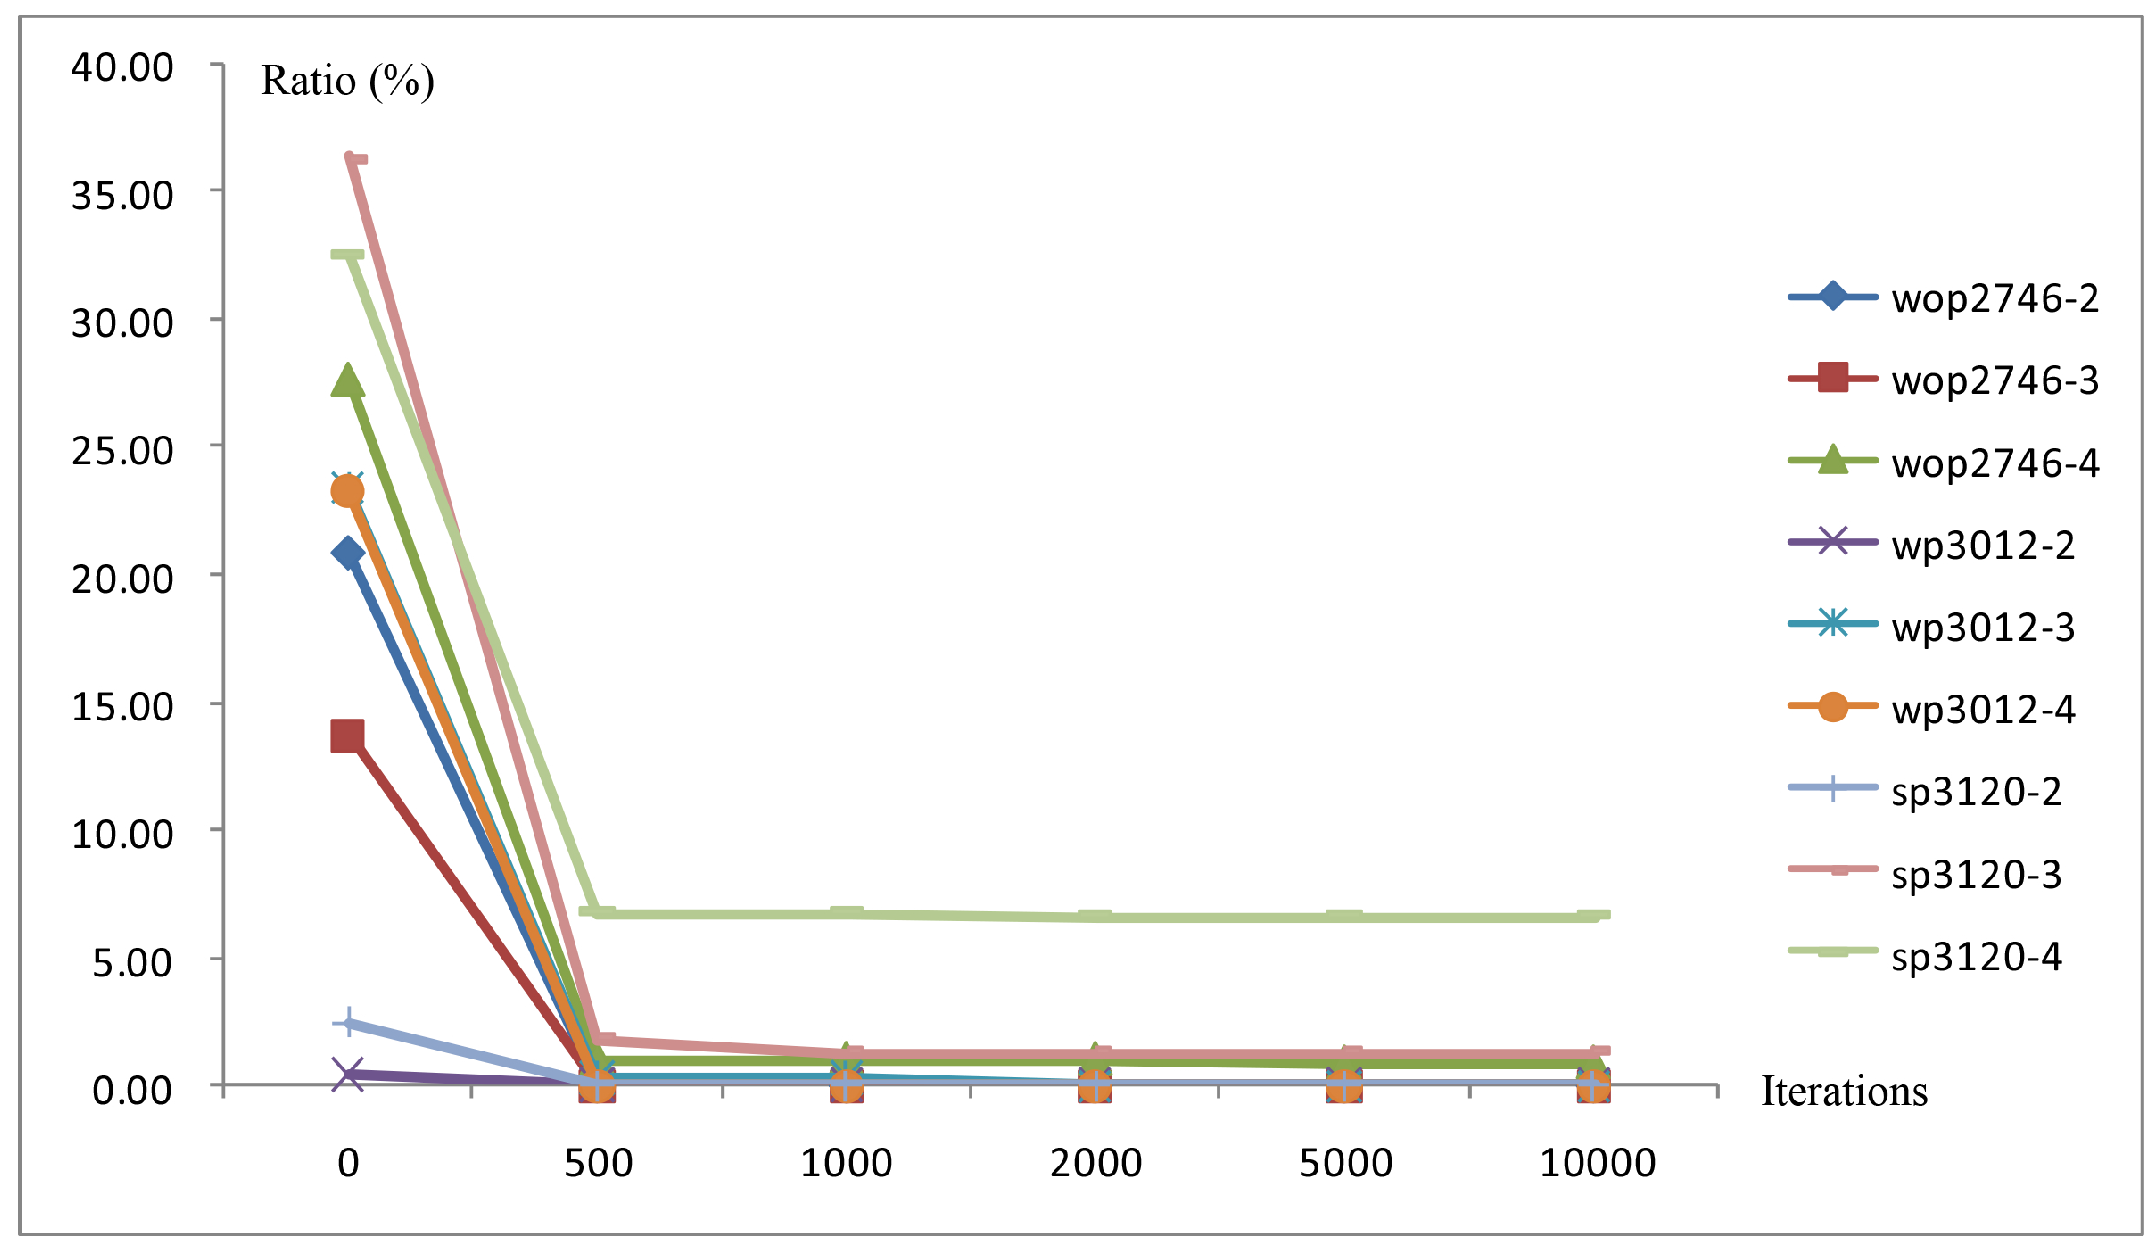

Figure 14.
The pictorial result of instance ieee118-2.
Figure 14.
The pictorial result of instance ieee118-2.
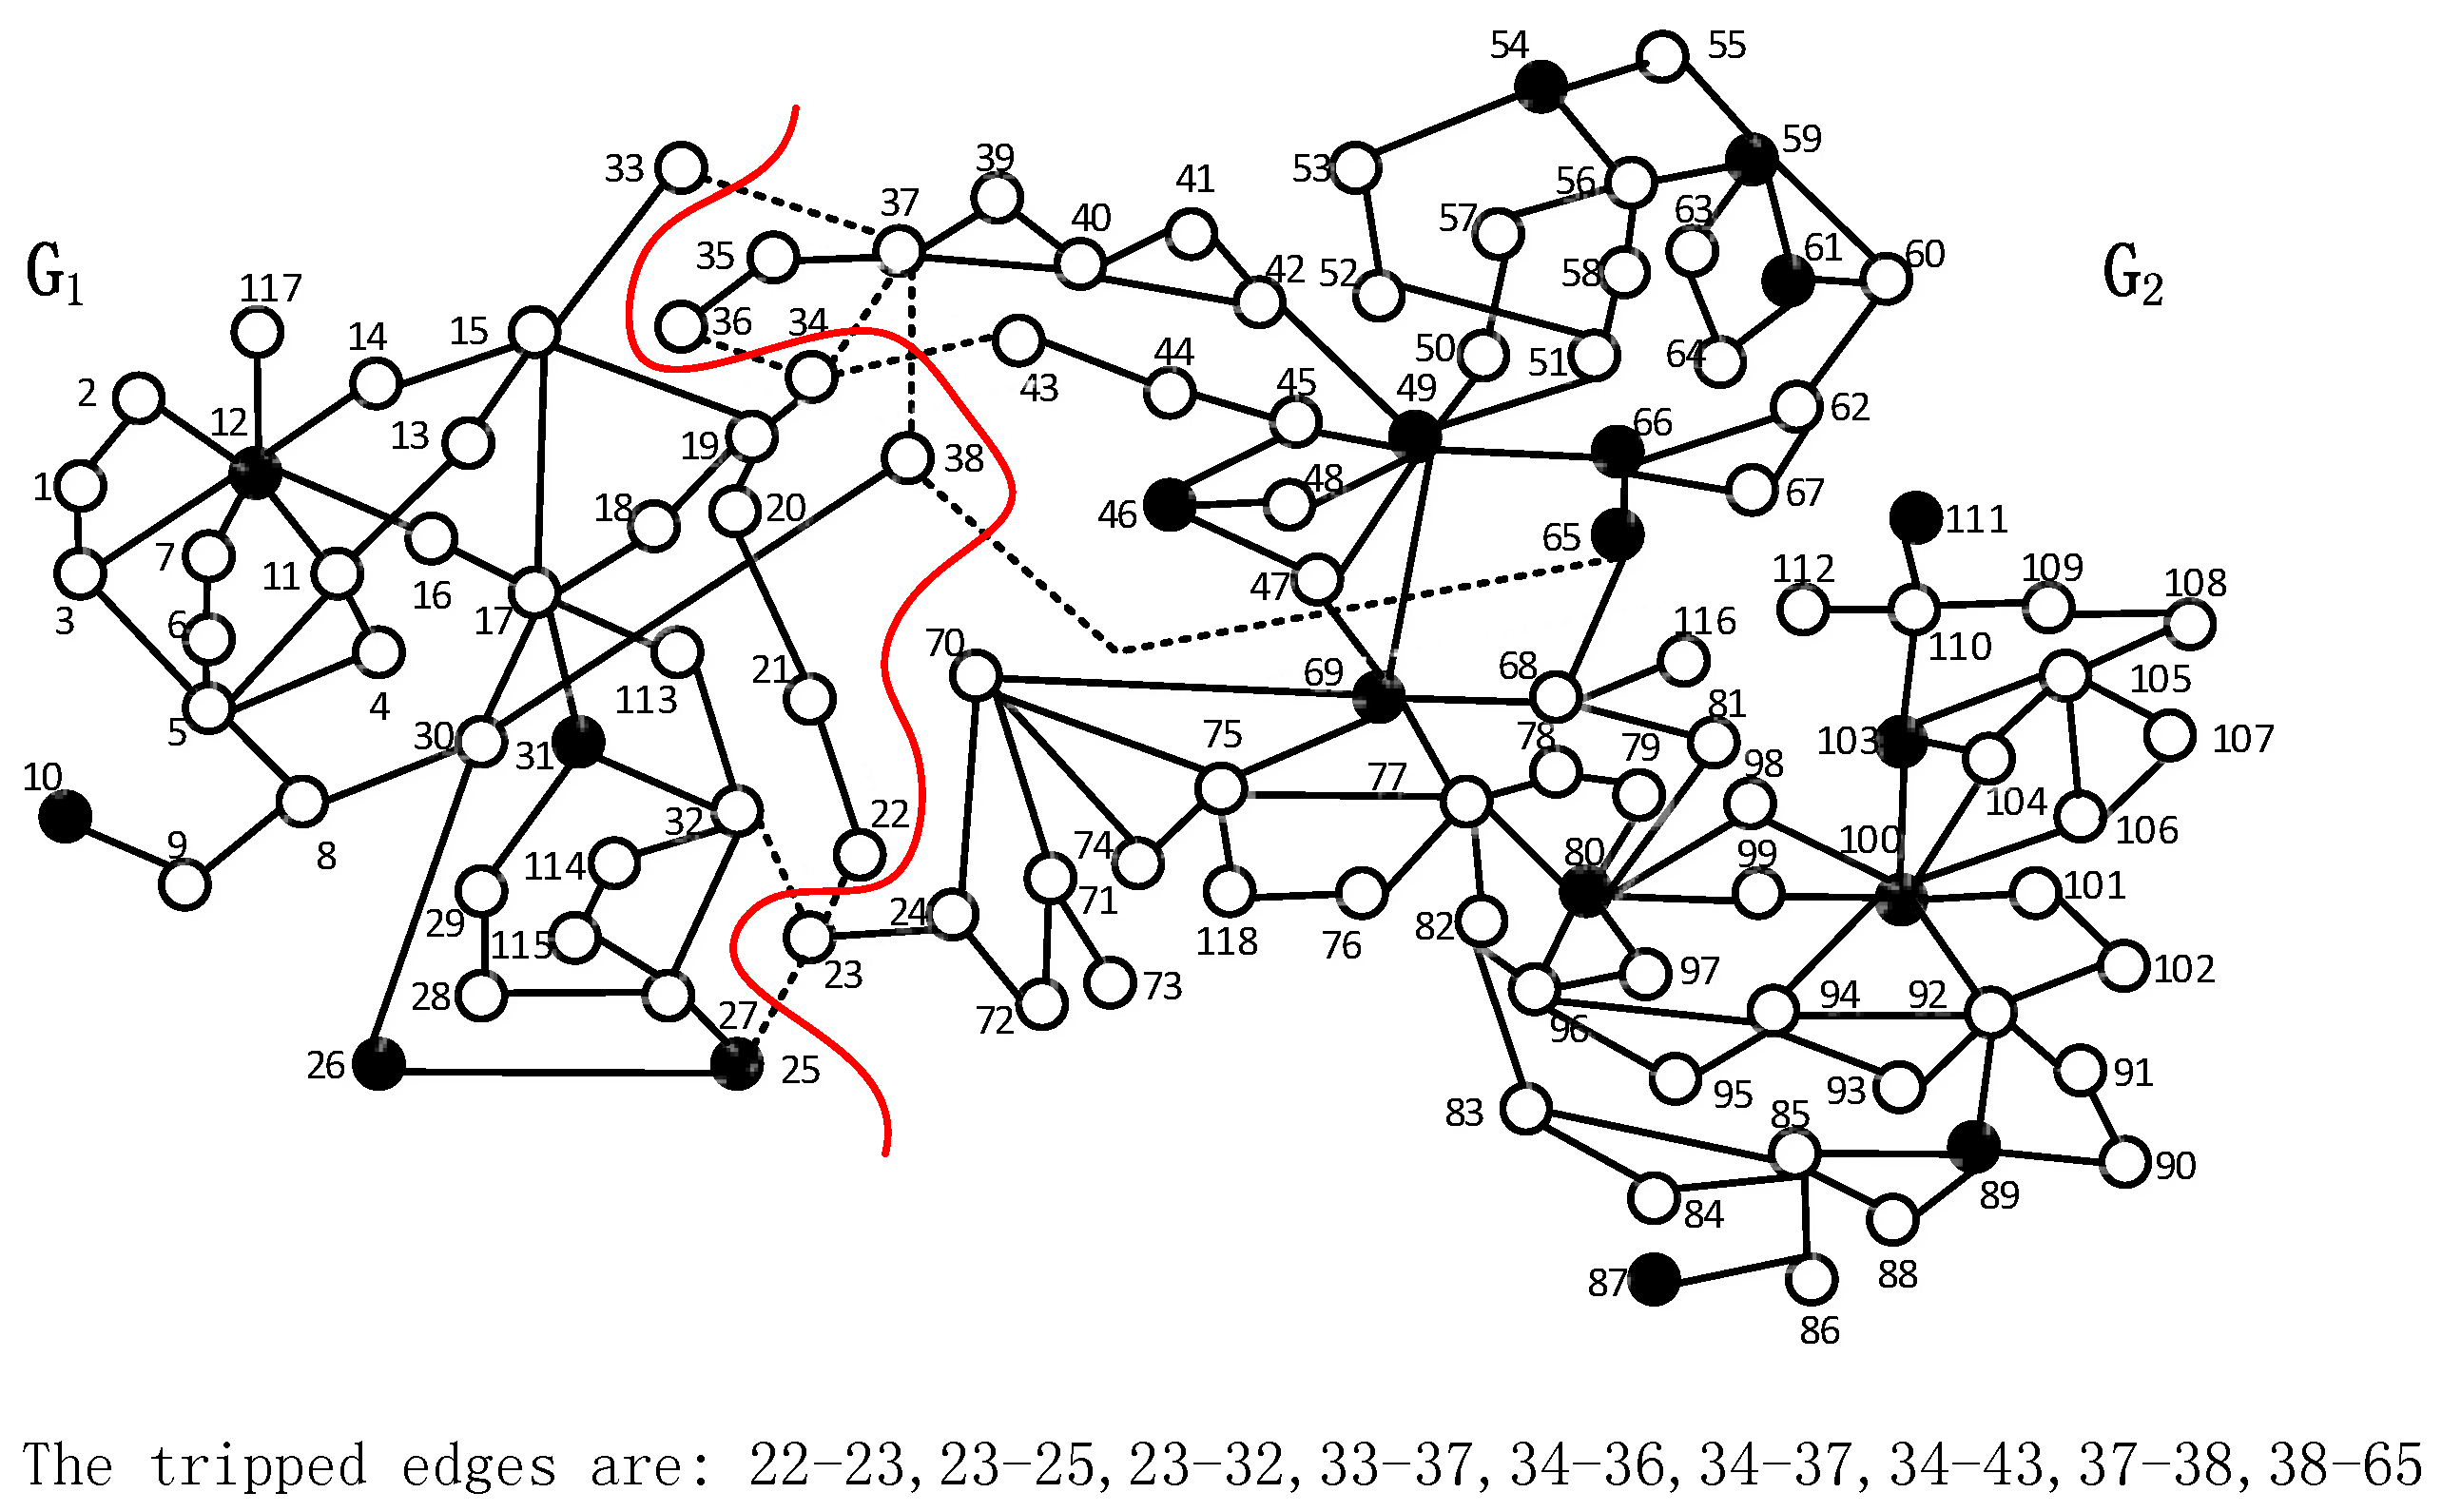
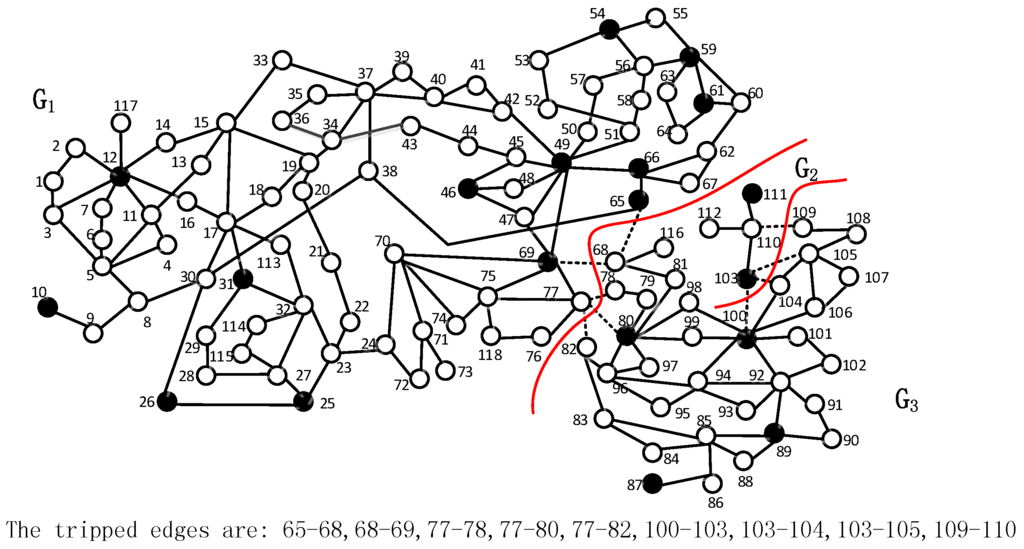
Figure 15.
The pictorial result of instance ieee118-3-a.
Figure 15.
The pictorial result of instance ieee118-3-a.

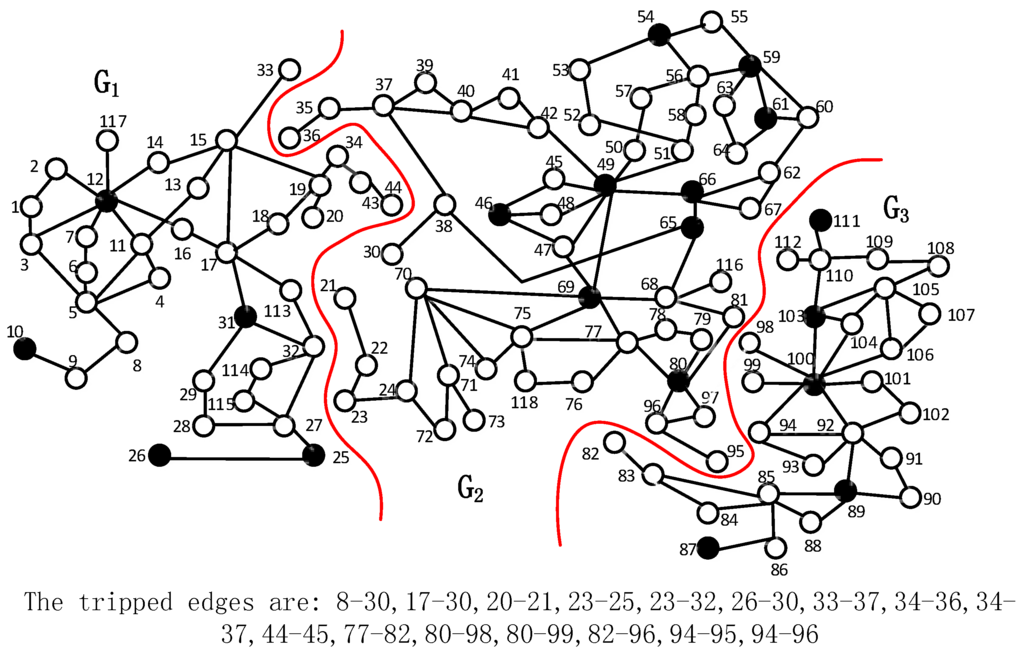
Figure 16.
The pictorial result of instance ieee118-3-b generated by the algorithm with .
Figure 16.
The pictorial result of instance ieee118-3-b generated by the algorithm with .
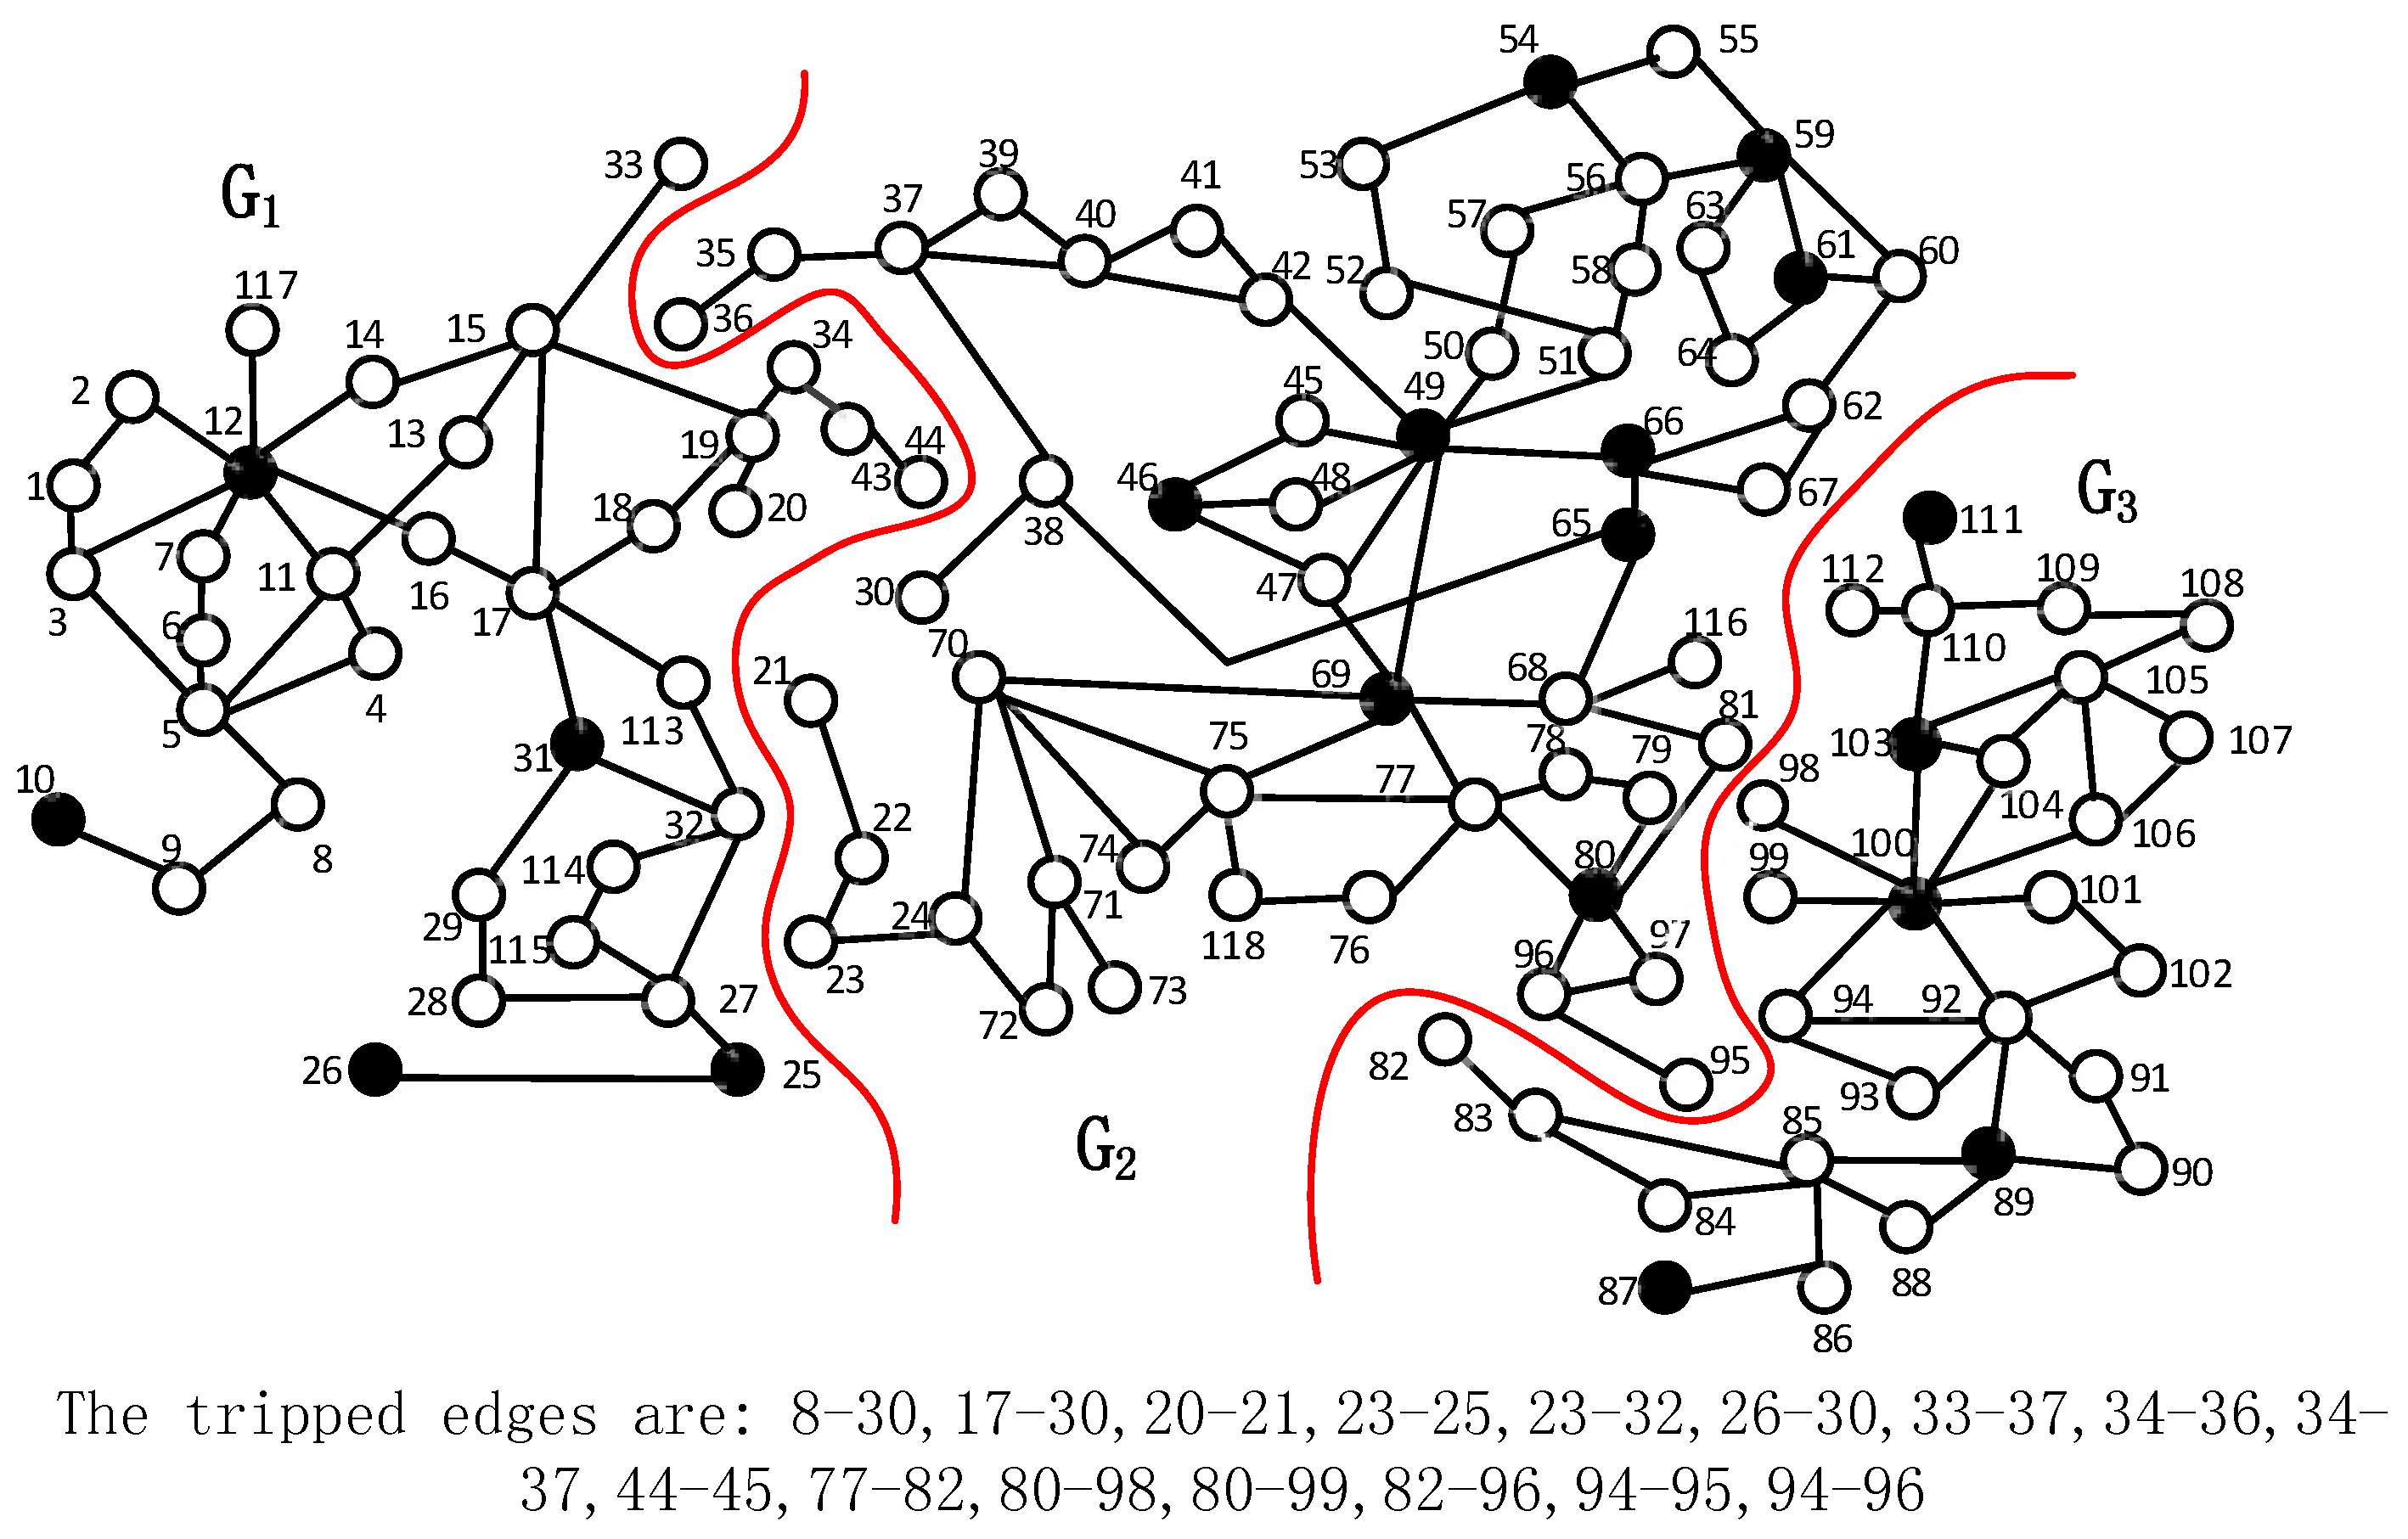

Figure 17.
The pictorial result of instance ieee118-3-b generated by the algorithm with .
Figure 17.
The pictorial result of instance ieee118-3-b generated by the algorithm with .
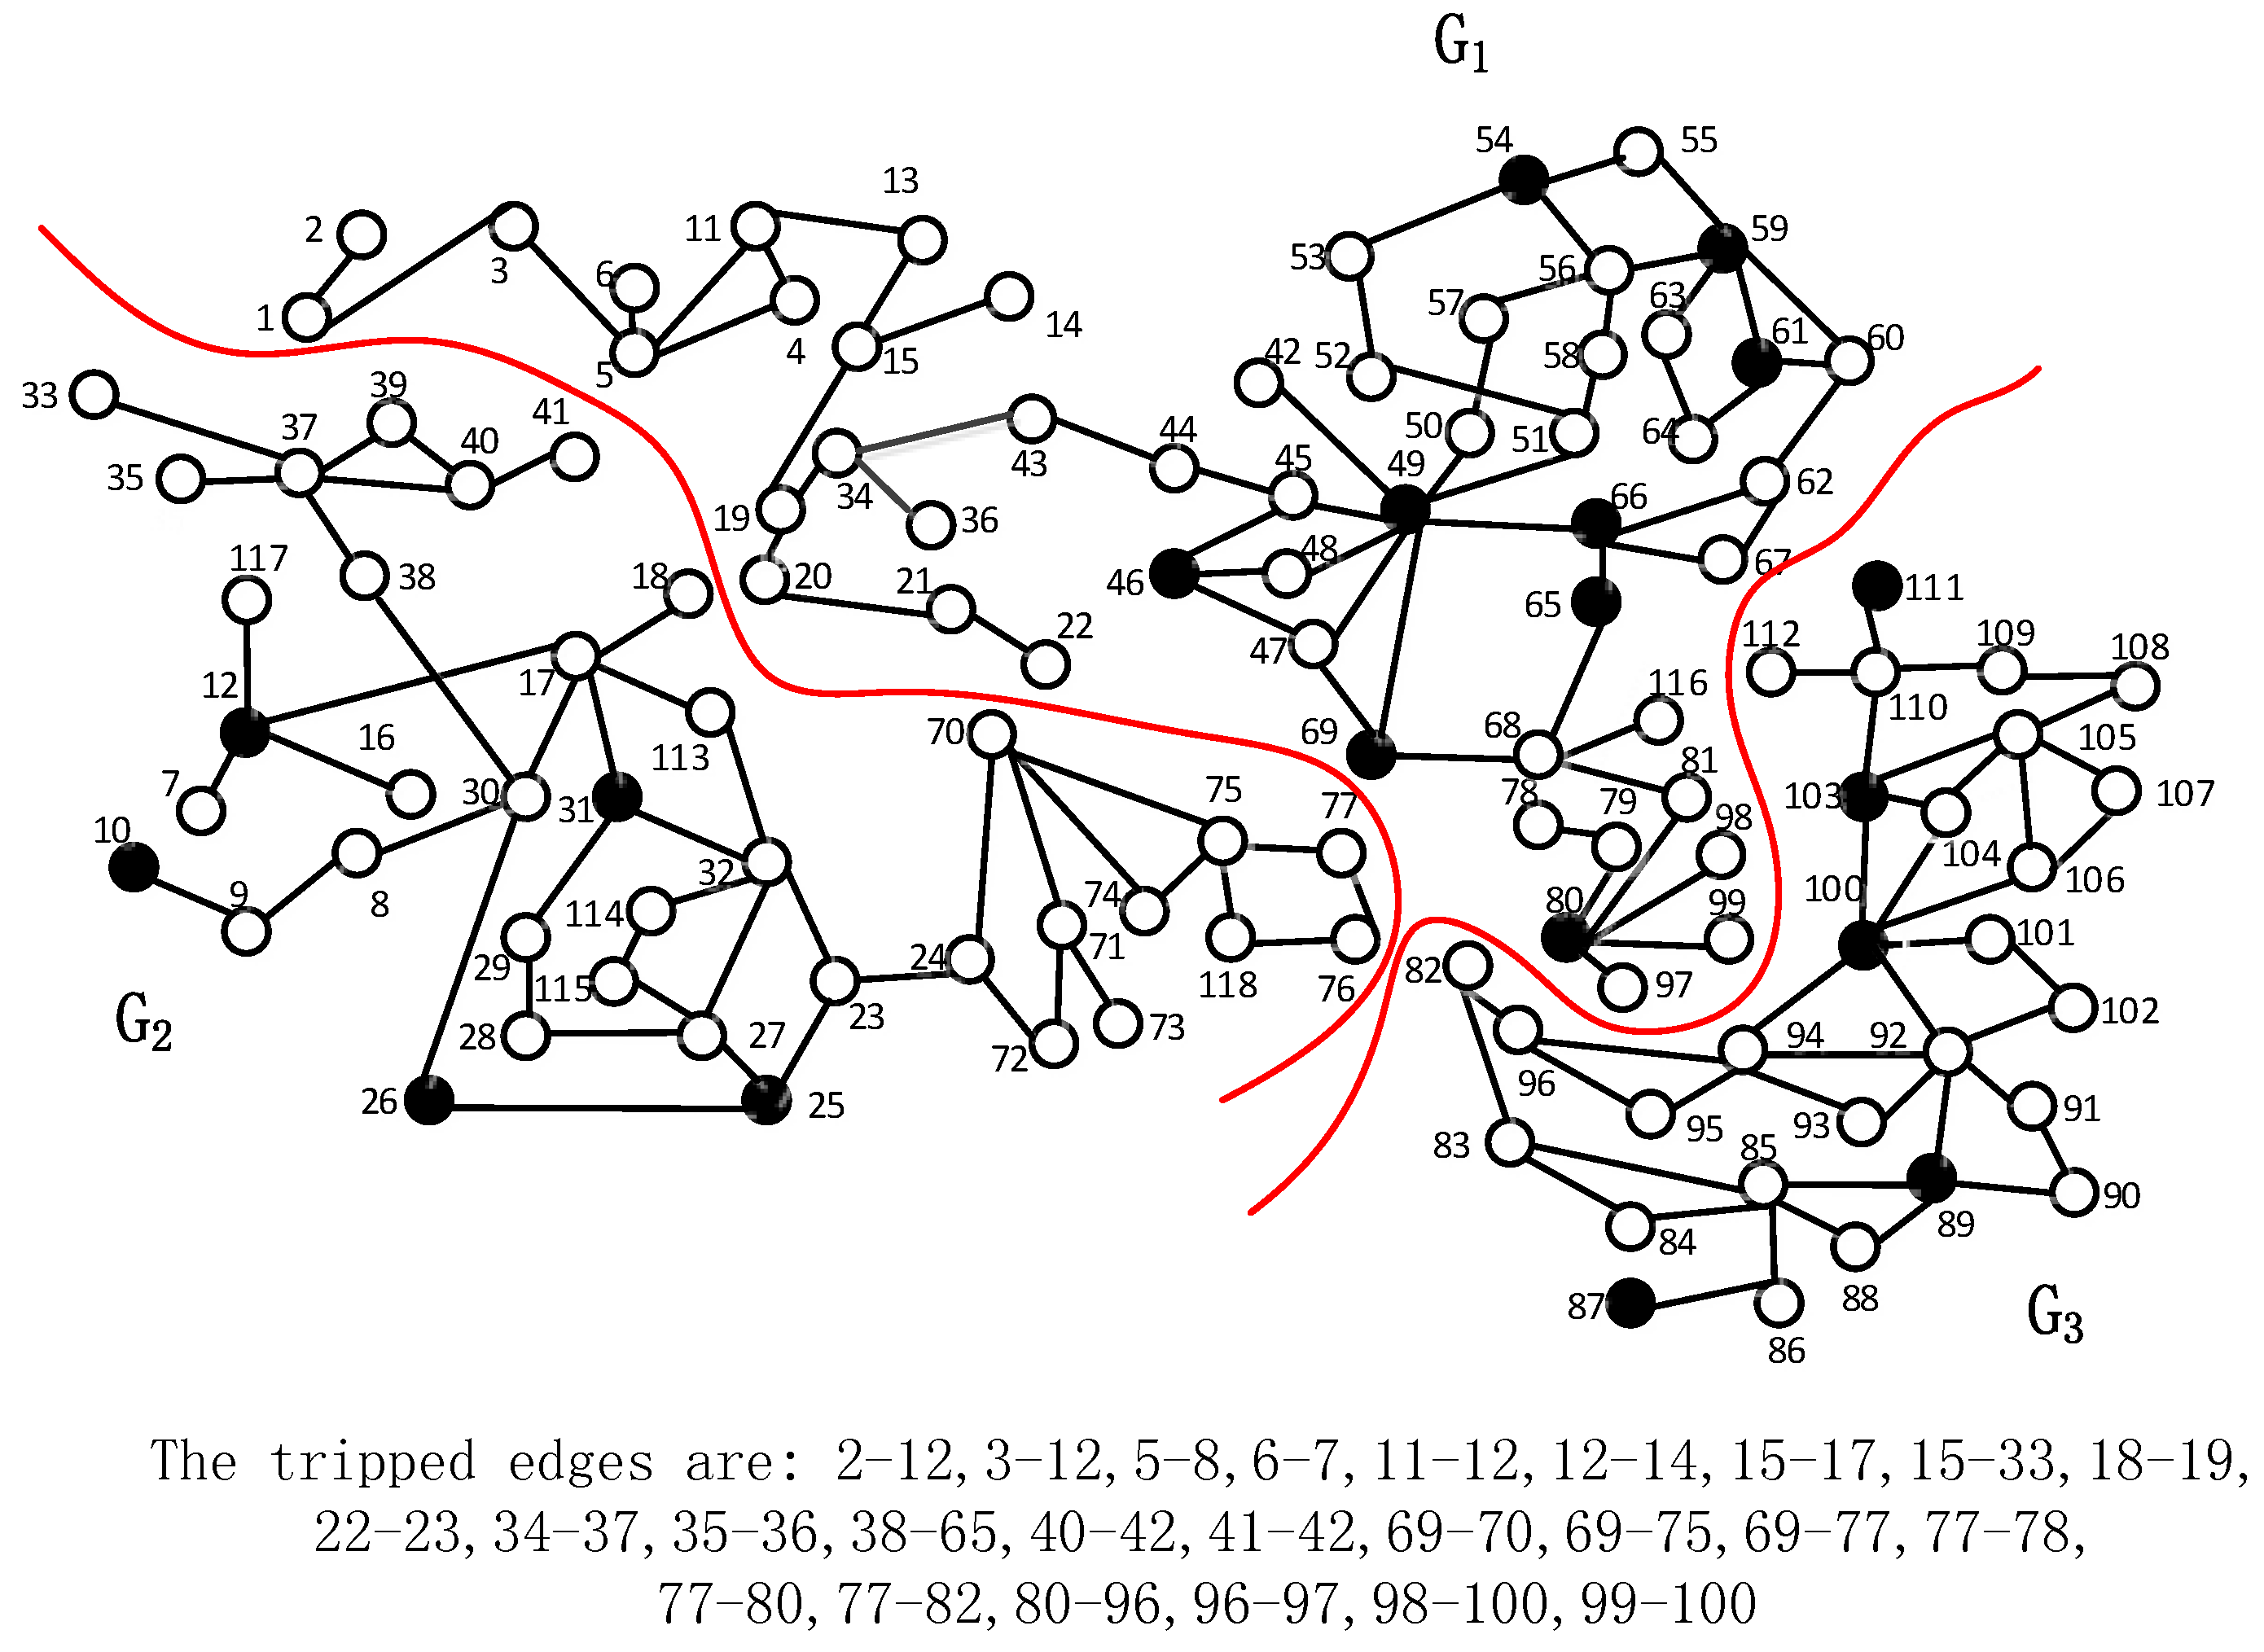
Table 4.
Performance comparison between the ant search algorithm and our tabu search algorithm on the IEEE 39-bus system.
| Method | Separation Boundaries | Imbalance Power (MW) | Imbalance Power (Ratio %) | Time |
|---|---|---|---|---|
| Tabu search | 25-26, 17-18, 17-16, 14-4, 14-13, 12-13, 4-5, 1-2 | 1026.8 | 16.40% | 0.001s |
| Ant search | 25-26, 17-18, 17-16, 16-15, 10-13, 13-12, 4-5, 1-2 | 1670.3 | 26.60% | 1 s |
Wang et al. [26] and Sun et al. [18] split the IEEE 118-bus system into three islands using the fast method and the OBDD (Ordered Binary Decision Diagram) based method. We present the performance comparison for the IEEE 118-bus system in Table 5. The fast method and our tabu search algorithm obtained the same power imbalance, namely 119.3 MW. The fast method consumed 0.012 s on a machine with a 2.2-GHz CPU, while our algorithm used 0.004 s (500 iterations) on a machine with a 3.3-GHz CPU. Our computation time is equivalent to about 0.006 s on a 2.2-GHz CPU machine. Therefore, our algorithm is better than the fast method, since it obtained the same solution with less computation time. The power imbalance obtained by our algorithm is greater than that obtained by the OBDD-based method. However, the OBDD-based method found different splitting strategies in five runs, and each run required much more time than our algorithm. Sun et al. [18] also claimed that their method is not applicable to large power systems. Before running the OBDD-based method, the power system needs to be simplified to the one with only 100 nodes. The time consumed by the OBDD-based method is 5 s, and the program was ran on a machine with a 1.86-GHz CPU. However, the computation time of our algorithm is only 0.004 s (500 iterations) on a machine with a 3.3-GHz CPU. Therefore, our algorithm requires less computational time, and the power imbalance can also be controlled under less than 3% of the total generation power.
Table 5.
Performance comparison for the IEEE 118-bus system. OBDD (Ordered Binary Decision Diagram), ordered binary decision diagram.
| Method | Separation Boundaries | Imbalance Power (MW) | Imbalance Power (Ratio %) | Time | |
|---|---|---|---|---|---|
| Tabu search | 15-33, 34-36, 37-34, 34-43, 30-38, 70-24, 24-72, 111-109, 103-105, 103-104, 103-100 | 119.3 | 2.73% | 0.004 s | |
| Fast search [26] | 15-33, 34-36, 37-34, 34-43, 30-38, 70-24, 24-72, 111-109, 103-105, 103-104, 103-100 | 119.3 | 2.73% | 0.012 s | |
| OBDD-based method [18] | Run 1 | 23-24, 30-38, 19-34, 15-33, 77-82, 96-97, 80-96, 98-100, 80-99 | 148.7 | 3.40% | 5 s |
| Run 2 | 23-24, 30-38, 19-34, 33-37, 77-82, 80-97, 80-96, 98-100, 80-99 | 113.3 | 2.59% | 5 s | |
| Run 3 | 30-38, 15-33, 19-34, 69-70, 70-74, 70-75, 77-82, 96-97, 80-96, 98-100, 99-100 | 52.47 | 1.20% | 5 s | |
| Run 4 | 30-38, 15-33, 19-34, 24-70, 24-72, 77-82, 80-97, 80-96, 98-100, 99-100 | 112.6 | 2.57% | 5 s | |
| Run 5 | 77-82, 96-97, 80-96, 98-100, 80-99, 23-24, 30-38, 19-34, 33-37 | 102.7 | 2.35% | 5 s | |
5.3. Simulation Studies
This section presents our simulation results. We used the dynamic models of the IEEE 39-bus and IEEE 162-bus test systems and a reduced real power system in China to demonstrate that our algorithm can minimize the impact of cascading outages with the aid of the proper post-separation actions.
5.3.1. Test Case 1: The IEEE 39-Bus System
The IEEE 10-generator and 39-bus system actually represents a 345-kV power network in New England, the United States. The system consists of 10 generators and 46 branches, and its total generated power is 6297.9 MW [36]. To simulate large disturbances in the power system, all time-domain simulations for the IEEE 39-bus system are performed using DIgSILENT PowerFactory [37]. We assume that at , a three phase-to-ground solid fault happens at bus Node 27, and the fault is cleared after 0.19 s. If the system splitting measures are not taken, the figures of the generator angle curves, bus voltage curves and generator frequency curves can be observed from Figure 18b–d.
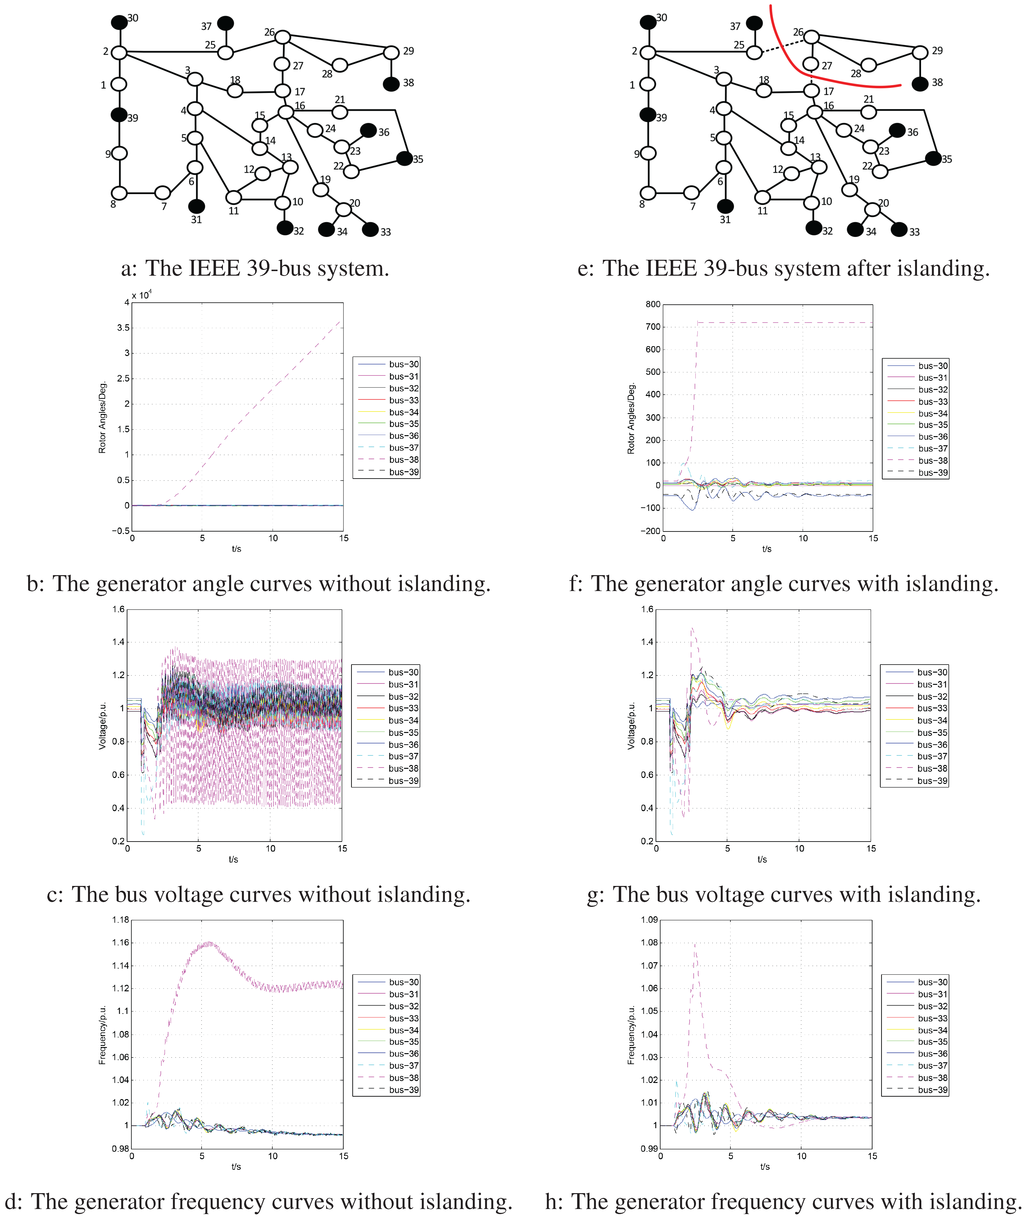
Figure 18.
Comparisons with and without the islanding on the IEEE 39-bus system.
Figure 18.
Comparisons with and without the islanding on the IEEE 39-bus system.
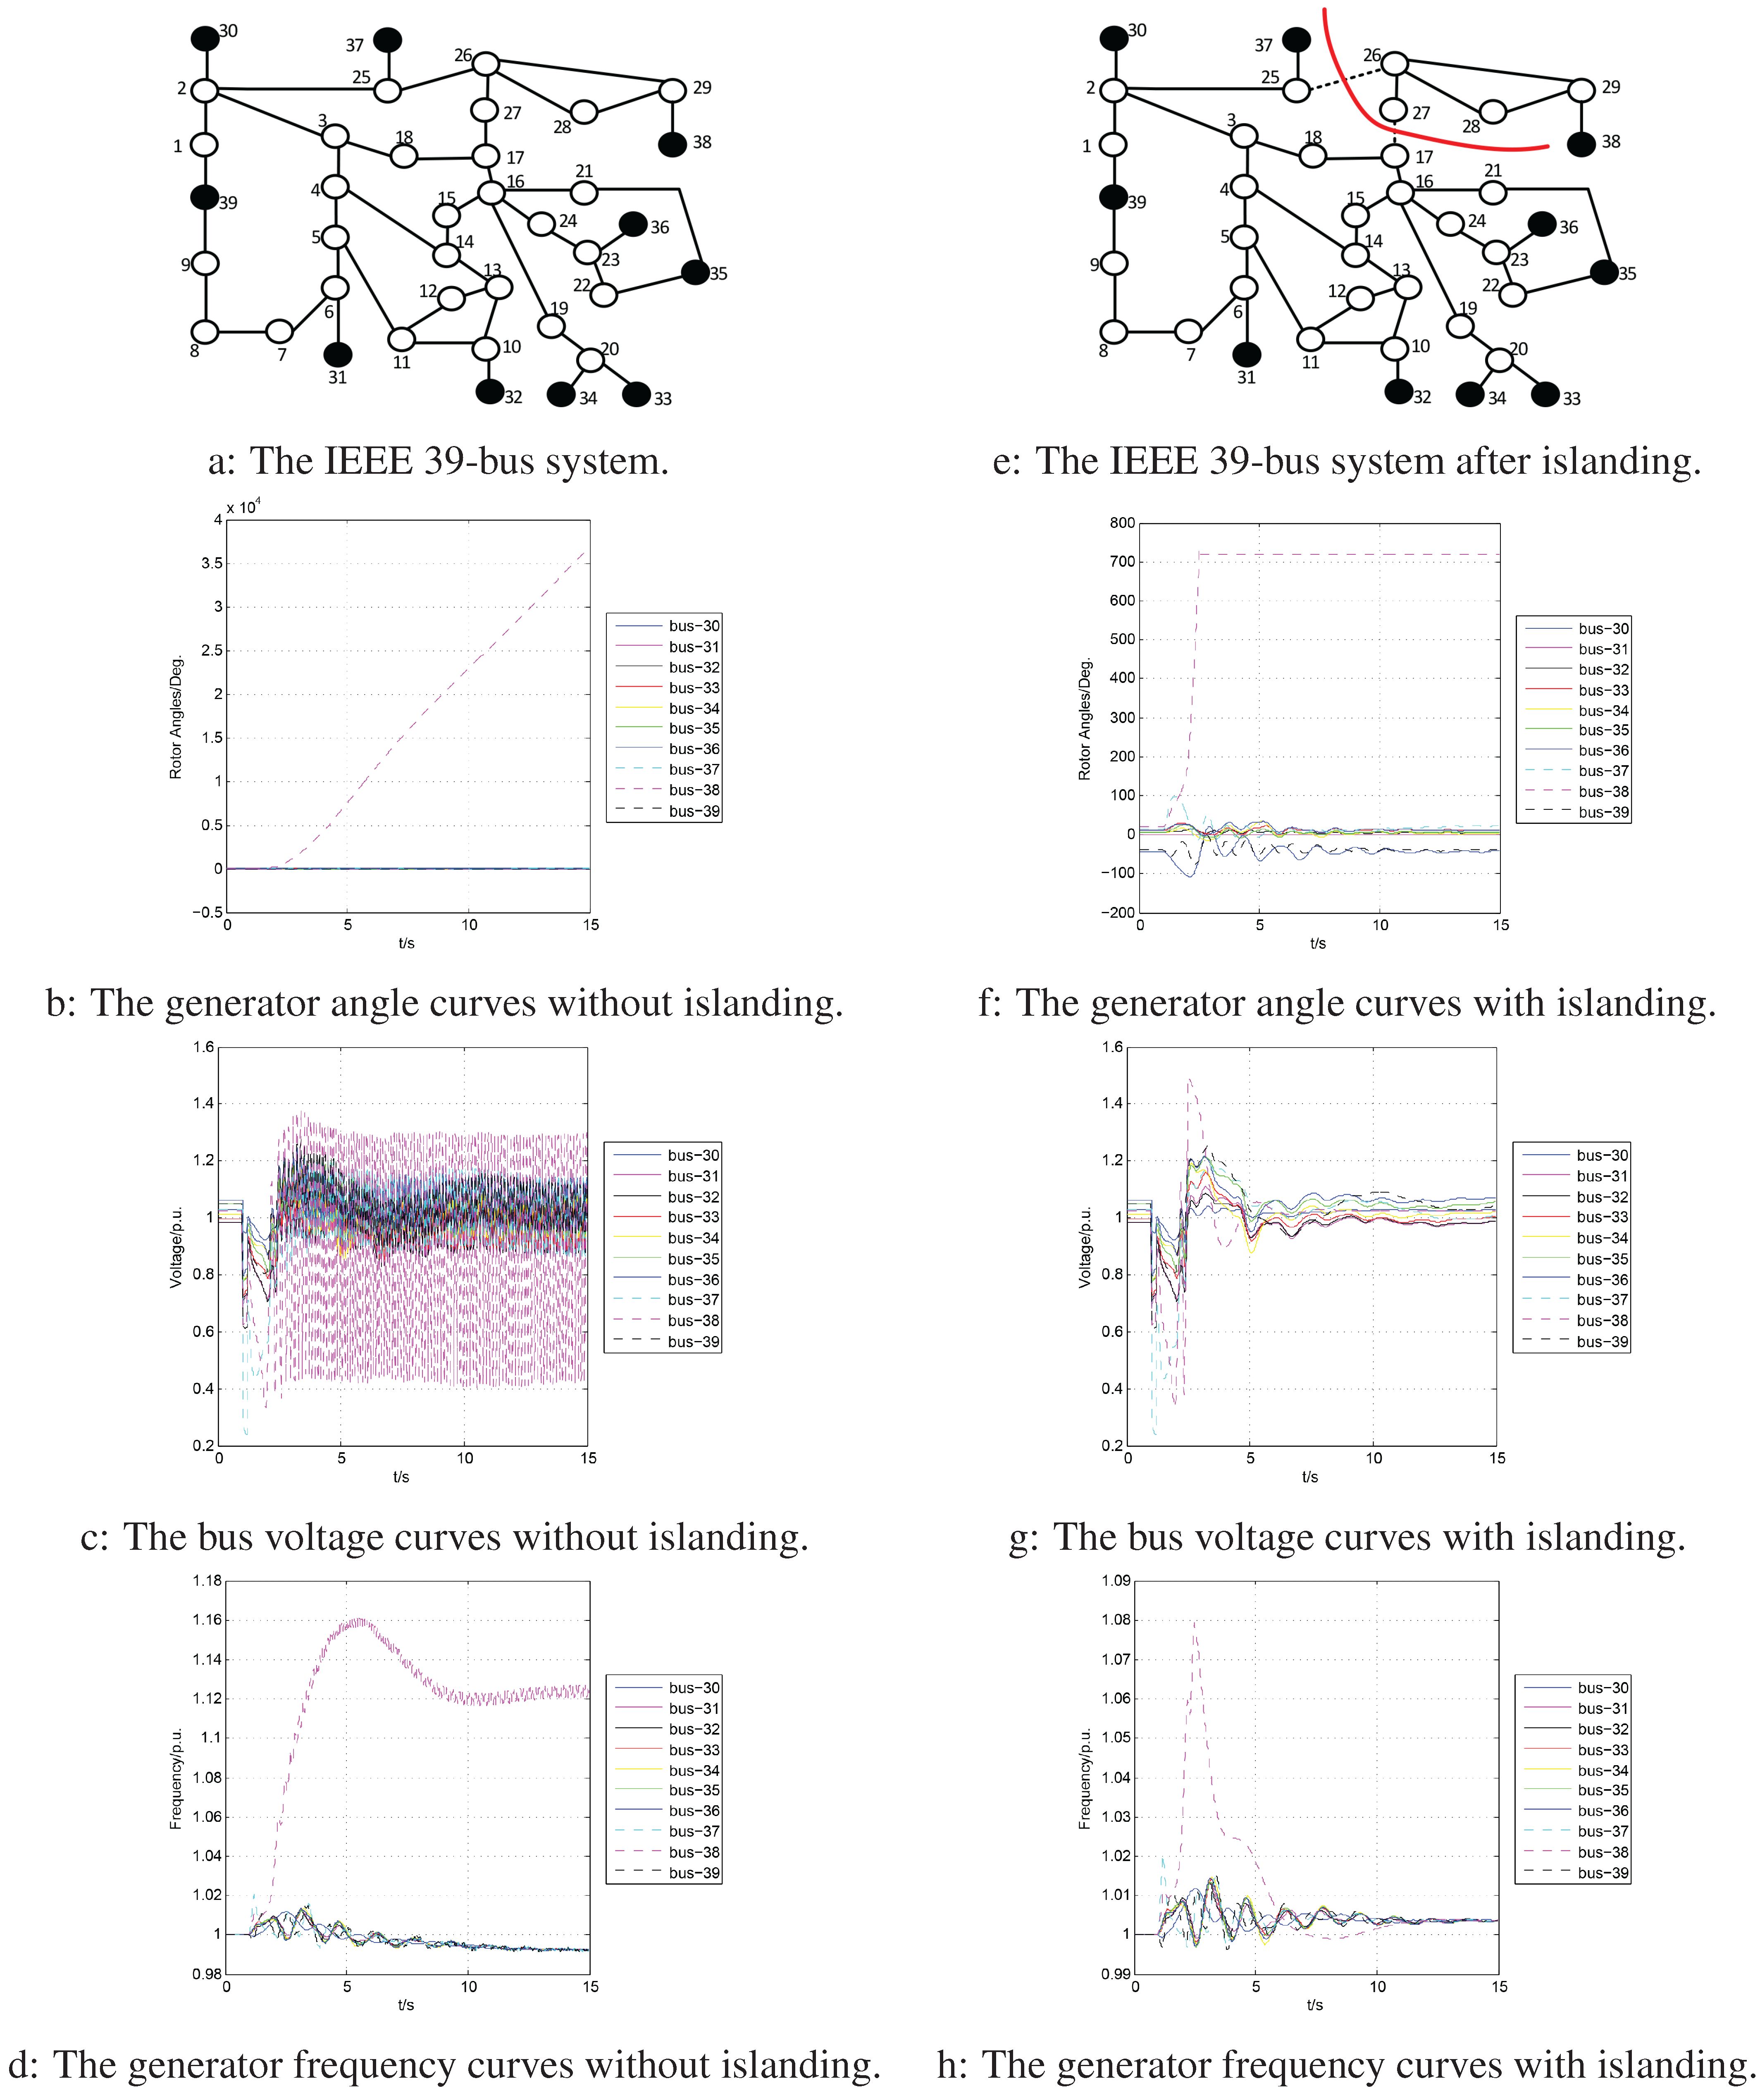
If no control actions are taken, it can be seen that the system loses synchronization at about 1.6417 s. Figure 18b indicates that the generator rotor angle curves become two clusters: {38} and {30, 31, 32, 33, 34, 35, 36, 37, 39}. The transient stability of the power system, or whether the system generators can continue to maintain synchronization after suffering large disturbances, is determined by the changing characteristics of the relative angles between generator rotors. Proper control measures should be required at this moment, such as controlled islanding. At about 2 s, the relative angles between the remaining generations have experienced the change from positive to negative 180 degrees, which indicates that the system has lost its transient stability [38]. Accordingly, the node voltage in the power system is usually controlled within [0.95 p.u., 1.05 p.u.]. However, after the fault occurs at time 1 s, the voltages suffer from drastic fluctuations, as shown in Figure 18c, especially for bus Node 38. Similarly, Figure 18d shows that the frequency of Generator 9 at bus Node 38 rises sharply, which means that the rotor speed is increased, widens the angle difference between itself and other generators gradually and eventually leads to instability.
After the fault happens, we can trip the boundary transmission lines that have been obtained by our tabu search algorithm. The emergency control actions after the system splitting are taken at 2.5 s: load shedding at Bus 29 with 90.72 MW. The system generator angle, voltage and frequency curves are shown in Figure 18f–h. We set the tabu tenure to seven, the number of iterations to 1000 and obtained a solution with the total power imbalance of 79.5 MW within 1 ms. The solution gives an islanding strategy, which disconnects lines 17-27 and 25-26. Therefore, the Nodes 2, 26, 28, 29 and 38 are included in one island, and the rest are included in the other island. We can also see that the two islands are successfully created with frequencies between 1.00 and 1.01 p.u. after 10 s, which is shown in Figure 18h. Similarly, the bus voltage and frequency gradually return to normal levels after 2.39 s. The angles, voltages and frequencies of generators in both islands have reached a steady state. Thus, the validity of our proposed tabu search algorithm can be verified from this perspective.
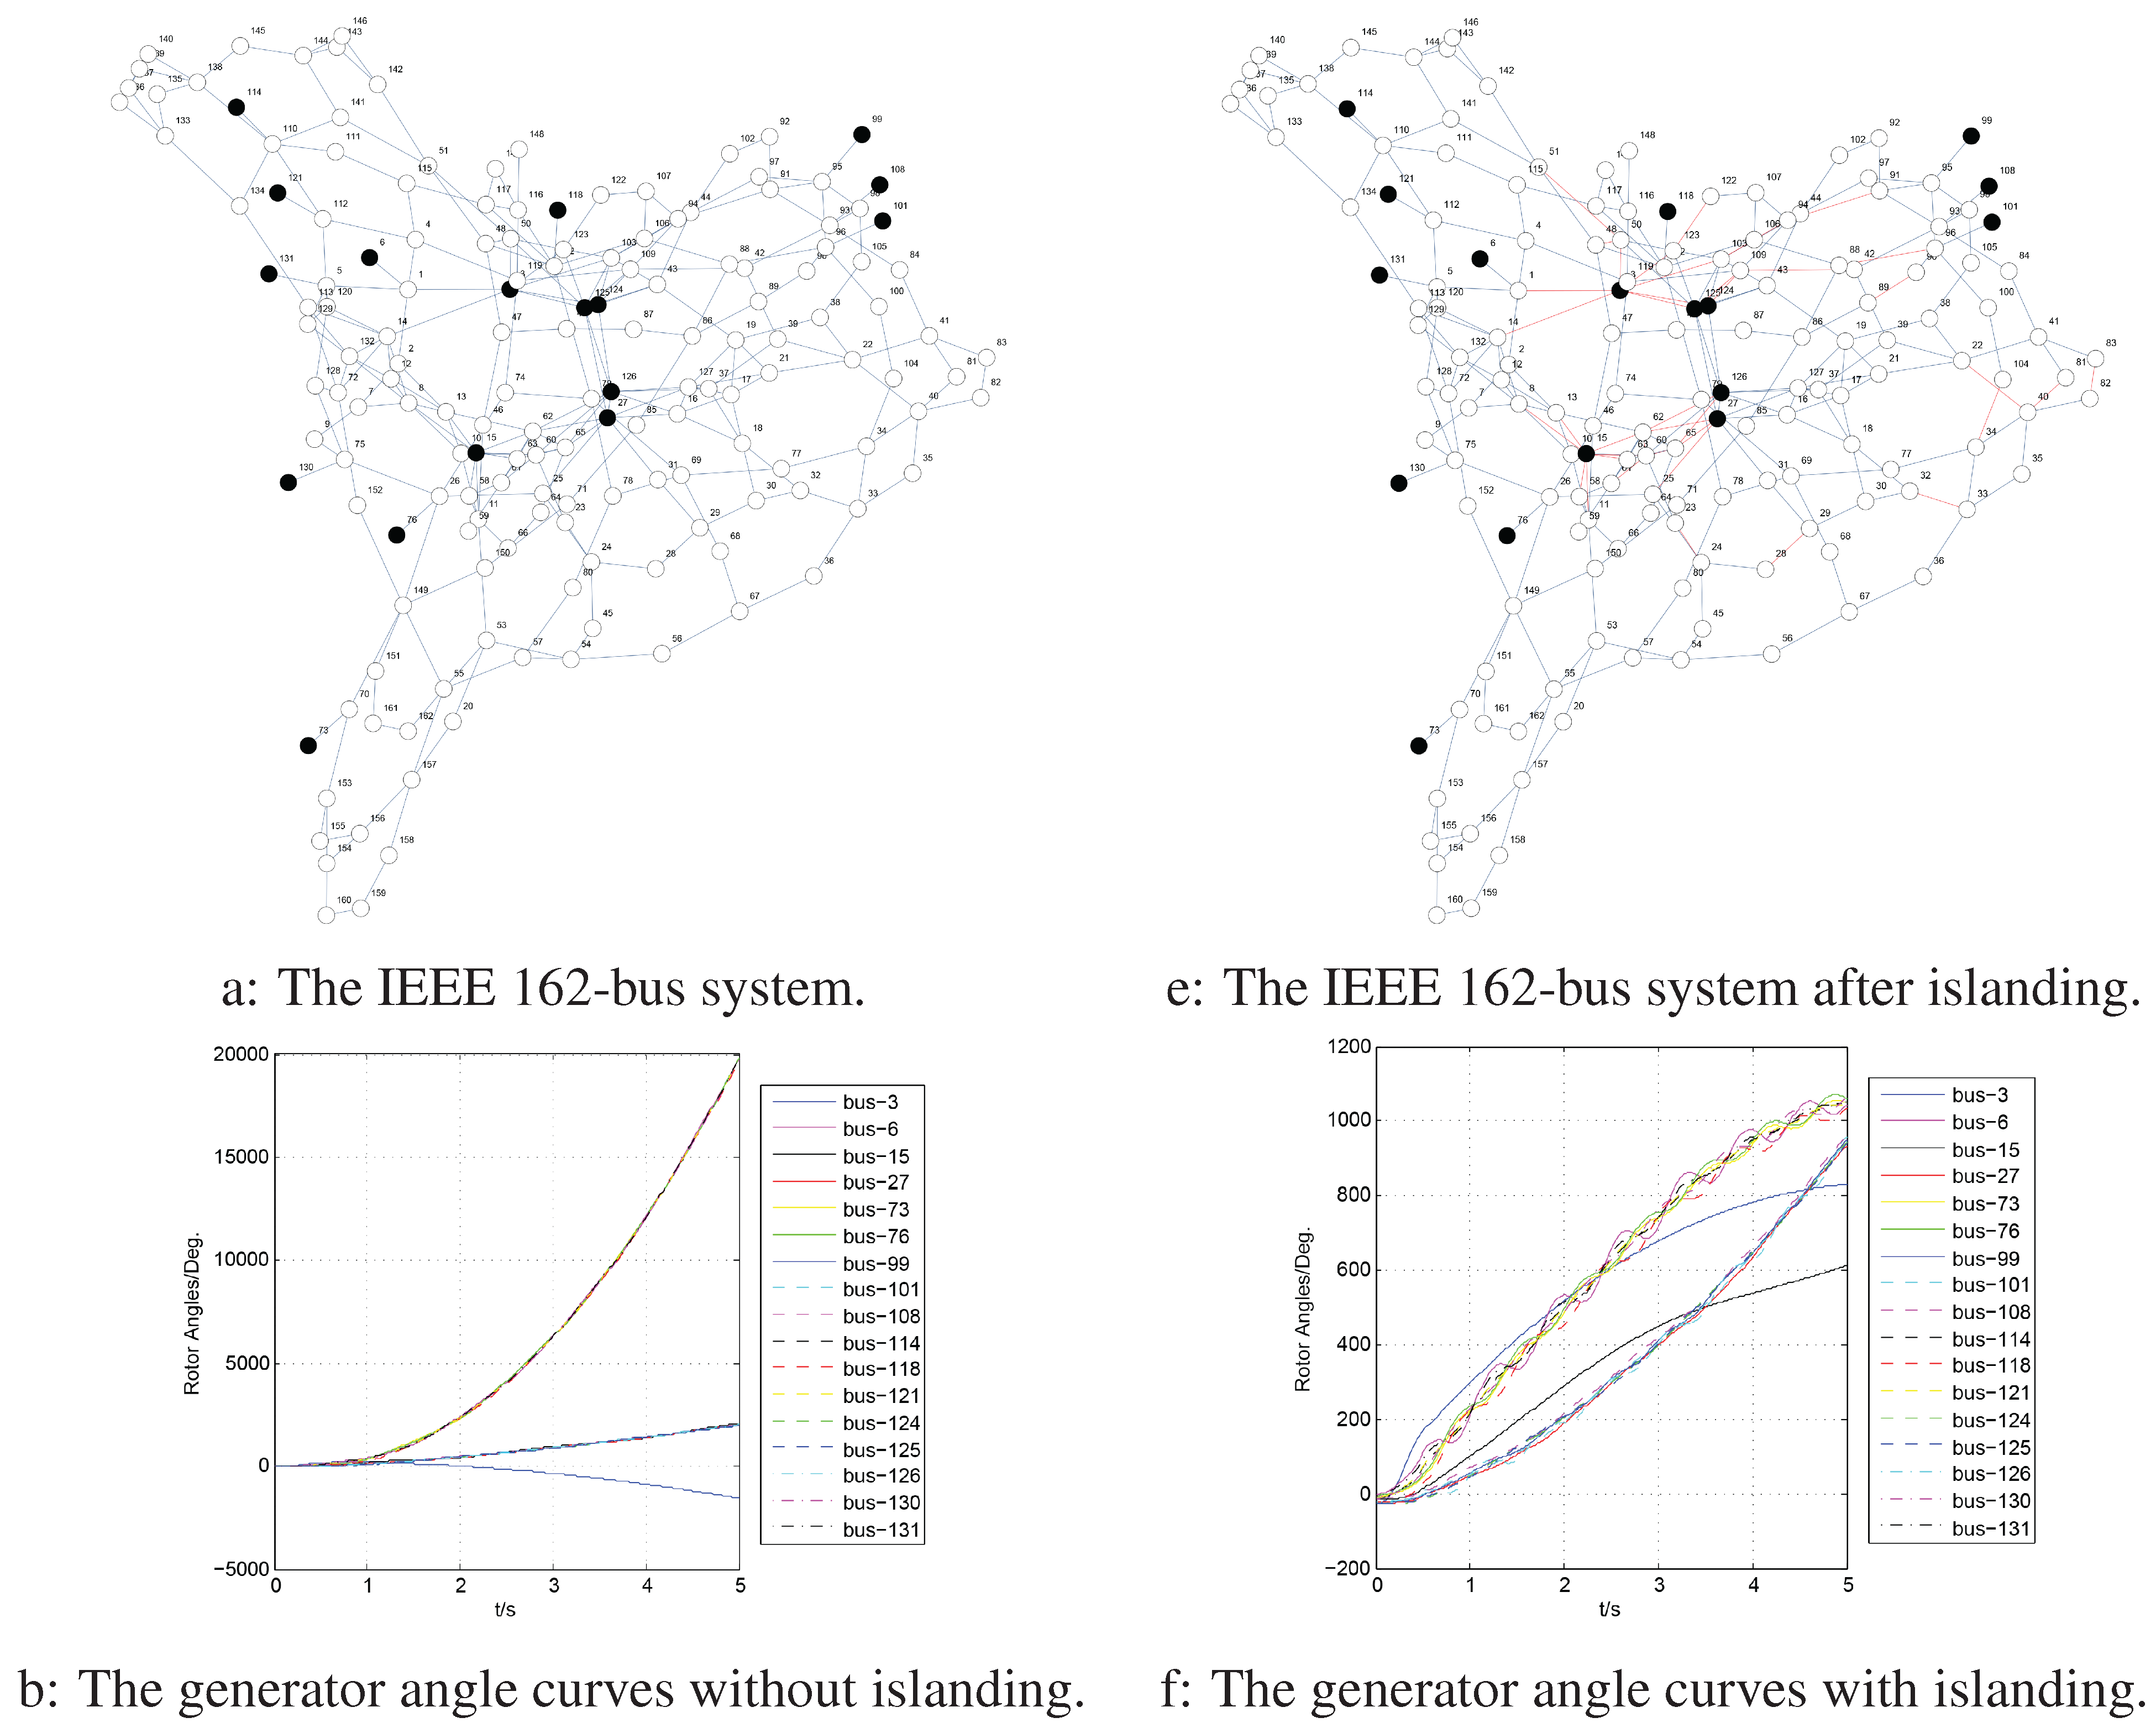
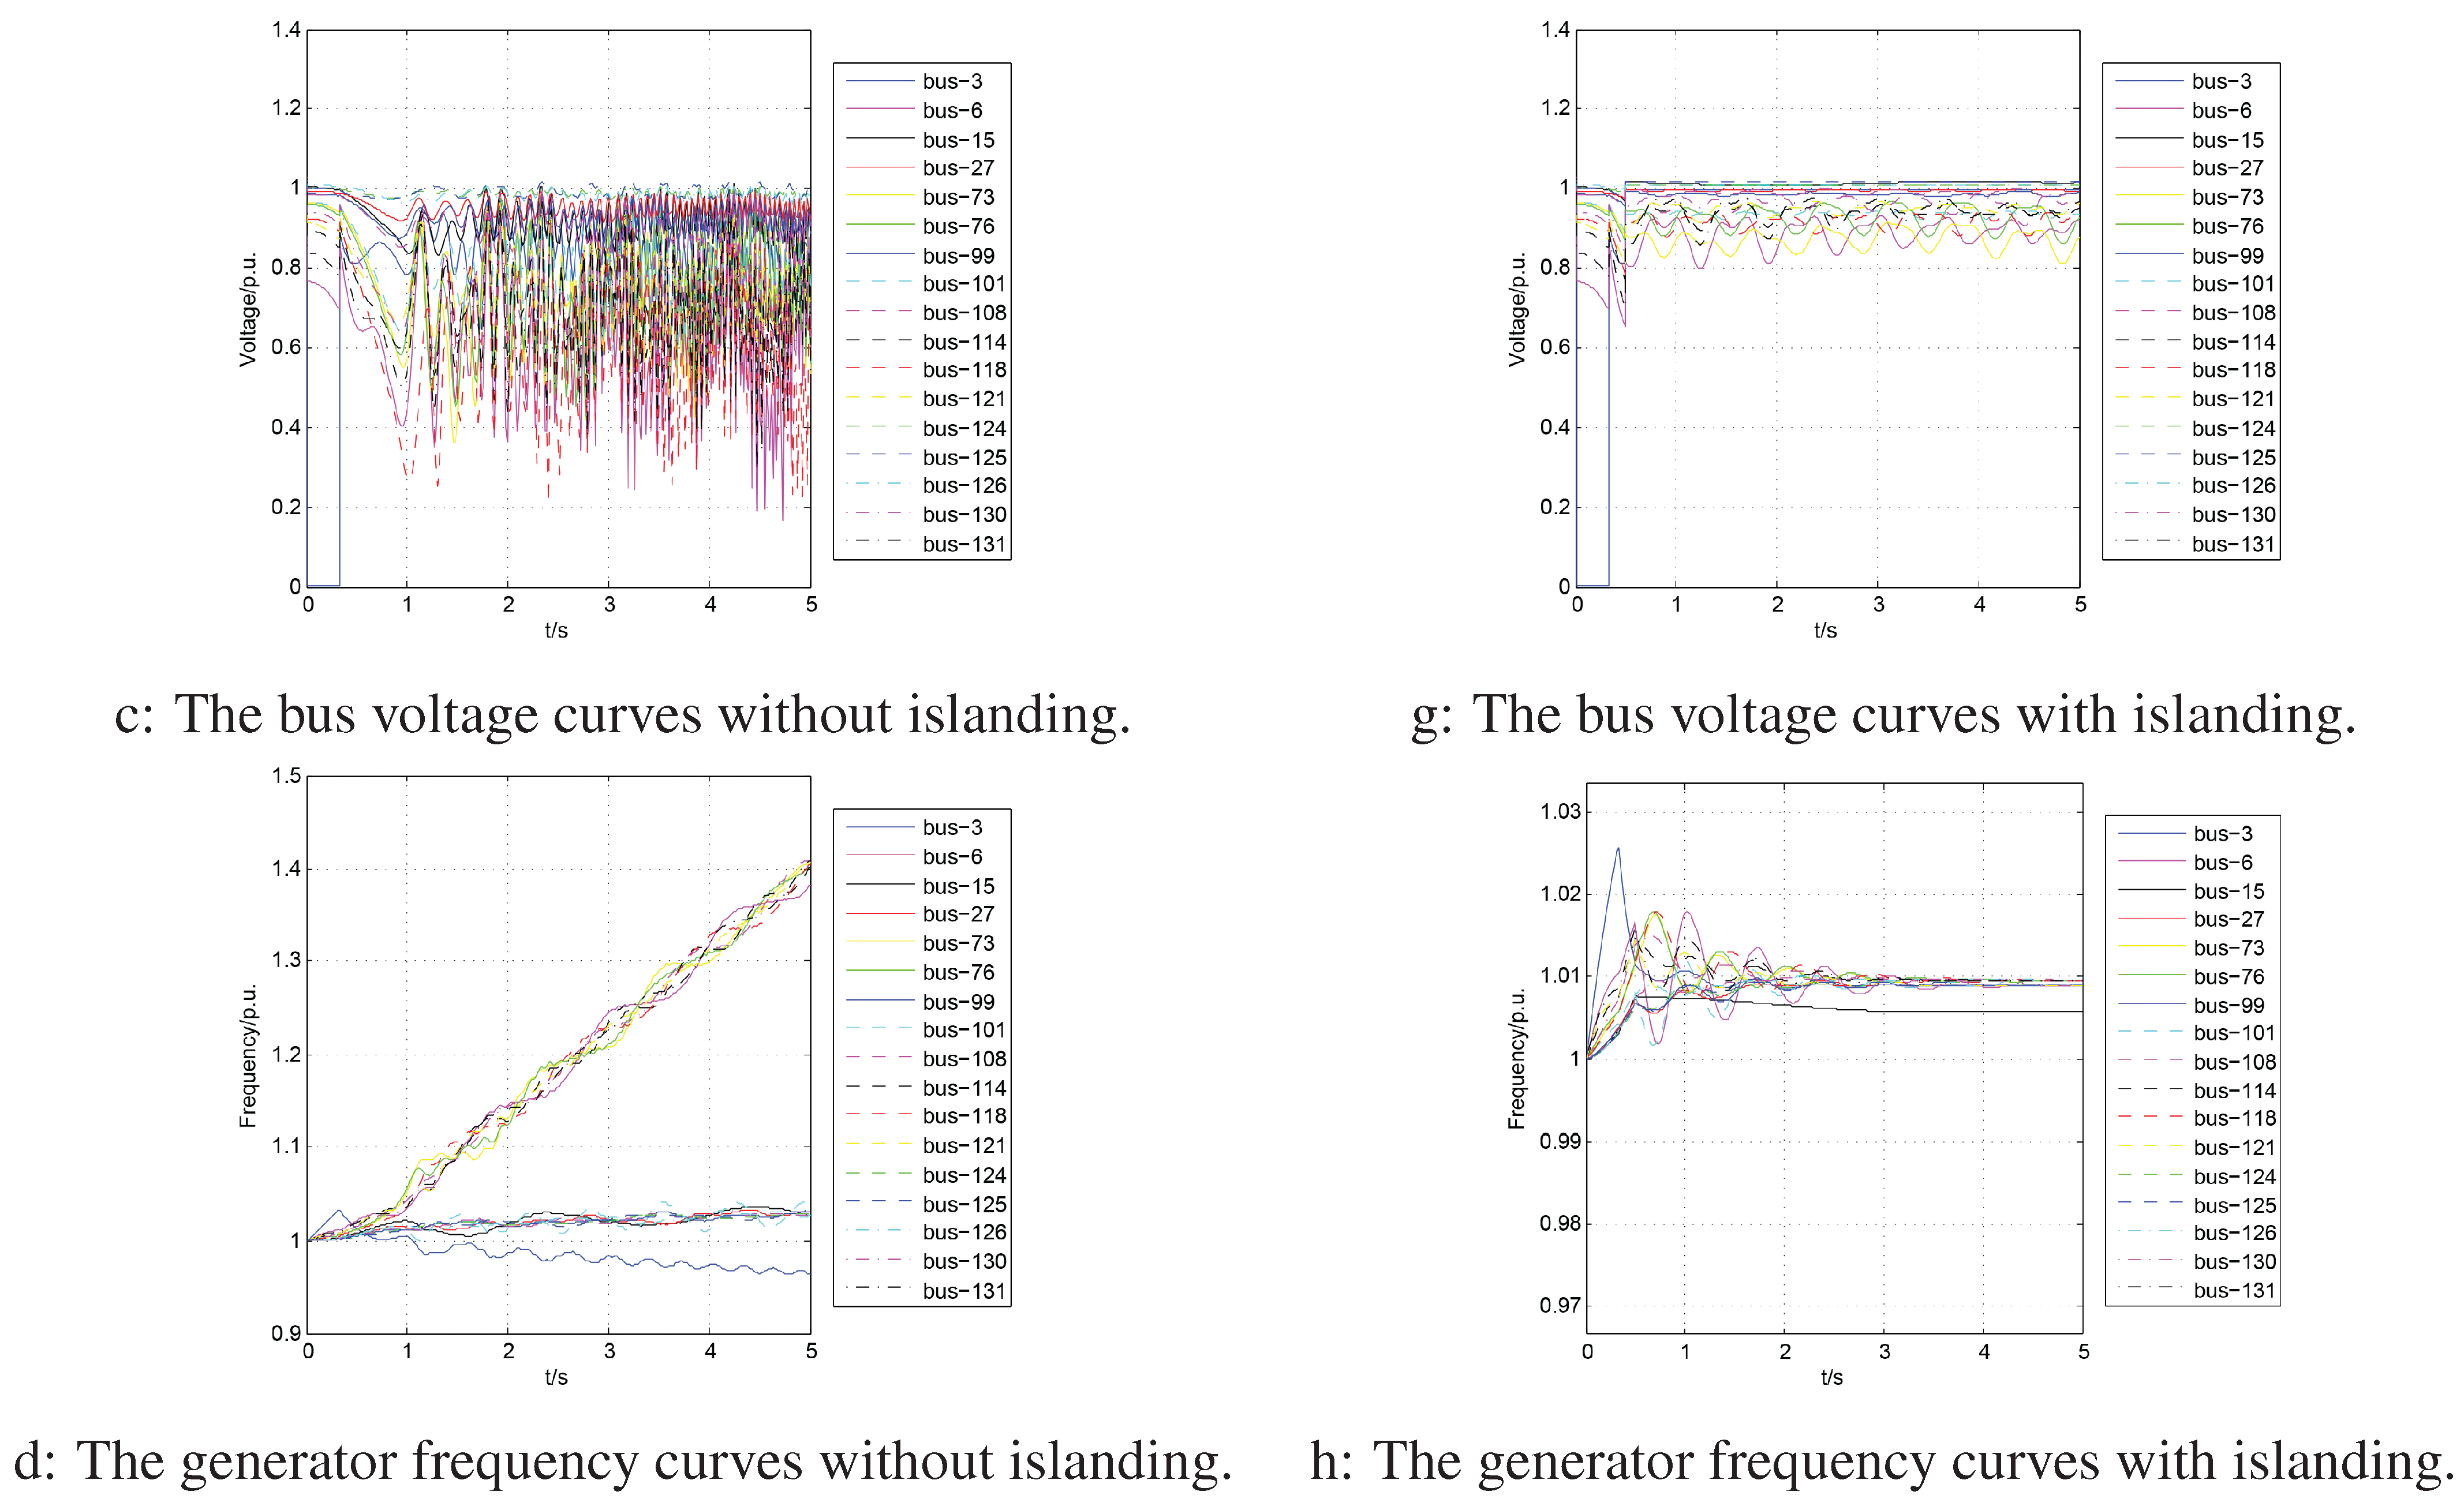
5.3.2. Test Case 2: The IEEE 162-Bus System
The 162-bus system consists of 17 generators, 162 nodes and 284 edges and has a capacity of 15,056.7 MW. All time-domain simulations for IEEE 162-bus system are performed using PSD-BPA, which is a component of the software package developed by the Power System Department of China Electric Power Research Institute [39]. We assume that at s, a three phase-to-ground solid fault happens at the middle of Line 3-50, and this fault is cleared after 0.325 s. If the system splitting measures are not taken, the figures of the generator angle curves, bus voltage curves and generator frequency curves can be observed from Figure 19a–d.
If no control actions are taken, it can be seen from Figure 19b that the generator rotor angle curves become three clusters {3}, {99, 15, 27, 101, 108, 124, 125, 126} and {130, 6, 73, 76, 114, 118, 121, 131} at about 0.4912 s. Taking the angle of generator bus Node 3 as the base, the relative angles of the remaining generators have experienced the change from positive to negative 180 degrees at around 2.5 s, which indicates that the system has lost its transient stability. After the fault occurs at 0 s, the voltages of generator buses suffer from drastic fluctuations with amplitudes from 0.1673–1.0178 p.u., as shown in Figure 19c. The voltages of the generators that have lost synchronization are likely to reach [0 p.u., 0.2 p.u.], and therefore, the voltage collapse is triggered. It can be seen from Figure 19d that the generator frequencies of the third cluster have been rising continuously, which means the rotor speed is increased, widens the angle difference between itself and the other generator clusters gradually and eventually leads to instability at 0.4917 s.
After the fault happens, we can trip the boundary transmission lines obtained from our tabu search algorithm. The emergency control actions after the system splitting are taken at 0.5 s: generation reduction at Bus 73 with 400 MW and load shedding at Bus 3 with 300 MW. The islands after the system splitting are shown in Figure 19e, where we mark the disconnected transmission lines in red. The system generator angles, voltages and frequency curves are shown in Figure 19f–h. Our algorithm obtained a solution with a power imbalance of 902.9 MW using approximately 40 ms. This solution gives an islanding strategy, which disconnects the set of edges {1-3, 3-14, 3-50, 3-103, 3-123, 3-124, 3-125, 8-15, 10-15, 10-60, 11-15, 13-15, 15-58, 15-62, 15-63, 22-40, 23-24, 25-27, 27-62, 27-65, 28-29, 32-33, 34-104, 40-81, 42-109, 48-50, 50-51, 60-61, 60-62, 60-65, 62-126, 65-126, 82-83, 88-96, 89-90, 91-94, 94-103, 109-124, 109-125, 122-123}, and the 17 generators are assigned to three islands. We can also see from Figure 19h that these three islands are successfully created with frequencies between 1.00 and 1.02 p.u. after 4 s. Similar to the simulations of the IEEE 39-bus system, the angles, voltages and frequencies of generators in both islands have reached a steady state.
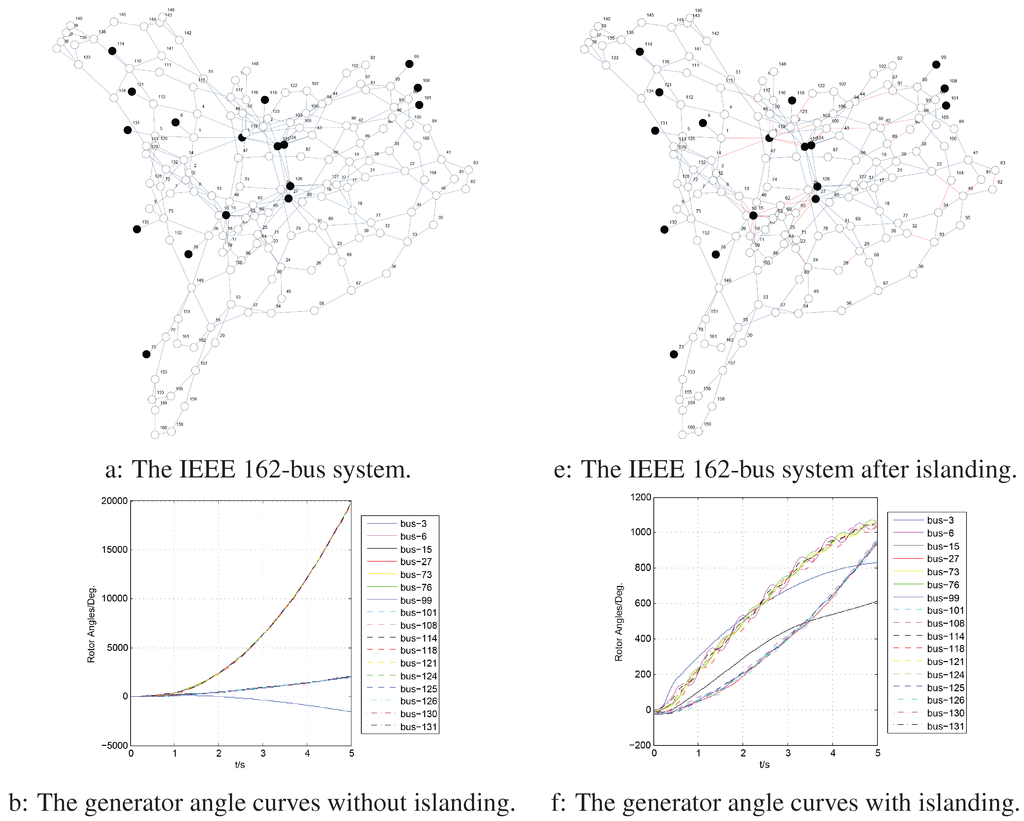

Figure 19.
Comparisons with and without the islanding on IEEE the 162-bus system.
Figure 19.
Comparisons with and without the islanding on IEEE the 162-bus system.
5.3.3. Test Case 3: A Reduced Power Grid of Central China
We employ a real power system in Central China to demonstrate our islanding algorithm. This power system contains 1713 buses. We reduce this system to the one with 11 generator buses, 55 load buses and 75 lines, which is shown in Figure 20. In a certain operation mode, the total active power output of the generators is 21,136 MW, and the total active power consumption of loads reaches 20,990.4 MW. All time-domain simulations for this power system are also performed using PSD-BPA.
We assume that at time s, a three phase-to-ground fault occurs near bus CTJWat Line 36 and is cleared after 0.3 s. The power angle, voltage and frequency curves of generators are shown in Figure 21a–c. It can be seen from Figure 21a that within a short time after the fault is cleared, the generators are divided into two groups: {CTB, CMEG, CLD, CLTS, CPBG, CXJB, YLHSQ} and {ESXYS, ESXYE, EPQ}. As observed from Figure 21b,c, if the system is not split, the voltage magnitudes of the majority of the generators are beyond the range of stable operation, which lies in [0.95 p.u., 1.05 p.u.]. The frequencies of the generators increase considerably, and if no control actions are taken in time, the system may quickly collapse. In this case, the system needs to be split at 3 s. The islanding solution found by our algorithm is shown in Figure 22. Table 6 summarizes the best islanding solution and post-separation control measures for this test case. This solution was found by our algorithm using approximately 30 ms, and the islanding was conducted at 2.06 s. After islanding, 11 generators are assigned to specific islands, as shown in Figure 22.
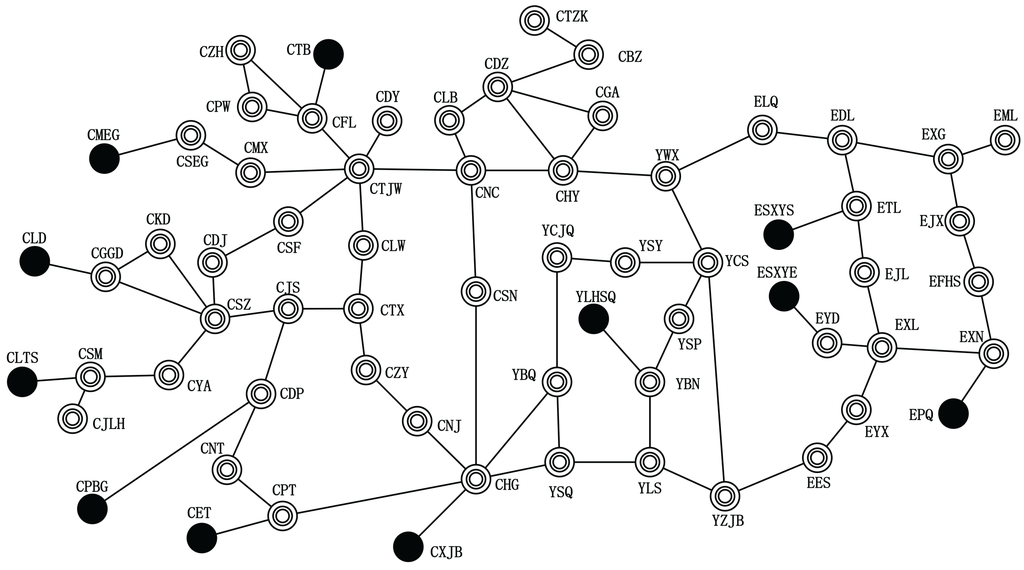
Figure 20.
The reduced power system of Central China.
Figure 20.
The reduced power system of Central China.
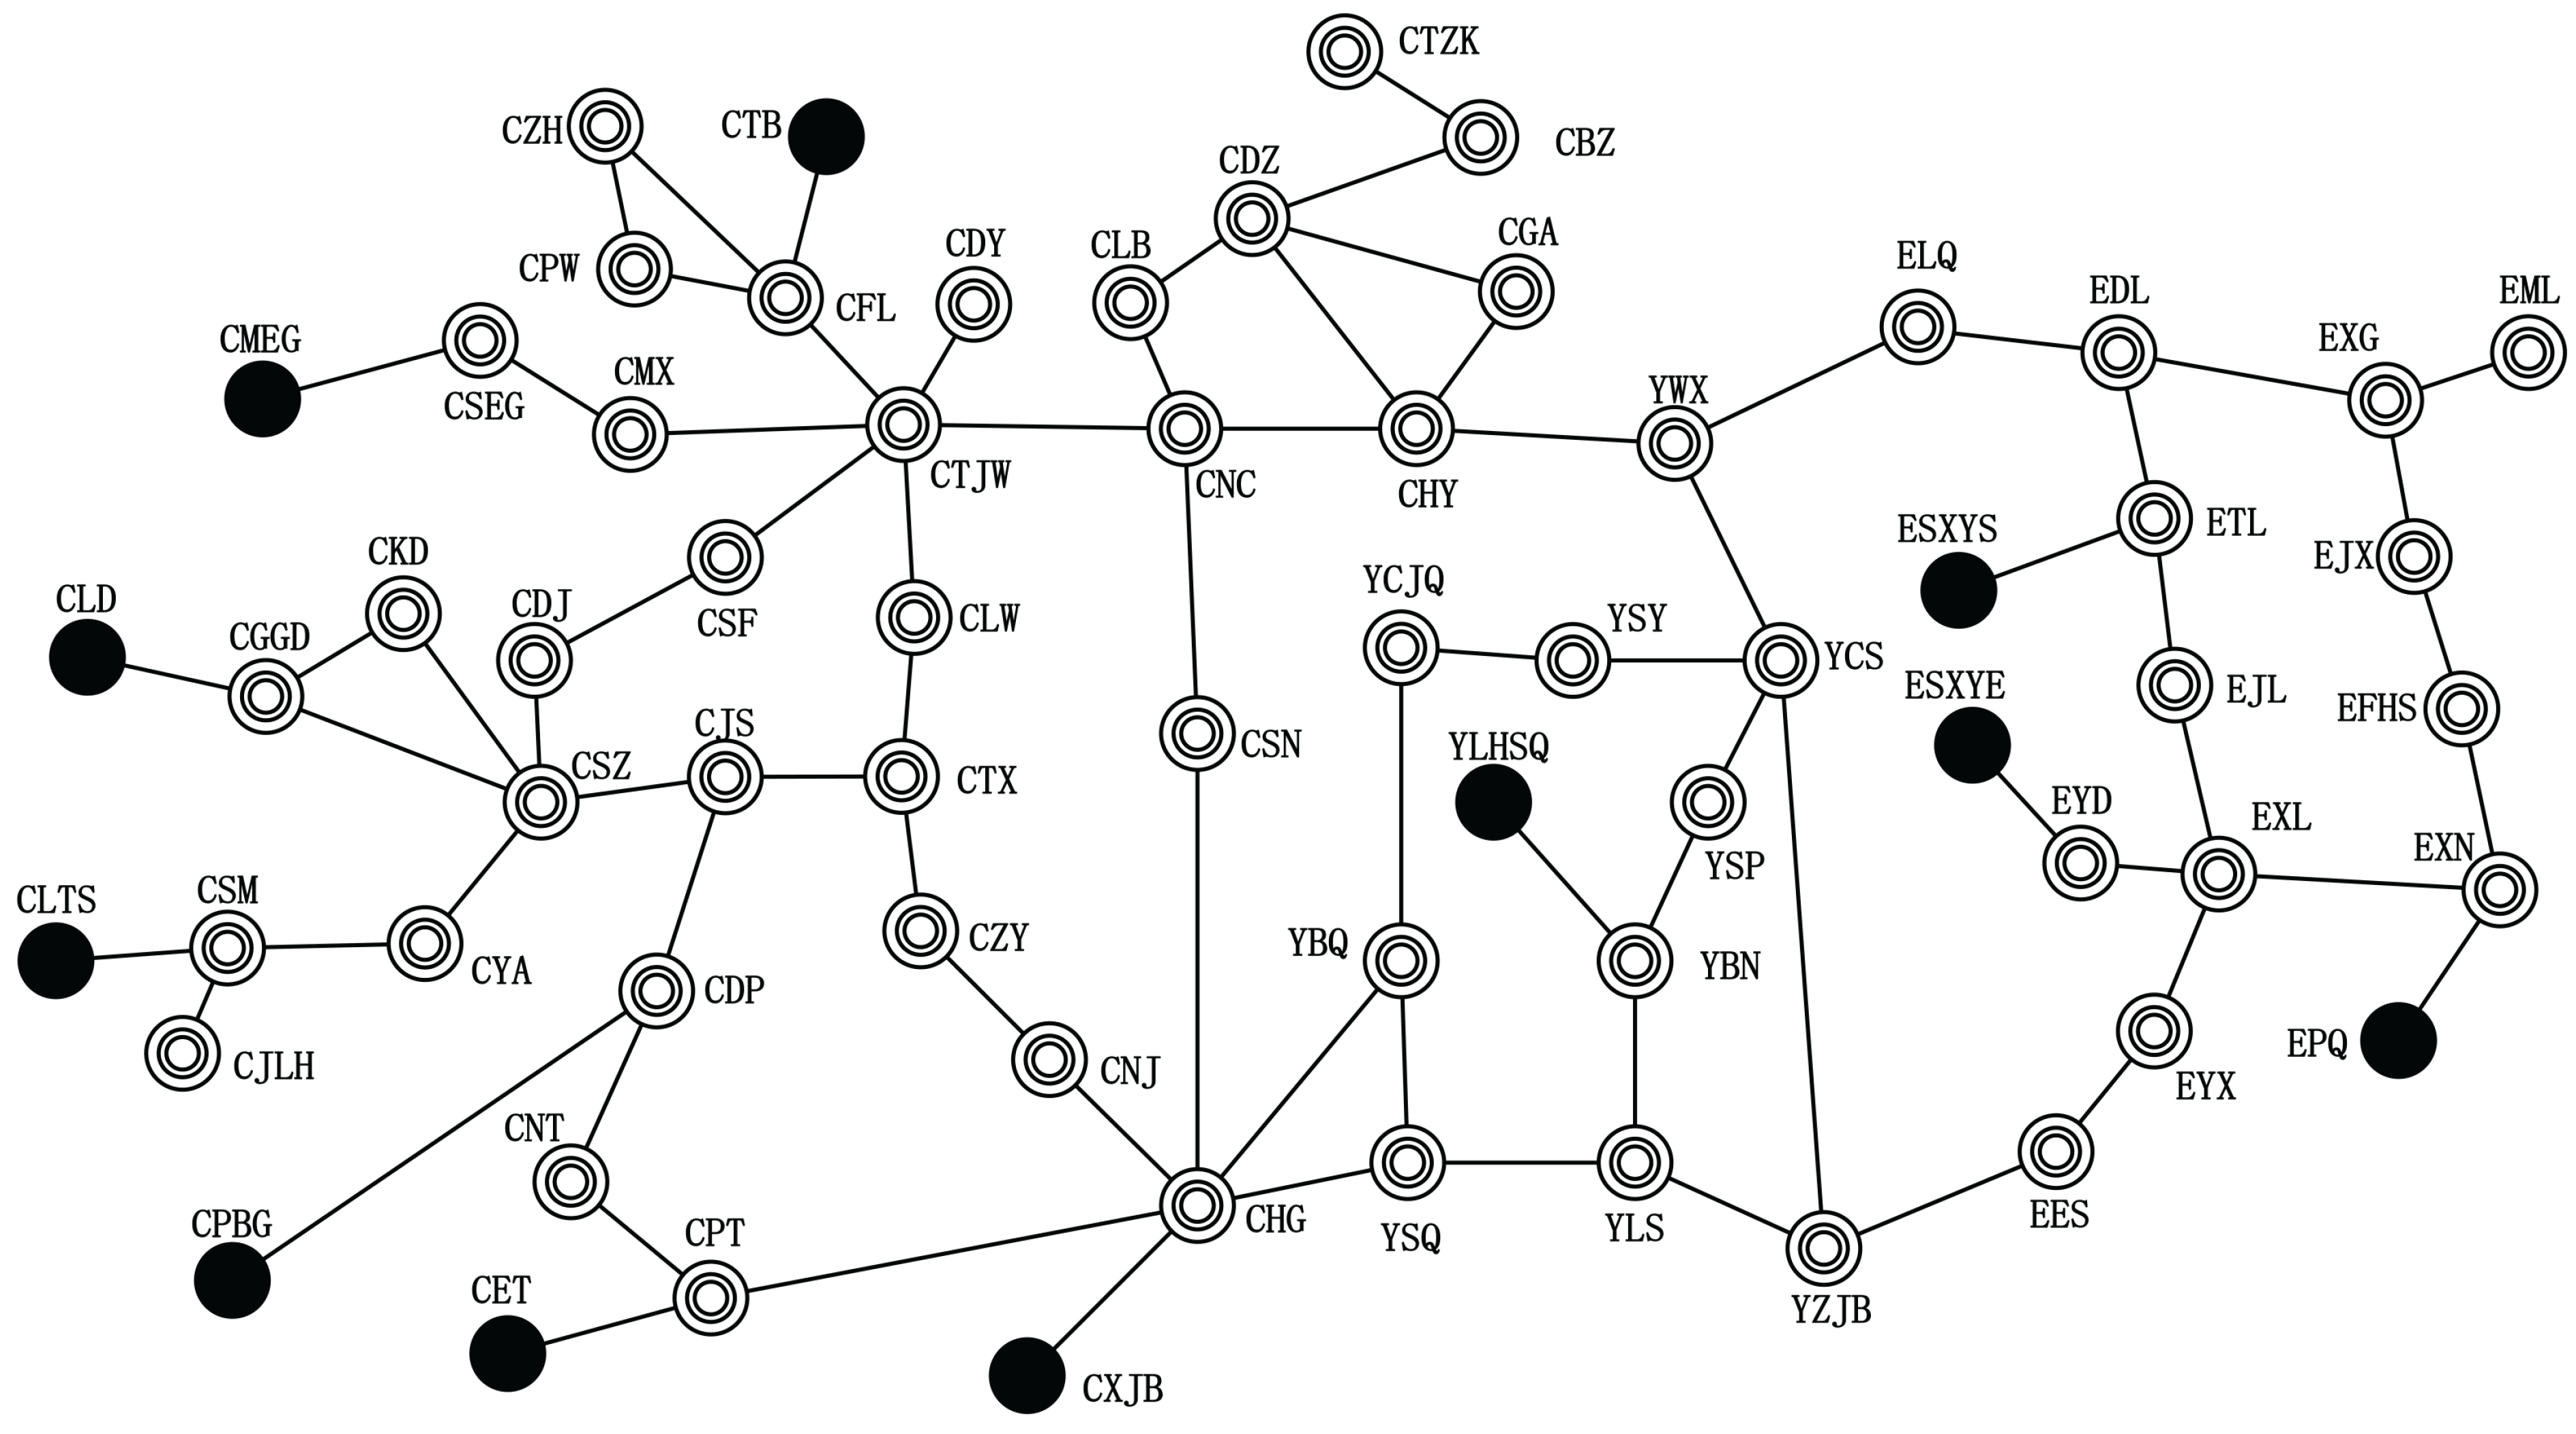
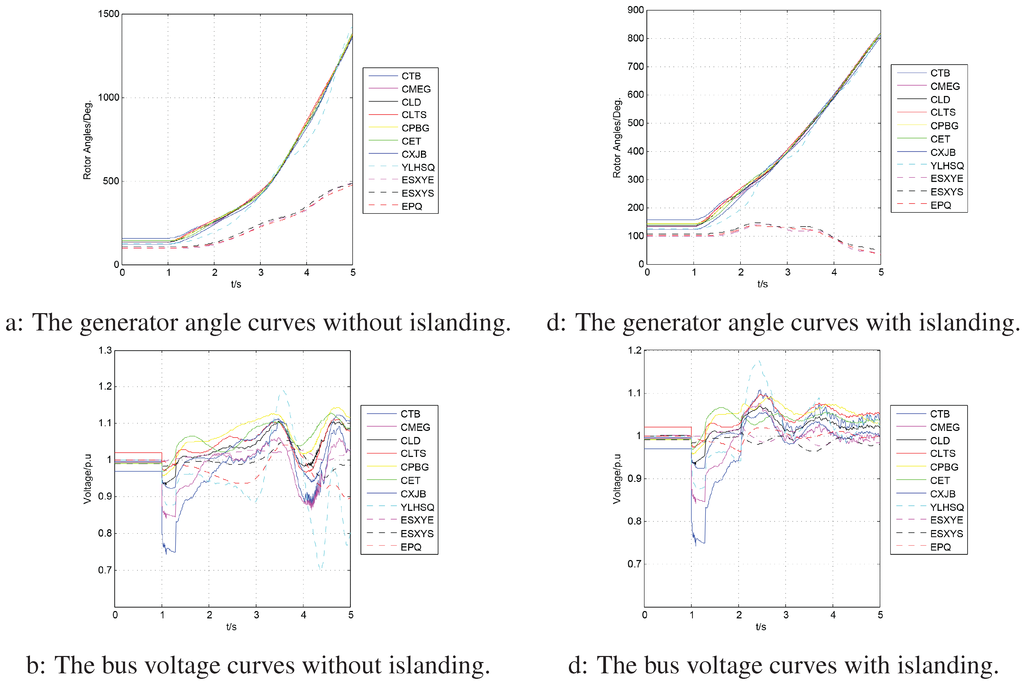
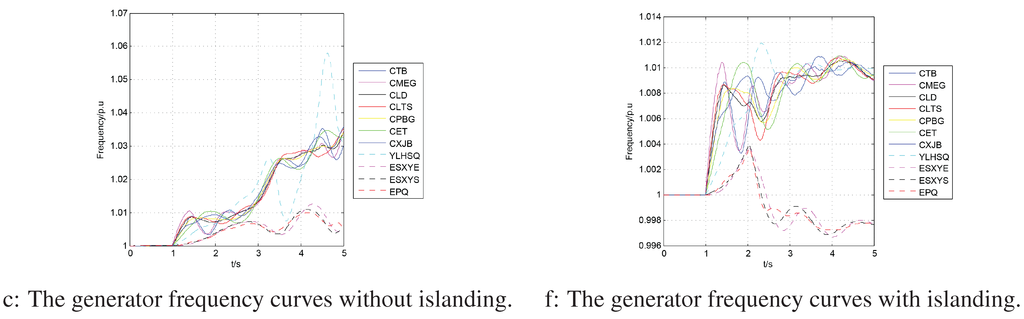
Figure 21.
Comparisons with and without the islanding on the reduced power grid of Central China.
Figure 21.
Comparisons with and without the islanding on the reduced power grid of Central China.
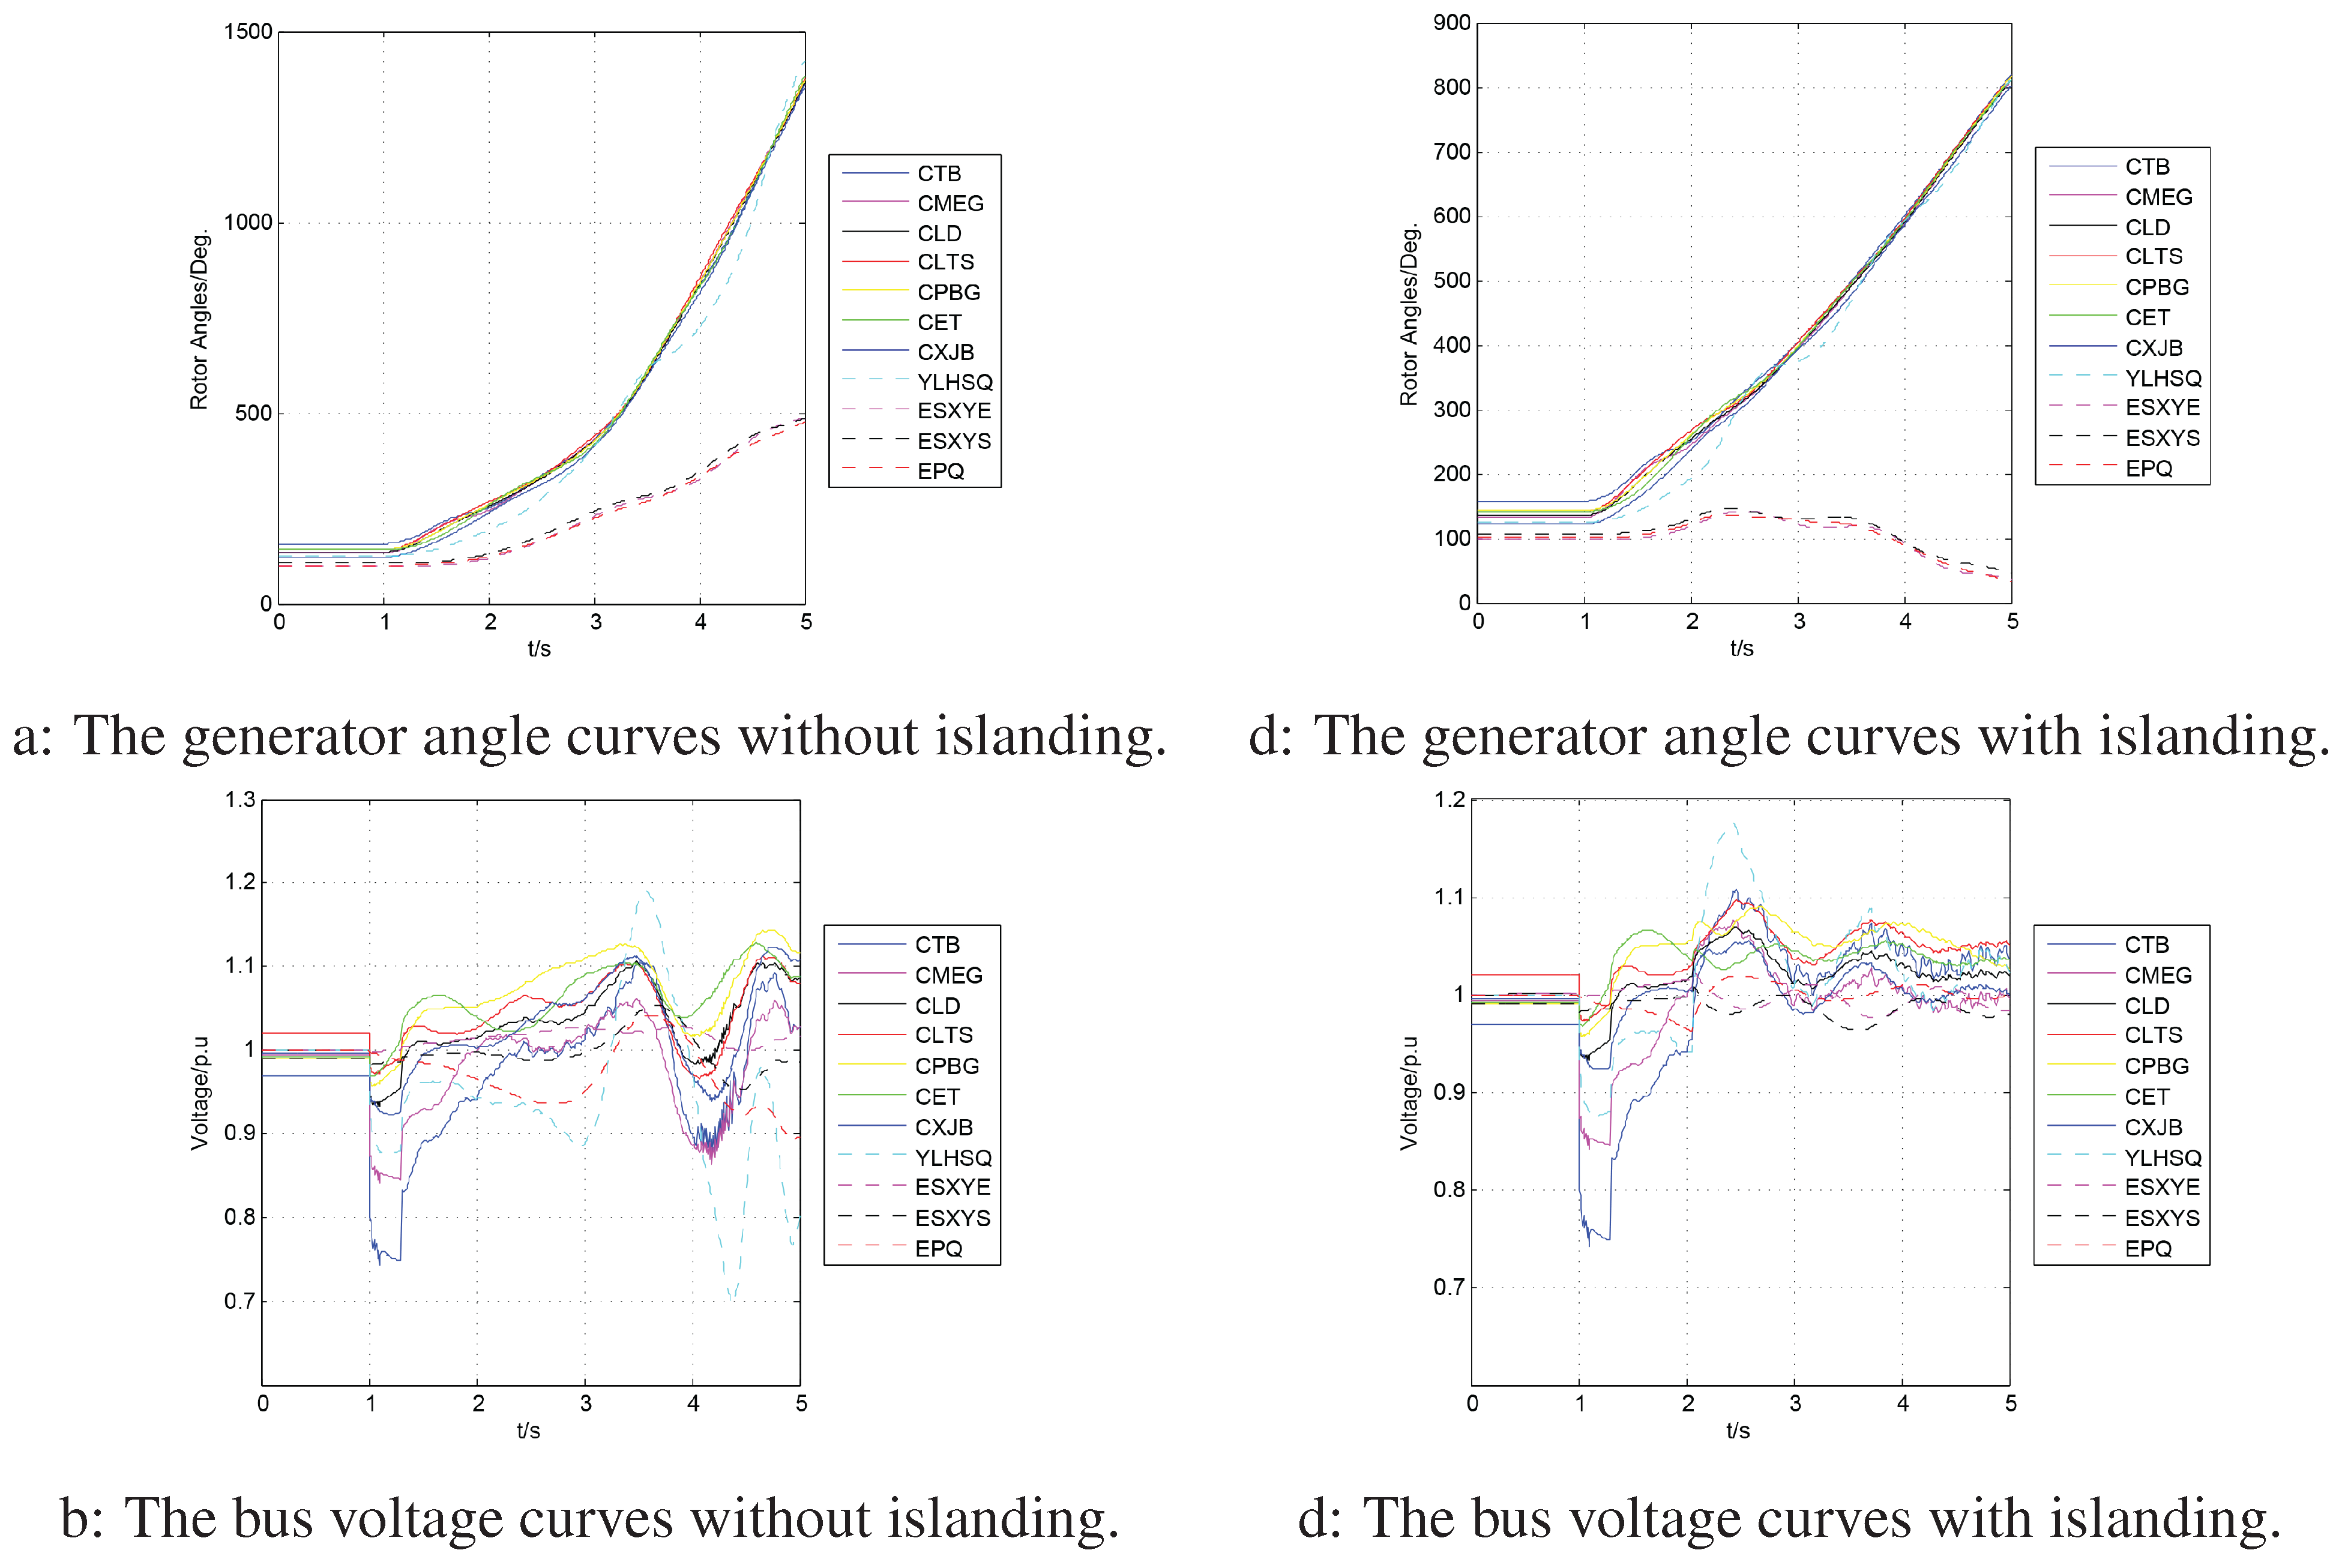
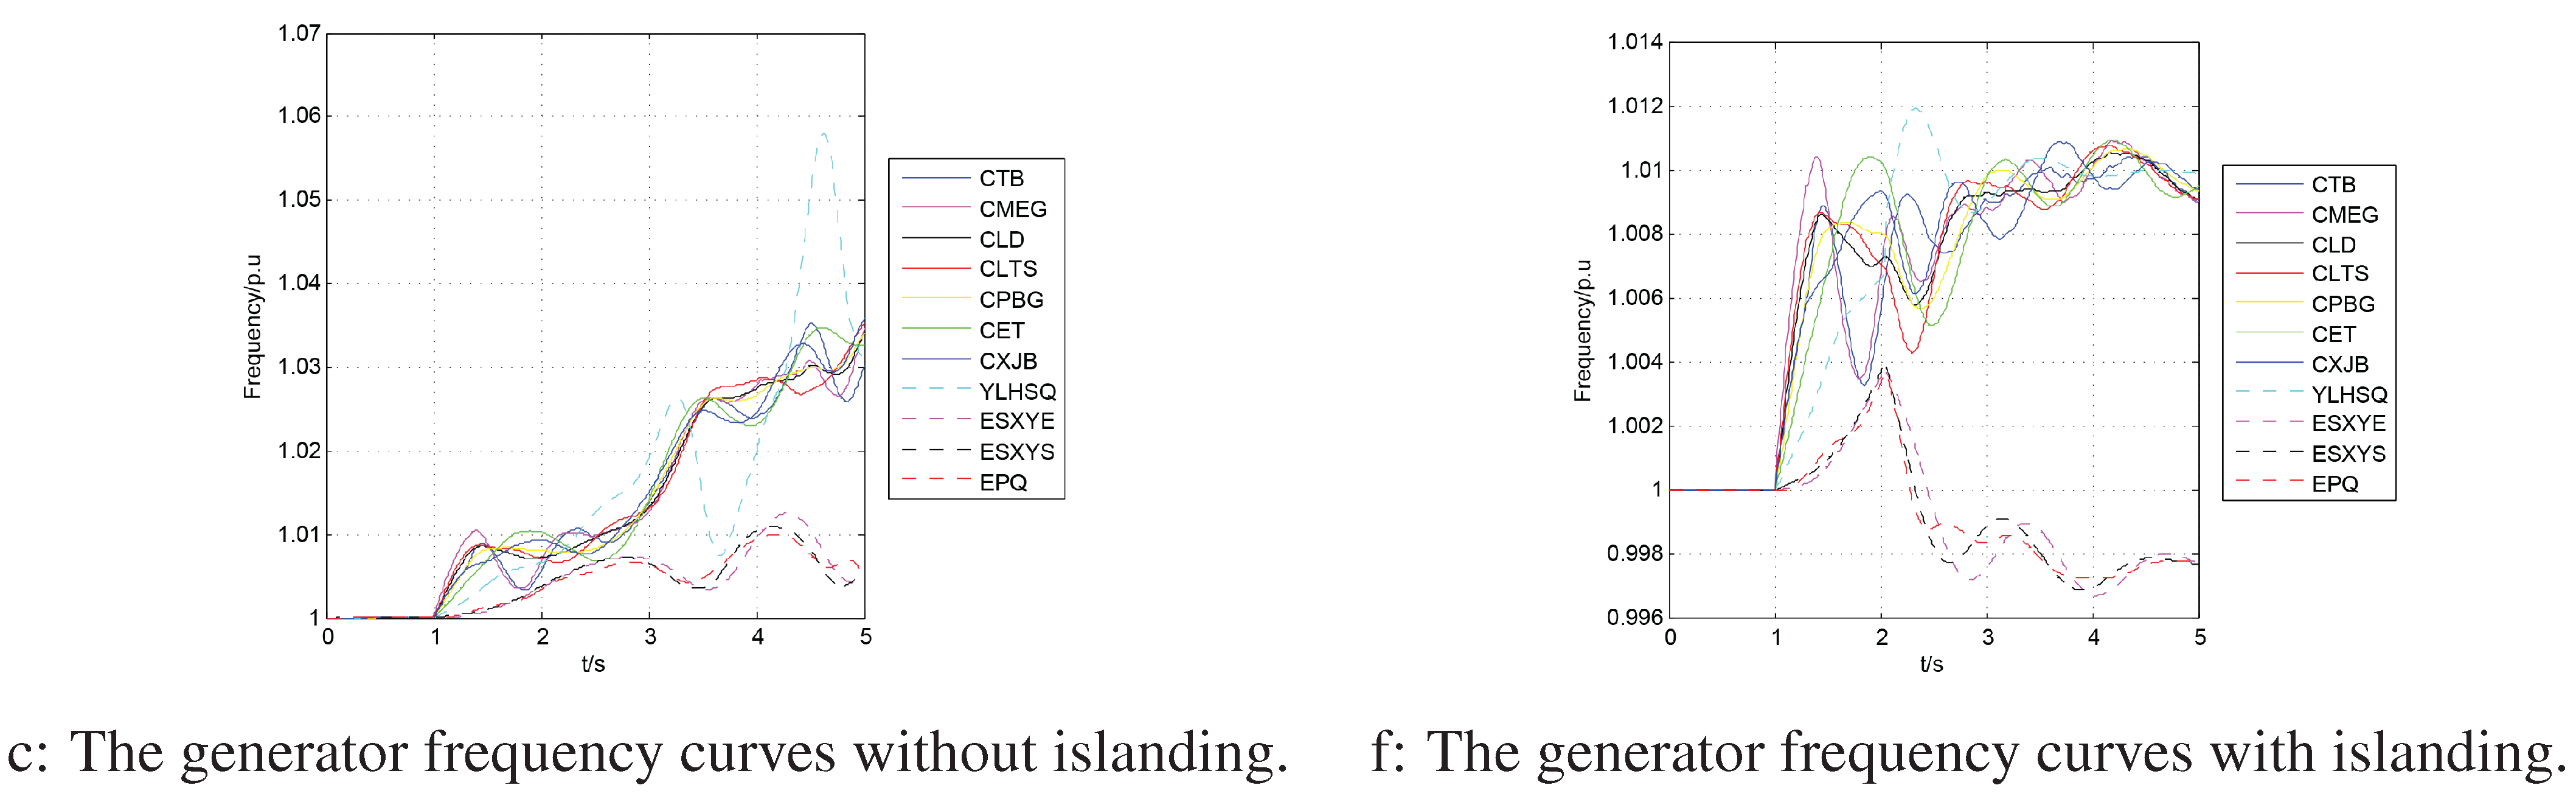
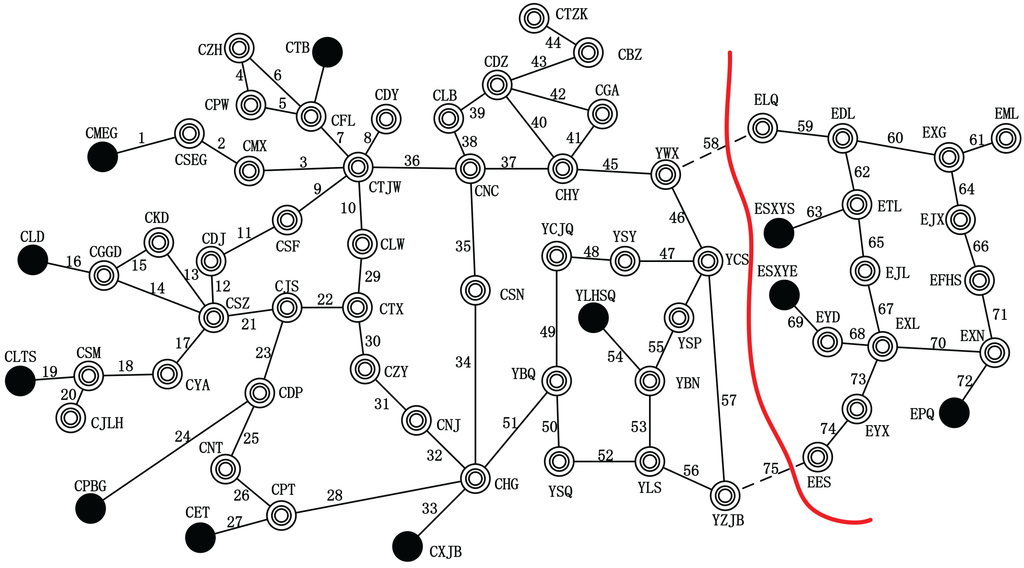
Figure 22.
The islanding solution for the reduced power system of Central China.
Figure 22.
The islanding solution for the reduced power system of Central China.
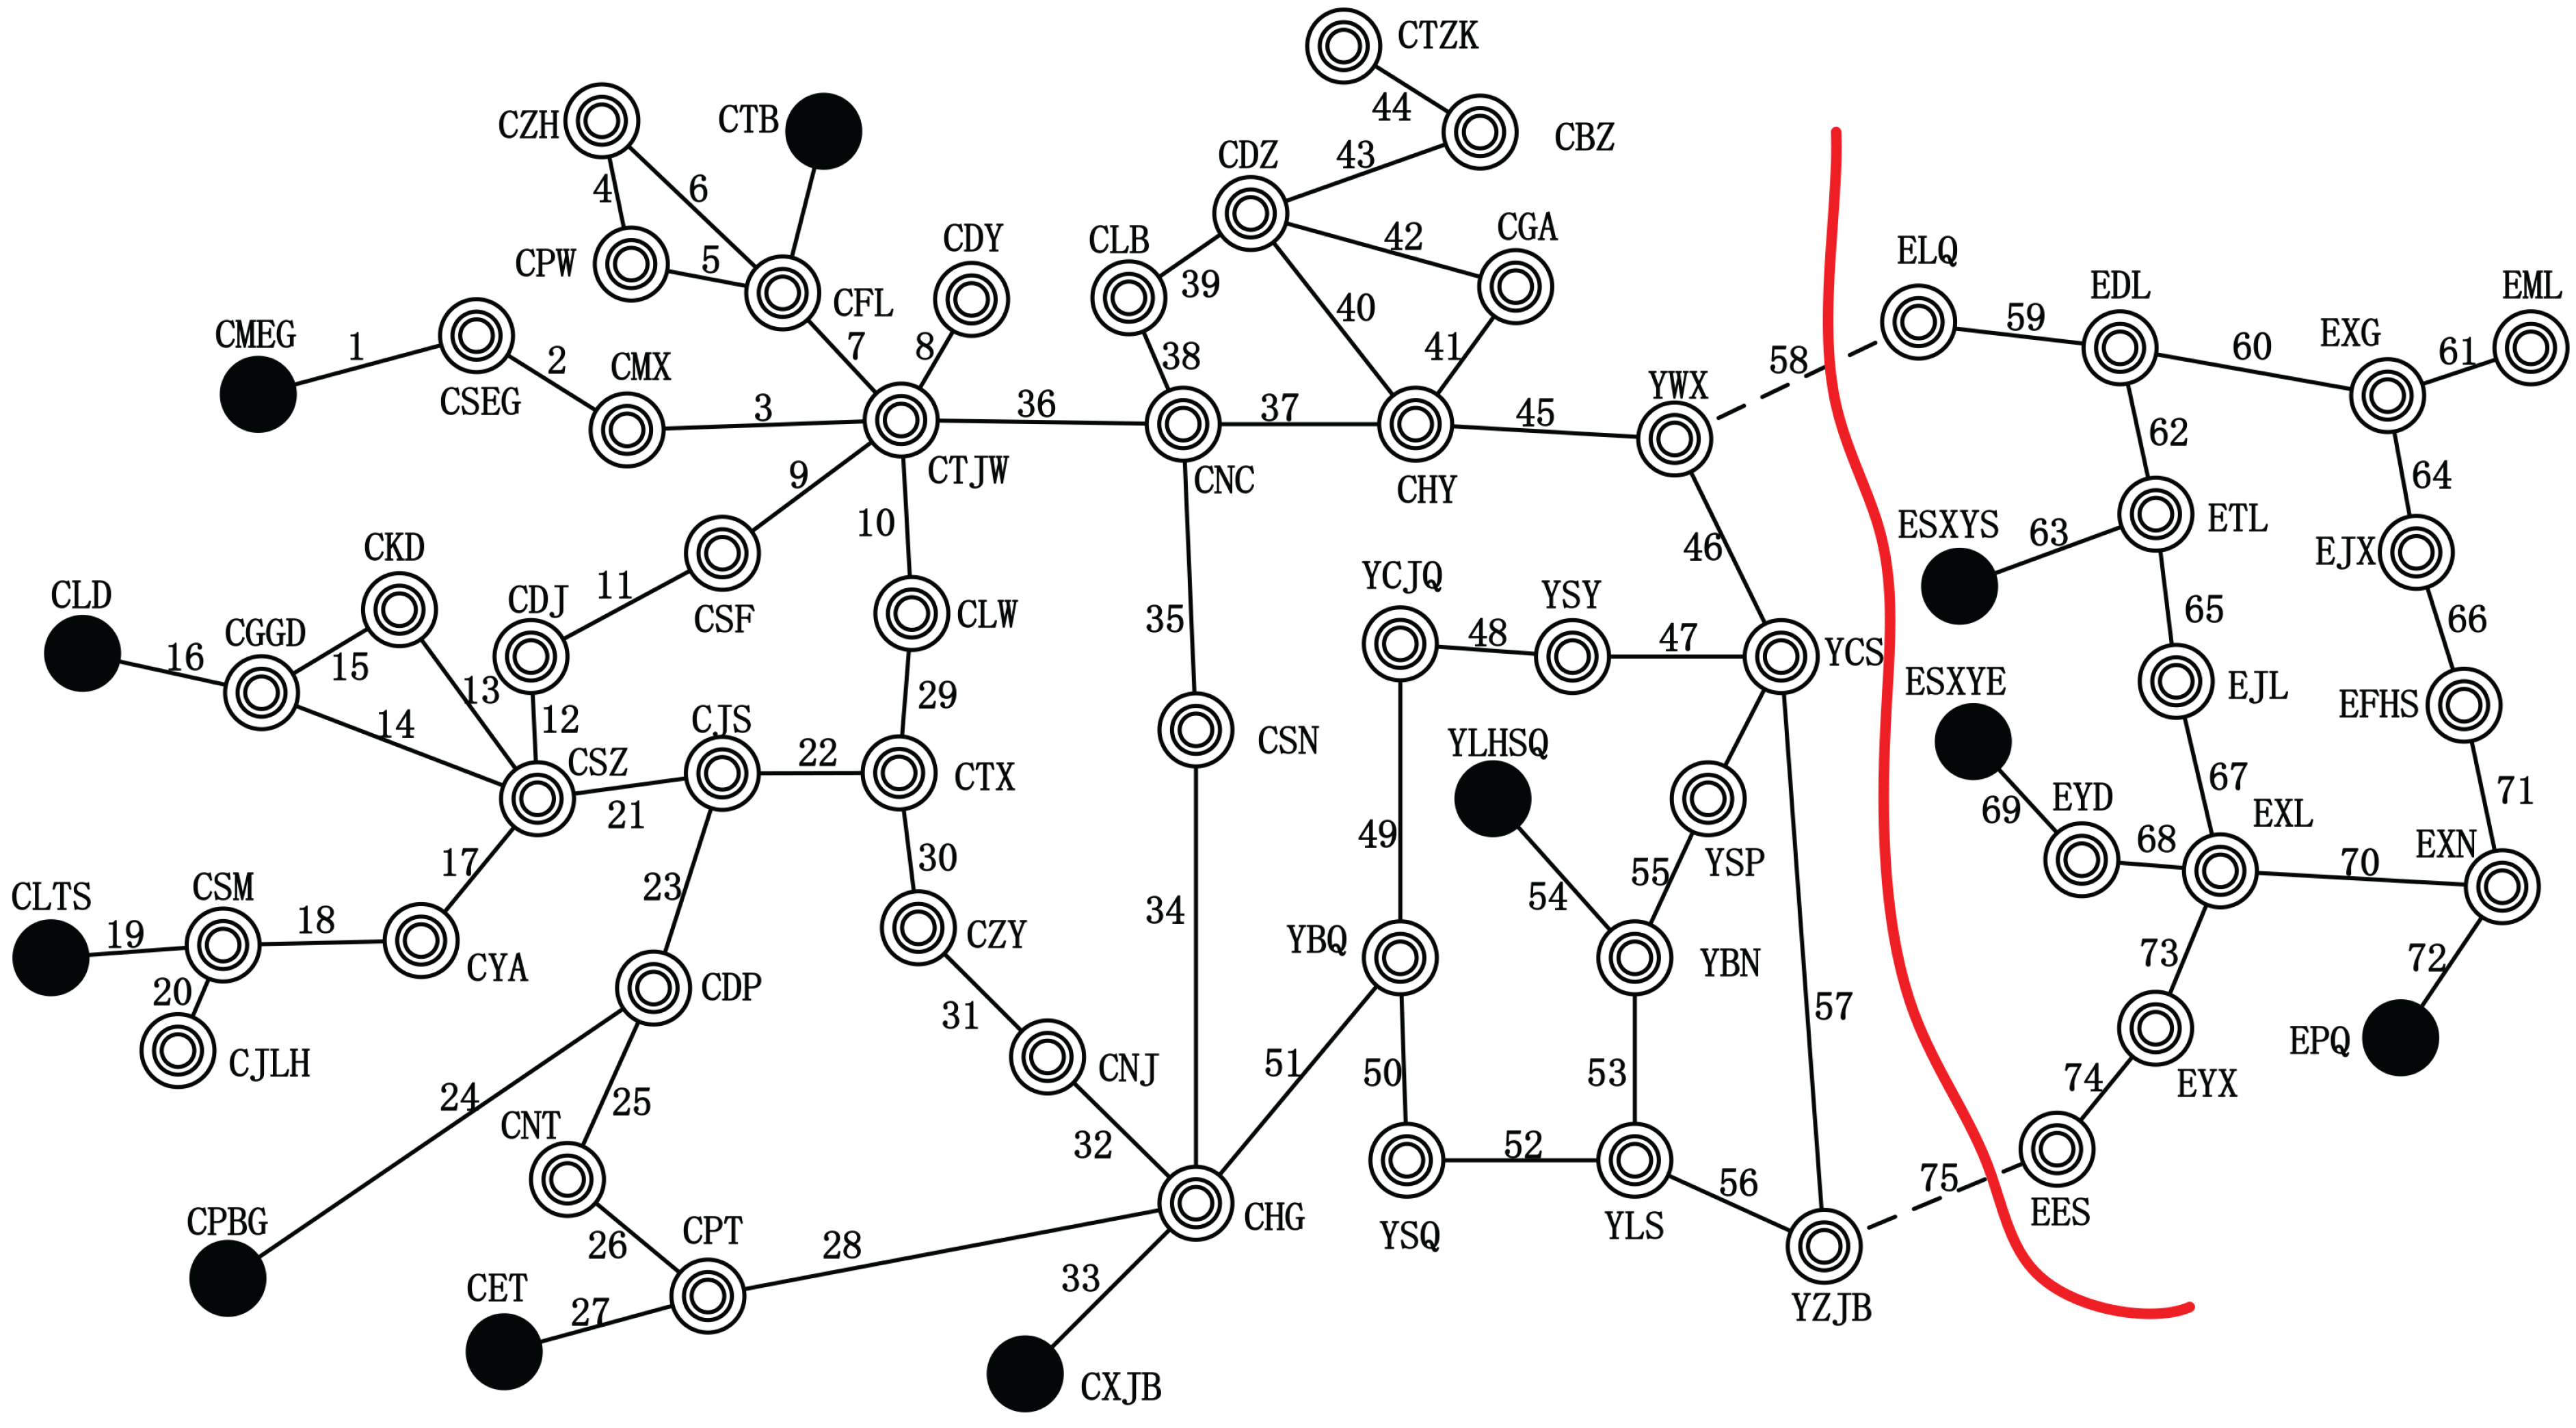
Table 6.
The best splitting solution of the reduced power system of central China.
| Minimum Imbalance Power | Tripped Lines | Generation Reduction | Load Shedding |
|---|---|---|---|
| 27 MW | 58 (YWX-ELQ), 75 (YZJB-EES) | CTB (9 MW), CMEG (7 MW), CLTS (11 MW) | EXG (15 MW), ELQ (3 MW), EML (9 MW) |
Figure 22d–f show the dynamic response of the generators after islanding. We can also see that two islands are successfully created with frequencies between 0.9975 and 1.0120 p.u. The voltage magnitudes shown in Figure 22e lie within [0.95 p.u., 1.05 p.u.], which indicates that this system is stable. These results indicate that our algorithm plays an important role in effectively preventing the blackout.
6. Conclusions
The control center needs to rapidly and actively respond to serious disturbances. In this paper, we propose a tabu search algorithm to help the control center split the power system into different islands; the corresponding problem is called the power system islanding problem. The critical components of the tabu search algorithm are the procedure of generating good initial solutions and the effective neighborhood operations. In our algorithm, we design a novel two-stage approach to construct the initial solution and then improve the initial solution by a neighborhood operation based on the movement of boundary nodes. The effectiveness and efficiency of this algorithm have been proven by the numerical experiments on 15 instances of various numbers of nodes. It is able to achieve high quality splitting strategies for the power systems with up to 3120 nodes within 0.7 s. The comparisons with some existing islanding methods based on the IEEE 39-bus system and the IEEE 118-bus system prove the validity and accuracy of our method. In the future, we can apply the tabu search algorithm to solve the power system islanding problems with other types of constraints, such as reactive power, voltage, etc. Furthermore, we can also study how to implement other meta-heuristics to solve this or related problems in the area of power system optimization.
Acknowledgments
This research was supported by the National Natural Science Foundation of China (Grant No.51507116).
Author Contributions
All the authors were involved in preparing the manuscript. Fei Tang raised the conception and prepared the structure of the study, analysed the data and wrote the manuscript. Huizhi Zhou performed the data analyses and wrote part of the manuscript. Qinghua Wu coded the Tabu program and debugged, performed the data analyses, helped response the rewiers. Qin Hu contributed significantly to analysis and manuscript preparation, helped prepare the response and polish the language. Jia Ju and Guo Ke helped perform the analysis with constructive discussions and did the simulations.
Conflicts of Interest
The authors declare no conflict of interest.
References
- Yamashita, K.; Joo, S.K.; Li, J.; Zhang, P.; Liu, C.C. Analysis, control, and economic impact assessment of major blackout events. Eur. Trans. Electr. Power 2008, 18, 854–871. [Google Scholar] [CrossRef]
- Final Report on the August 14, 2003 Blackout in the United States and Canada: Causes and Recommendations. CERTS (Consortium for Electric Reliability Technology Solutions): North America, 2004.
- Final Report of the Investigation Committee on the 28 September 2003 Blackout in Italy. UCTE (Union for the Coordination of Electricity Transmission): Europe, 2004.
- Final Report—System Disturbance on 4 November 2006. UCTE (Union for the Coordination of Electricity Transmission): Europe, 2007.
- Adibi, M.M.; Kafka, R.J.; Maram, S.; Mili, L.M. On Power System Controlled Separation. IEEE Trans. Power Syst. 2006, 21, 1894–1902. [Google Scholar] [CrossRef]
- Liu, L.; Liu, W.; Cartes, D.A.; Chung, I.Y. Slow coherency and angle modulated particle swarm optimization based islanding of large-scale power systems. Adv. Eng. Inform. 2009, 23, 45–56. [Google Scholar] [CrossRef]
- Zhao, Q.; Sun, K.; Da-Zhong, Z.; Lu, Q. A study of system splitting strategies for island operation of power system: A two-phase method based on OBDDs. IEEE Trans. Power Syst. 2003, 18, 1556–1565. [Google Scholar] [CrossRef]
- Sun, K.; Da-Zhong, Z.; Lu, Q. Splitting strategies for islanding operation of large-scale power systems using OBDD-based methods. IEEE Trans. Power Syst. 2003, 18, 912–923. [Google Scholar]
- Sun, K.; Hur, K.; Zhang, P. A new unified scheme for controlled power system separation using synchronized phasor measurements. IEEE Trans. Power Syst. 2011, 26, 1544–1554. [Google Scholar] [CrossRef]
- You, H.; Vittal, V.; Wang, X. Slow coherency-based islanding. IEEE Trans. Power Syst. 2004, 19, 483–491. [Google Scholar] [CrossRef]
- Xu, G.; Vittal, V. Slow coherency based cutset determination algorithm for large power systems. IEEE Trans. Power Syst. 2010, 25, 877–884. [Google Scholar] [CrossRef]
- Ding, L.; Gonzalez-Longatt, F.M.; Wall, P.; Terzija, V. Two-step spectral clustering controlled islanding algorithm. IEEE Trans. Power Syst. 2013, 28, 75–84. [Google Scholar] [CrossRef]
- Glover, F.; Laguna, M. Tabu Search. In Handbook of Combinatorial Optimization; Du, D.Z., Pardalos, P.M., Eds.; Springer-Verlag: Berlin, Germany, 1999; pp. 2093–2229. [Google Scholar]
- Andreev, K.; Räcke, H. Balanced graph partitioning. Theory Comput. Syst. 2006, 39, 929–939. [Google Scholar]
- Alpert, C.J.; Kahng, A.B. Recent directions in netlist partitioning: A survey. VLSI J. Integr. 1995, 19, 1–81. [Google Scholar] [CrossRef]
- Hendrickson, B.; Kolda, T.G. Graph partitioning models for parallel computing. Parallel Comput. 2000, 26, 1519–1534. [Google Scholar] [CrossRef]
- Bryant, R.E. Graph-based algorithms for Boolean function manipulation. IEEE Trans. Comput. 1986, 100, 677–691. [Google Scholar] [CrossRef]
- Sun, K.; Zheng, D.Z.; Lu, Q. A simulation study of OBDD-based proper splitting strategies for power systems under consideration of transient stability. IEEE Trans. Power Syst. 2005, 20, 389–399. [Google Scholar] [CrossRef]
- Yang, B.; Vittal, V.; Heydt, G.T. Slow-Coherency-Based Controlled Islanding; A Demonstration of the Approach on the August 14, 2003 Blackout Scenario. IEEE Trans. Power Syst. 2006, 21, 1840–1847. [Google Scholar] [CrossRef]
- Yang, B.; Vittal, V.; Heydt, G.T.; Sen, A. A Novel Slow Coherency Based Graph Theoretic Islanding Strategy. In Proceedings of the The 2007 IEEE Power Engineering Society General Meeting, Tampa, FL, USA, 24–28 June 2007; pp. 1–7.
- Trodden, P.A.; Bukhsh, W.A.; Grothey, A.; McKinnon, K.I.M. Optimization-based islanding of power networks using piecewise linear AC power flow. IEEE Trans. Power Syst. 2014, 29, 1212–1220. [Google Scholar] [CrossRef]
- Chow, J.H. Time-Scale Modeling of Dynamic Networks with Applications to Power Systems; Springer-Verlag: Berlin, Germany, 1982. [Google Scholar]
- Pampara, G.; Franken, N.; Engelbrecht, A.P. Combining Particle Swarm Optimisation with Angle Modulation to Solve Binary Problems. In Proceedings of the 2005 IEEE Congress on Evolutionary Computation, Edinburgh, Scotland, 5 September 2005; pp. 89–96.
- Sen, A.; Ghosh, P.; Vittal, V.; Yang, B. A new min-cut problem with application to electric power network partitioning. Eur. Trans. Electr. Power 2009, 19, 778–797. [Google Scholar] [CrossRef]
- Klein, P.; Ravi, R. A Nearly Best-Possible Approximation Algorithm for Node-Weighted Steiner Trees. J. Algorithms 1995, 19, 104–115. [Google Scholar] [CrossRef]
- Wang, C.G.; Zhang, B.H.; Hao, Z.G.; Shu, J.; Li, P.; Bo, Z.Q. A novel real-time searching method for power system splitting boundary. IEEE Trans. Power Syst. 2010, 25, 1902–1909. [Google Scholar] [CrossRef]
- Ding, L.; Wall, P.; Terzija, V. Constrained spectral clustering based controlled islanding. Int. J. Electr. Power Energy Syst. 2014, 63, 687–694. [Google Scholar] [CrossRef]
- Glover, F.; Laguna, M. Tabu Search*. In Handbook of Combinatorial Optimization; Pardalos, P.M., Du, D.Z., Graham, R.L., Eds.; Springer-Verlag: Berlin, Germany, 2013; pp. 3261–3362. [Google Scholar]
- Rolland, E.; Pirkul, H.; Glover, F. Tabu search for graph partitioning. Ann. Oper. Res. 1996, 63, 209–232. [Google Scholar] [CrossRef]
- Battiti, R.; Bertossi, A.A. Greedy, prohibition, and reactive heuristics for graph partitioning. IEEE Trans. Comput. 1999, 48, 361–385. [Google Scholar] [CrossRef]
- Benlic, U.; Hao, J.K. An effective multilevel tabu search approach for balanced graph partitioning. Comput. Oper. Res. 2011, 38, 1066–1075. [Google Scholar] [CrossRef] [Green Version]
- Ding, L.; Terzija, V. A New Controlled Islanding Algorithm Based on Spectral Clustering. In Proceedings of the 4th International Conference on Electric Utility Deregulation and Restructuring and Power Technologies (DRPT), Weihai, China, 6–9 July 2011; pp. 337–342.
- Molzahn, D.K.; Holzer, J.T.; Lesieutre, B.C.; DeMarco, C.L. Implementation of a large-scale optimal power flow solver based on semidefinite programming. IEEE Trans. Power Syst. 2013, 28, 3987–3998. [Google Scholar] [CrossRef]
- Qin Hu’s Web Page. Available online: https://sites.google.com/a/tigerqin.com/www/publicatoins/psip (accessed on 12 October 2015).
- Aghamohammadi, M.R.; Shahmohammadi, A. Intentional islanding using a new algorithm based on ant search mechanism. Int. J. Electr. Power Energy Syst. 2012, 35, 138–147. [Google Scholar] [CrossRef]
- Athay, T.; Podmore, R.; Virmani, S. A practical method for the direct analysis of transient stability. IEEE Trans. Power Appar. Syst. 1979, 2, 573–584. [Google Scholar] [CrossRef]
- Power System Analysis and Engineering–DIgSILENT Germany. Available online: http://www.digsilent.de/ (accessed on 12 October 2015).
- Machowski, J.; Bialek, J.; Bumby, D.J. Power System Dynamics: Stability and Control, 2nd ed.; John Wiley & Sons, Ltd: Hoboken, NJ, USA, 2008. [Google Scholar]
- Song, Y.; Ma, S.; Wu, L.; Wang, Q.; Hailei, H. PMU Placement Based on Power System Characteristics. In Proceedings of the International Conference on Sustainable Power Generation and Supply, Nanjing, China, 6–7 April 2009; pp. 1–6.
© 2015 by the authors; licensee MDPI, Basel, Switzerland. This article is an open access article distributed under the terms and conditions of the Creative Commons Attribution license (http://creativecommons.org/licenses/by/4.0/).