Abstract
This paper aims to present an improved version of a typical particle swarm optimization (PSO) algorithm, such that the global maximum power point (MPP) on a P-V characteristic curve with multiple peaks can be located in an efficient and precise manner for a photovoltaic module array. A series of instrumental measurements are conducted on variously configured arrays built with SANYO HIP2717 PV modules, either unshaded, partially shaded, or malfunctioning, as the building blocks. There appear two, triple and quadruple peaks on the corresponding P-V characteristic curves. Subsequently, the tracking performance comparisons, made by some practical experiments, indicate the superiority of this improved MPP tracking algorithm over the typical one.
1. Introduction
A photovoltaic power generation system refers to a power system involving a photovoltaic array, a power conditioner(s) and a transmission and distribution system. The output power provided by a single PV module is found to vary nonlinearly with the change in solar irradiation and the ambient temperature. Hence, it becomes a significant research issue to develop maximum power point tracking (MPPT) techniques, through power electronics, which enable a PV power generation system to provide the maximum output power at all events. To date, the published MPPT algorithms include the voltage feedback [1], the constant voltage tracking (CVT) [2], the power feedback [3], the perturb and observe (P & O) [4], the incremental conductance (INC) methods [5], and so on. The voltage feedback method is deemed as the simplest approach, while the output voltage corresponding to the MPP must be known in advance of the tracking operation. More importantly, MPP drifts due to the PV module deteriorations, meaning that the P-V characteristic curve must be updated frequently, and otherwise the MPP cannot be located successfully. As a simple tracking strategy, a CVT approach does not require a high computational complexity. Since there is little difference between the output voltage levels at MPP under various solar illuminance conditions, a PV module array operates at all events at the MPP voltage measured under standard test conditions (STC). Nonetheless, such difference rises at a low level of solar illuminance, or in the event of temperature drift of PV module, which deteriorates the tracking accuracy. Since MPP is a point at which dP/dV = 0 on a P-V characteristic curve, the MPP tracker is operated in such a way that dP/dV approaches zero. In comparison with a voltage feedback approach, a power feedback approach requires a higher computational complexity and exhibits a lower level of energy consumption, namely a higher overall efficiency, but there is an extremely low probability that the MPP can be exactly located due to the accuracy limit on sensors employed. With reference to a P & O approach, the operating voltage of a PV module array is perturbed periodically. In case of a rise in the output power, the voltage is further perturb toward the same direction. Otherwise, it is toward along the opposite direction. In simple terms, the operating point oscillates around, but cannot stay constantly and exactly at the MPP leading to a large amount of power loss during tracking process, i.e., a power efficiency reduction. When applied to an MPP tracking task on a P-V characteristic curve with multiple peaks, all the above-stated approaches tend to track the local, rather than the desired global, MPP.
Over recent years, there has been a large volume of published studies on smart MPP trackers [6,7,8,9,10,11,12] in an attempt to precisely locate the MPP and improve the tracking performance, both dynamic and static. Yet, these tracking strategies fail to track the global MPP as intended in the case of any partially shaded PV modules in an array, simply due to the multiple peak problems commonly found in practical operations. For this sake, it becomes a critical issue to develop an algorithm to track the global, rather than the local, MPP on a complex nonlinear output curve. Researchers have recently proposed maximum power point tracking techniques [13,14,15,16,17] for photovoltaic module array based on the particle swarm optimization algorithm, to increase the dynamic responding speeds of tracking. However, the literature [13] did not take into account the characteristics of the module in partial shade and thus can be applicable to only the MPP tracking by modules all in the condition of the same sunshine. In the literature [14], the proposed method was able to effectively obtain the maximum power point, MPP, in the working condition in various shades, but it applies to only systems with multiple converters. The literature [15] features the tracking of global MPP with multi-peak characteristic curve, but such tracking lacks robustness as the learning factor and weight in the algorithm are of fixed value, which thus resulted in unlikely high success in obtaining global MPP with limited iterations, and, if the MPP is successfully obtained, insufficient dynamic responding speed. Though the literature [16,17] proposed improved particle swarm optimization, [16] lacked the factors of consideration in the guidelines for system design and in actual design, while [17] improved on conventional PSO algorithms and made them applicable to photovoltaic module arrays in the shade, but its selection of parameters for PSO algorithm was in a linear decremented manner that disqualified as optimization for photovoltaic module arrays with non-linear characteristics, in particular those in the shade.
In view of this, this work is proposed as an improved version of typical tracking algorithms when dealing with the global MPP tracking issue experienced in an array involved partially shaded or even malfunctioning PV modules. The superior tracking performance of this proposal is demonstrated by experimental results in various test cases.
2. Connection Characteristics of Photovoltaic Module Arrays
A SANYO HIP2717 photovoltaic module [18] is employed as a building block of PV module arrays in this work, and the electric specifications thereof are tabulated in Table 1 under standard test conditions (STC): Irradiation of 1000 W/m2, airmass AM 1.5, and module temperature of 25 °C.

Table 1.
Electrical specifications of the SANYO HIP 2717 PV modules.
| Electrical parameters | Specifications |
|---|---|
| Maximum output power (Pmp) | 27.8 W |
| Maximum power point current (Imp) | 1.63 A |
| Maximum power point voltage (Vmp) | 17.1 V |
| Short-circuit current (Isc) | 1.82 A |
| Open-circuit voltage (Voc) | 21.6 V |
| Module length and width specifications | 496 mm × 524 mm |
In a unshaded case, an M-series N-parallel module array provides an output voltage M × Vmp, an output current N × Imp and an output power M × N × Pmp at the maximum power point (MPP), under an assumption that each single photovoltaic module provides an output voltage Vmp, an output current Imp and an output power Pmp at the MPP. Yet, should there be variously shaded PV modules in a PV array, as illustrated in Figure 1, the total amount of output power provided falls accordingly. Furthermore, an overshaded case gives rise to a multiple peak value problem, which disables a maximum power point tracker as intended to locate the MPP.
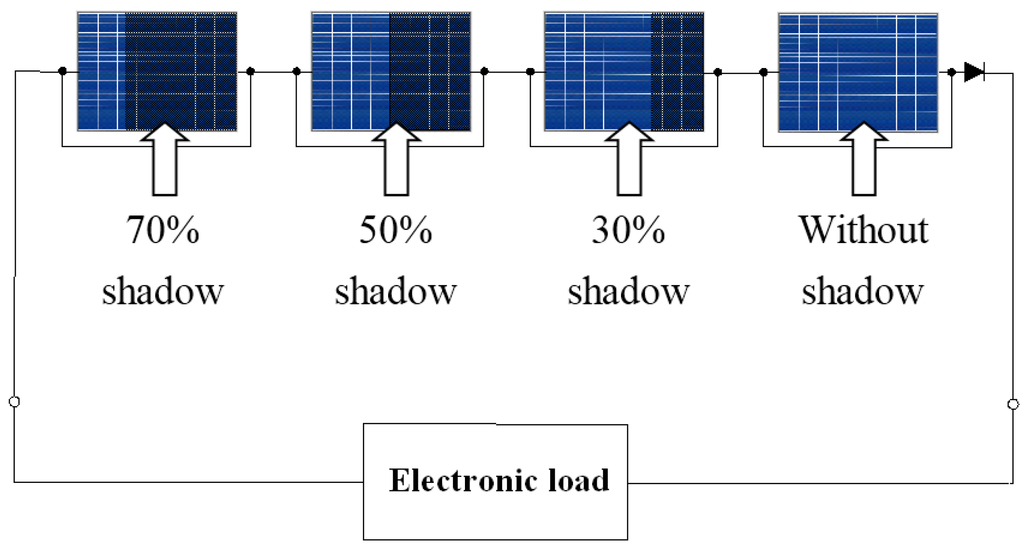
Figure 1.
Schematic diagram of a PV array composed of unshaded and partially shaded PV modules.
If any modules in a PV array are in the shade, the output power of the PV array decreases. Again, if any module in a PV array is faulty, such module can form a circuit with a bypass diode to maintain the power generated by the PV array at a certain level. This bypass diode improves on the situation of reduced output power in the case of part of the modules in a PV array, however, it is unable to resolve the problem with decreased output voltage and current when the modules are in the shade. Also, if the proportion of the PV modules in the shade is too large, an output power with double peaks or multiple peaks may appear, which would further lead to the failure of MPP tracking device to control the work of the PV array at the real maximum power point.
Given the characteristics of PV module arrays as above mentioned, this paper sets the developed SANYO HIP 2717 module simulator [19] at different rates of shade and the condition of defect, also forms PV module arrays of various configurations in series and in parallel to conduct MPP tracking tests. Figure 2 and Figure 3 show the characteristic curves for I-V and P-V output which were obtained by simulation with PSpice software [20] on the four in series and one in parallel array of SANYO HIP 2717 PV modules which were set in the condition of each module in 30% shade alike.
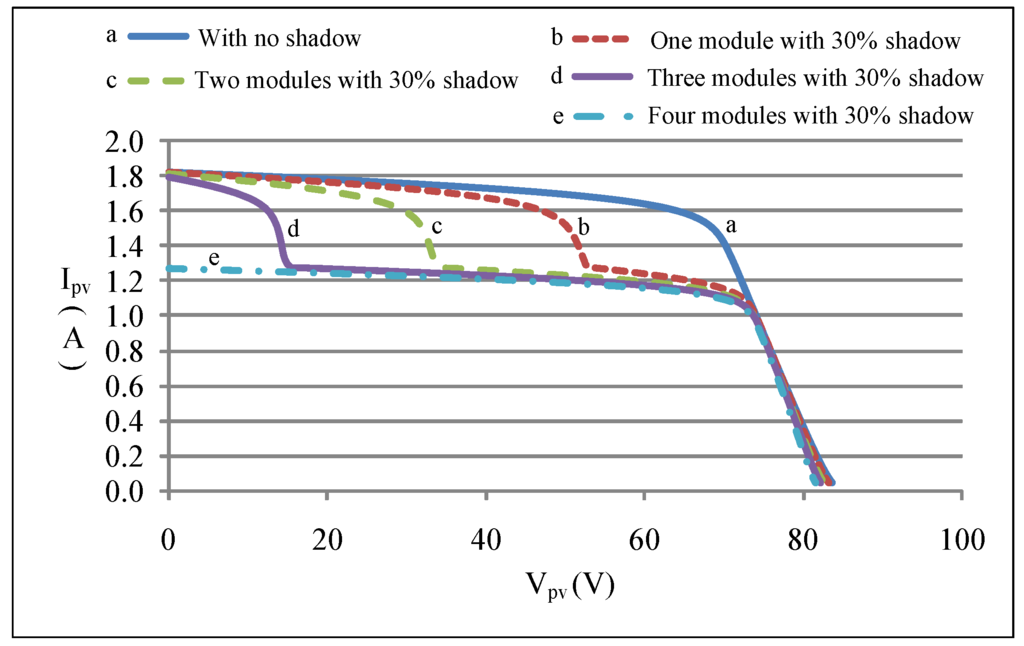
Figure 2.
Comparison of I-V characteristic curves in a 4-series 1-parallel case with various number of 30% shaded modules.
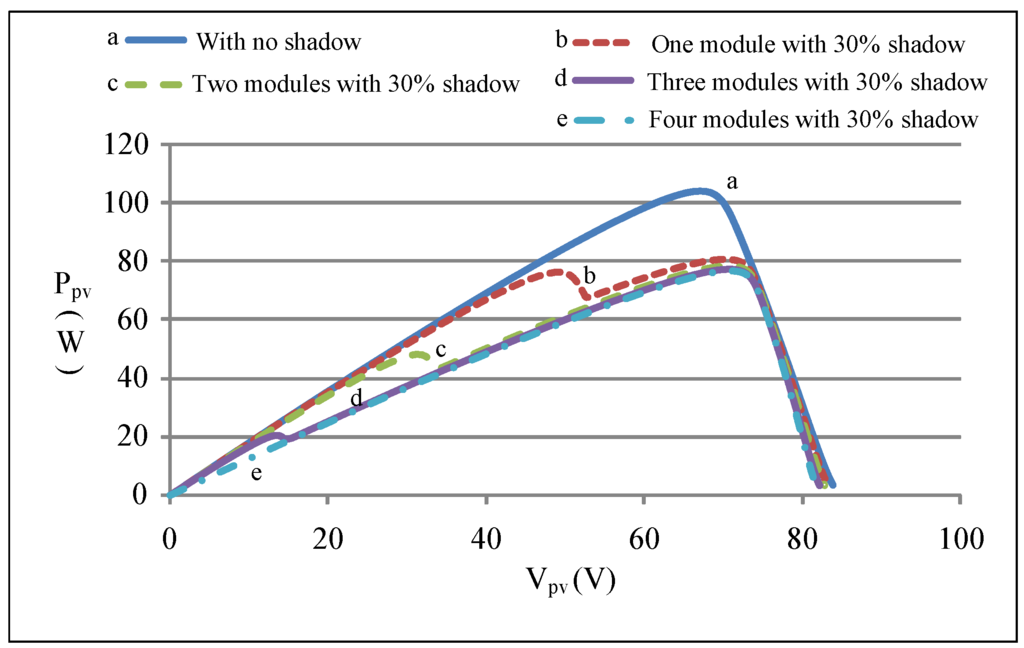
Figure 3.
Comparison of P-V characteristic curves in a 4-series 1-parallel case with various number of 30% shaded modules.
It can be observed from the figures that when part of the modules in the array are in partial shade, the I-V and P-V characteristic curves both displayed multiple peaks. Whereas when the PV module array is faulty, the one single faulty module would not function and produced no current to the loads, but the other normal modules send current through the bypass diode of the faulty module, allowing these normal modules to keep on working. Figure 4 and Figure 5 show the I-V and P-V output characteristic curves derived with PSpice software for different numbers of faulty modules, which reveal that when part of the modules in a same array in series are faulty, their I-V and P-V characteristic curves do not display multiple peaks.
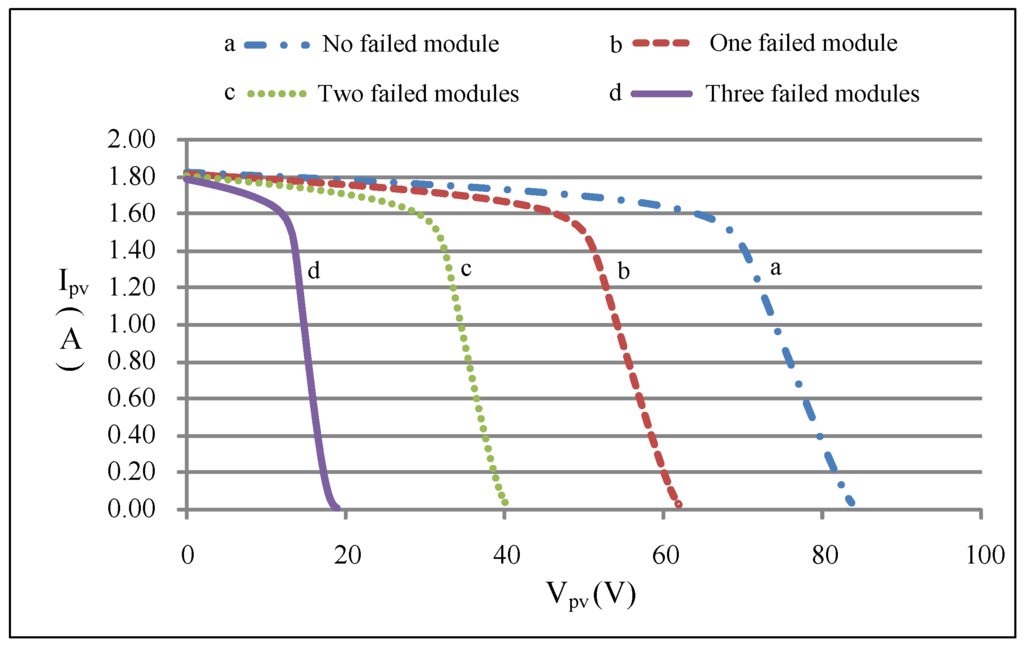
Figure 4.
Comparison of I-V characteristic curves in a 4-series 1-parallel case with various number of malfunctioning modules.
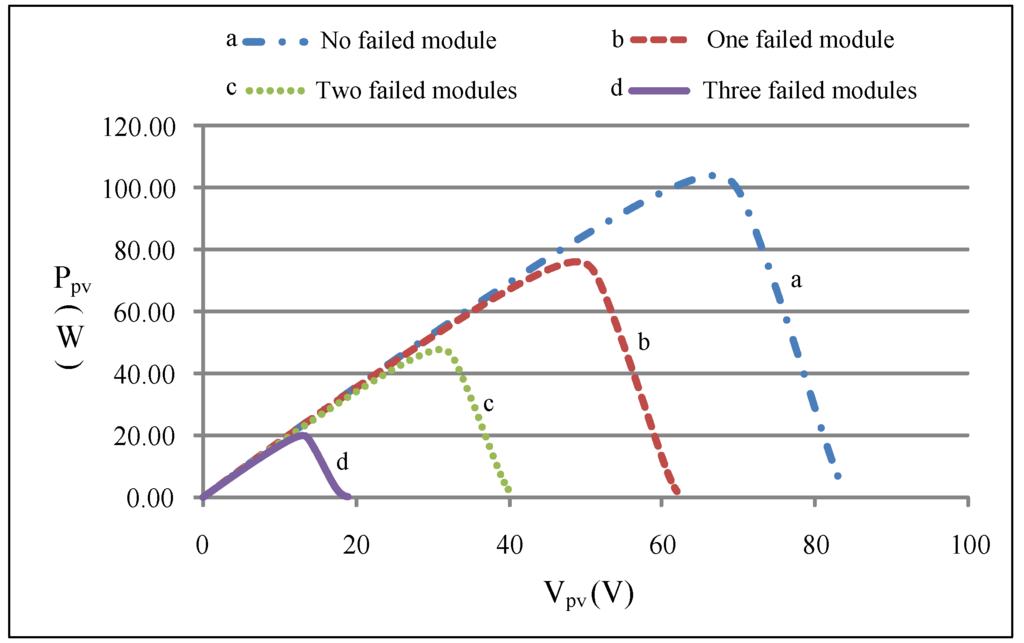
Figure 5.
Comparison of P-V characteristic curves in a 4-series 1-parallel case with various number of malfunctioning modules.
3. MPPT Method Based on PSO Algorithm
Proposed in 1995 by Kennedy and Eberhart [21], particle swarm optimization (PSO) algorithm refers to an optimization approach for the public interest in a society. It is inspired by the flocking behavior of birds or fish that individuals communicate in such a way that the entire population migrates toward the same target along the same direction.
3.1. Conventional PSO Algorithm
A flowchart of the conventional PSO algorithm is shown in Figure 6, and the steps are described below:
- Step 1:
- Specify the value of the number of particles, P, and the number of iterations, N.
- Step 2:
- For each particle, initialize its value, namely the duty cycle of a boost converter in this study, its value of the velocity Vij, the individual optimized D value, i.e., Pbest, (the initial value of D), and the optimized D value of the entire particle swarm, Gbest.
- Step 3:
- Given the cognition-only factor C1, the social-only learning factor C2 and the inertial weight W, the substitution of the initial value of D into the fitness function gives the updated particle velocity, expressed as:and D is updated as:
- Step 4:
- Either Pij+1 or Pij is saved as Pbest,i for such D value, whichever is larger.
- Step 5:
- Either Pbest,i or Gbest is saved as Gbesi for such D value, whichever is larger.
- Step 6:
- Repeat Steps 3–5 until the specified number of iterations is reached.
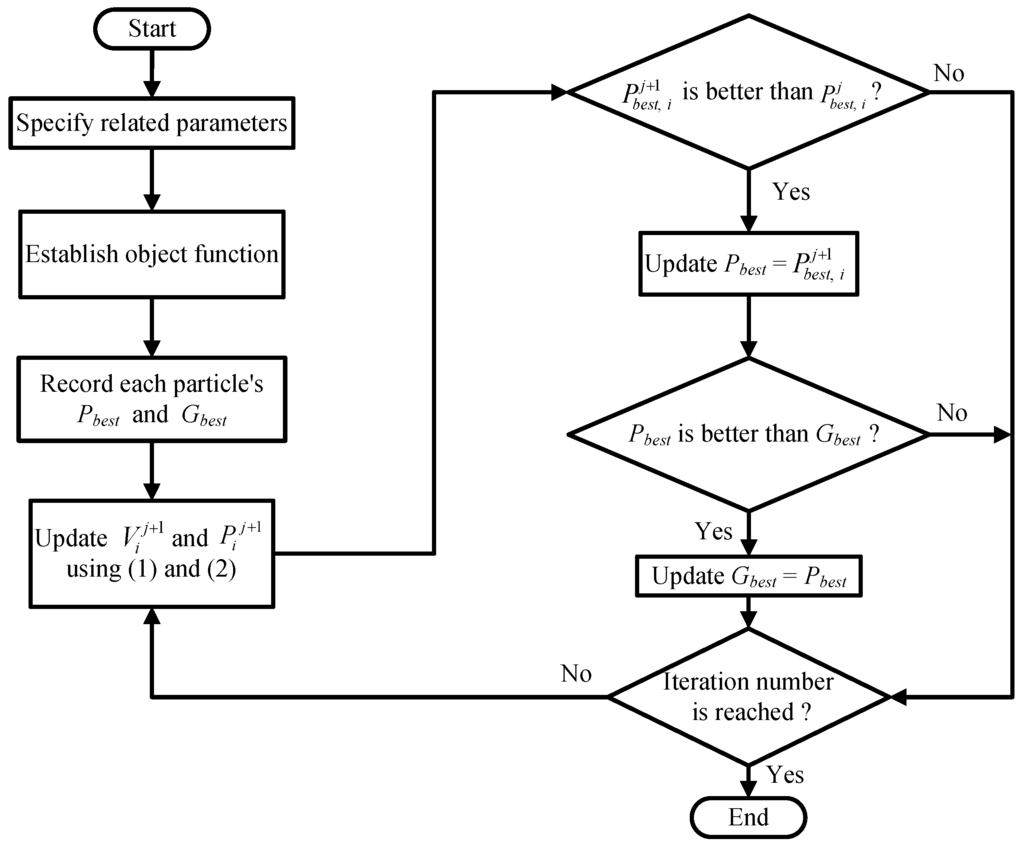
Figure 6.
Flowchart for conventional PSO algorithm.
The nomenclature of typical PSO parameters is given below:
- The number of particles P: The number of particles being tracked for a given initial duty cycle D,
- The number of iterations N: Times of travels of each particle,
- The cognition-only learning factor C1: The learning factor in relation to the particle itself,
- The social-only learning factor C2: The learning factor in relation to other particles,
- The inertia weight W: The relation to the distance traveled last time of a particle,
- : The velocity of particle i in iteration j,
- : The duty cycle D of particle i in iteration j,
- Rand1 (): The first random number between 0 and 1,
- Rand2 (): The second random number between 0 and 1,
- : The individual optimal value of the duty cycle D of particle i, and
- : The global optimal value of the duty cycle D among the whole particles.
Typically, the cognition-only and social-only learning factors C1, C2 and the inertia weight W are constants, and are related by W = (10 − C1 − C2)/10.
3.2. Proposed PSO Algorithm with Automatic Parameter Tuning
Though conventional PSO algorithms stated in Section 3.1. feature the tracking of global MPP with curves of multi-peak characteristics, the learning factors and weights in them are fixed value. Therefore, their tracking performance is not so robust, and, as a result, the rate of success in tracking the global MPP within limited iterations is low and, if MPP sought, the dynamic responding speeds are not so high. In this view, this paper will address the situation with part of the modules of a PV module array in the shade or being faulty and adjust, by non-linear method, the parameters for PSO algorithms with memory to shorten the tracking time in the algorithm. This paper will further develop an MPPT method that excels existed methods such that better tracking of MPP can be achieved when the PV module arrays display P-V characteristic curves with multiple peaks. Therefore, this paper presents an improved version of PSO [17], where the parameters C1, C2 and W are modified into variables in each iteration, as opposed to those stated in Step 3 of the preceding section, given by:
The new parameters added in this work are stated as follows:
- The slope of P-V characteristic m: It is defined as ;
- The slope coefficient L: The value set in this paper is 0.8;
- The upper bound of slope of P-V characteristic y: The maximum slope of P-V characteristic set in this paper is 25;
- The power variation value of particle i in iteration j ΔP: It defined as ;
- The power variation value of particle i in iteration j ΔV: It define as ;
- The upper bound of the cognition-only learning factor C1,max: The maximum value of the learning factor in relation to the particle itself;
- The lower bound of the cognition-only learning factor C1,min: The minimum value of the learning factor in relation to the particle itself;
- The upper bound of the social-only learning factor C2,max: The maximum value of the learning factor in relation to other particles;
- The lower bound of the social-only learning factor C2,min: The minimum value of the learning factor in relation to other particles;
- The upper bound of the inertia weight Wmax: The maximum value of the relation to the distance traveled last time of a particle; and
- The lower bound of the inertia weight Wmin: The minimum value of the relation to the distance traveled last time of a particle.
A flowchart of the proposed PSO algorithm is shown in Figure 7.
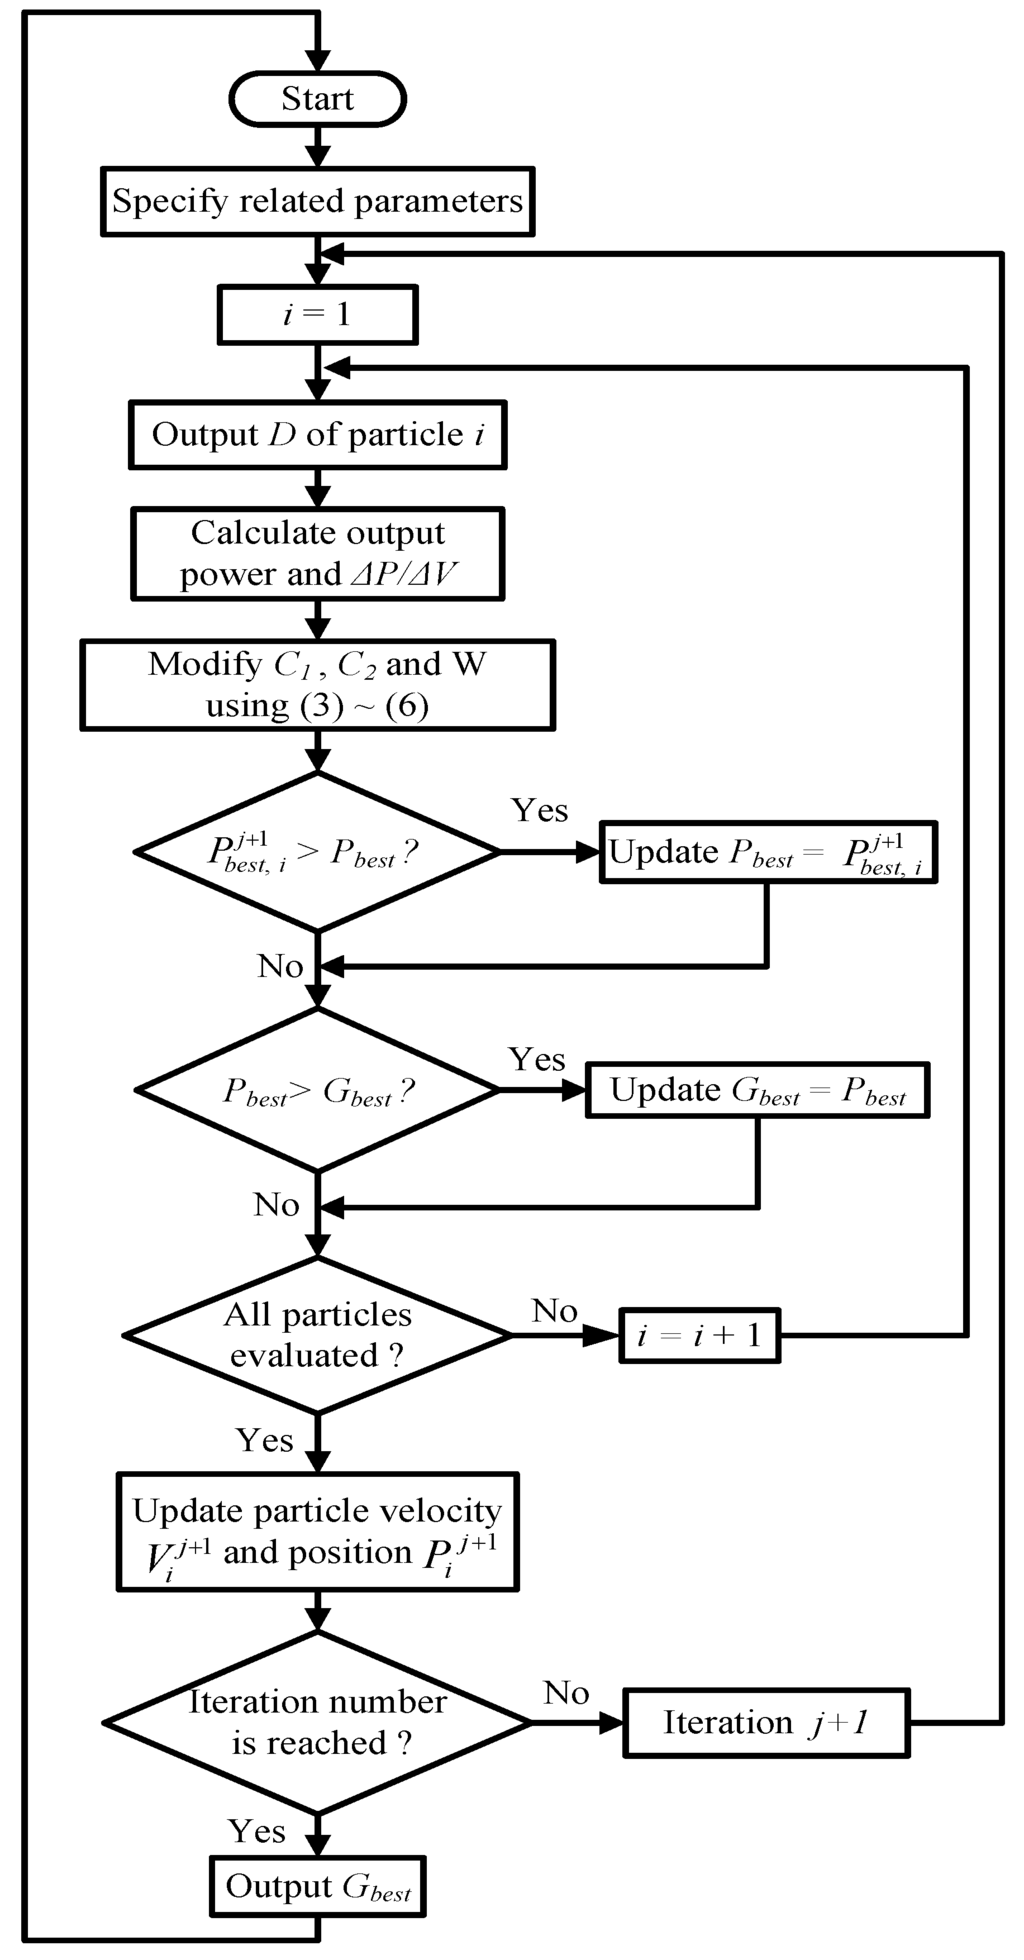
Figure 7.
Flowchart for improved PSO algorithm.
Presented in Figure 8 is an illustration where the PSO parameters C1, C2 and W are plotted against the number of iterations on the conditions C1,max = 4, C1,min = 1, C2,max = 4, C2,min = 1, Wmax = 0.8, Wmin = 0.1, N = 10. It is revealed that C2 as well as W increases with the number of iteration in this improved PSO version, meaning that the probability that the location of an global particle is the optimal position rises as the number of iterations rises, while C1 decreases with the number of iterations instead, meaning that the significance of referencing the individual optimal particle falls with the number of iterations.
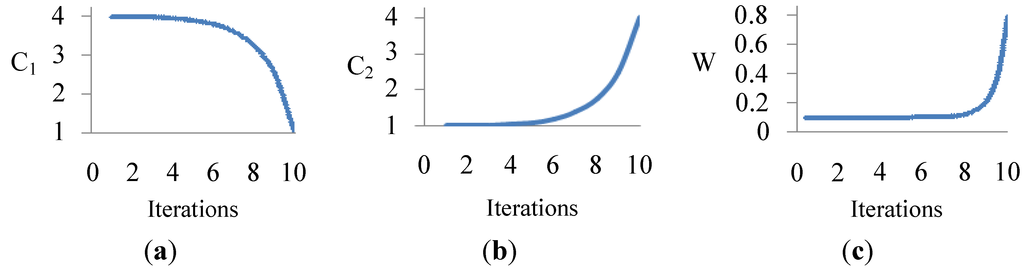
Figure 8.
Respective PSO parameter trend curves of this proposal for (a) C1; (b) C2; and (c) W.
A typical PSO algorithm and the counterpart thereof are exactly the same, except for the key difference as stated in Steps 3–5.
3.3. Implementation of MPPT Using PSO Algorithm
As presented in Figure 9, this proposed improved PV tracking system mainly involves two subsystems, i.e., (1) a DC-DC boost converter [22]; and (2) an improved PSO-based maximum power point tracker. In this manner, the PV array is operated at the MPP even in case of any malfunction or partially shaded event in a PV module(s) through a skillful manipulation of the duty cycle in the boost converter. Where the voltage across Cin is the output voltage by the PV array, its fluctuation is mainly subject to the control by the maximum power point tracker, MPPT, constructed for PSO method, further to track the array’s MPP. In this paper, the MPPT constructed for PSO method was implemented by combining the PIC16F684 micro-controller made by Microchip Corp. and a DC-DC Boost converter.
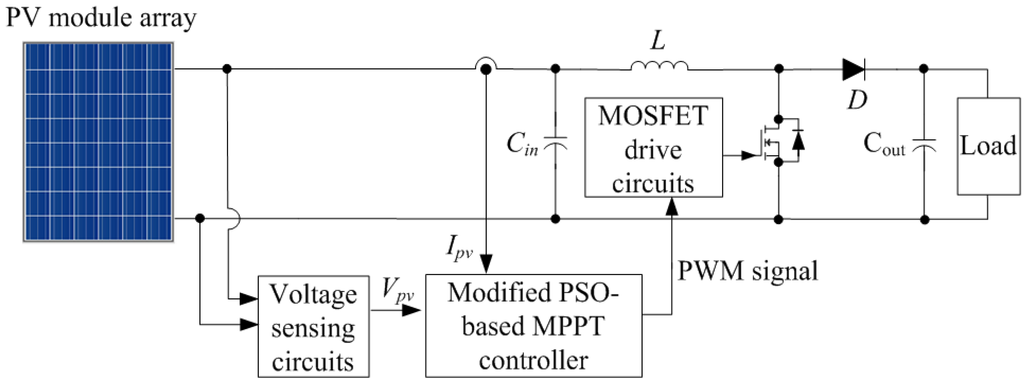
Figure 9.
System framework of this presented PSO-based MPP tracker.
Tabulated in Table 2 are the component choices and the parameter setting of the DC-DC boost converter employed in this study [22], while the PSO parameters for a typical and this improved version are tabulated respectively in Table 3 and Table 4 for comparison purposes. Practical experiments are conducted on five test cases, as listed in Table 5, following the steps as stated in Section 3.1.
Table 2.
Component choices and parameter setting for a DC-DC boost converter.
| Part Name | Types and Specifications |
|---|---|
| Inductor (L) | 1 mH |
| Capacitor () | 470 μF/450 V |
| Capacitor () | 470 μF/450 V |
| Switching frequency (f) | 20 kHz |
| Transistor | IRF460 (500 V/20 A) |
| Diode | DSEP30-12A (1200 V/30 A) |
Table 3.
Parameter setting for a typical PSO algorithm.
| Parameter Name | Setting Value |
|---|---|
| Particle number (P) | 3 |
| Iterations (N) | 30 |
| Cognition-only learning factor (C1) | 3 |
| Social-only learning factor (C2) | 3 |
| Inertia weight (W) | 0.4 |
Table 4.
Parameter setting for this proposed PSO algorithm.
| Parameter Name | Setting Value |
|---|---|
| Particle number (P) | 3 |
| Iterations (N) | 30 |
| Upper bound of the cognition-only learning factor (C1,max) | 4 |
| Lower bound of the cognition-only learning factor (C1,min) | 1 |
| Upper bound of the social-only learning factor (C2,max) | 4 |
| Lower bound of the social-only learning factor (C2,min) | 1 |
| Upper bound of the inertia weight (Wmax) | 0.8 |
| Lower bound of the inertia weight (Wmin) | 0.1 |
Table 5.
Test case descriptions.
| Case | Partial Shadow or Fault Conditions | Number of P-V Curve Peaks |
|---|---|---|
| 1 | 2-series 1-parallel: 0% shadow+70% shadow | 2 |
| 2 | 3-series 1-parallel: 0% shadow + 50% shadow + 70% shadow | 3 |
| 3 | 4-series 1-parallel: 0% shadow + 30% shadow + 50% shadow + 70% shadow | 4 |
| 4 | 4-series 1-parallel: 50% shadow + fault + 30% shadow + 0% shadow | 3 |
| 5 | 2-series 2-parallel: (0% shadow +0% shadow)//(fault +0% shadow) | 2 |
Note: “+” and “//” denote the series and parallel connection, respectively.
4. Experimental Results
The experimental devices in this paper included power supply, PV module simulators, an oscilloscope and MPPT controllers. The setting with the equipment is shown in Figure 10.
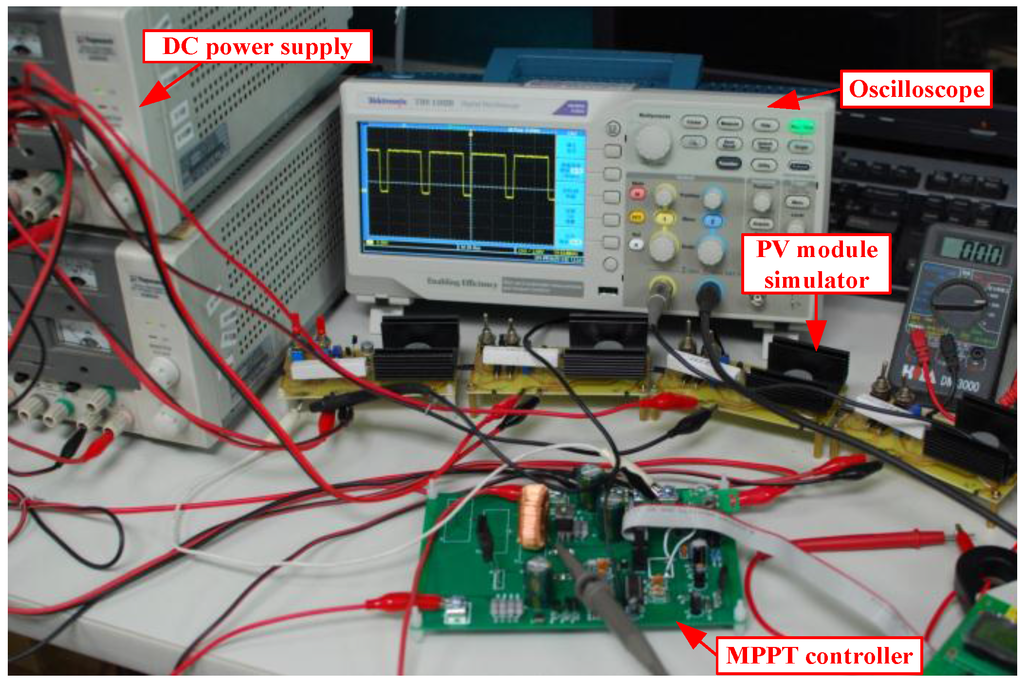
Figure 10.
Overview of the experiment setting and devices.
Practical measurements are conducted using EKO MP-170 I-V Checker [23] on five test cases for respective P-V as well as I-V characteristic curves, and the comparisons of dynamic tracking performance between a typical PSO-based MPP tracker and this proposed approach are made by experimental results. The tests in five cases in this paper were all conducted in standard test condition, STC, with the experimental steps described below. In the actual measurement of the output characteristic curves of the PV module simulator, the input terminal of the MPPT controller is connected to the PV module simulator and the output terminal to the electronic load, followed by setting value of open voltage Voc and short current Isc required by different rates of shade for the SANYO HIP 2711 PV module simulator in STC and in the configurations of five different shades or defect. With the rate of shade properly set, an MP170 I-V checker [23] is used to scan and make direct measurement of the P-V and I-V output characteristic curves in each case of test in STC. Then, a PIC16F684 microcontroller by Microchip Corp. is used to implement the both PSO algorithms and test on the MPP tracking, while an oscilloscope is used to measure the output voltage and current waveform of the PV module array, after using such voltage and current to determine the output power. The setting of test is as Figure 10 shows and the steps of test as below shows:
- Step 1:
- Adjust Voc and Isc for the PV module simulator to arrange the rate of shade needed for each test configuration. If to simulate a PV module defect, adjust the output current of the PV module simulator at zero, such that the current from the rest of the modules flows through the bypass diode of the faulty simulator.
- Step 2:
- Scan the P-V and I-V output characteristic curves of the PV module simulator using the MP170 I-V checker to verify the condition where multiple peaks appear, the positions and the power.
- Step 3:
- Perform the modified PSO MPPT algorithm and the PSO MPPT algorithm with fixed parameters, respectively, on a same hardware circuit, and compare the tracking speeds and the steady-state performances.
For the purpose of stressing the superiority of the proposed improved PSO MPPT in the performance of tracking to conventional PSO MPPT, comparisons were made of the waveforms of actual tracking responses by the length of the responding time.
As tabulated in Table 1, Case 1 refers to a 2-series 1-parallel case where there are an unshaded module and a 70% shaded one, and the I-V and P-V characteristic curves are plotted in Figure 11a, while the performance comparison between both tracking algorithms is presented in Figure 11b. As can be found in Figure 11a,b, there appear two peaks in the characteristic curve, and the typical PSO algorithm fails to track the global MPP following a limited number of iterations, for the reason that the tracking response provided is not fast enough to perform the intended tracking task. In Case 1, it was observed from Figure 11b that conventional PSO MPPT tracked the real MPP at about 96.2 ms (tb), while the proposed improved PSO MPPT spent only 35.9 ms (tb′) to achieve the same.

Figure 11.
(a) I-V and P-V characteristic curves in Case 1; and (b) the tracking performance comparison between a typical PSO-based (upper) tacking algorithm and this proposal (lower).
Case 2 refers to a 3-series 1-parallel case where there is an unshaded module, a 50% shaded module and a 70% shaded module. This case leads to a three peaks in the P-V characteristic curve in Figure 12a, and the tracking performance comparison is made in Figure 12b. In Case 2, it was observed from Figure 12b that conventional PSO MPPT tracked the real MPP at about 37.9 ms (tb), while the proposed improved PSO MPPT spent only 16.3 ms (tb′). As in Case 1, this proposed tracking algorithm is demonstrated as a more efficient way such that the MPP tracker does not get trapped at the first peak, and then successfully locates the global MPP.
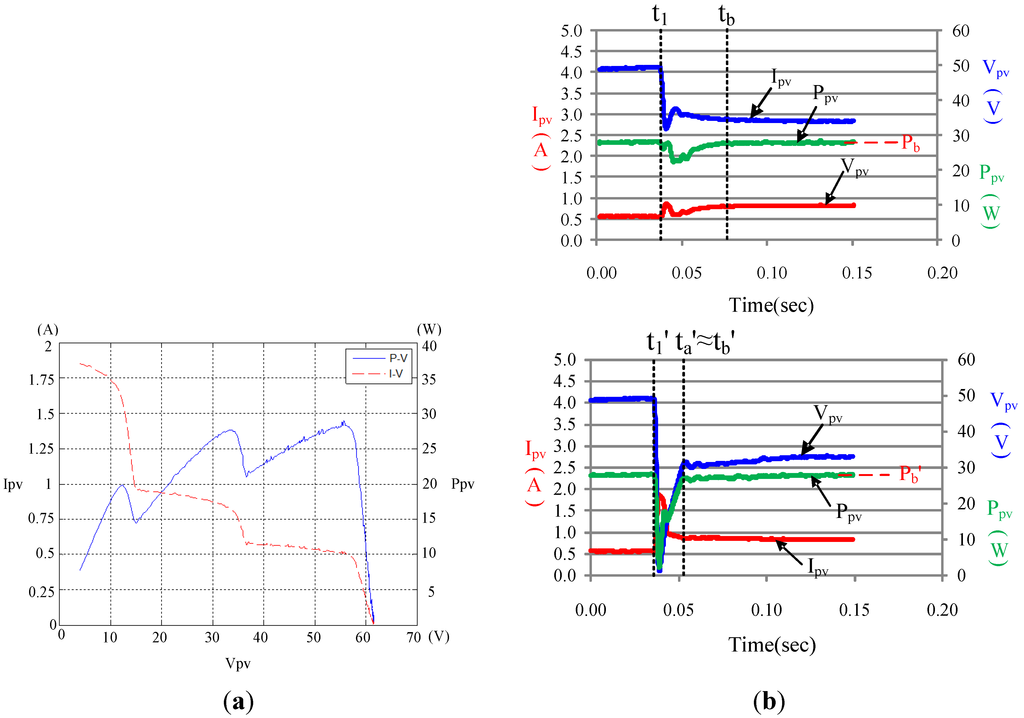
Figure 12.
(a) I-V and P-V characteristic curves in Case 2; and (b) the tracking performance comparison between a typical PSO-based (upper) tacking algorithm and this proposal (lower).
Case 3 refers to a 4-series 1-parallel case where there is an unshaded module, and the remaining PV modules are 30%, 50% and 70% shaded with four peaks on the P-V and I-V characteristic curves plotted in Figure 13a. As compared in Figure 13b, it indicated that the typical PSO algorithm was consistently trapped at local MPP within 30 iterations. However, the proposed algorithm approached the global MPP within 23.3 ms (tb′). That indicated that the more peaks the P-V characteristic curve of PV module array displayed, the more the proposed improved PSO MPPT stood out in tracking performance.
Case 4 refers to another 4-series 1-parallel case where there is a malfunctioning PV module, a 30% shaded module and a 50% shaded one. This case gives rise to three peaks on the P-V characteristic curve, as illustrated in Figure 14a. In Case 4, it was observed from Figure 14b that conventional PSO MPPT tracked the real MPP at about 52.5 ms (tb), while the proposed improved PSO MPPT spent only 13.1 ms (tb′). As compared in Figure 14b, though both algorithms can successfully locate the global MPP, this improved version demonstrates a superior dynamic tracking response relative to the counterpart, as in Case 3.
In the event, Case 5 refers to a 2-series 2-parallel case where all the P-V modules, but the only malfunctioning one, are all unshaded. This case leads to two peaks on the P-V characteristic curve as illustrated in Figure 15a, and the tracking performances are compared in Figure 15b. In Case 5, it was observed from Figure 15b that conventional PSO MPPT tracked the real MPP at about 91.9 ms (tb), while the proposed improved PSO MPPT spent only 88.7 ms (tb′). Just as in Cases 3 and 4, this improved version again demonstrates a superior dynamic tracking response relative to the counterpart, though both can reach the goal of the global MPP tracking. Therefore, it was observed from the test results that when the P-V characteristic curve displayed only two peaks which differed not much and were near to each other, the two PSO MPPT methods performed without much difference.
In the waveform of the response at the tests, the output voltage, Vpv, is the open-circuit voltage on the PV module array, with small current, before t1 when MPP tracking has not begun. Again, as a boost converter adopts fixed duty cycles, its voltage, current and power are all constants. Where MPP tracking commences at t1, since which moment the value of voltage, current and power is found varying with the duty cycle, in which it takes the power only (ta − t1) to rise rapidly from P1 to Pa and the time interval of the power rising from Pa to Pb is (tb − ta). After tb, the power curve develops toward steadiness, till the iteration time ends.
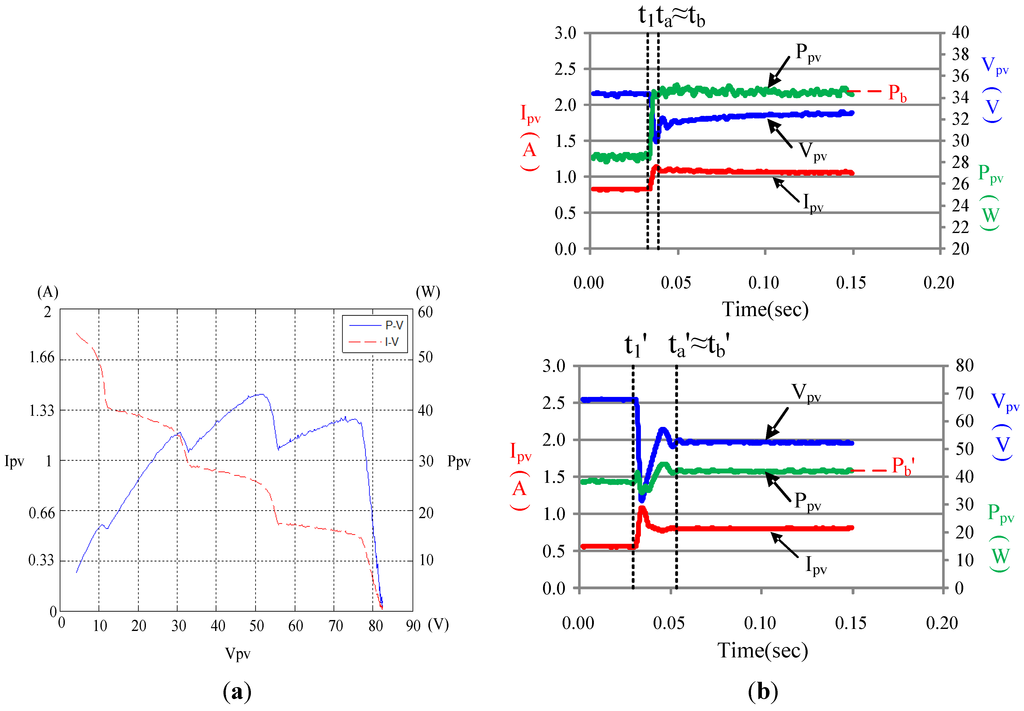
Figure 13.
(a) I-V and P-V characteristic curves in Case 3; and (b) the tracking performance comparison between a typical PSO-based (upper) tacking algorithm and this proposal (lower).
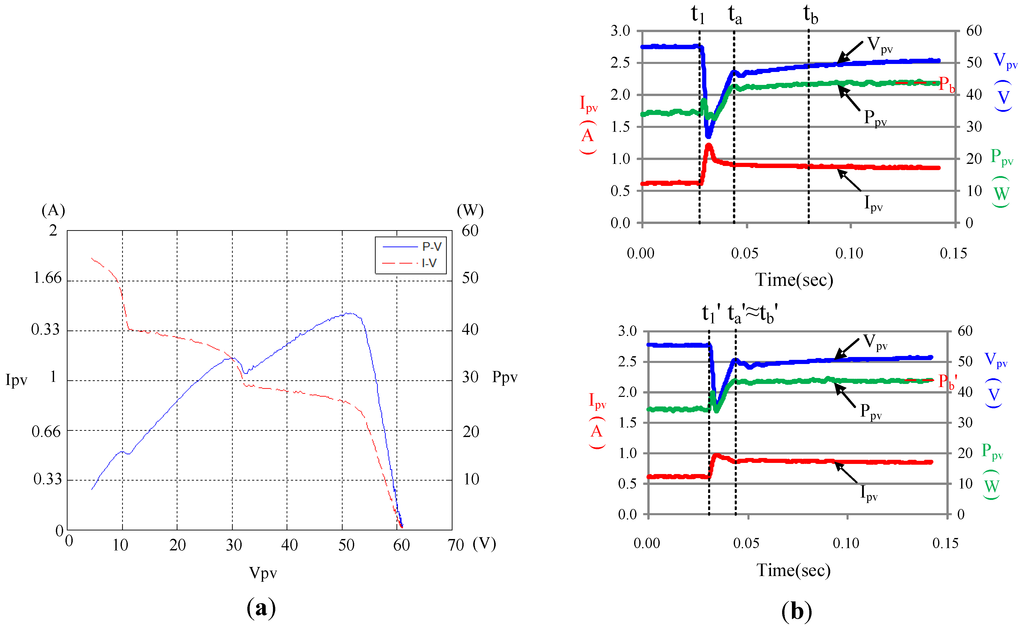
Figure 14.
(a) I-V and P-V characteristic curves in Case 4; and (b) the tracking performance comparison between a typical PSO-based (upper) tacking algorithm and this proposal (lower).
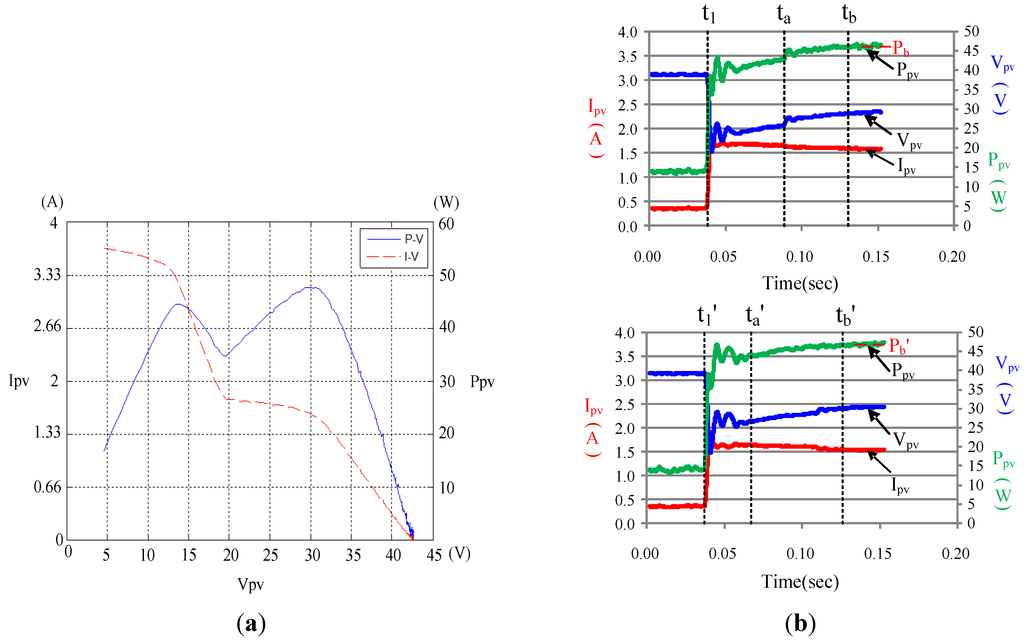
Figure 15.
(a) I-V and P-V characteristic curves in Case 5; and (b) the tracking performance comparison between a typical PSO-based (upper) tacking algorithm and this proposal (lower).
Therefore, a small (ta − t1) means fast tracking of power from P1 to Pa; if the value of power at tb approaches stability, it means from this point of time on, MPP is already obtained. It is observed from the above, with comparison that shows the difference in the performance between conventional PSO and improved PSO algorithms.
5. Conclusions
This paper proposes an improved PSO algorithm to perform maximum power point tracking of photovoltaic module arrays. In order to enhance the efficiency and performance of PSO tracking, the parameters of cognition-only learning factor, C1, social-only learning factor, C2, and the weights, W, were increased or decreased exponentially with the increase of the iterations to lessen iterations and upgrade the rate of successful tracking. Also, the MPPT controller with improved PSO algorithm based on tuning of slope of the curve of P-V characteristics that this paper proposes did locate the real MPP of multi-peak characteristics when tested in various shades, which thus was able to overcome the deficiency of conventional MPPT algorithm. Compared with conventional PSO algorithms, the proposed improved PSO algorithm features apparently excellent tracking speeds and stability as well as better tracking performance when there are multiple peaks that have similar maximums. In addition, the improved PSO algorithm with slope tuning that this paper proposed combines inertia weights and the Power Feedback method to render the former directionality, thus able to increase the speed of tracking. Given the above stated characteristics, the improved PSO algorithm that this paper proposed highlights the adaption of weights and employs non-linear increment of weights in combination with the value of the slopes of the characteristic curves to determine the distance from the location of the particles to the maximum power point; the proposed method further adjusts the value of the weights, increasing the robustness of PSO algorithm, to enhance the rate of success in tracking the real maximum power point and the convergent rate. Practical experiments are conducted on five test cases involving various combinations of partially shared, unshaded and even malfunctioning PV modules. In the end, this presented tracking algorithm is validated as a considerably more reliable approach to locating the global MPP than a typical PSO algorithm, particularly in the event of any malfunctioning or shaded PV modules.
Conflicts of Interest
The author declares no conflict of interest.
References
- Masoum, M.A.S.; Sarvi, M. Voltage and Current Based MPPT of Solar Arrays under Variable Insolation and Temperature Conditions. In Proceeding of the 43th International Universities Power Engineering Conference, Sydney, Australia, 1–4 September 2008; pp. 1–5.
- Masoum, M.A.S.; Dehbonei, H.; Fuchs, E.F. Theoretical and Experimental Analyses of Photovoltaic Systems with Voltage and Current-Based Maximum Power-Point Tracking. IEEE Trans. Energy Convers. 2002, 17, 514–522. [Google Scholar] [CrossRef]
- Esram, T.T.; Chapman, P.L. Comparison of Photovoltaic Array Maximum Power Point Tracking Techniques. IEEE Trans. Energy Convers. 2007, 22, 439–449. [Google Scholar] [CrossRef]
- Femia, N.; Granozio, D.; Petrone, G.; Spagnuolo, G.; Vitelli, M. Predictive and Adaptive MPPT Perturb and Observe Method. IEEE Trans. Aerosp. Electron. Syst. 2007, 43, 934–950. [Google Scholar] [CrossRef]
- Liu, F.; Duan, S.; Liu, B.; Kang, Y. A Variable Step Size INC MPPT Method for PV Systems. IEEE Trans. Ind. Electron. 2008, 55, 2622–2628. [Google Scholar]
- Chao, K.H.; Lee, Y.H. A Maximum Power Point Tracker with Automatic Step Size Tuning Scheme for Photovoltaic Systems. Int. J. Photoenergy 2012, 2012, 1–10. [Google Scholar] [CrossRef]
- Ramaprabha, R. Maximum Power Point Tracking using GA-Optimized Artificial Neural Network for Solar PV System. In Proceeding of the 1st International Electrical Energy Systems Conference, Newport Beach, CA, USA, 3–5 January 2011; pp. 264–268.
- Besheer, A.H. Ant Colony System Based PI Maximum Power Point Tracking for Stand Alone Photovoltaic System. In Proceeding of the IEEE International Industrial Technology Conference, Athens, Greece, 19–21 March 2012; pp. 693–698.
- Adly, M. An Optimized Fuzzy Maximum Power Point Tracker for Stand Alone Photovoltaic Systems: Ant Colony Approach. In Proceeding of the 7th IEEE Industrial Electronics and Applications Conference, Singapore, 18–20 July 2012; pp. 113–119.
- Chao, K.H.; Chiu, C.L. Design and Implementation of an Intelligent Maximum Power Point Tracking Controller for Photovoltaic Systems. Int. Rev. Electr. Eng. 2012, 7, 3759–3768. [Google Scholar]
- Yau, H.T.; Wu, C.H. Comparison of Extremum-Seeking Control Techniques for Maximum Power Point Tracking in Photovoltaic Systems. Energies 2011, 4, 2180–2195. [Google Scholar] [CrossRef]
- Zazo, H.; Del Castillo, E.; Reynaud, J.F.; Leyva, R. MPPT for Photovoltaic Modules via Newton-Like Extremum Seeking Control. Energies 2012, 5, 2653–2666. [Google Scholar] [CrossRef]
- Chen, L.R.; Tsai, C.H.; Lin, Y.L.; Lai, Y.S. A Biological Swarm Chasing Algorithm for Tracking the PV Maximum Power Point. IEEE Trans. Energy Convers. 2010, 25, 484–493. [Google Scholar] [CrossRef]
- Miyatake, M.; Veerachary, M.; Toriumi, F.; Fujii, N.; Ko, H. Maximum Power Point Tracking of Multiple Photovoltaic Arrays: A PSO Approach. IEEE Trans. Aerosp. Electron. Syst. 2011, 47, 367–380. [Google Scholar] [CrossRef]
- Chao, K.H.; Chen, J.P. A Maximum Power Point Tracking Method Based on Particle Swarm Optimization for Photovoltaic Module Arrays with Shadows. ICIC Exp. Lett. 2014, 8, 697–702. [Google Scholar]
- Ishaque, K.; Salam, Z.; Amjad, M.; Mekhilef, S. An Improved Particle Swarm Optimization (PSO)-Based MPPT for PV with Reduced Steady-State Oscillation. IEEE Trans. Power Electron. 2012, 27, 3627–3638. [Google Scholar] [CrossRef]
- Liu, Y.H.; Huang, S.C.; Huang, J.W.; Liang, W.C. A Particle Swarm Optimization-Based Maximum Power Point Tracking Algorithm for PV Systems Operating Under Partially Shaded Conditions. IEEE Trans. Energy Convers. 2012, 27, 1027–1035. [Google Scholar] [CrossRef]
- SANYO HIP 2717 Datasheet. Available online: http://iris.nyit.edu/~mbertome/solardecathlon/SDClerical/SD_DESIGN+DEVELOPMENT/091804_Sanyo190HITBrochure.pdf (accessed on 27 February 2015).
- Tang, K.H.; Chao, K.H.; Chao, Y.W.; Chen, J.P. Design and Implementation of a Simulator for Photovoltaic Modules. Int. J. Photoenergy 2012, 2012. [Google Scholar] [CrossRef]
- PSpice Official Website. Available online: http://www.cadence.com/products/orcad/pspice_simulation/pages/default.aspx (accessed on 27 February 2015).
- Kennedy, J.; Eberhart, R. Particle Swarm Optimization. In Proceeding of the IEEE International Conference on Neural Networks, Perth, Australia, 27 November–1 December 1995; pp. 1942–1948.
- Hart, D.W. Introduction to Power Electronics; Prentice Hall: New York, NY, USA, 2003. [Google Scholar]
- EKO Instruments Co. Ltd. official website. Available online: http://www.environmental-expert.com/products/model-mp-170-iv-checker-80092 (accessed on 27 February 2015).
© 2015 by the author; licensee MDPI, Basel, Switzerland. This article is an open access article distributed under the terms and conditions of the Creative Commons Attribution license (http://creativecommons.org/licenses/by/4.0/).