Abstract
Considering the geographical location and climatic conditions of Iran, solar energy can provide a considerable portion of the energy demand for the country. This study develops a two-step framework. In the first step, the map of unsuitable regions is extracted based on the defined constraints. In the next step, in order to identify the suitability of different regions, 11 defined criteria, including solar radiation, average annual temperatures, distance from power transmission lines, distance from major roads, distance from residential area, elevation, slope, land use, average annual cloudy days, average annual humidity and average annual dusty days, are identified. The relative weights of defined criteria and sub-criteria are also determined applying fuzzy analytical hierarchy process (FAHP) technique. Next, by overlaying these criteria layers, the final map of prioritization of different regions of Iran for exploiting solar photovoltaic (PV) plants is developed. Based on Iran’s political divisions, investigation and analysis of the results have been presented for a total of 1057 districts of the country, where each district stands in one of the five defined classes of excellent, good, fair, low, and poor level. The obtained data indicate that 14.7% (237,920 km2), 17.2% (278,270 km2), 19.2% (311,767 km2), 11.3% (183,057 km2), 1.8% (30,549 km2) and 35.8% (580,264 km2) of Iran’s area are positioned as excellent, good, fair, low, poor and unsuitable areas, respectively. Moreover, Kerman, Yazd, Fars, Sisitan and Baluchestan, Southern Khorasan and Isfahan are included in the regions as the most excellent suitable provinces for exploiting solar PV plants.
1. Introduction
Nowadays, challenges such as limitation of fossil fuels, environmental pollution, importance of energy-mix diversification, and possibility of earning more value from fossil resources have encouraged governments all over the world to promote the renewable energy share in their energy portfolios.
The representatives of 195 countries in the 21st conference of the countries committed to climate change convention in Paris climate conference (COP21) in December 2015 reached a legal and binding agreement for determining the environmental situation of the earth. In this conference, development in the consumption of fossil fuels such as oil and gas was considered to be the main reason for the emission of greenhouse gases and global warming. Based on the final COP21 statement, world’s countries have committed themselves to maintain increase in the Earth’s temperature to be lower than 2 °C. Moreover, the countries should try to keep it under 1.5 °C [1].
Iran, with an annual production of 850 million tons of greenhouse gases, is one of the 10 major countries in the world in terms of GHG production. According to the commitments necessitated in COP21, Iran will try to reduce about 190 million tons of the volume of its greenhouse gases in the next 15 years, i.e., by 2030. Achieving this legally binding commitment by exploiting renewable energies as a suitable solution has been the agenda of energy planners and policymakers [2].
Iran, as one of the wealthiest countries in the world, not only holds considerable amount of fossil sources, but also has great potential of renewable energy sources. Nonetheless, based on the current circumstances of energy mix and the intensity of energy consumption, sole reliance on the oil and natural gas is a strategic fault that may result in irreparable issues in the future.
Solar energy is one of the best and most economical types of renewable energies in Iran. It will not only lead to a reduction in most of the human concerns such as environmental pollution, new emerging diseases and termination of fossil resources, but also considering Iran’s climatic conditions, it can be well developed in Iran. Generally, Concentrating Solar thermal Power (CSP) and photovoltaics (PV) are the two major technologies for exploiting solar energy. According to studies in an area of 2000 km2, there is the possibility of installing 60 GW of solar thermal power plant in Iran. In recent years, the utilization of solar energy systems is developing because of its simplicity, easy transport, high reliability, absence of mechanical parts, compatibility with the environment as well as no need for fuel [3].
Identifying suitable locations for the construction of solar farms, as with any other engineering project, requires detailed information and accurate planning. In the process of exploiting solar energy, alongside the necessity of existence of solar insolation potential in the region, the vital point is investigating different places considering various technical, socioeconomic, and environmental criteria. Geographic Information System (GIS) is considered as a very useful and practical tool capable of developing a database which can act as the departure point for guiding any decision support system (DSS) [4].
In this study, the criteria defined using literature and expert opinions have been classified into four categories: climatology, environment, location, and meteorology. Considering the necessity of taking economic, technical, social, and environmental constraints into account in solar site selection, this study develops a two-step framework.
In the first step, the map of unsuitable regions is prepared based on the related constraints such as urban lands, cultural heritage, watercourses, wildlife, conservation areas, national parks, etc. In the next step, in order to identify the suitability of different regions remaining, 11 criteria, including solar insolation, average annual temperatures, distance from power transmission lines, distance from major roads, distance from residential area, elevation (altitude above sea level), slope, land use, average annual cloudy days, average annual humidity and average annual dusty days are identified. The relative weights of these criteria and sub-criteria are also determined utilizing Fuzzy Analytical Hierarchy Process (FAHP) technique. Next, by overlaying these criteria layers, the final map of suitability of different regions of Iran for exploiting solar PV plants is developed. Investigation and analysis of the results will be presented for 1057 districts of the country according to Iran’s political divisions. Finally, each district stands in one of the five defined classes of excellent, good, fair, low, and poor level.
This paper has been organized as follows: Section 2 reviews the literature of solar site selection. Section 3 overviews the Iran’s current status and outlook of energy sector. Section 4 describes the proposed framework. We present the results and discussion in Section 5. Finally, the conclusion is given in Section 6.
2. Literature Review
Because of various issues and characteristics of utilized energy resources in electricity generation industry, a multi-lateral survey is needed for comprehensive evaluation. Hence, multi-criteria decision analysis (MCDA) techniques have become increasingly prominent in sustainable energy planning to handle the conflicts of decision makers’ opinions and the complication of criteria [5]. A review of the literature shows that several studies in different fields such as energy management, renewable energies planning, energy resource allocation, etc. have applied various multi attribute decision making (MADM) techniques [6]. A model to rank various renewable and non-renewable electricity production technologies was proposed by Stein by utilizing the analytic hierarchy process (AHP) based on four comprehensive criteria: financial, technical, environmental and socio-economic-political [7]. In order to evaluate the energy alternatives and create a roadmap of energy strategies for Turkey, Erdogan et al. [8] proposed a hybrid MCDM methodology that included AHP and TOPSIS based on type-2 fuzzy sets.
With regard to surveying potential sites for exploiting renewable energies in Iran, several studies have been carried out. Alamdari et al. [9] examined the feasibility of exploiting solar energy for different regions of Iran based on information obtained from 63 weather stations and application of radiation maps in GIS. Based on the results, the greatest radiation is related to central and southern regions of Iran except for the southern coastal regions. Existence of a radiation of 500 W/m2 indicates the good potential of these regions for exploiting photovoltaic systems.
The current status and prospect of exploiting solar energy in Iran have been dealt with in [3]. Considering the area of and having 300 sunny days in Iran along with the mean radiation of 2200 kWh/m2, there are suitable conditions for the expansion of solar energy industry in Iran. Currently, solar energy units in Iran are established in Shiraz, Semnan, Taleghan, Yazd, Tehran, and Khorasan.
A GIS-based integrated framework for determining the best size and location related to PV plants is presented utilizing mathematical optimization and simulation besides considering the criteria such as solar radiation, slope, elevation, and aspect. Kucuksari et al. determined the candidate places and thereafter, via mathematical modeling, presented long-term expansion plan of this technology. Moreover, based on simulation, the voltage profile related to a distribution network is investigated [10].
In order to identify the best location for the exploitation of wind farms, Sánchez-Lozano et al. [11] proposed an integrated model based on GIS and fuzzy Multi-Criteria Decision Making (MCDM) technique. They utilized Fuzzy Analytic Hierarchy Process (FAHP) to determine the relative importance of the criteria, and GIS was also applied to generate the database of the alternatives.
Because of site selection of large ground-mounted PV plants, a GIS based model to identify the suitable areas for the installation of photovoltaic systems in Piedmont region, Italy was proposed by Borgogno Mondino et al. [12]. Several criteria including qualitative and quantitative criteria were considered and Artificial Neural Network (ANN) was applied for the aggregation of the quantitative criteria.
Prioritization of different regions for exploiting solar energy in Konya Province in Turkey has been evaluated based on environmental and economic factors by [13]. In this study, for the environmental criteria, three sub-criteria, distance from residential areas, land use, and distance from roads, have been defined. Similarly, considering economic factors, the sub-criteria of slope and distance from transmission lines have been considered. Using AHP method, the priority of each criterion is defined and based on the obtained relative importance weights, digitized layers are overlaid and the suitable regions for the utilization of solar energy have been determined.
In order to locate solar farms in the south of Spain, Sánnchez-Lozano et al. [14] determines prioritization of the candidate places via ELECTRE-TRI technique based on defined criteria and utilizing the GIS software. The evaluations have been carried out based on four criteria including environmental, location, climatology and orography.
In order to determine the best location for placement of solar thermoelectric installments, GIS and AHP were utilized for determining the weights of criteria. Thereafter, evaluation and prioritization of 10 candidate regions was carried out by fuzzy TOPSIS [15].
By utilizing spatial multi-criteria evaluation and fuzzy sets theory, Charabi and Gastli [16] evaluate the suitability of large farmlands for different PV technologies in Oman by taking nine technical, economical, and environmental criteria into consideration for evaluating the regions of interest. The results indicated that 0.5% of the total lands in Oman have a high suitability level for installing photovoltaic plants.
A new assessment framework based on GIS was developed in [17] to characterize PV deployment in the UK. They investigated the temporal and spatial expansion trends for various PV market sections, including domestic and non-domestic rooftop and grid connected solar farms. The obtained results revealed the strong correlation between expansion of PV technology and level of policy support.
To investigate the performance of solar farms, a hybrid framework model based on DEMATEL, DANP and GIS is proposed by Chen et al. [18]. They considered four dimensions, including environment, orography, location and climatology, as well as ten criteria. Based on their results, the orography dimension (slope, orientation and area) in solar energy industry should improve first for enhancing the performance of solar farms.
The potential of solar insolation in Iran and the extraction of the solar radiation maps for various modes so as to implement PV and CSP technology was examined by [19]. Then, feasibility study for the construction of a 5 MW photovoltaic plant in 50 cities of Iran was carried out, where, according to the obtained results, central and southern regions of Iran have the greatest priority. Because of solar site selection in Isfahan, Iran and based on GIS and multiple criteria decision making, the most suitable areas for the exploitation of solar energy, such as Borkhar, Nain, Shahin Shahr and Meimeh, were identified [20].
In order to assess the potential of European regions for solar power generation, Castillo et al. using multi-criteria decision making and GIS, took into consideration criteria such as solar radiation, elevation, aspect, slope, land use, population distribution, and proximity to the power transmission line to prioritize various regions and extract the suitability map for PV power plants. The results obtained revealed that there is no correlation among the EU investment and the suitability in solar energy [21].
In order to investigate the various energy generation scenarios in the province of Frosinone, Massimo et al. developed and experimented a model based on Geographical Information Database System (GIS DB) due to new distributed generation technologies. Their detailed examination is done for solar energy based on the availability of land use to estimate the appropriate potential, the amount of residential electricity consumptions and the integration of renewable energy sources [22].
Potential solar assessment for concentrating solar power (CSP) and on-grid PV technology was studied by [23]; using satellite-derived data and GIS based approach, reanalysis data and measurements were combined for solar mapping and finally the potential maps of Vietnam were generated.
Appropriate use of solar energy involves the identification of regions with high potential for utilizing this energy. Although most regions in Iran have good potential for solar energy, identifying the areas with suitable condition can increase the efficiency of electricity generation.
3. Iran’s Status and Outlook of Energy Sector
Iran, with an area of 1,640,195 km2 and 79 million inhabitants, is situated in latitude 35°44′ N and longitude 51°30′ E. Based on the political division, Iran has 31 provinces, 429 counties, 1057 districts, and 2589 rural districts [24]. Iran is the 18th largest country in the world where over half of the country’s area consists of mountains and altitudes, one fourth is plains, and less than one fourth of it consists of lands under cultivation. In terms of climate, Iran is one of the most unique countries. The temperature difference in winter between the warmest and coldest points sometimes reaches more than 50 °C. The hottest points of the earth in 2004 and 2005 were measured in Loot desert in Iran [9].
Due to increase in population growth, social welfare and low energy prices, power consumption in Iran is inefficient and is rapidly increasing. The ultimate demand of 301 million tons of oil equivalent energy (twice the current demand) in 2035 is predicted for Iran [25].
In 2013–2014, the total electric energy generated by Iran’s power plants amounted to 263 GWh with 3.1% growth compared with the previous year. This amount was supplied by power plants in the Ministry of Energy, large industries and the non-governmental sector as follows: 25 steam power plants, 78 gas turbine power plants including 18 DG units (CHP-DG), 18 combined cycle power plants, 46 diesel power plants, 48 hydro power plants (large, medium, small and mini), 182 wind turbines, four photovoltaic units and three biogas power plants. Note that the share of thermal plants was 92.6%, hydro plants reached 5.5% and renewable and nuclear plants was about 1.9% [26]. Based on the Five-Year Socio-Economic and Cultural Development Plan, some focal points of electric power industry are promotion of the renewable energy share, reduction of loss, improvement of power plant efficiency and load management, all of which have been put on the agenda of power industry [25].
Considering the position of Iran in the world’s dry and desert regions, existence of climate diversity in Iran and solar radiation in majority of the regions and in the majority of seasons have provided a suitable and necessary context for utilizing and developing solar energy; such that using 1% of the entire area of the country, it is possible to generate nine million megawatt hours of energy per day. The overall potential of solar energy and energy generation in Iran is 14.7 TWe [3].
The potential of solar radiation in Iran is much more than that in Germany, one of the leading countries in solar energy [27]. Therefore, with such potential, the negligible share of solar energy in the Iran’s energy mix looks irrational; thus, giving attention to the development of this industry is necessary.
4. The Proposed Framework
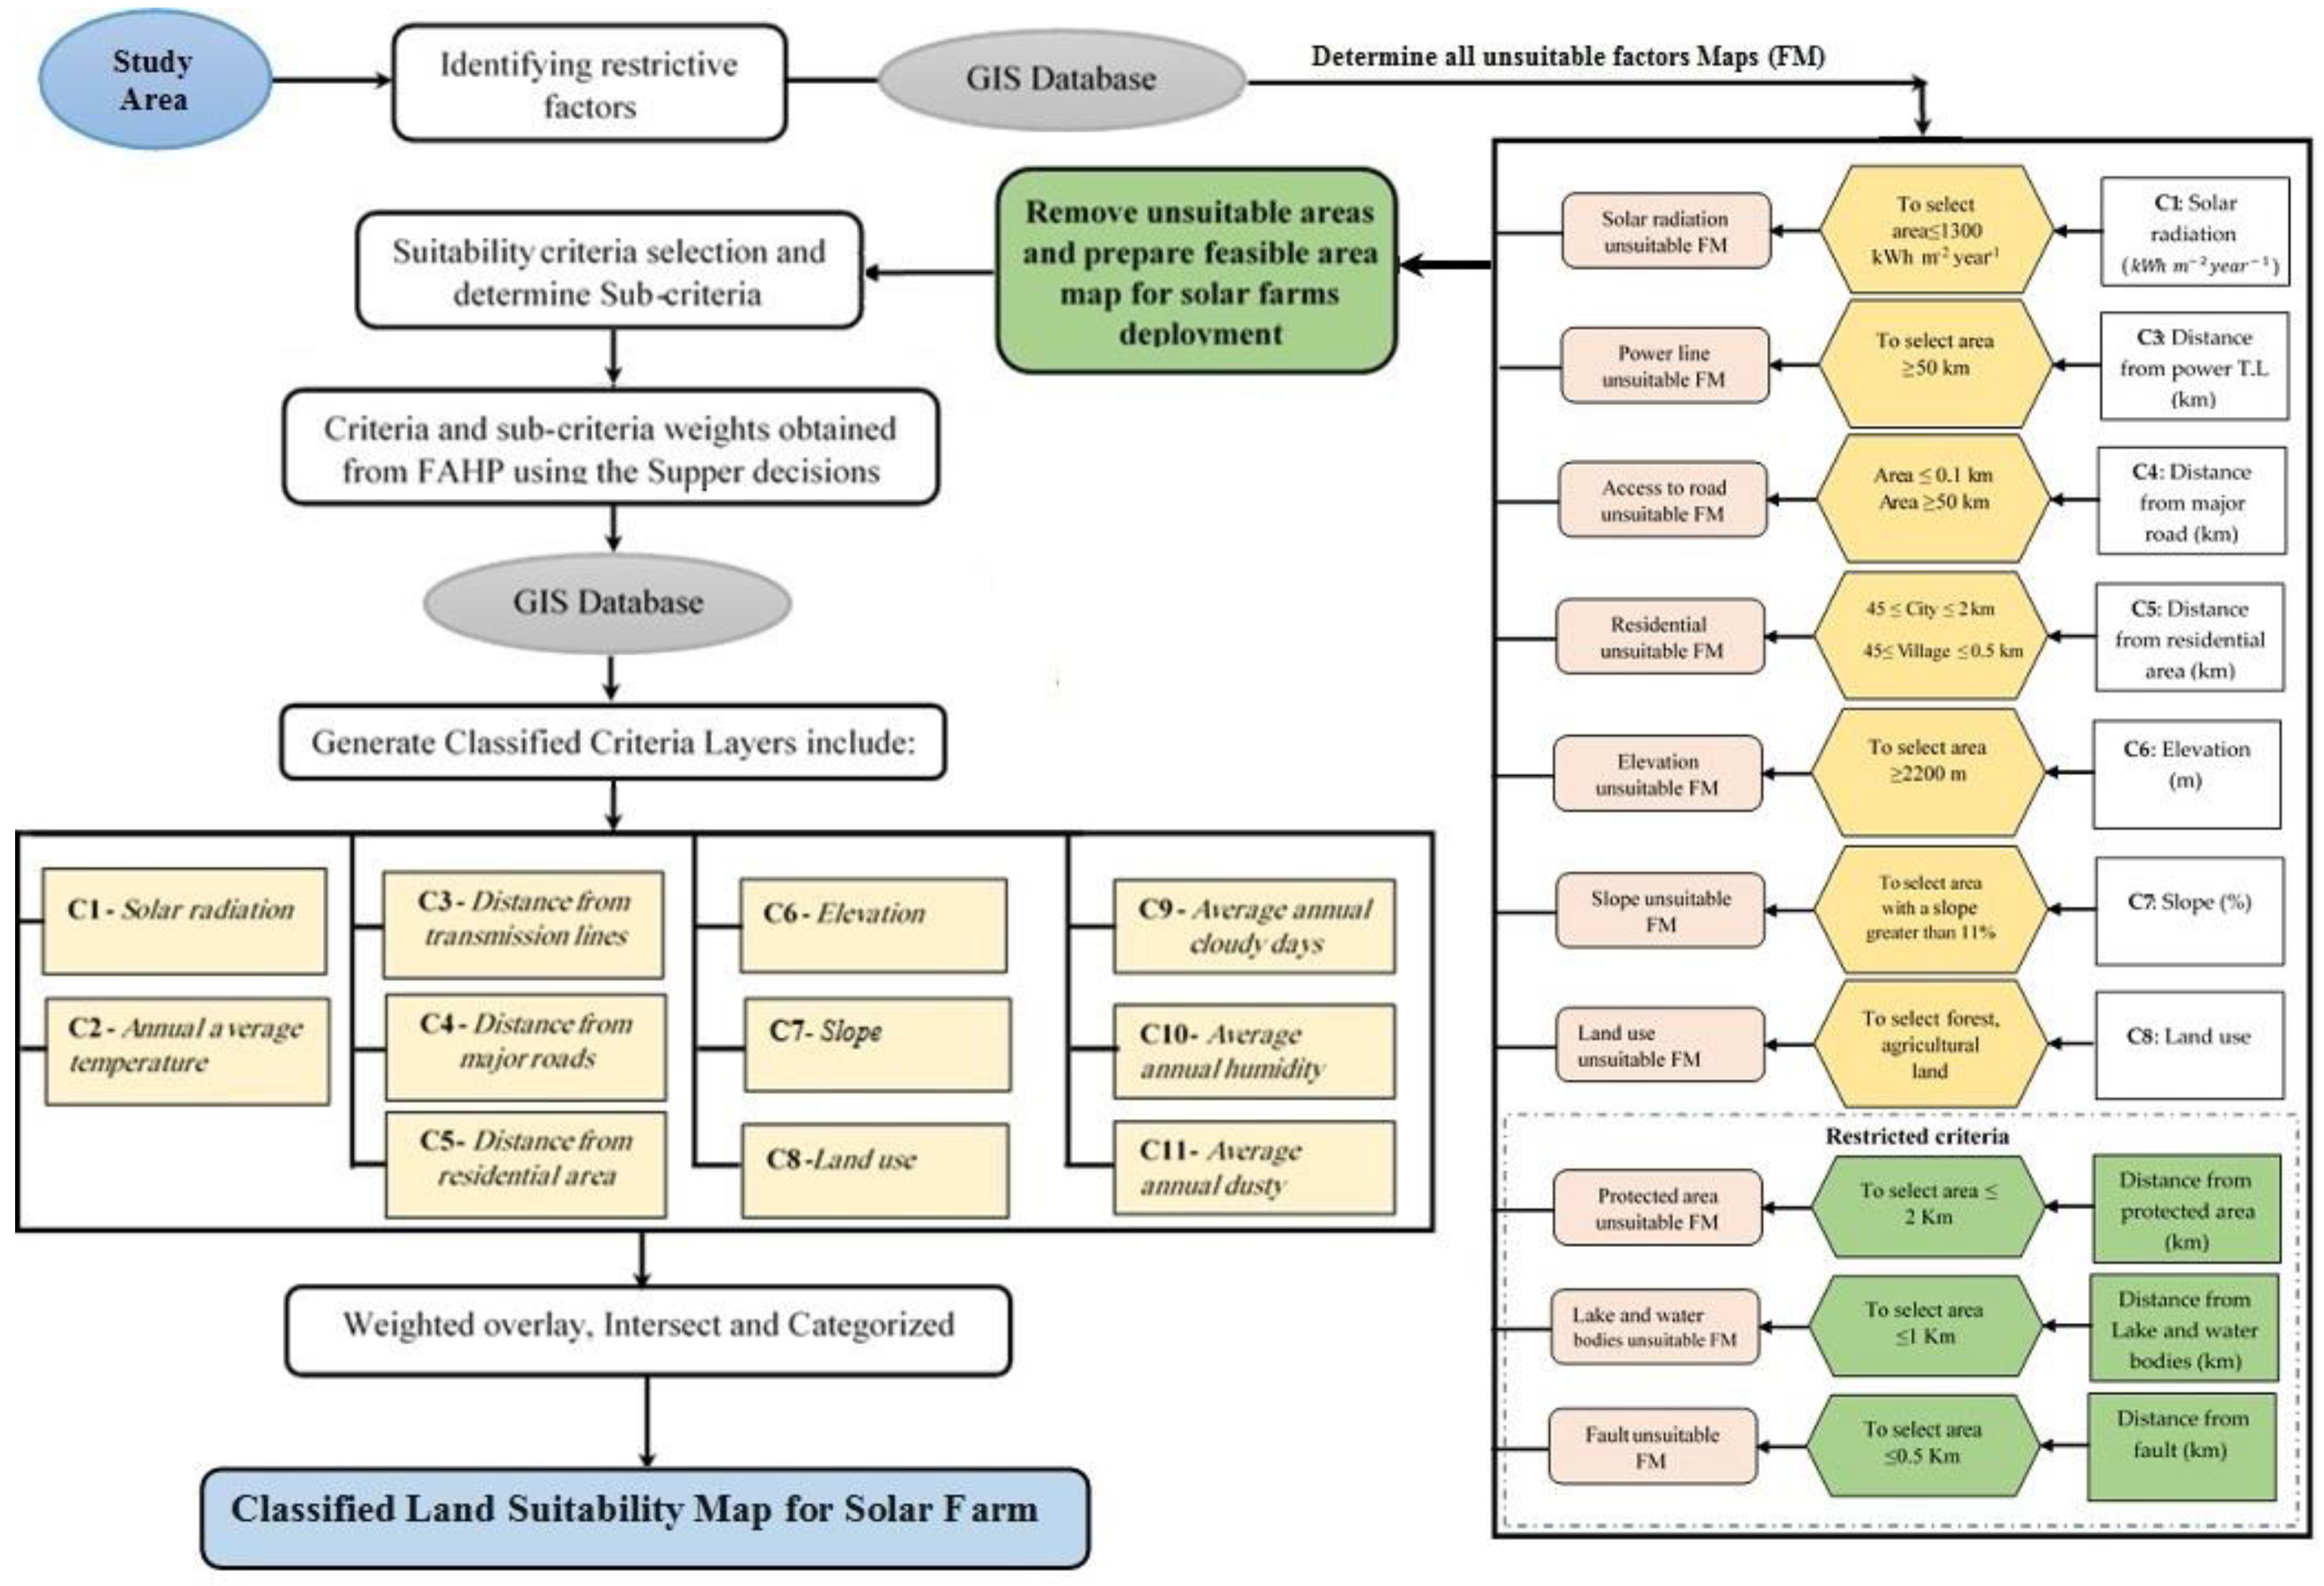
In this study, in order to identify the suitable regions for exploiting solar energy in Iran, GIS with multi-criteria decision-making approach was utilized. In this study, based on Iran’s political divisions, the conducted investigations were performed where the territory is divided into 1057 districts (the district is similar to a district in England) and the land suitability index (LSI) of each district is determined. In summary, the proposed methodology includes the following stages:
- √
- Establishment of a team consisting of academic, governmental, and industrial experts who will take part in the process of identifying and evaluating the criteria
- √
- Identification of the technical, economic, social, and environmental constraints for exploiting solar energy in different regions of the country for identifying the unsuitable areas
- √
- Generating the layers associated with defined constraints by GIS
- √
- Overlaying of layers in GIS with AND logic and preparation of the map of unsuitable regions in the country
- √
- Identifying and evaluating the criteria influencing the solar energy potential for land suitability analysis modeling
- √
- Determining the weight of evaluation criteria using FAHP
- √
- Preparation of the layers related to criteria layer in GIS
- √
- Overlaying of layers in GIS via Simple Additive Weight (SAW) method and preparation of the land suitability map of regions for exploiting solar energy
All digitization, conversion, and analysis of maps processes were performed by Arc GIS Desktop software. The calculations related to FAHP were carried out utilizing Super Decision software following the determination of crisp value for experts’ opinions.
4.1. Identifying the Unsuitable Area
At this stage, the aim is to investigate and perform feasibility study of different regions of the country for the implementation of solar PV plants. In order to achieve this objective, GIS is utilized. GIS is a very useful instrument that analyzes and visualizes geospatial information and can be used for guiding decision-support systems for identification of suitable spatial locations by developing a database.
In the planning process of developing solar PV plants, taking some technical, economic, social, and environmental constraints into consideration for removing inappropriate regions is necessary [28]. For instance, land is one of the main infrastructures needed for the construction of plants and this issue has gain more significance for solar plants because, on average, total land-use requirements for PV is 7.9 acres/MW [29].
In general, in order to establish a solar farm, adhering to suitable buffer considering constraints such as the following bounds is necessary. Violation of each of these conditions makes the application of the under study region practically unacceptable or uneconomical [29]:
- √
- Regions with a solar radiation lower than 1300 (kWh·m−2·year−1)
- √
- Regions with a lower distance of 2 km from protected regions such as national natural monuments, wildlife conservation areas, and national parks
- √
- Regions located closer to the minimum distance determined for the criteria of cities and populated centers (the minimum distance should be 2000 m from cities and 500 m from villages)
- √
- Land-use such as forest, agricultural lands, cannot be suitable options for the construction of solar plant
- √
- Regions with a distance more than 50 km from roads and power transmission lines
- √
- Regions with a distance less than 0.5 km from faults and 0.1 km from roads
- √
- Regions with a distance less than 1 km from rivers, lakes, wetlands, and dams
- √
- Regions with an elevation (altitude above sea level) of over 2200 m
- √
- Regions with a slope greater than 11% is considered as unsuitable area
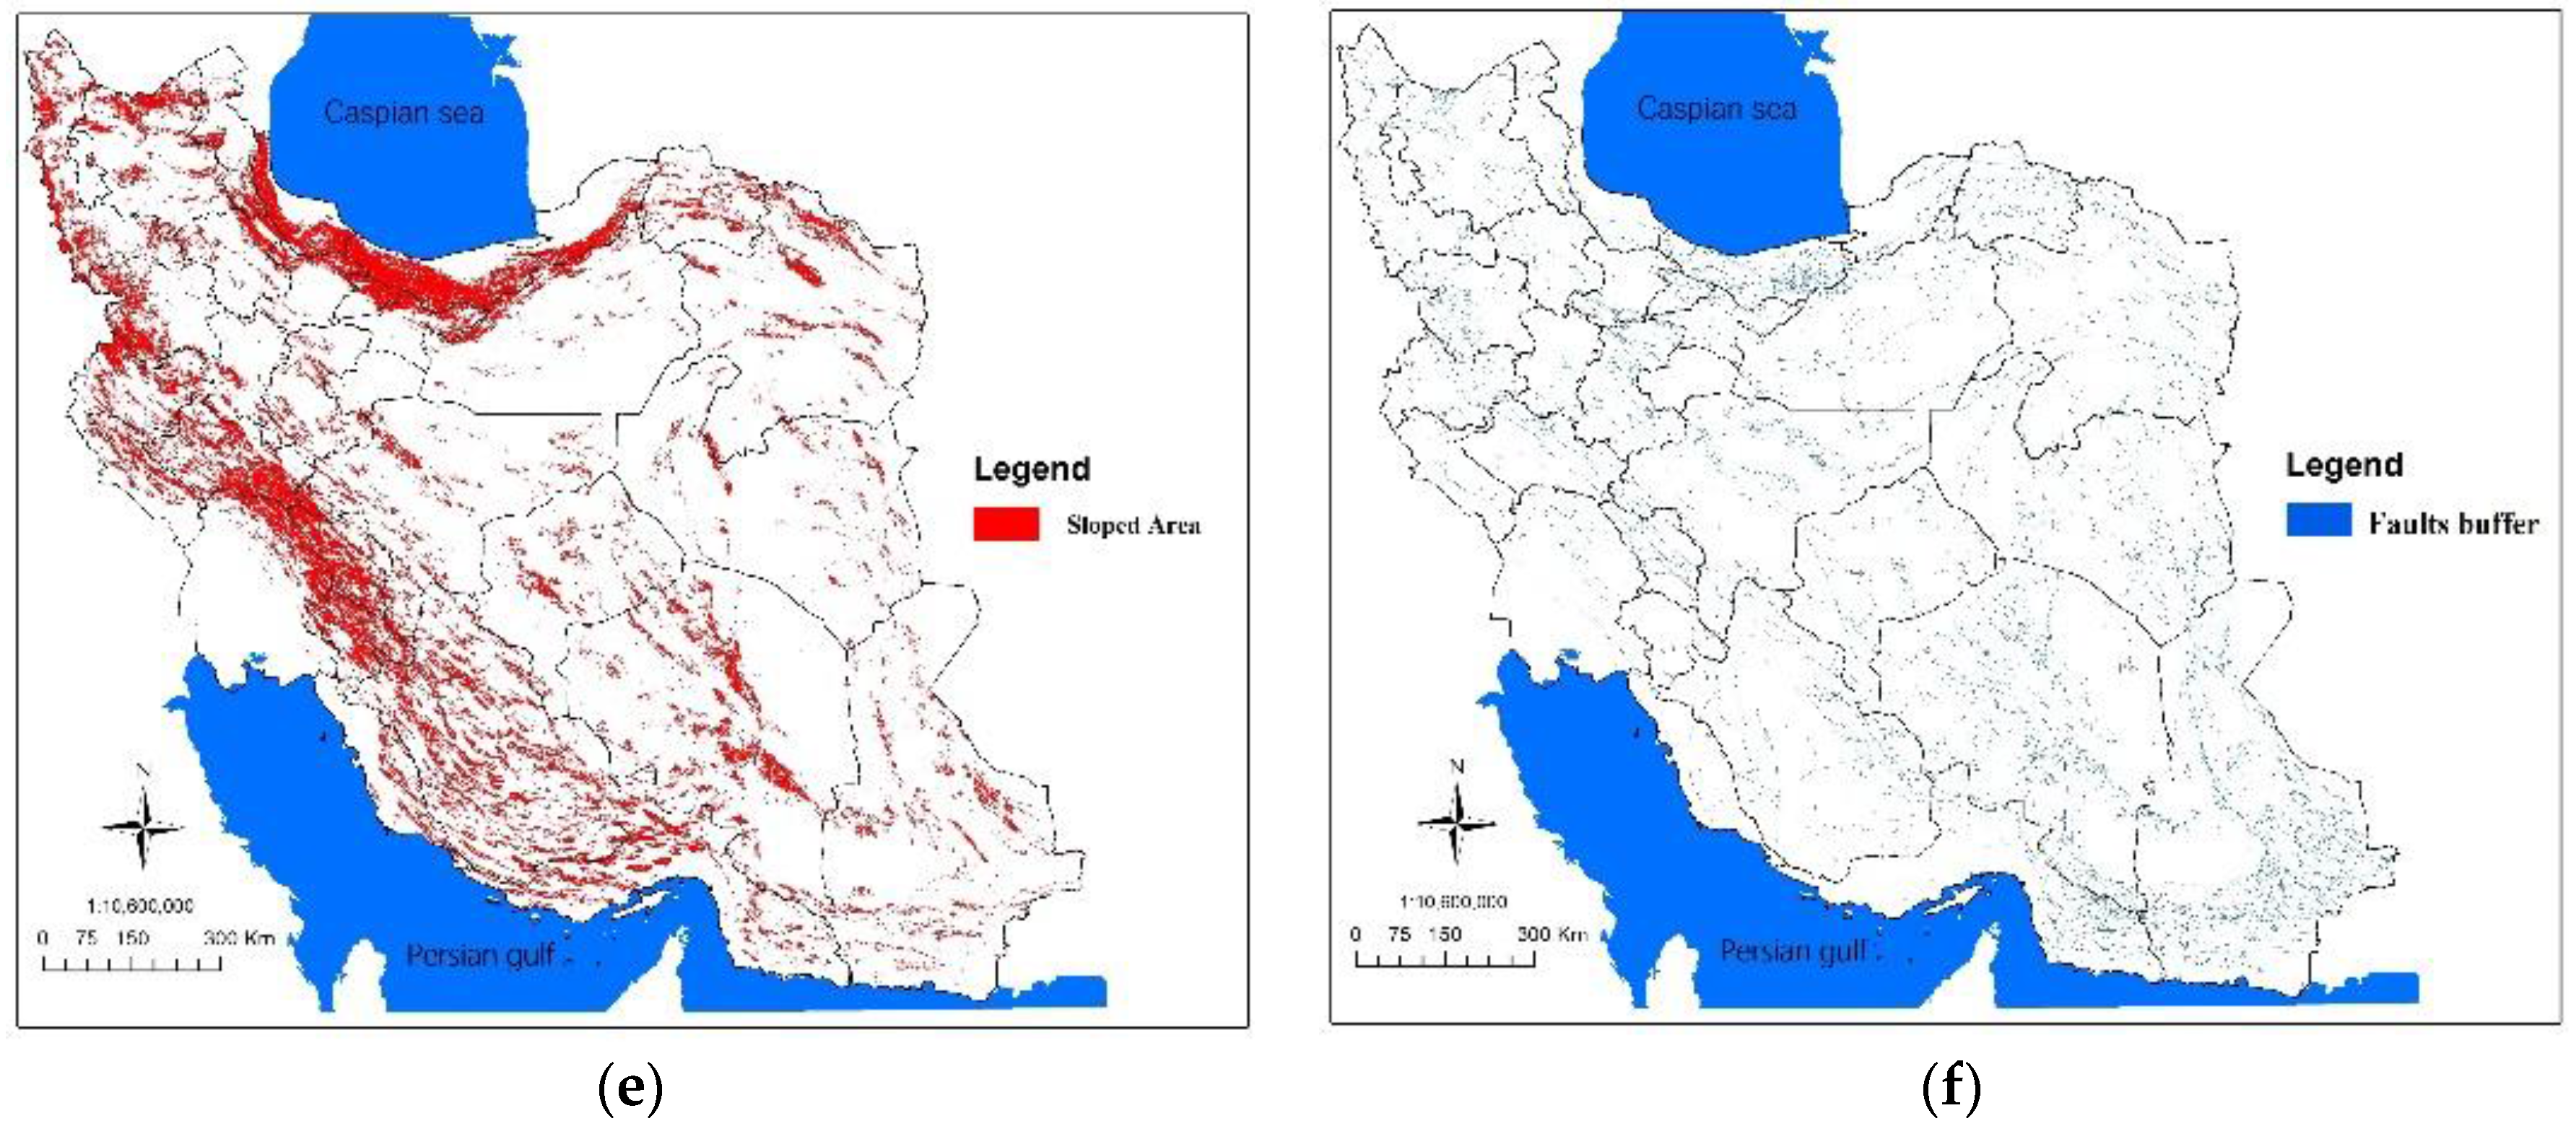
These restrictions are analyzed in GIS, and these layers are then overlaid based on AND logic. According to the results obtained from overlaying of these layers, the suitable regions for developing solar energy are identified. Some of the defined restricted layers are illustrated in Figure 1 and the final result of the combination of restricted criteria layers is presented in Figure 2.
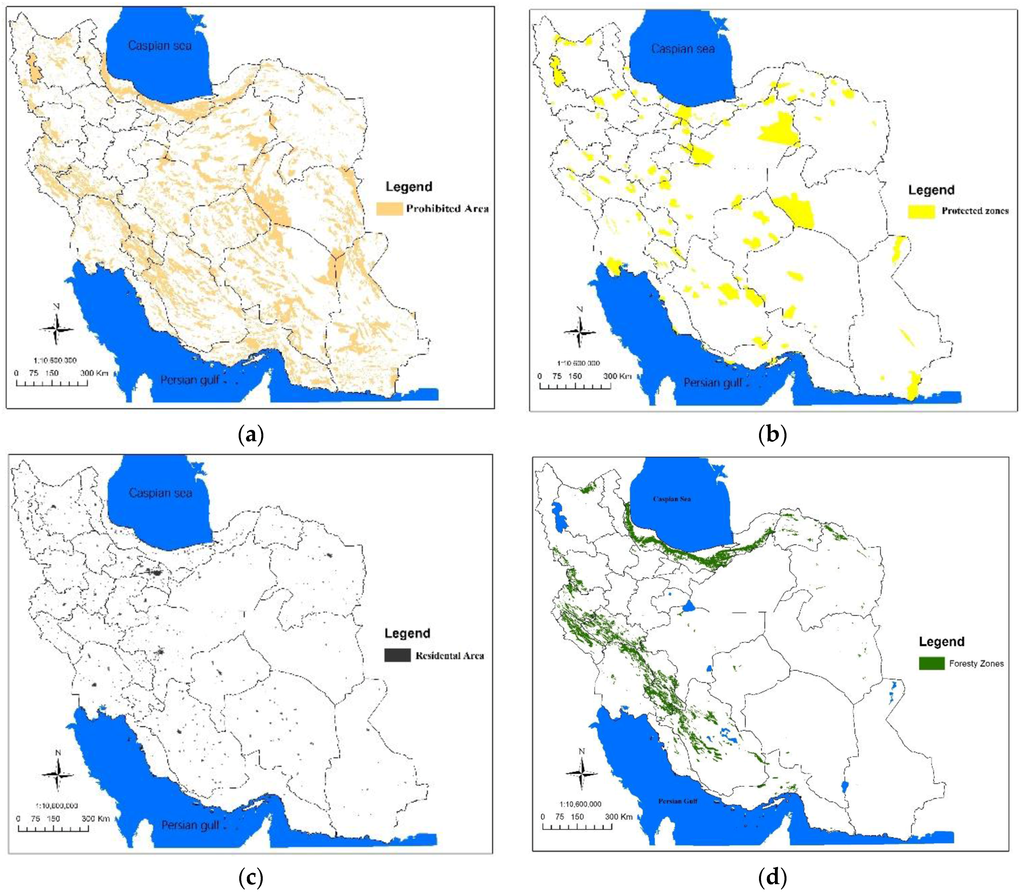

Figure 1.
Restrictive criteria layers: (a) prohibited area; (b) protected zones; (c) residential area; (d) frosty zones; (e) sloped area; and (f) faults buffer.
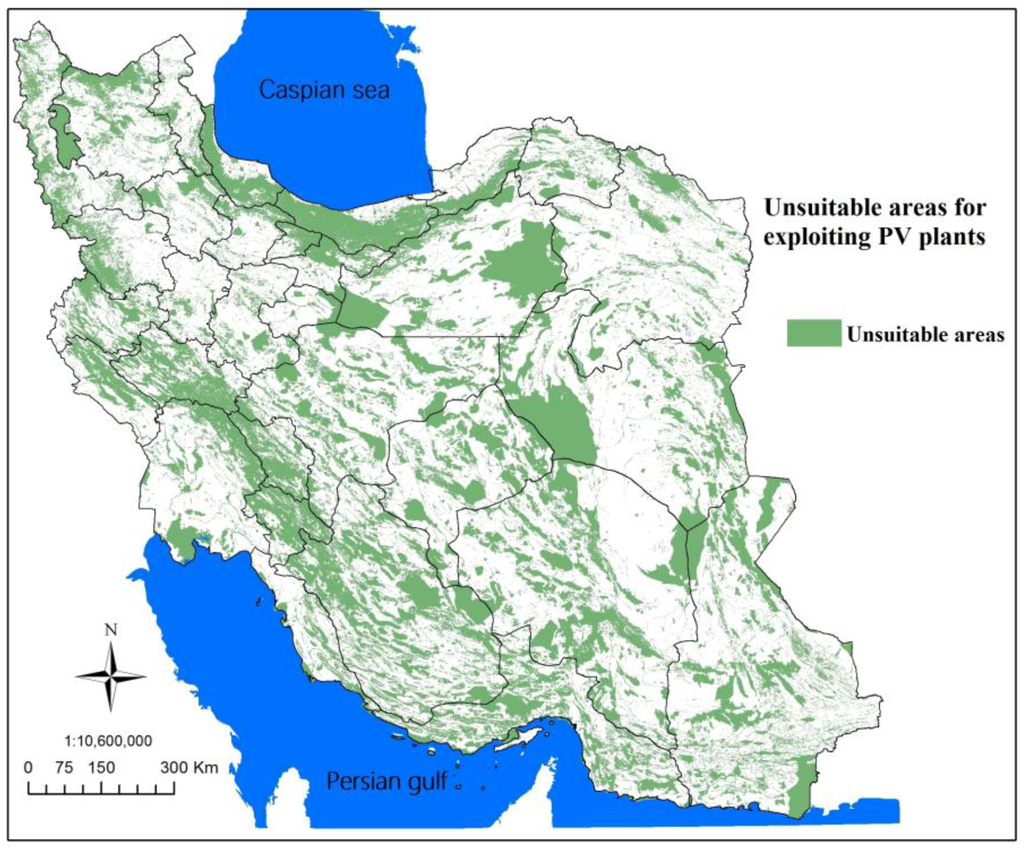
Figure 2.
Final map of unsuitable areas.
4.2. Evaluation Criteria
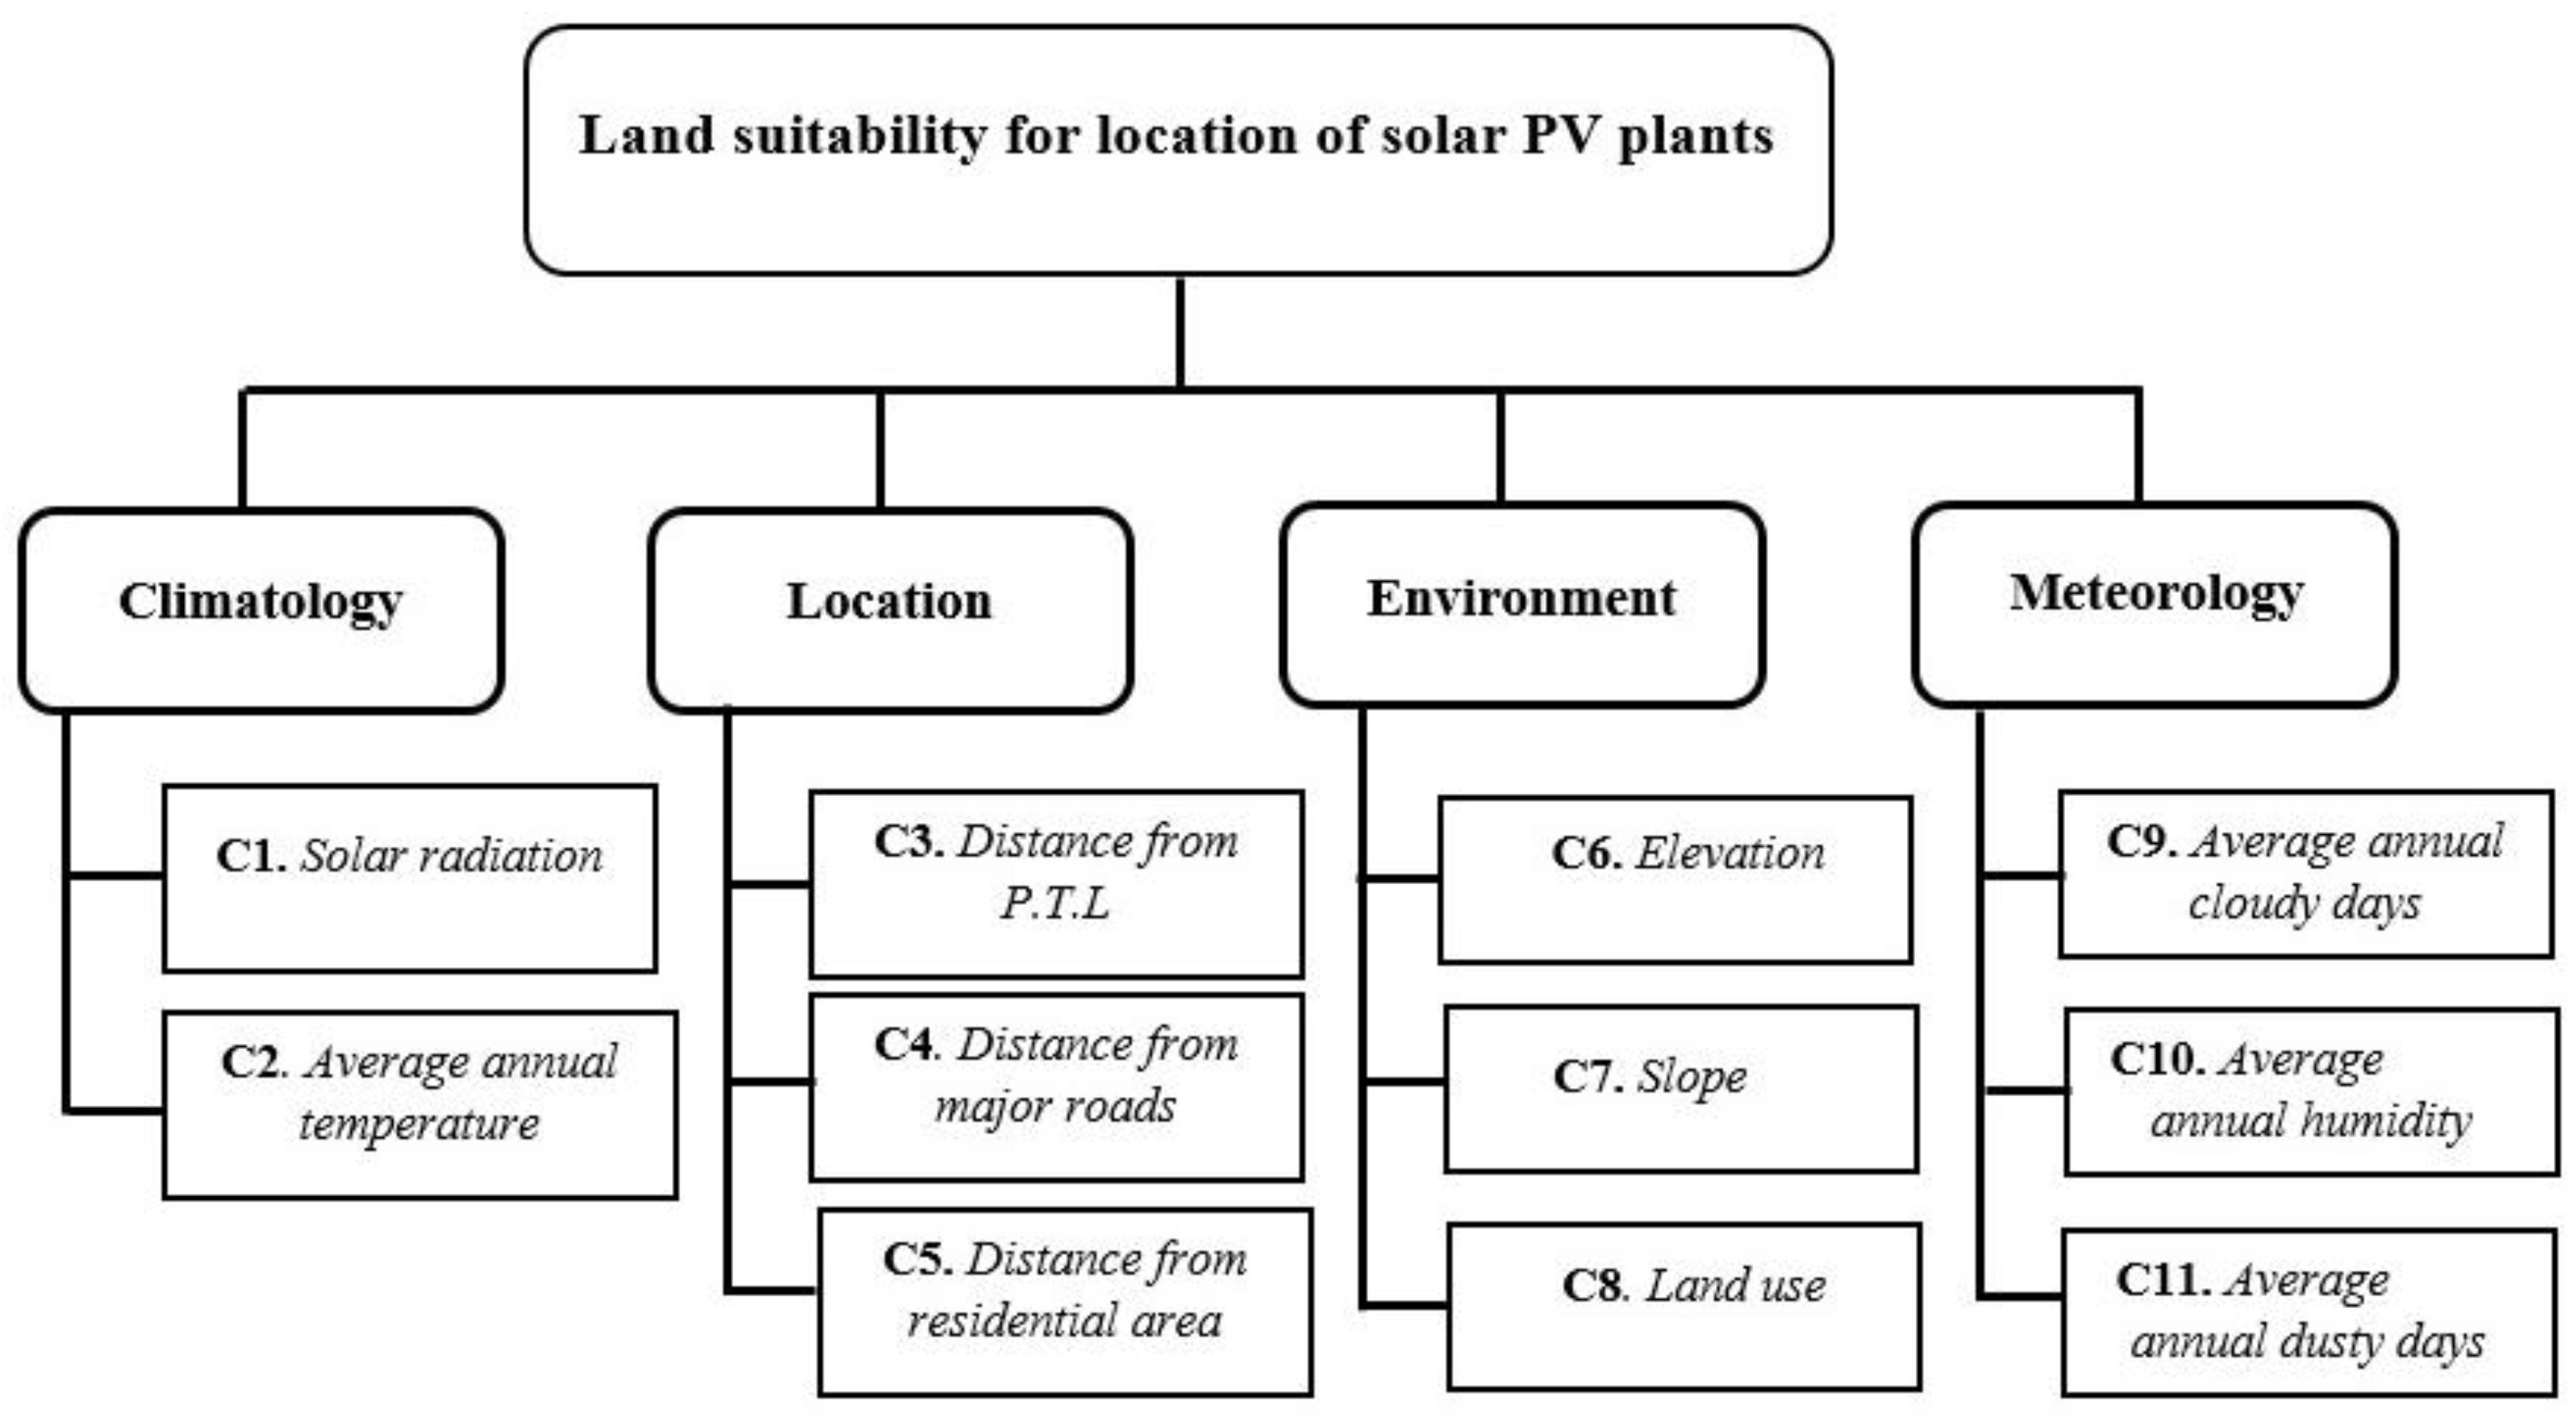
In general, site selection criteria are normally studied in the form of different groups including environmental, economic, geographical, demographic, land-use, hydrological, security, technical, etc. In this research, according to other studies and by reviewing the criteria based on positioning of solar farms through Delphi method, some questionnaires were prepared and given to four experts to respond. As many as 14 criteria were obtained through expert judgments by this method. In order to prevent further complication of the study, three criteria with the lowest score were removed and the remaining 11 criteria were classified based on the hierarchy structure shown in Figure 3. Next, some explanations are presented regarding the defined criteria.

Figure 3.
Evaluation criterion for location of solar PV plants.
4.2.1. Solar Radiation (C1)
To evaluate the optimal location to implant PV systems, solar radiation is one of the most important factors that determine whether the candidate locations will receive sufficient sunlight throughout the year. Generally, PV systems efficiency is higher in sunnier regions, as a rule of thumb, PV systems require a minimum solar radiation of 1300 kWh·m−2·year−1 (3.5 kWh·m−2·year−1) for economical operation [30], hence, in this study we remove areas with solar radiation less than 1300 kWh·m−2·year−1 as illustrated in Figure 4. In addition, a little decrease in PV system efficiency arises when solar irradiation exceed 2000 kWh·m−2·year−1, due to the negative effect of higher ambient temperatures on PV module efficiency [31].

Figure 4.
The conceptual model of the proposed framework.
4.2.2. Average Annual Temperatures (C2)
One of the components of photovoltaic systems is the solar panel. In order for the system to provide the required power, it should be properly designed. One of the issues that influence determination of the size of the required panel is its efficiency. The efficiency of solar panels depends on its temperature and the panel’s temperature itself results from the ambient temperature and the intensity of the solar radiation. The performance of the modules of PV systems declines with increase in ambient temperature. For every 1 °C rise in the cell temperature at temperatures above 25 °C, the amount of generated energy declines by about 0.4%–0.5% [32,33].
4.2.3. Distance from Power Transmission Lines (C3)
Considering the high costs associated with construction of power transmission lines, one of the important criteria in siting of solar farms is distance from transmission lines. Overall, electric power transmission lines influence the positioning of solar farms in terms of safety, network security, and quick accessibility for installing equipment and potential repairs. Studies have demonstrated that the best distance from power networks for the safety of solar farms and the network is 0–3 miles. In other words, the proximity of the location of plant construction to electric energy transmission lines is an important economical advantage [30]. In this study, regarding the extent of understudy area and also the potential of central and desert regions in Iran for utilization of solar energy in order to reduce the possibility of eliminating potential areas, the last defined level in this criterion belongs to areas with distance of 20 to 50 km from power transmission lines with a total weight of (0.012). In other words, about 90% of relative weight belonging to this criterion is allocated to regions less than 12.5 miles from transmission lines [34]. In summary, regions at a distance more than 50 km from power transmission lines has been considered as unsuitable areas for solar farms establishment, as illustrated in Figure 4.
4.2.4. Distance from Major Roads (C4)
Construction of new access roads for transportation of goods and equipment is very expensive and is one of the unavoidable factors in the construction of solar plants. Certainly, the easier is the access to the plant, the lower the cost of plant construction will be. Regarding this criterion, according to the wide range of the understudy area (1,640,195 km2) and also the availability of local roads across the country, the last level defined in this criterion belongs to areas with distance of 30 to 50 km from main access roads with total weight of (0.009). In other words, about 90% of relative weight of this criterion is allocated to areas with distance less than 18.75 miles [34]. Thus, in order to reduce the possibility of eliminating suitable areas from investigation, in this study, the maximum and minimum distance from major roads in positioning of solar farms has been considered as 50 km and 0.1 km, respectively [15].
4.2.5. Distance from Residential Areas (C5)
Due to the various unfavorable environmental impacts on the populated centers and urban growth, in this research, distance from residential areas is considered as one of the important criteria in solar PV farms site selection. Therefore, solar farms are at a distance less than 2000 m from city and 500 m from village areas must not be established. Moreover, regions at a distance more than 45 km from populated centers are considered as unsuitable areas for solar farms establishment, as illustrated in Figure 4.
4.2.6. Elevation (C6)
The thickness and the compounds of atmosphere influence the entrance of both shortwave energy of the sun and longwave energy of the earth. The lower the elevation of a region from sea level, the greater the atmosphere thickness. Thus, elevated regions enjoy a greater solar radiation potential than lower regions due to the fact that they receive a great deal of energy [35].
4.2.7. Slope (C7)
Slope is one of the highly important factors in site selection of PV farms, whose mean value in Iran is about 11%. In general, lands with a slope greater than 4% have a lower priority since panels shadow the next row and adversely affect the system efficiency [28].
4.2.8. Land Use (C8)
One concern regarding establishment of solar farms is land use as an important environmental factor for site selection. In this paper, land use was evaluated for five level as barren, rangeland, shrub, rainfed and irrigated areas. Barren areas were considered as the best areas and irrigated areas have the lowest priority for exploitation solar farms.
4.2.9. Average Annual Cloudy Days (C9)
One of the criteria used in this research is the annual average of cloudy days in the year. As the number of cloudy days has a great effect on the number of sunny hours and the performance of panels, the higher the average annual of cloudy days in a region, the lower the value of generation due to reduction of the received radiation; this value can even reach zero [36].
4.2.10. Average Annual Relative Humidity (C10)
Humidity is the amount of water present in the air. Humidity affects the irradiance level of sunlight and ingression to the solar cell enclosure. Thus, the increase in humidity is inversely related with the efficiency of solar panels [37].
4.2.11. Average Annual Dusty Days (C11)
Dust is defined as the minute solid particles less than 500 µm in diameter. Dust deposition is a function of several environmental and weather conditions that affect the efficiency of PV. This particle absorbs 15% of shortwave energy of the sun. Considering the environmental changes of the recent years and entrance of dust systems in the southern and southwestern regions of Iran, for exploiting solar energy, the regions that have the least annual average of dusty days in the year are more suitable [37].
4.3. Fuzzy Analytic Hierarchy Process (FAHP)
The analytic hierarchy process (AHP) was introduced by Saaty [38] and broadly utilized by several researches in various fields to deal with the complexity of many problems. Several researchers utilized the AHP method and presented a framework for prioritizing the alternatives [13].
AHP method does not take into account the uncertainty associated with the process. To alleviate this imperfection, several researchers have turned to use the fuzzy sets theory. The fuzzy set theory, presented by Zadeh [39], takes into consideration the vagueness, imprecision and uncertainty associated with the process.
In this research, the relative weights of defined criteria and sub-criteria will be determined utilizing FAHP technique. Thereafter, the final map of land suitability of different regions of Iran is obtained by overlaying these criteria layers based on the calculated weights.
The expert team consists of four governmental, industrial and academic experts. Experts’ judgments were gathered utilizing the prepared questionnaires. In order to use fuzzy theory, first, experts are asked to express pair wise comparisons with linguistic terms as indicated in Table 1. Thereafter, the linguistic variables were transformed into triangular fuzzy numbers.

Table 1.
Linguistic variables for the weightings.
Based on the experts’ judgments, crisp relative importance weights of the criteria can be calculated by obtained fuzzy importance weights based on the membership functions in Table 1. Aggregated triangular fuzzy numbers (TNF) are calculated by unifying the experts’ opinions with geometric mean. An aggregate triangular fuzzy number is obtained by unifying the experts’ opinions by utilizing the geometric mean method as illustrated in Equation (1):
where, is the expert t viewpoint (). We apply the center of gravity (COG) method to defuzzify the aggregate triangular fuzzy numbers as in Equation (2):
After determining the aggregated pairwise comparison matrix, priorities could be calculated as:
where, is the aggregated comparison matrix, is the eigenvector, and is the largest eigenvalue of matrix .
The consistency of results is crucial for more accurately represented judgments. Consistency of result at each step and for each expert’s opinion was calculated by consistency index (CI) and if there was any inconsistency, the expert was asked to amend the conflicting part from the survey. CI index and consistency ratio (CR) can be calculated as illustrated in Equations (4) and (5) where, n is the size of pairwise comparison matrix and RI is random index. When CR ≤ 0.1, the consistency test is passed [13].
The results of the calculated weights for defined criteria and sub criteria using FAHP technique are summarized in Table 2.
Table 2.
The calculated weights for defined criteria and sub criteria by FAHP.
4.4. Land Suitability Analysis Modeling
In this section, various information; the criteria investigated utilizing GIS as decision-support system (DSS); and, according to the criteria, restrictions, and problems of constructing solar farms, the calculated relative weights were combined and integrated with each other, followed by determination of the prioritization of 1057 districts around the Iran. A conceptual model of the proposed framework is shown in Figure 4.
The information obtained from 72 synoptic stations around the country has been utilized for the preparation of criteria layers in GIS and zoning map is also prepared for various defined criteria. The maps related to each factor were prepared and used in the form of digitized maps at the scale of 1:50,000. In addition, the map of elevation and slope has been generated based on digital elevation model of the country.
As in the majority of synoptic stations around the country, the amount of solar radiation was not measured, in this research for this criterion, the data provided by National Oceanic and Atmospheric Administration (NOAA) of the US were utilized.
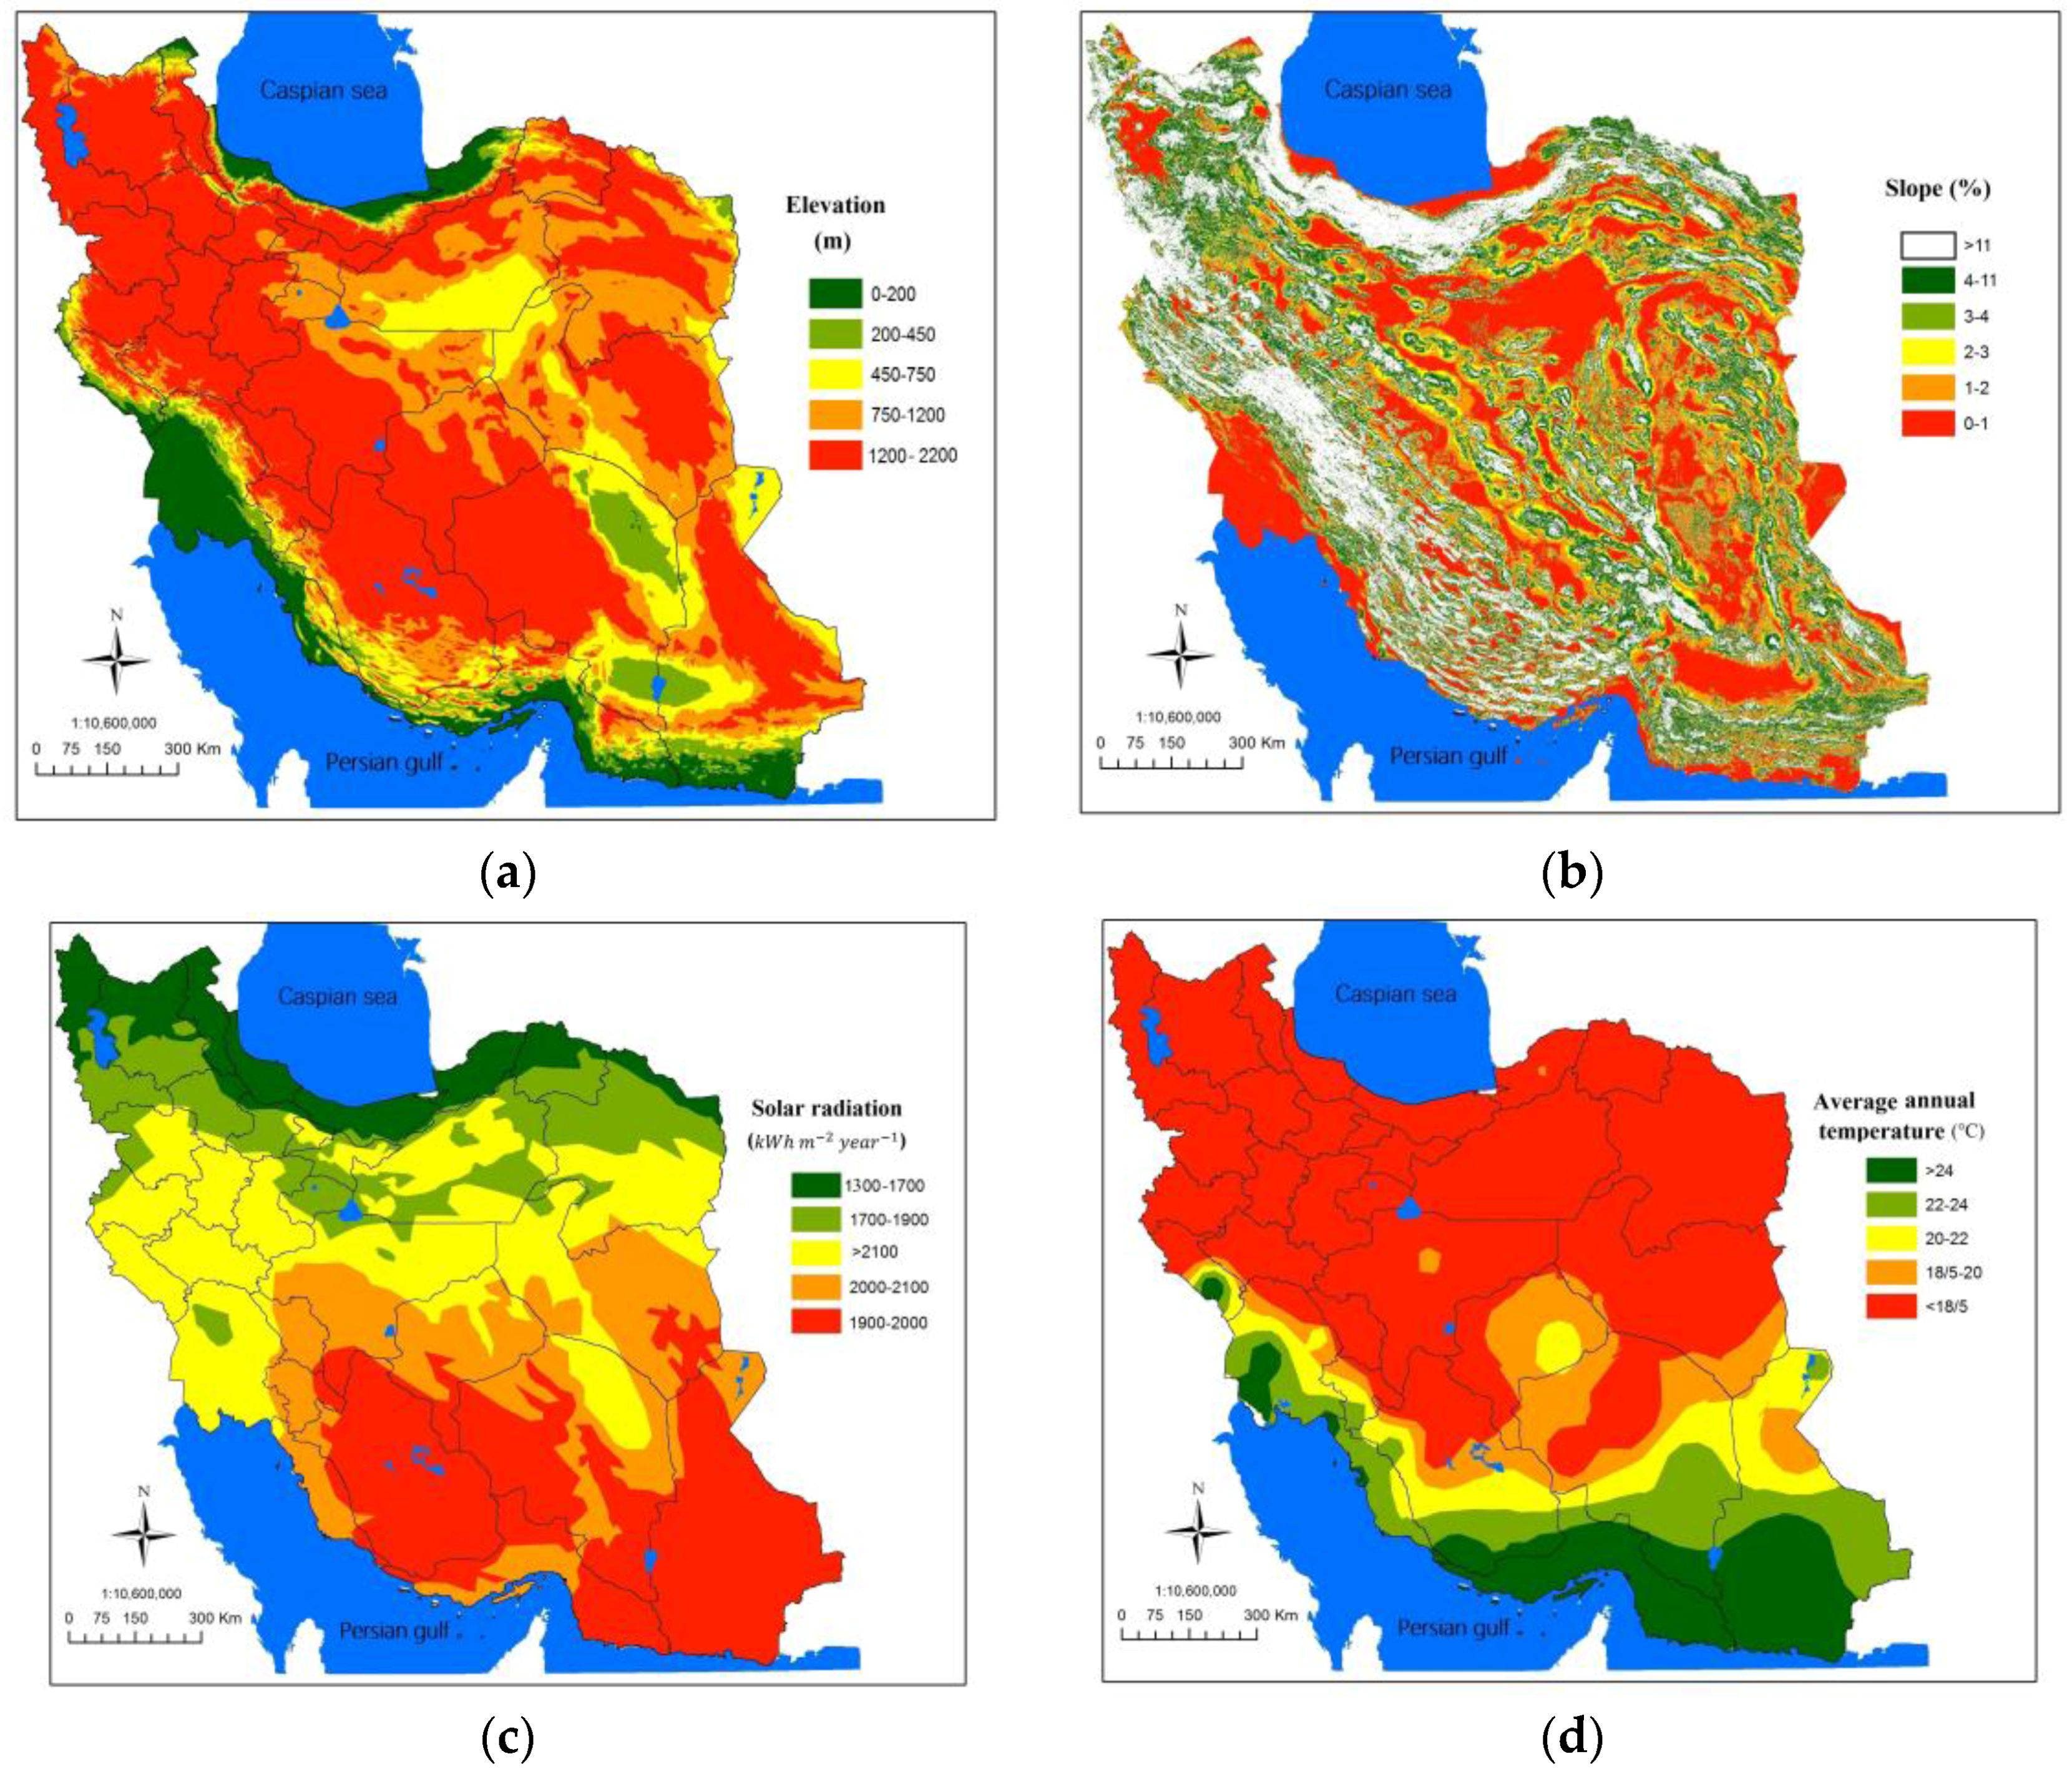
According to the criteria and sub-criteria defined in Table 2, the relevant criteria layers are prepared as illustrated in Figure 5. In order to generate the final suitability map, by overlaying these layers and selecting common sections in all the layers based on the defined classes as well as considering the restricted regions as illustrated in Figure 2, the final map related to Iran land suitability was generated as illustrated in Figure 6.

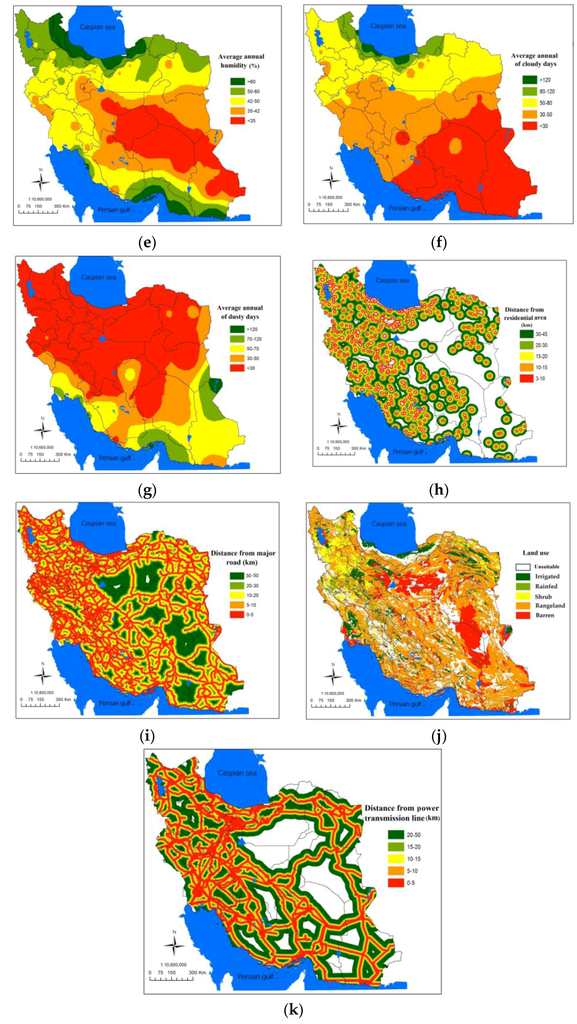
Figure 5.
Evaluation criteria layers for land Suitability analysis: (a) elevation criterion; (b) slope criterion; (c) solar radiation criterion; (d) average annual temperature criterion; (e) average annual humidity criterion; (f) average annual of cloudy days criterion; (g) average annual of dusty days criterion; (h) distance from residential area criterion; (i) distance from access road criterion; (j) land use criterion; and (k) distance from power transmission lines criterion.

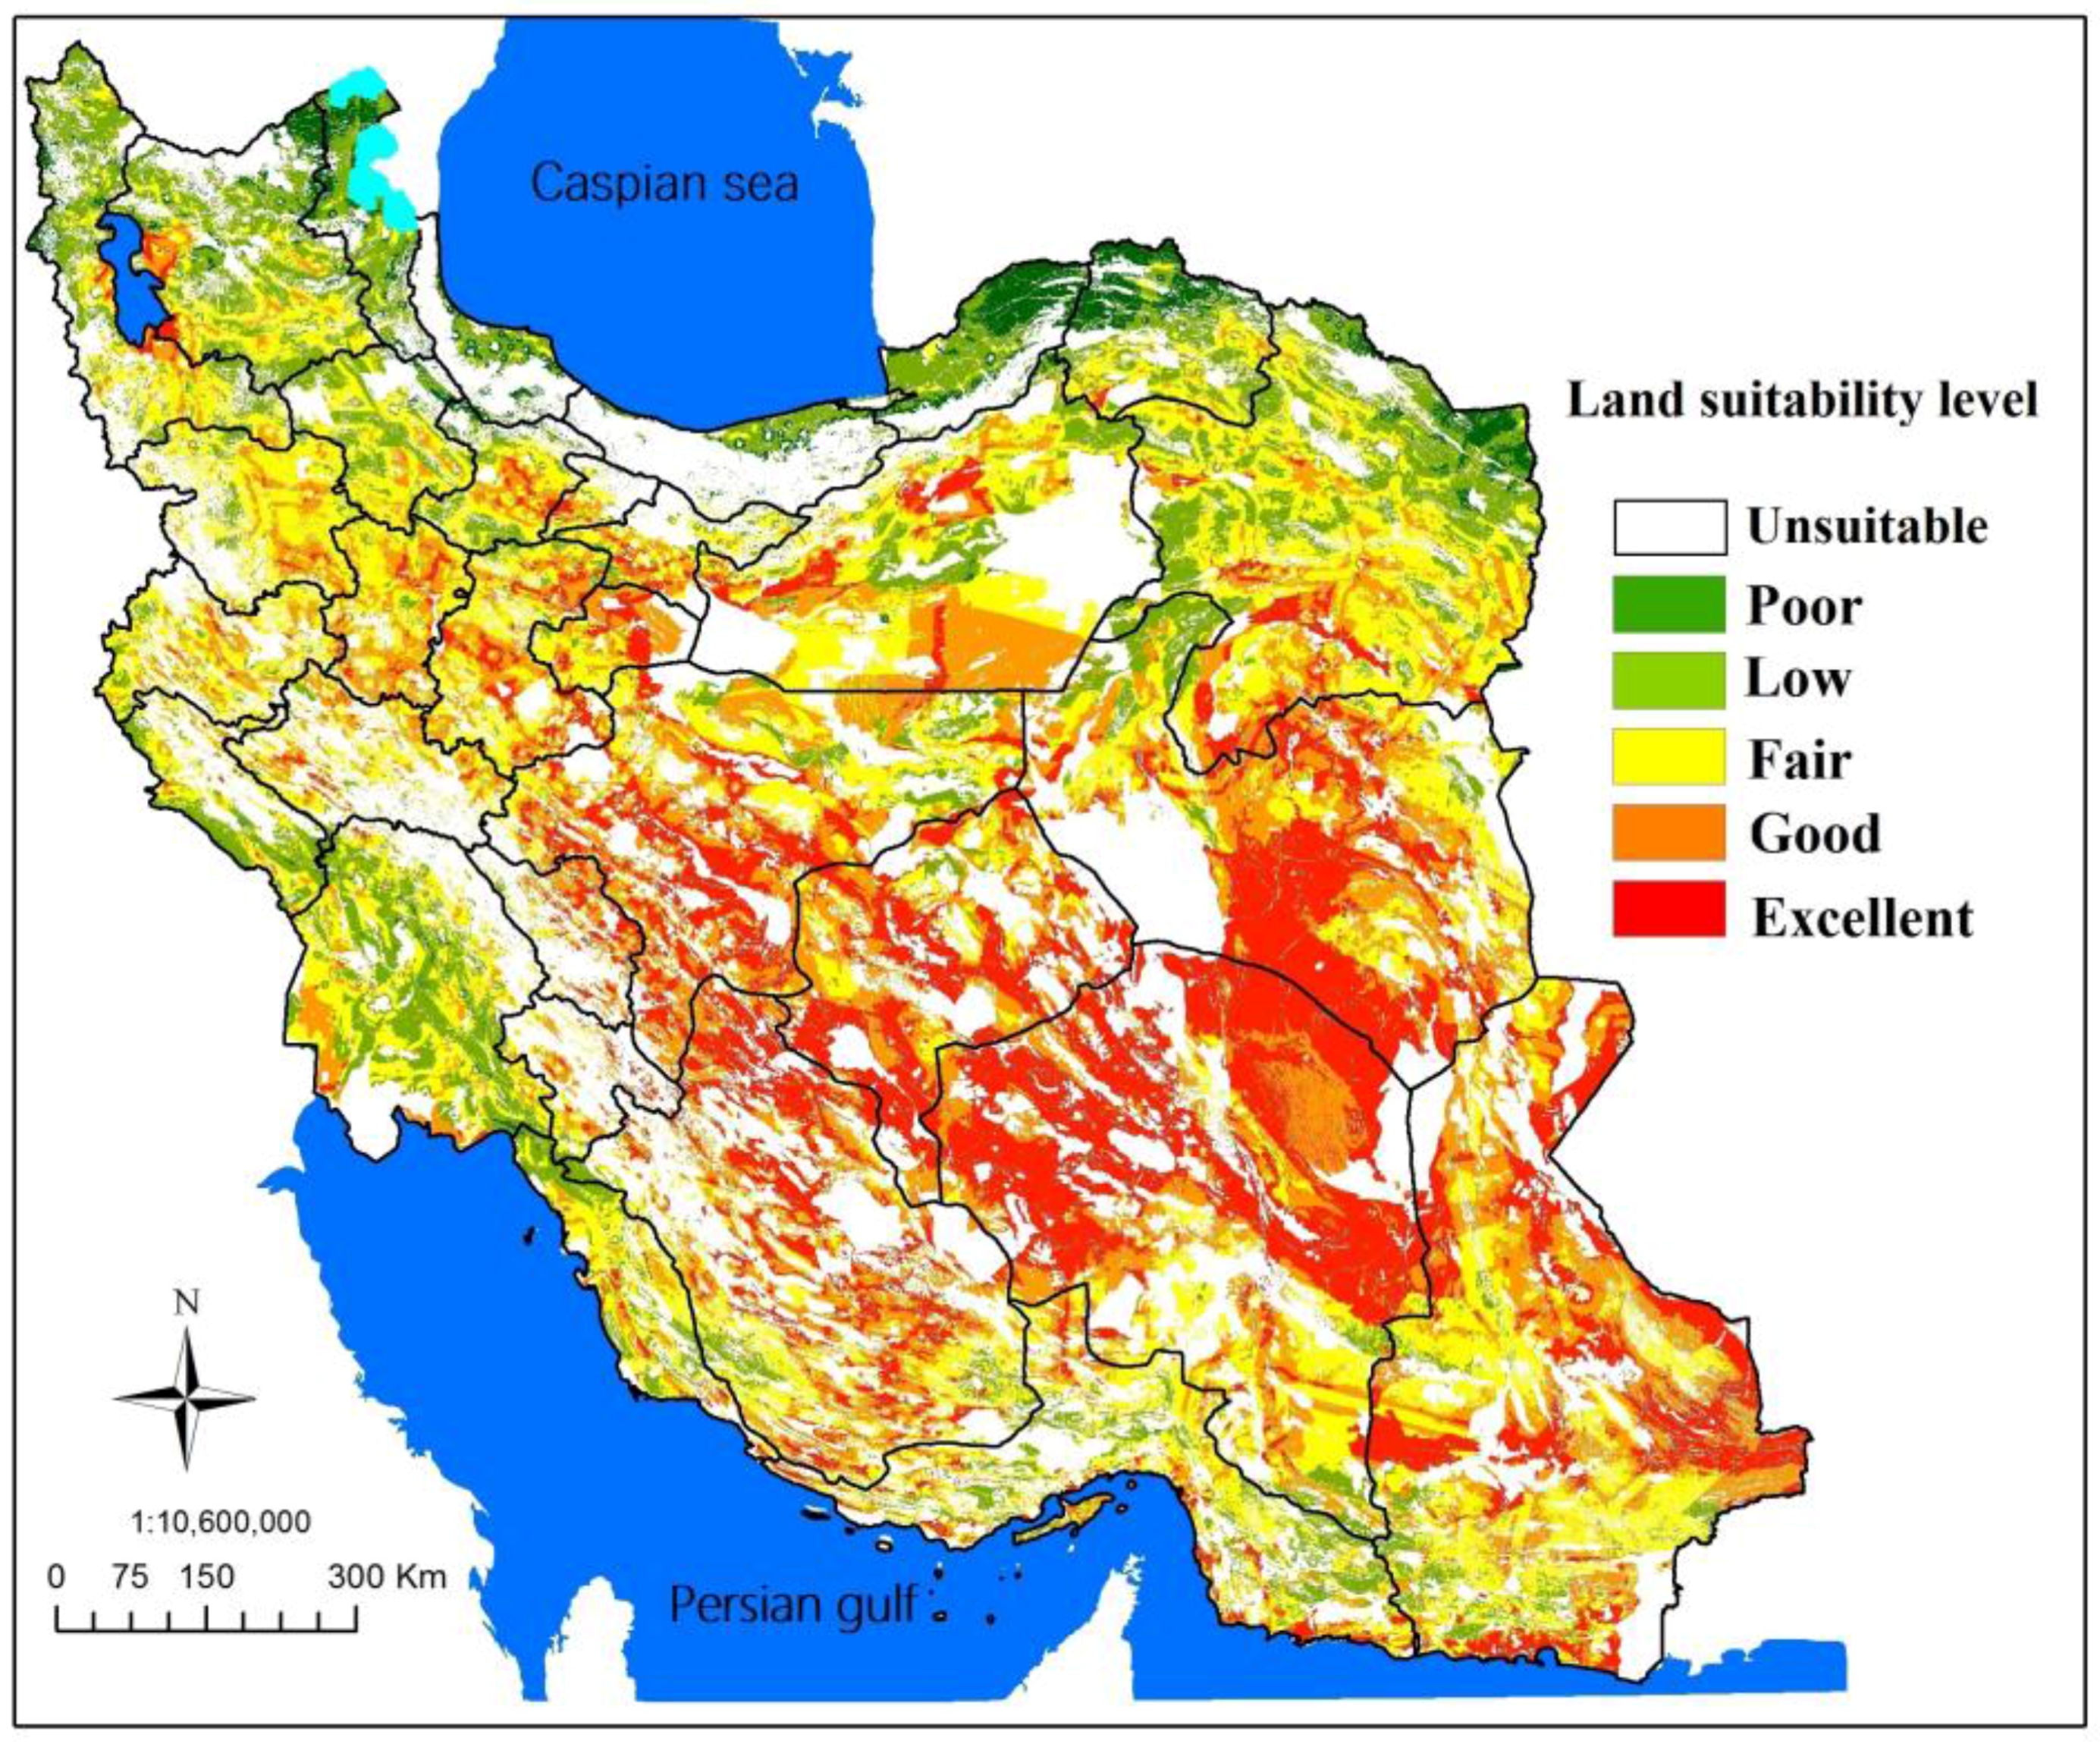
Figure 6.
Classified land suitability map for exploiting solar PV farms.
In this research, the values determined for Land Suitability Index (LSI) for each district were determined based on the share of each of the five defined classes in each district area, where higher scores represent more suitable regions for constructing solar PV farms. The final map related to the priority of regions (1057 districts based on Iran’s political division) was calculated as depicted in Figure 7.
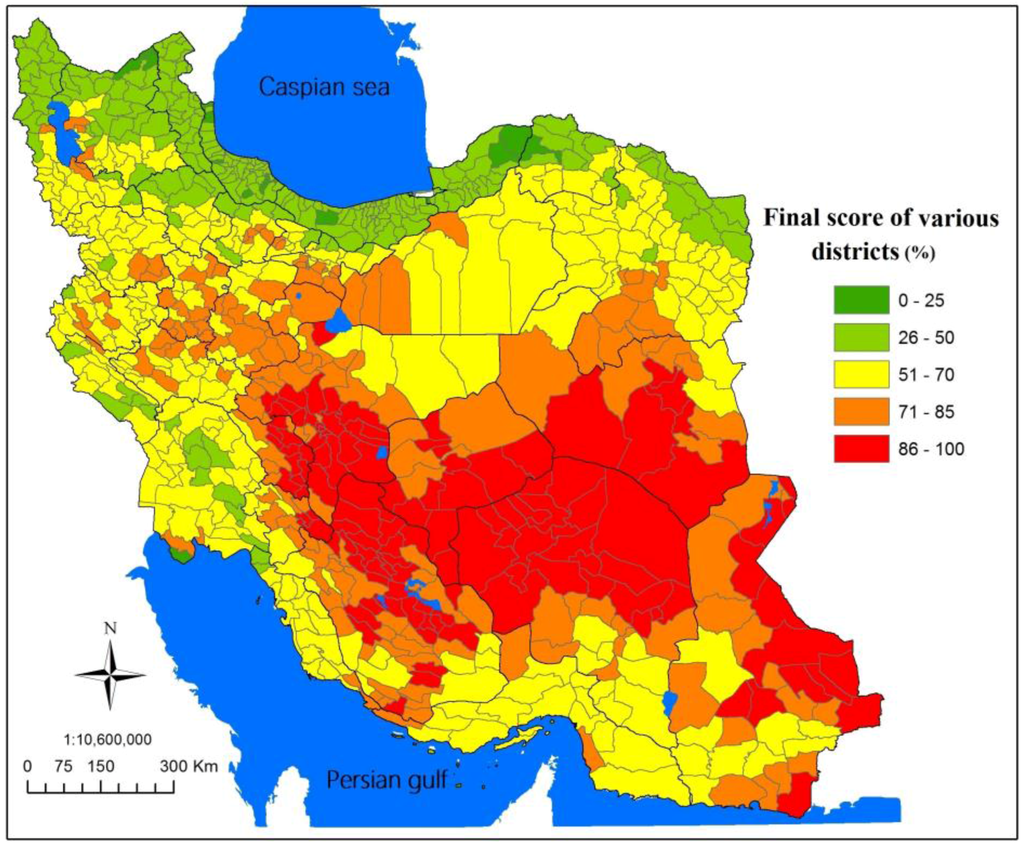
Figure 7.
The priority of various districts for exploiting solar PV farms.
5. Results and Discussion
The obtained results indicated that the combination of FAHP, SAW with GIS has a high accuracy in land suitability analysis modeling and, in this way, climatic criteria have the most relative importance.
The results revealed that 14.7%, 17.2%, 19.2%, 11.3% and 1.8% of Iran’s area are positioned as excellent, good, fair, low and poor classes, respectively.
About 35.8% of the areas in Iran are in the restricted area (Figure 2). Based on this, we can say that this is due to the high slope or elevation. As mentioned earlier, the regions with slope greater than 11% as well as above 2200 m from sea level are unsuitable for the construction of PV farms. Hence, the regions with restricted areas that are not suitable for creating large farms may have a better situation for implementation of small off-grid solar technology.
Table 3 shows the results for Iran’s provinces based on the percentage of area related to each defined class. As indicated in Table 3, Golestan, Ardabil, North Khorasan, Gilan and Mazandaran provinces have the highest area in the poor class due to the rain forest areas in the northern part of Iran. Moreover, as the suitable provinces, Kerman, Yazd, Fars, Sisitan and Baluchestan, Southern Khorasan and Isfahan, with half the total area of Iran, are included in the regions with the most excellent suitability for exploiting solar energy. Area classification of the most suitable provinces based on the percentage of area related to each class including excellent, good, fair, low and poor, as well as unsuitable area is presented in Figure 8.
Table 3.
The percentage of area related to various classes at the provincial level.
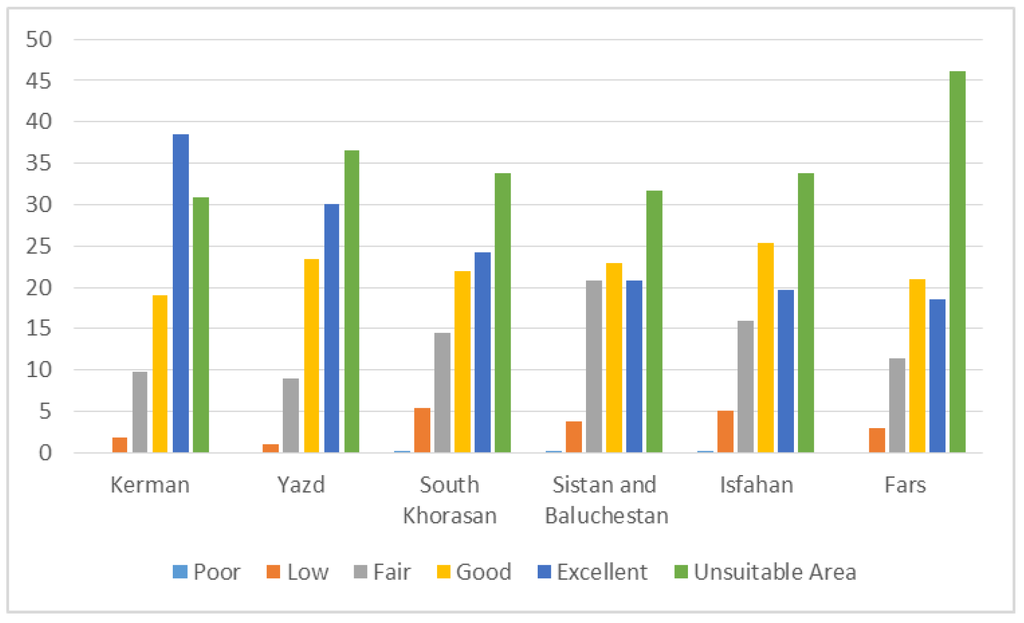
Figure 8.
Area classification of the most suitable provinces.
Due to the geographical location and climatic conditions of central and southern regions of Iran such as aridity, high quantity of sunny days and good situation for other defined criteria in this research, Kerman, Yazd, Fars, Sisitan and Baluchestan, Southern Khorasan and Isfahan will be attractive for investment in solar energy projects. Figure 9 presents a closer view of the geographical location and classification in these provinces.
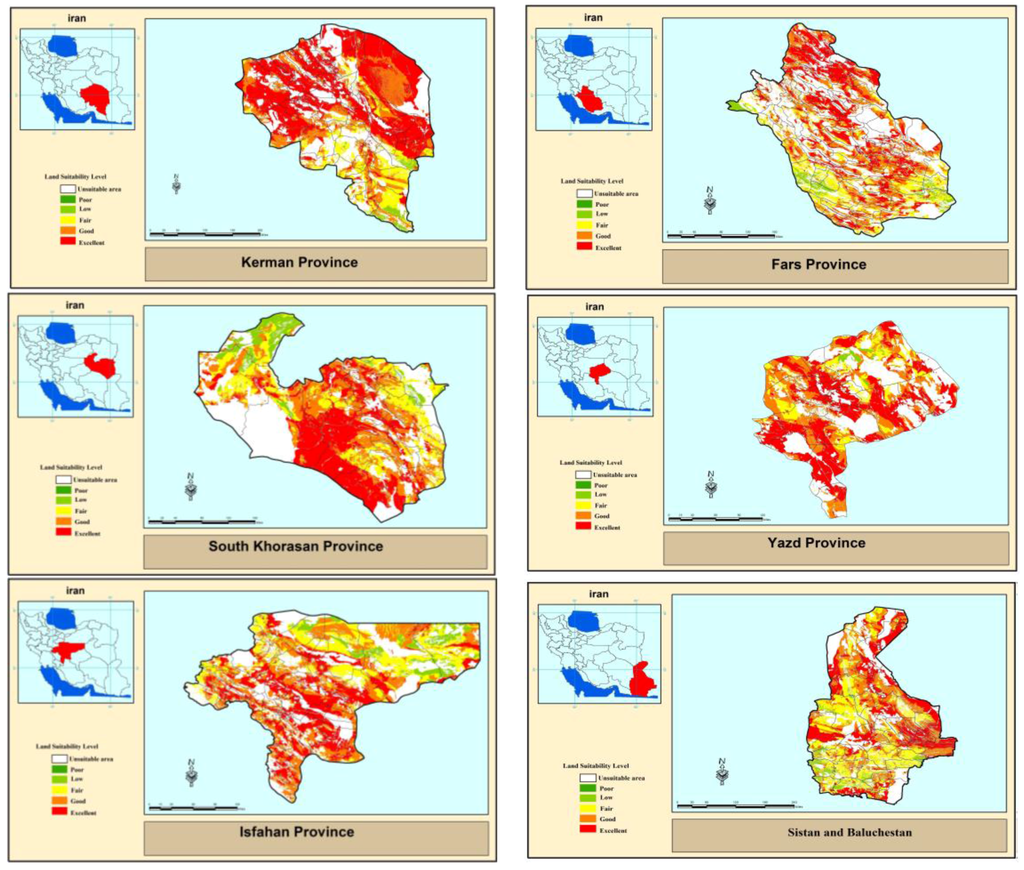
Figure 9.
Closer view of the geographical location and classification in the most suitable provinces.
Due to obtained data in this research, we can also determine the prioritization in country, districts or in rural area level for Iran. More detail analysis, including the 50 best districts in various provinces are presented in Appendix A.
6. Conclusions
As a developing country and considering the growth of energy consumption, Iran needs to develop and increase its energy generation capacity. Unavoidably, it should consider a special status for planning and providing energy in its developmental plan. Extensive utilization of fossil energy resources across economic sectors has led to increase of pollutants as well as depletion of these resources. Thus, the inclination for the usage of renewable energy resources should be taken into consideration due to characteristics such as renewability, availability, pollution reduction, and, more importantly, sustainable development. Application of renewable energies including solar energy can assist Iran in achieving goals including diversification of energy mix, application of local energy resources, reducing environmental impacts, and eventually sustainable development of the energy sector.
Because of high initial capital investment to set up solar power plants, identification of the best sites for exploitation of solar energy may be the most important step in the development of this industry. This study provides a practical approach, considering technical, environmental, geographical, and economic criteria, to assess and prioritize various regions of Iran for exploiting solar energy using geographical information system (GIS) and fuzzy AHP technique.
The results indicated that 14.7% of the entire lands in Iran have a suitability level of excellent, 17.2% are in good level, 19.2% are in fair level, 11.3% are in low level, and 1.8% are in poor level with the lowest priority regarding installation of photovoltaic. Moreover, provinces of Kerman, Yazd, Fars, Sisitan and Baluchestan, Southern Khorasan and Isfahan have the greatest Suitability for the exploitation of solar energy, while districts of Narmashir, Fahraj, Pariz, Anar, Bam and Chatrud in Kerman province; Safa Shahr district in Fars; Shahraki and Naroki in Sistan; and Ashkzar district in Yazd province are among the most highly prioritized regions for development of the technology of solar energy (Appendix A).
In order to relate the investigations to real life situations, we consider climatic, executive, technical, and technological limitations in land Suitability modeling in our analyses. For example, due to entrance of dust systems in west and south regions of Iran over the past few years, the factor of the annual average of dusty days has been taken into consideration as one of the influential factors.
Regarding the issues of development of solar industry, considering the different limitations ahead of the government, the results of this study can be of interest to the energy planners because of the accuracy of investigations and the obtained results. In addition to the central government and national organizations, the results of this research can assist the relevant authorities and planners at the level of each province together with the investors over the energy area for planning and developing this industry. However, government’s aids to provide promotional tools like subsidies, guaranteed purchase contracts and providing the economic situation for private part venture will encourage investors inside and outside the country to invest in solar energy development projects.
Author Contributions
Ehsan Noorollahi acquired data. Ehsan Noorollahi and Dawud Fadai drafted the manuscript. Ehsan Noorollahi, Dawud Fadai, Mohsen Akbarpour Shirazi and Seyed Hassan Ghodsipour contributed to the conception and design of the study. All authors analyzed and interpreted the data and participated in revising and finalizing of the paper.
Conflicts of Interest
The authors declare no conflict of interest.
Abbreviations
The following abbreviations are used in this manuscript:
| RES | Renewable Energy Sources |
| PV | photovoltaics |
| CSP | Concentrating Solar Power |
| GIS | Geographic information system |
| TNF | Triangular Fuzzy Numbers |
| MCDM | Multi Criteria Decision Making |
| MADM | Multi Attribute Decision Making |
| MODM | Multi Objective Decision Making |
| FAHP | Fuzzy Analytic Hierarchy Process |
| SAW | Simple Additive Weight |
| LSI | Land suitability Index |
| ANN | Artificial Neural Network |
| DSS | Decision support system |
| kWh·m−2·year−1 | kilowatt hour per square meter per year |
| kWh | kilowatt hour |
| GWh | Gigawatt hour |
| MW | megawatt |
| MWh | Megawatt hour |
| °C | Degree Celsius |
Appendix A
The Specification of the Best 50 Districts for Exploitation of Solar Energy in Iran
Due to the high volume of total obtained results in this study, and in order to prepare detailed and operational outputs, the results of the best 50 districts of Iran, based on the possession of the highest proportion of excellent class is presented in Table A1. For each district, the name of its related county and province, its area percentage of each class and its total area in (km2) are presented.
Table A1.
The specification of the best 50 districts for exploitation of solar energy in Iran.
| No. | District | County | Province | Unsuitable Area | Poor | Low | Fair | Good | Excellent | Total Area (km2) |
|---|---|---|---|---|---|---|---|---|---|---|
| 1 | Narmashir | Bam | Kerman | 0.02 | 0.00 | 0.00 | 0.00 | 0.01 | 0.96 | 528.58 |
| 2 | Fahraj | Fahraj | Kerman | 0.11 | 0.00 | 0.00 | 0.00 | 0.05 | 0.84 | 3583.39 |
| 3 | Pariz | Sirjan | Kerman | 0.18 | 0.00 | 0.00 | 0.00 | 0.05 | 0.77 | 1681.77 |
| 4 | Anar | Anar | Kerman | 0.21 | 0.00 | 0.00 | 0.00 | 0.05 | 0.74 | 2088.55 |
| 5 | Safa shahr c.d | Khorrambid | Fars | 0.18 | 0.00 | 0.00 | 0.00 | 0.11 | 0.71 | 1879.43 |
| 6 | Shahraki v Naroki | Zehak | Sistan and Baluchestan | 0.19 | 0.00 | 0.00 | 0.00 | 0.13 | 0.69 | 781.85 |
| 7 | Central district | Bam | Kerman | 0.23 | 0.00 | 0.00 | 0.00 | 0.09 | 0.67 | 6311.70 |
| 8 | Chatrud | Kerman | Kerman | 0.24 | 0.00 | 0.00 | 0.00 | 0.10 | 0.67 | 1198.05 |
| 9 | Ashkzar Central district | Sadugh | Yazd | 0.37 | 0.00 | 0.00 | 0.00 | 0.00 | 0.63 | 718.69 |
| 10 | Central district | Rafsanjan | Kerman | 0.33 | 0.00 | 0.00 | 0.00 | 0.05 | 0.62 | 4418.15 |
| 11 | Khusf | Birjand | South Khorasan | 0.07 | 0.00 | 0.00 | 0.11 | 0.20 | 0.62 | 15,795.74 |
| 12 | Marvast | Khatam | Yazd | 0.24 | 0.00 | 0.00 | 0.04 | 0.13 | 0.59 | 5147.89 |
| 13 | Central district | Yazd | Yazd | 0.38 | 0.00 | 0.00 | 0.02 | 0.02 | 0.58 | 1628.82 |
| 14 | Central district | Zarand | Kerman | 0.38 | 0.00 | 0.00 | 0.00 | 0.05 | 0.57 | 4034.55 |
| 15 | Yazdan shahr. | Zarand | Kerman | 0.25 | 0.00 | 0.00 | 0.00 | 0.17 | 0.57 | 2084.14 |
| 16 | Central district | Abarkuh | Yazd | 0.26 | 0.00 | 0.00 | 0.03 | 0.14 | 0.56 | 2351.22 |
| 17 | Koshkuiyeh | Rafsanjan | Kerman | 0.26 | 0.00 | 0.00 | 0.00 | 0.18 | 0.55 | 1425.63 |
| 18 | Central district | Shahr-e-babak | Kerman | 0.21 | 0.00 | 0.00 | 0.02 | 0.22 | 0.55 | 13,528.07 |
| 19 | Central district | Marvdasht | Fars | 0.31 | 0.00 | 0.00 | 0.00 | 0.14 | 0.55 | 1132.75 |
| 20 | Central district | Eqlid | Fars | 0.31 | 0.00 | 0.00 | 0.00 | 0.14 | 0.54 | 4269.91 |
| 21 | Nir | Taft | Yazd | 0.12 | 0.00 | 0.00 | 0.00 | 0.34 | 0.54 | 2042.48 |
| 22 | Rayen | Kerman | Kerman | 0.23 | 0.00 | 0.00 | 0.03 | 0.22 | 0.52 | 2591.99 |
| 23 | Shahdad | Kerman | Kerman | 0.21 | 0.00 | 0.00 | 0.01 | 0.27 | 0.51 | 29,373.10 |
| 24 | Jolgeh | Isfahan | Isfahan | 0.44 | 0.00 | 0.00 | 0.00 | 0.06 | 0.50 | 1820.39 |
| 25 | Kuhbonan | Kuhbonan | Kerman | 0.41 | 0.00 | 0.00 | 0.00 | 0.10 | 0.49 | 2037.42 |
| 26 | Central district | Sirjan | Kerman | 0.30 | 0.00 | 0.00 | 0.02 | 0.20 | 0.49 | 10,997.23 |
| 27 | Roudab | Bam | Kerman | 0.19 | 0.00 | 0.00 | 0.17 | 0.15 | 0.49 | 1861.20 |
| 28 | Central district | Meybud | Yazd | 0.25 | 0.00 | 0.00 | 0.03 | 0.24 | 0.49 | 1228.16 |
| 29 | Bam pasht | Saravan | Sistan v baluchestan | 0.13 | 0.00 | 0.00 | 0.01 | 0.38 | 0.48 | 5580.34 |
| 30 | Kuhpayeh | Isfahan | Isfahan | 0.27 | 0.00 | 0.00 | 0.01 | 0.25 | 0.47 | 3039.88 |
| 31 | Garkan-e Jonubi | Mobarakeh | Isfahan | 0.43 | 0.00 | 0.00 | 0.03 | 0.07 | 0.47 | 199.94 |
| 32 | Central district | Isfahan | Isfahan | 0.43 | 0.00 | 0.00 | 0.01 | 0.10 | 0.47 | 1549.51 |
| 33 | Central district | Borujen | Chaharmahal v bakhtiari | 0.17 | 0.00 | 0.00 | 0.02 | 0.35 | 0.46 | 868.63 |
| 34 | Central district | Ravar | Kerman | 0.51 | 0.00 | 0.00 | 0.00 | 0.03 | 0.45 | 8448.77 |
| 35 | Zarqan | Shiraz | Fars | 0.42 | 0.00 | 0.00 | 0.01 | 0.11 | 0.45 | 828.37 |
| 36 | Mahan | Kerman | Kerman | 0.41 | 0.00 | 0.00 | 0.00 | 0.15 | 0.45 | 1919.31 |
| 37 | Rigan | Rigan | Kerman | 0.12 | 0.00 | 0.13 | 0.18 | 0.13 | 0.44 | 7091.51 |
| 38 | Central district | Bonab | East azerbaijan | 0.06 | 0.00 | 0.07 | 0.27 | 0.16 | 0.44 | 773.73 |
| 39 | Sedeh | Qaen | South Khorasan | 0.20 | 0.00 | 0.00 | 0.03 | 0.34 | 0.44 | 2252.91 |
| 40 | Pir bakran | Falavarjan | Isfahan | 0.46 | 0.00 | 0.00 | 0.00 | 0.11 | 0.44 | 121.61 |
| 41 | Central district | Chadegan | Isfahan | 0.27 | 0.00 | 0.00 | 0.00 | 0.30 | 0.43 | 824.98 |
| 42 | Central district | Saravan | Sistan v baluchestan | 0.21 | 0.00 | 0.00 | 0.03 | 0.33 | 0.42 | 2560.98 |
| 43 | Nuq | Rafsanjan | Kerman | 0.26 | 0.00 | 0.00 | 0.00 | 0.33 | 0.42 | 2279.29 |
| 44 | Central district | Nazarabad | Alborz | 0.20 | 0.00 | 0.06 | 0.13 | 0.19 | 0.42 | 287.81 |
| 45 | Mashhad marghab | Pasargad | Fars | 0.33 | 0.00 | 0.00 | 0.03 | 0.22 | 0.41 | 1509.22 |
| 46 | Central district | Abadeh | Fars | 0.34 | 0.00 | 0.00 | 0.01 | 0.25 | 0.41 | 5637.03 |
| 47 | Hiduj | Sib o Soran | Sistan V Baluchestan | 0.12 | 0.00 | 0.00 | 0.25 | 0.22 | 0.40 | 2301.28 |
| 48 | Gogan | Azarshahr | East Azerbaijan | 0.06 | 0.00 | 0.04 | 0.10 | 0.40 | 0.40 | 268.58 |
| 49 | Shib ab | Zabol | Sistan v baluchestan | 0.43 | 0.00 | 0.00 | 0.03 | 0.14 | 0.40 | 4871.46 |
| 50 | Karbal | Shiraz | Fars | 0.39 | 0.00 | 0.00 | 0.03 | 0.19 | 0.39 | 19.70 |
References
- United Nations. Adoption of the Paris Agreement. In Proceedings of the Conference of the Parties, Twenty-First Session, Paris, France, 30 November–11 December 2015.
- Department of Environment Islamic Republic of Iran. Available online: http://www.doe.ir/Portal/Home/Default.aspx?CategoryID=7072cd63-f3b7–4844-89ac-c82431aabdc1 (accessed on 9 April 2016).
- Najafi, G.; Ghobadian, B.; Mamat, R.; Yusaf, T.; Azmi, W.H. Solar energy in Iran: Current state and outlook. Renew. Sustain. Energy Rev. 2015, 49, 931–942. [Google Scholar] [CrossRef]
- Sosa, A.; McDonnell, K.; Devlin, G. Analysing Performance Characteristics of Biomass Haulage in Ireland for Bioenergy Markets with GPS, GIS and Fuel Diagnostic Tools. Energies 2015, 8, 12004–12019. [Google Scholar] [CrossRef]
- San Cristóbal, J.R. Multi-criteria decision-making in the selection of a renewable energy project in Spain: The Vikor method. Renew. Energy 2011, 36, 498–502. [Google Scholar] [CrossRef]
- Prasad, R.D.; Bansal, R.C.; Raturi, A. Multi-faceted energy planning: A review. Renew. Sustain. Energy Rev. 2014, 38, 686–699. [Google Scholar] [CrossRef]
- Stein, E.W. A comprehensive multi-criteria model to rank electric energy production technologies. Renew. Sustain. Energy Rev. 2013, 22, 640–654. [Google Scholar] [CrossRef]
- Erdogan, M.; Kaya, I. An integrated multi-criteria decision-making methodology based on type-2 fuzzy sets for selection among energy alternatives in turkey. Iran. J. Fuzzy Syst. 2015, 12, 1–25. [Google Scholar]
- Alamdari, P.; Nematollahi, O.; Alemrajabi, A.A. Solar energy potentials in Iran: A review. Renew. Sustain. Energy Rev. 2013, 21, 778–788. [Google Scholar] [CrossRef]
- Kucuksari, S.; Khaleghi, A.M.; Hamidi, M.; Zhang, Y.; Szidarovszky, F.; Bayraksan, G.; Son, Y.J. An Integrated GIS, optimization and simulation framework for optimal PV size and location in campus area environments. Appl. Energy 2014, 113, 1601–1613. [Google Scholar] [CrossRef]
- Sánchez-Lozano, J.M.; García-Cascales, M.S.; Lamata, M.T. GIS-based onshore wind farm site selection using Fuzzy Multi-Criteria Decision Making methods. Evaluating the case of Southeastern Spain. Appl. Energy 2016, 171, 86–102. [Google Scholar] [CrossRef]
- Borgogno Mondino, E.; Fabrizio, E.; Chiabrando, R. Site Selection of Large Ground-Mounted Photovoltaic Plants: A GIS Decision Support System and an Application to Italy. Int. J. Green Energy 2014, 12, 515–525. [Google Scholar] [CrossRef]
- Uyan, M. GIS-based solar farms site selection using analytic hierarchy process (AHP) in Karapinar region Konya/Turkey. Renew. Sustain. Energy Rev. 2013, 28, 11–17. [Google Scholar] [CrossRef]
- Sanchez-Lozano, J.M.; Henggeler Antunes, C.; Garcia-Cascales, M.S.; Dias, L.C. GIS-based photovoltaic solar farms site selection using ELECTRE-TRI: Evaluating the case for Torre Pacheco, Murcia, Southeast of Spain. Renew. Energy 2014, 66, 478–494. [Google Scholar] [CrossRef]
- Sánchez-Lozano, J.M.; García-Cascales, M.S.; Lamata, M.T. Evaluation of suitable locations for the installation of solar thermoelectric power plants. Comput. Ind. Eng. 2015, 87, 343–355. [Google Scholar] [CrossRef]
- Charabi, Y.; Gastli, A. PV site suitability analysis using GIS-based spatial fuzzy multi-criteria evaluation. Renew. Energy 2011, 36, 2554–2561. [Google Scholar] [CrossRef]
- Westacott, P.; Candelise, C. A Novel Geographical Information Systems Framework to Characterize Photovoltaic Deployment in the UK: Initial Evidence. Energies 2016, 9, 26. [Google Scholar] [CrossRef]
- Chen, C.R.; Huang, C.C.; Tsuei, H.J. A hybrid MCDM model for improving GIS-based solar farms site selection. Int. J. Photoenergy 2014, 2014. [Google Scholar] [CrossRef]
- Besarati, S.M.; Padilla, R.V.; Goswami, D.Y.; Stefanakos, E. The potential of harnessing solar radiation in Iran: Generating solar maps and viability study of PV power plants. Renew. Energy 2013, 53, 193–199. [Google Scholar] [CrossRef]
- Zoghi, M.; Ehsani, A.H.; Sadat, M.; Javad Amiri, M.; Karimi, S. Optimization solar site selection by fuzzy logic model and weighted linear combination method in arid and semi-arid region: A case study Isfahan-IRAN. Renew. Sustain. Energy Rev. 2015. [Google Scholar] [CrossRef]
- Perpiña Castillo, C.; Batista e Silva, F.; Lavalle, C. An assessment of the regional potential for solar power generation in EU-28. Energy Policy 2016, 88, 86–99. [Google Scholar] [CrossRef]
- Massimo, A.; Dell’Isola, M.; Frattolillo, A.; Ficco, G. Development of a Geographical Information System (GIS) for the Integration of Solar Energy in the Energy Planning of a Wide Area. Sustainability 2014, 6, 5730–5744. [Google Scholar] [CrossRef]
- Polo, J.; Bernardos, A.; Navarro, A.A.; Fernandez-Peruchena, C.M.; Ramírez, L.; Guisado, M.V.; Martínez, S. Solar resources and power potential mapping in Vietnam using satellite-derived and GIS-based information. Energy Convers. Manag. 2015, 98, 348–358. [Google Scholar] [CrossRef]
- Iran’s Annual Statistical. Available online: http://www.amar.org.ir/english (accessed on 20 March 2015).
- Electric Holding Company of Generation, Transmission & Distribution Company (Tavanir). Electric Power Industry in Iran; Ministry of Energy: Tehran, Iran, 2014.
- Meratizaman, M.; Salimi, M.; Monadizaeh, S.; Amidpour, M. Environmental Analysis of Different Scenarios of Power Generation in Iran with Natural Gas, Vacuum Residue and Syngas Feedstock. In Proceedings of the 4th International Gas Processing Symposium, Doha, Qatar, 26–27 October 2014; Volume 4, p. 327.
- SEAI. Best Practice Guide Photovoltaics; Sustainable Energy Authority of Ireland: Dublin, Ireland, 2013. [Google Scholar]
- Wheatbelt Development Commission. Site Options for Concentrated Solar Power Generation in the Wheatbelt Final Report; Wheatbelt Development Commission: Northam, Australia, 2010.
- Ong, S.; Campbell, C.; Denholm, P.; Margolis, R.; Heath, G. Land-Use Requirements for Solar Power Plants in the United States; National Renewable Energy Laboratory (NREL): Golden, CO, USA, 2013; Volume 7.
- US EPA & Nrel. Best Practices for Siting Solar Photovoltaics on Municipal Solid Waste Landfills; National Renewable Energy Laboratory (NREL): Golden, CO, USA, 2013; Volume 41.
- Quaschning, V. Technical and economical system comparison of photovoltaic and concentrating solar thermal power systems depending on annual global irradiation. Sol. Energy 2004, 77, 171–178. [Google Scholar] [CrossRef]
- Huld, T.; Amillo, A.M.G. Estimating PV module performance over large geographical regions: The role of irradiance, air temperature, wind speed and solar spectrum. Energies 2015, 8, 5159–5181. [Google Scholar] [CrossRef]
- Yelmen, B.; Çakir, M.T. Influence of temperature changes in various regions of Turkey on powers of photovoltaic solar panels. Energy Sources Part A Recover. Util. Environ. Eff. 2016, 38, 542–550. [Google Scholar] [CrossRef]
- Ignizio, D. Suitability Modeling and the Location of Utility-Scale Solar Power Plants in the Southwestern United States. Masters Thesis, University of New Mexico, Albuquerque, NM, USA, 2010. [Google Scholar]
- Piazena, H. The effect of altitude upon the solar UV-B and UV-A irradiance in the tropical Chilean Andes. Sol. Energy 1996, 57, 133–140. [Google Scholar] [CrossRef]
- Kosmopoulos, P.G.; Kazadzis, S.; Lagouvardos, K.; Kotroni, V.; Bais, A. Solar energy prediction and verification using operational model forecasts and ground-based solar measurements. Energy 2015, 93, 1918–1930. [Google Scholar] [CrossRef]
- Mekhilef, S.; Saidur, R.; Kamalisarvestani, M. Effect of dust, humidity and air velocity on efficiency of photovoltaic cells. Renew. Sustain. Energy Rev. 2012, 16, 2920–2925. [Google Scholar] [CrossRef]
- Saaty, T.L. Decision Making with Dependence and Feedback: The Analytical Network Process. In Analytic Hierarchy Process; RWS Publications: Pittsburgh, PA, USA, 1996; Volume 9. [Google Scholar]
- Zadeh, L.A. Fuzzy sets. Inform. Control 1965, 8, 338–353. [Google Scholar] [CrossRef]


© 2016 by the authors; licensee MDPI, Basel, Switzerland. This article is an open access article distributed under the terms and conditions of the Creative Commons Attribution (CC-BY) license (http://creativecommons.org/licenses/by/4.0/).