Desktop Fabrication of Strong Poly (Lactic Acid) Parts: FFF Process Parameters Tuning

 ,
, 

Abstract

1. Introduction
2. Methods and Materials
2.1. Sample Shapes
2.2. Samples Fabrication
- Nozzle diameter (0.6 mm)
- Heated bed temperature (60 °C)
- The first layer thickness (0.3 mm)
- The first layer printing speed (25 mm/s)
2.3. Mechanical Testing
2.4. Sublayer Temperature Evaluation
2.5. Macrostructure Evaluation of Fracture Surfaces
3. Results and Discussion
3.1. Technological Parameters Coarse Optimization
3.2. Technological Parameters Fine Tuning
3.3. Fracture Surface Structure of the Tested Samples
3.4. Comparing Experimental Data with Previously Obtained Models
4. Summary
5. Conclusions
Author Contributions
Funding
Acknowledgments
Conflicts of Interest
Nomenclature/Abbreviations
References
- Colley, D.P. Instant prototypes. Mech. Eng. 1988, 110, 68. [Google Scholar]
- Deitz, D. Stereolithography automates prototyping. Mech. Eng. 1990, 112, 34. [Google Scholar]
- Ashley, S. Rapid prototyping systems. Mech. Eng. 1991, 113, 34. [Google Scholar]
- Kruth, J.P. Material incress manufacturing by rapid prototyping techniques. CIRP Ann. 1991, 40, 603–614. [Google Scholar] [CrossRef]
- Jacobs, P.F. Rapid Prototyping Manufacturing: Fundamentals of Stereolithography; Society of Manufacturing Engineers: College Station, TX, USA, 1992. [Google Scholar]
- Wall, M.B.; Ulrich, K.T.; Flowers, W.C. Evaluating prototyping technologies for product design. Res. Eng. Des. 1992, 3, 163–177. [Google Scholar] [CrossRef]
- Ashley, S. Rapid prototyping is coming of age. Mech. Eng. 1995, 117, 62–68. [Google Scholar]
- Sachs, E.; Cima, M.; Cornie, J. Three-Dimensional Printing: Rapid Tooling and Prototypes Directly from a CAD Model. CIRP Ann. 1990, 39, 201–204. [Google Scholar] [CrossRef]
- Dickens, P.M.; Stangroom, R.; Greul, M.; Holmer, B.; Hon, K.K.B.; Hovtun, R.; Neumann, R.; Noeken, S.; Wimpenny, D. Conversion of RP models to investment castings. Rapid Prototyp. J. 1995, 1, 4–11. [Google Scholar] [CrossRef]
- Karapatis, N.P.; Van Griethuysen, J.-P.S.; Glardon, R. Direct rapid tooling: A review of current research. Rapid Prototyp. J. 1998, 4, 77–89. [Google Scholar] [CrossRef]
- Chua, C.K.; Hong, K.H.; Ho, S.L. Rapid tooling technology. Part 1. A comparative study. Int. J. Adv. Manuf. Technol. 1999, 15, 604–608. [Google Scholar] [CrossRef]
- Radstok, E. Rapid tooling. Rapid Prototyp. J. 1999, 5, 164–168. [Google Scholar] [CrossRef]
- Chua, C.K.; Hong, K.H.; Ho, S.L. Rapid tooling technology. Part 2. A case study using arc spray metal tooling. Int. J. Adv. Manuf. Technol. 1999, 15, 609–614. [Google Scholar] [CrossRef]
- Rosochowski, A.; Matuszak, A. Rapid tooling: The state of the art. J. Mater. Process. Technol. 2000, 106, 191–198. [Google Scholar] [CrossRef]
- Lerner, Y.; Rao, P.N.; Kouznetsov, V. Rapid tooling in metalcasting. Foundry Manag. Technol. (USA) 2002, 130, 47. [Google Scholar]
- Hopkinson, N.; Hague, R.J.M.; Dickens, P.M. Rapid Manufacturing: An Industrial Revolution for the Digital Age; John Wiley and Sons, Ltd.: Chichister, UK, 2006. [Google Scholar]
- Pham, D.T.; Dimov, S.S. Rapid prototyping and rapid tooling—The key enablers for rapid manufacturing. Proc. Inst. Mech. Eng. Part C J. Mech. Eng. Sci. 2003, 217, 1–24. [Google Scholar] [CrossRef]
- Levy, G.N.; Schindel, R.; Kruth, J.P. Rapid manufacturing and rapid tooling with layer manufacturing (LM) technologies, state of the art and future perspectives. CIRP Ann. 2003, 52, 589–609. [Google Scholar] [CrossRef]
- Lee, C.W.; Chua, C.K.; Cheah, C.M.; Tan, L.H.; Feng, C. Rapid investment casting: Direct and indirect approaches via fused deposition modelling. Int. J. Adv. Manuf. Technol. 2004, 23, 93–101. [Google Scholar] [CrossRef]
- Cheah, C.M.; Chua, C.K.; Lee, C.W.; Feng, C.; Totong, K. Rapid prototyping and tooling techniques: A review of applications for rapid investment casting. Int. J. Adv. Manuf. Technol. 2005, 25, 308–320. [Google Scholar] [CrossRef]
- Hopkinson, N.; Dickens, P. Rapid prototyping for direct manufacture. Rapid Prototyp. J. 2001, 7, 197–202. [Google Scholar] [CrossRef]
- Bak, D. Rapid prototyping or rapid production? 3D printing processes move industry towards the latter. Assem. Autom. 2003, 23, 340–345. [Google Scholar] [CrossRef]
- Hopkinson, N.; Dicknes, P. Analysis of rapid manufacturing—Using layer manufacturing processes for production. Proc. Inst. Mech. Eng. Part C J. Mech. Eng. Sci. 2003, 217, 31–39. [Google Scholar] [CrossRef]
- Yan, Y.; Li, S.; Zhang, R.; Lin, F.; Wu, R.; Lu, Q.; Xiong, Z.; Wang, X. Rapid Prototyping and Manufacturing Technology: Principle, Representative Technics, Applications, and Development Trends. Tsinghua Sci. Technol. 2009, 14, 1–12. [Google Scholar] [CrossRef]
- Ballardini, R.M.; Flores Ituarte, I.; Pei, E. Printing spare parts through additive manufacturing: Legal and digital business challenges. J. Manuf. Technol. Manag. 2018, 29, 958–982. [Google Scholar] [CrossRef]
- Fomlabs Form 1. Available online: https://makezine.com/2013/11/08/formlabs-form-1/ (accessed on 8 May 2019).
- Prusa, J. Introducing Original Prusa SL1—Open Source SLA 3D Printer by Josef Prusa. Available online: https://blog.prusaprinters.org/introducing-original-prusa-sl1-open-source-sla-3d-printer-by-josef-prusa/ (accessed on 8 May 2019).
- Ragan, S.M. Homemade High Resolution DLP 3D Printer. Available online: https://makezine.com/2010/10/15/homemade-high-resolution-dlp-3d-pri/ (accessed on 8 May 2019).
- Shultz, M. Formlabs Announces Desktop SLS Printer, Automated Manufacturing System. Available online: https://makezine.com/2017/06/05/formlabs-fuse-1-form-cell/ (accessed on 8 May 2019).
- Jones, R.; Haufe, P.; Sells, E.; Iravani, P.; Olliver, V.; Palmer, C.; Bowyer, A. RepRap-the Replicating Rapid Prototyper. Robotica 2011, 29, 177–191. [Google Scholar] [CrossRef]
- Bowyer, A. 3D Printing and Humanity’s First Imperfect Replicator. 3D Print. Addit. Manuf. 2014, 1, 4–5. [Google Scholar] [CrossRef]
- Rayna, T.; Striukova, L. From rapid prototyping to home fabrication: How 3D printing is changing business model innovation. Technol. Forecast. Soc. Chang. 2016, 102, 214–224. [Google Scholar] [CrossRef]
- Laplume, A.; Anzalone, G.; Pearce, J. Open-source, self-replicating 3-D printer factory for small-business manufacturing. Int. J. Adv. Manuf. Technol. 2015, 85, 633–642. [Google Scholar] [CrossRef]
- Laplume, A.; Petersen, B.; Pearce, J. Global value chains from a 3D printing perspective. J. Int. Bus. Stud. 2016, 47, 595–609. [Google Scholar] [CrossRef]
- Gershenfeld, N. How to make almost anything. Foreign Aff. 2012, 91, 43–57. [Google Scholar]
- Gwamuri, J.; Wittbrodt, B.; Anzalone, N.; Pearce, J. Reversing the Trend of Large Scale and Centralization in Manufacturing: The Case of Distributed Manufacturing of Customizable 3-D-Printable Self-Adjustable Glasses. Chall. Sustain. 2014, 2, 30–40. [Google Scholar] [CrossRef]
- Wittbrodt, B.; Laureto, J.; Tymrak, B.; Pearce, J. Distributed Manufacturing with 3-D Printing: A Case Study of Recreational Vehicle Solar Photovoltaic Mounting Systems. J. Frugal Innov. 2015, 1, 1–7. [Google Scholar] [CrossRef]
- Woern, A.L.; Pearce, J.M. Distributed Manufacturing of Flexible Products: Technical Feasibility and Economic Viability. Technologies 2017, 5, 71. [Google Scholar] [CrossRef]
- Woern, A.L.; Byard, D.J.; Oakley, R.B.; Fiedler, M.J.; Snabes, S.L.; Pearce, J.M. Fused Particle Fabrication 3-D Printing: Recycled Materials’ Optimization and Mechanical Properties. Materials 2018, 11, 1413. [Google Scholar] [CrossRef] [PubMed]
- Reich, M.J.; Woern, A.L.; Tanikella, N.G.; Pearce, J.M. Mechanical Properties and Applications of Recycled Polycarbonate Particle Material Extrusion-Based Additive Manufacturing. Materials 2019, 12, 1642. [Google Scholar] [CrossRef] [PubMed]
- Shih, C.C.; Burnette, M.; Staack, D.; Wang, J.; Tai, B.L. Effects of cold plasma treatment on interlayer bonding strength in FFF process. Addit. Manuf. 2019, 25, 104–111. [Google Scholar] [CrossRef]
- Go, J.; Hart, A.J. Fast desktop-scale extrusion additive manufacturing. Addit. Manuf. 2017, 18, 276–284. [Google Scholar] [CrossRef]
- Ravi, A.K.; Deshpande, A.; Hsu, K.H. An in-process laser localized pre-deposition heating approach to inter-layer bond strengthening in extrusion based polymer additive manufacturing. J. Manuf. Process. 2016, 24, 179–185. [Google Scholar] [CrossRef]
- Kishore, V.; Ajinjeru, C.; Nycz, A.; Post, B.; Lindahl, J.; Kunc, V.; Duty, C. Infrared preheating to improve interlayer strength of big area additive manufacturing (BAAM) components. Addit. Manuf. 2017, 14, 7–12. [Google Scholar] [CrossRef]
- Lederle, F.; Meyer, F.; Brunotte, G.P.; Kaldun, C.; Hübner, E.G. Improved mechanical properties of 3D-printed parts by fused deposition modeling processed under the exclusion of oxygen. Prog. Addit. Manuf. 2016, 1, 3–7. [Google Scholar] [CrossRef][Green Version]
- Abourayana, H.; Dobbyn, P.; Dowling, D. Enhancing the mechanical performance of additive manufactured polymer components using atmospheric plasma pre-treatments. Plasma Process. Polym. 2018, 15, 1700141. [Google Scholar] [CrossRef]
- Shaffer, S.; Yang, K.; Vargas, J.; Di Prima, M.A.; Voit, W. On reducing anisotropy in 3D printed polymers via ionizing radiation. Polymer 2014, 55, 5969–5979. [Google Scholar] [CrossRef]
- Sweeney, C.B.; Lackey, B.A.; Pospisil, M.J.; Achee, T.C.; Hicks, V.K.; Moran, A.G.; Green, M.J. Welding of 3D-printed carbon nanotube-polymer composites by locally induced microwave heating. Sci. Adv. 2017, 3, e1700262. [Google Scholar] [CrossRef] [PubMed]
- Li, G.; Zhao, J.; Wu, W.; Jiang, J.; Wang, B.; Jiang, H.; Fuh, J. Effect of ultrasonic vibration on mechanical properties of 3d printing non-crystalline and semi-crystalline polymers. Materials 2018, 11, 826. [Google Scholar] [CrossRef] [PubMed]
- Tofangchi, A.; Han, P.; Izquierdo, J.; Iyengar, A.; Hsu, K. Effect of Ultrasonic Vibration on Interlayer Adhesion in Fused Filament Fabrication 3D Printed ABS. Polymers 2019, 11, 315. [Google Scholar] [CrossRef] [PubMed]
- Hart, K.R.; Dunn, R.M.; Sietins, J.M.; Mock, C.M.H.; Mackay, M.E.; Wetzel, E.D. Increased fracture toughness of additively manufactured amorphous thermoplastics via thermal annealing. Polymer 2018, 144, 192–204. [Google Scholar] [CrossRef]
- Singh, S.; Singh, M.; Prakash, C.; Gupta, M.K.; Mia, M.; Singh, R. Optimization and reliability analysis to improve surface quality and mechanical characteristics of heat-treated fused filament fabricated parts. Int. J. Adv. Manuf. Technol. 2019, 102, 1–16. [Google Scholar] [CrossRef]
- Tanikella, N.G.; Wittbrodt, B.; Pearce, J.M. Tensile strength of commercial polymer materials for fused filament fabrication 3D printing. Addit. Manuf. 2017, 15, 40–47. [Google Scholar] [CrossRef]
- Wu, W.; Geng, P.; Li, G.; Zhao, D.; Zhang, H.; Zhao, J. Influence of layer thickness and raster angle on the mechanical properties of 3D-printed PEEK and a comparative mechanical study between PEEK and ABS. Materials 2015, 8, 5834–5846. [Google Scholar] [CrossRef]
- Xiaoyong, S.; Liangcheng, C.; Honglin, M.; Peng, G.; Zhanwei, B.; Cheng, L. Experimental analysis of high temperature PEEK materials on 3D printing test. In Proceedings of the 2017 9th International Conference on Measuring Technology and Mechatronics Automation (ICMTMA), Changsha, China, 14–15 January 2017. [Google Scholar] [CrossRef]
- Ning, F.; Cong, W.; Hu, Y.; Wang, H. Additive manufacturing of carbon fiber-reinforced plastic composites using fused deposition modeling: Effects of process parameters on tensile properties. J. Compos. Mater. 2017, 51, 451–462. [Google Scholar] [CrossRef]
- Lu, Y.; Poh, G.K.; Gleadall, A.; Zhao, L.; Han, X. Fabrication of the continuous carbon fiber reinforced plastic composites by additive manufacturing. In Proceedings of the 16th Conference on Rapid Design, Prototyping & Manufacturing (RDPM2019), London, UK, 4–5 April 2019. [Google Scholar]
- Caminero, M.Á.; Chacón, J.M.; García-Plaza, E.; Núñez, P.J.; Reverte, J.M.; Becar, J.P. Additive Manufacturing of PLA-Based Composites Using Fused Filament Fabrication: Effect of Graphene Nanoplatelet Reinforcement on Mechanical Properties, Dimensional Accuracy and Texture. Polymers 2019, 11, 799. [Google Scholar] [CrossRef]
- Levenhagen, N.P.; Dadmun, M.D. Interlayer diffusion of surface segregating additives to improve the isotropy of fused deposition modeling products. Polymer 2018, 152, 35–41. [Google Scholar] [CrossRef]
- Levenhagen, N.P.; Dadmun, M.D. Improving Interlayer Adhesion in 3D Printing with Surface Segregating Additives: Improving the Isotropy of Acrylonitrile-Butadiene-Styrene Parts. ACS Appl. Polym. Mater. 2019, 1, 876–884. [Google Scholar] [CrossRef]
- Kuznetsov, V.E.; Solonin, A.N.; Urzhumtsev, O.D.; Schilling, R.; Tavitov, A.G. Strength of PLA Components Fabricated with Fused Deposition Technology Using a Desktop 3D Printer as a Function of Geometrical Parameters of the Process. Polymers 2018, 10, 313. [Google Scholar] [CrossRef] [PubMed]
- Kuznetsov, V.E.; Solonin, A.N.; Tavitov, A.G.; Urzhumtsev, O.D.; Vakulik, A.H. Increasing of Strength of FDM (FFF) 3D Printed Parts by Influencing on Temperature-Related Parameters of the Process. Preprints 2018. [Google Scholar] [CrossRef]
- Kuznetsov, V.E.; Tavitov, A.G.; Urzhumtcev, O.D. Hardware Factors Influencing Interlayer Bonding Strength of Parts Obtained by Fused Filament Fabrication. Preprints 2019. [Google Scholar] [CrossRef]
- Kuznetsov, V.E.; Tavitov, A.G.; Urzhumtsev, O.D.; Mikhalin, M.V.; Solonin, A.N. Design and Fabrication of Strong Parts from Poly (Lactic Acid) with a Desktop 3D Printer: A Case with Interrupted Shell. Polymers 2019, 11, 760. [Google Scholar] [CrossRef] [PubMed]
- Cura 15.0x branch. Available online: https://github.com/daid/LegacyCura (accessed on 8 May 2019).
- Download FLIR Tools. Available online: https://www.flir.com/products/flir-tools/ (accessed on 8 May 2019).
- Enblend/Enfuse—Combine Images with No Fuse. Available online: http://enblend.sourceforge.net (accessed on 8 May 2019).
- Tweak at Z Plugin for Cura 15.xx. Available online: https://github.com/daid/LegacyCura/blob/SteamEngine/plugins/TweakAtZ.py (accessed on 8 May 2019).


| Mode | Layer Thickness, mm | Print Speed, mm/s | Flow Rate, mm3/s | Extrusion Temperature, °C | Fan Speed, % * |
|---|---|---|---|---|---|
| A | 0.3 | 30 | 5.4 | 210 | 100 |
| B | 0.3 | 30 | 5.4 | 250 | 0 |
| C | 0.1 | 60 | 3.6 | 210 | 100 |
| D | 0.1 | 60 | 3.6 | 250 | 0 |
| E | 0.3 | 30 | 5.4–7.02 | 210–250 | 0–100 |
| Shape | Mode | Printing Time, hh:mm | Mass, g | Strength, N | Relative Strength, N/g |
|---|---|---|---|---|---|
| 1 | A | 1:59 | 36.9 (0.2) | 483 (47) | 13.1 |
| B | 2:01 | 37.5 (0.2) | 420 (36) | 11.2 | |
| C | 3:13 | 37.0 (0.2) | 433 (32) | 11.7 | |
| D | 3:14 | 37.6 (0.2) | 412 (28) | 10.9 | |
| 2 | A | 2:01 | 37.2 (0.2) | 906 (52) | 24.4 |
| B | 2:02 | 38.6 (0.2) | 1382 (85) | 35.8 | |
| C | 3:23 | 37.6 (0.1) | 1280 (64) | 34.0 | |
| D | 3:24 | 39.1 (0.2) | 1420 (34) | 36.3 | |
| 3 | A | 1:48 | 27.0 (0.1) | 427 (26) | 15.8 |
| B | 1:49 | 28.0 (0.1) | 701 (55) | 25.0 | |
| C | 3:34 | 27.7 (0.1) | 620 (72) | 22.4 | |
| D | 3:36 | 28.5 (0.1) | 787 (44) | 27.6 | |
| 4 | A | 1:37 | 27.6 (0.1) | 662 (51) | 24.0 |
| B | 1:39 | 28.7 (0.1) | 875 (54) | 30.5 | |
| C | 2:57 | 28.3 (0.1) | 758 (21) | 26.8 | |
| D | 2:58 | 29.1 (0.1) | 923 (30) | 31.7 | |
| 5 | A | 1:46 | 30.3 (0.2) | 1026 (72) | 33.9 |
| B | 1:47 | 30.9 (0.1) | 1596 (32) | 51.7 | |
| C | 3:18 | 30.8 (0.1) | 1343 (46) | 43.6 | |
| D | 3:18 | 31.6 (0.2) | 1695 (68) | 53.6 |
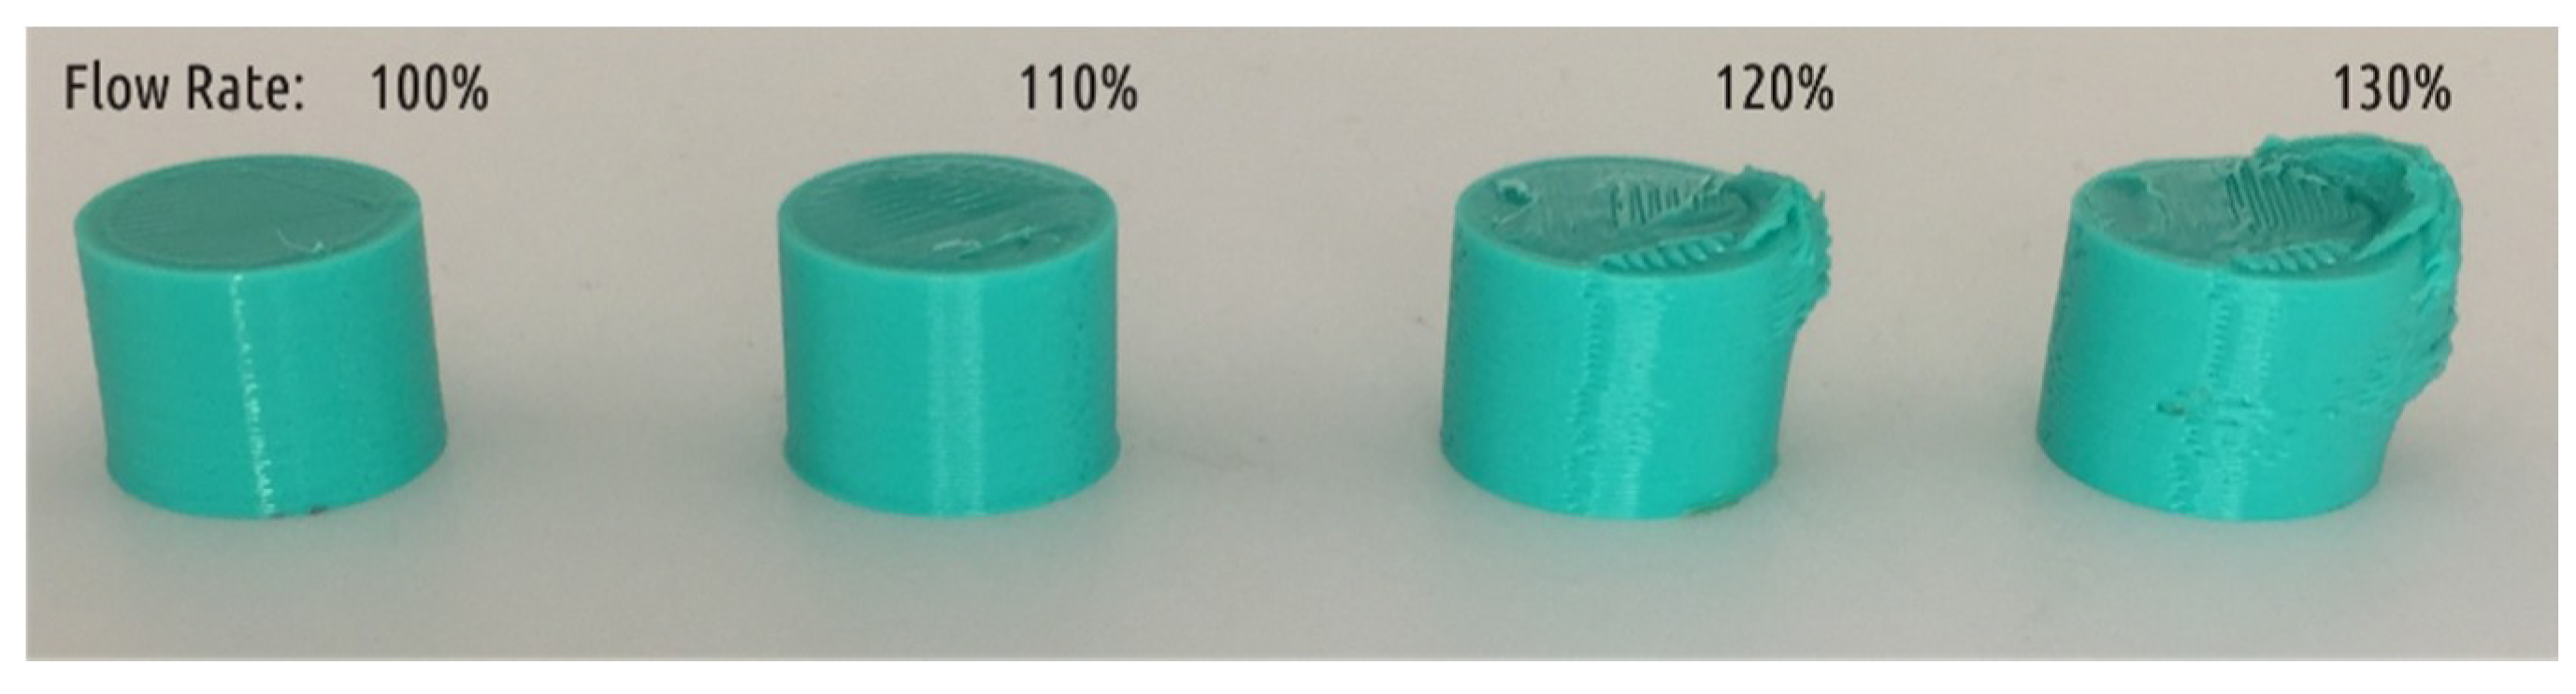
| Flow Rate, % | Actual Mass, g | Extrusion Efficiency | Actual Diameter, mm |
|---|---|---|---|
| 100 | 5.61 (0.1) | 0.93 | 19.7 (0.1) |
| 110 | 5.91 (0.1) | 0.98 | 20.2 (0.1) |
| 120 | 6.37 (0.1) | 1.06 | 20.6 (0.1)* |
| 130 | 6.87 (0.2) | 1.14 | 20.7 (0.1)* |
| Layer # | tE, °C | Fan Speed, % | Flow rate, % | Comment |
|---|---|---|---|---|
| 1–6 | 210 | 0 | 100 | Initial printing on the hot plate |
| 6–21 | 210 | 30 | 100 | Printing the unstressed part of the boss |
| 22–23 | 210 | 100 | 100 | “Bridging” |
| 24–31 | 250 | 0 | 105 | Printing the stressed part of the boss |
| 32 | 250 | 0 | 115 | Top of the boss part |
| 33–49 | 250 | 0 | 130 | Printing the critical zone |
| 50–69 | 250 | 14 | 130 | Printing the critical zone, providing some cooling to avoid defects formation |
| 70–99 | 250 | 14 | 120 | Leaving the critical zone |
| 100–129 | 250 | 24 | 110 | Printing non critical part of the shaft |
| 130–200 | 250 | 24 | 100 | Printing non critical part of the shaft |
| Shape | 2 | 3 | 4 | 5 | Model |
|---|---|---|---|---|---|
| Mode A, strength, N | 906 (20.1) | 427 (14.2) | 662 (18.4) | 1026 (23.5) | - |
| Mode C, strength, N | 1280 (22.6) | 620 (19.3) | 758 (18.8) | 1343 (22.2) | - |
| Strength bonus | 1.41 | 1.45 | 1.15 | 1.31 | 1.33 |
| Parameter | Shape 5, Mode A | Shape 5, Mode B |
|---|---|---|
| Calculated mass, g | 36.0 | |
| Actual mass, g | 30.3 (0.2) | 32.3 (0.2) |
| Extrusion efficiency | 0.84 | 0.90 |
| Sublayer temperature, ° C | 58 | 90 |
| Calculated strength, MPa | 70.9 (0.9) | 104.2 (1.1) |
| Actual sample strength, N | 1026 (23.5) | 1596 (31.2) |
| Estimated strength bonus | 1.41 | |
| Actual strength bonus | 1.47 | |
© 2019 by the authors. Licensee MDPI, Basel, Switzerland. This article is an open access article distributed under the terms and conditions of the Creative Commons Attribution (CC BY) license (http://creativecommons.org/licenses/by/4.0/).
Share and Cite
Kuznetsov, V.E.; Tavitov, A.G.; Urzhumtsev, O.D.; Korotkov, A.A.; Solodov, S.V.; Solonin, A.N. Desktop Fabrication of Strong Poly (Lactic Acid) Parts: FFF Process Parameters Tuning. Materials 2019, 12, 2071. https://doi.org/10.3390/ma12132071
Kuznetsov VE, Tavitov AG, Urzhumtsev OD, Korotkov AA, Solodov SV, Solonin AN. Desktop Fabrication of Strong Poly (Lactic Acid) Parts: FFF Process Parameters Tuning. Materials. 2019; 12(13):2071. https://doi.org/10.3390/ma12132071
Chicago/Turabian StyleKuznetsov, Vladimir E., Azamat G. Tavitov, Oleg D. Urzhumtsev, Artem A. Korotkov, Sergey V. Solodov, and Alexey N. Solonin. 2019. "Desktop Fabrication of Strong Poly (Lactic Acid) Parts: FFF Process Parameters Tuning" Materials 12, no. 13: 2071. https://doi.org/10.3390/ma12132071
APA StyleKuznetsov, V. E., Tavitov, A. G., Urzhumtsev, O. D., Korotkov, A. A., Solodov, S. V., & Solonin, A. N. (2019). Desktop Fabrication of Strong Poly (Lactic Acid) Parts: FFF Process Parameters Tuning. Materials, 12(13), 2071. https://doi.org/10.3390/ma12132071