Towards Functional Parts by Binder Jetting Calcium-Sulphate with Thermal Treatment Post-Processing

 , and
, and 
Abstract
:
1. Introduction
2. Materials and Methods
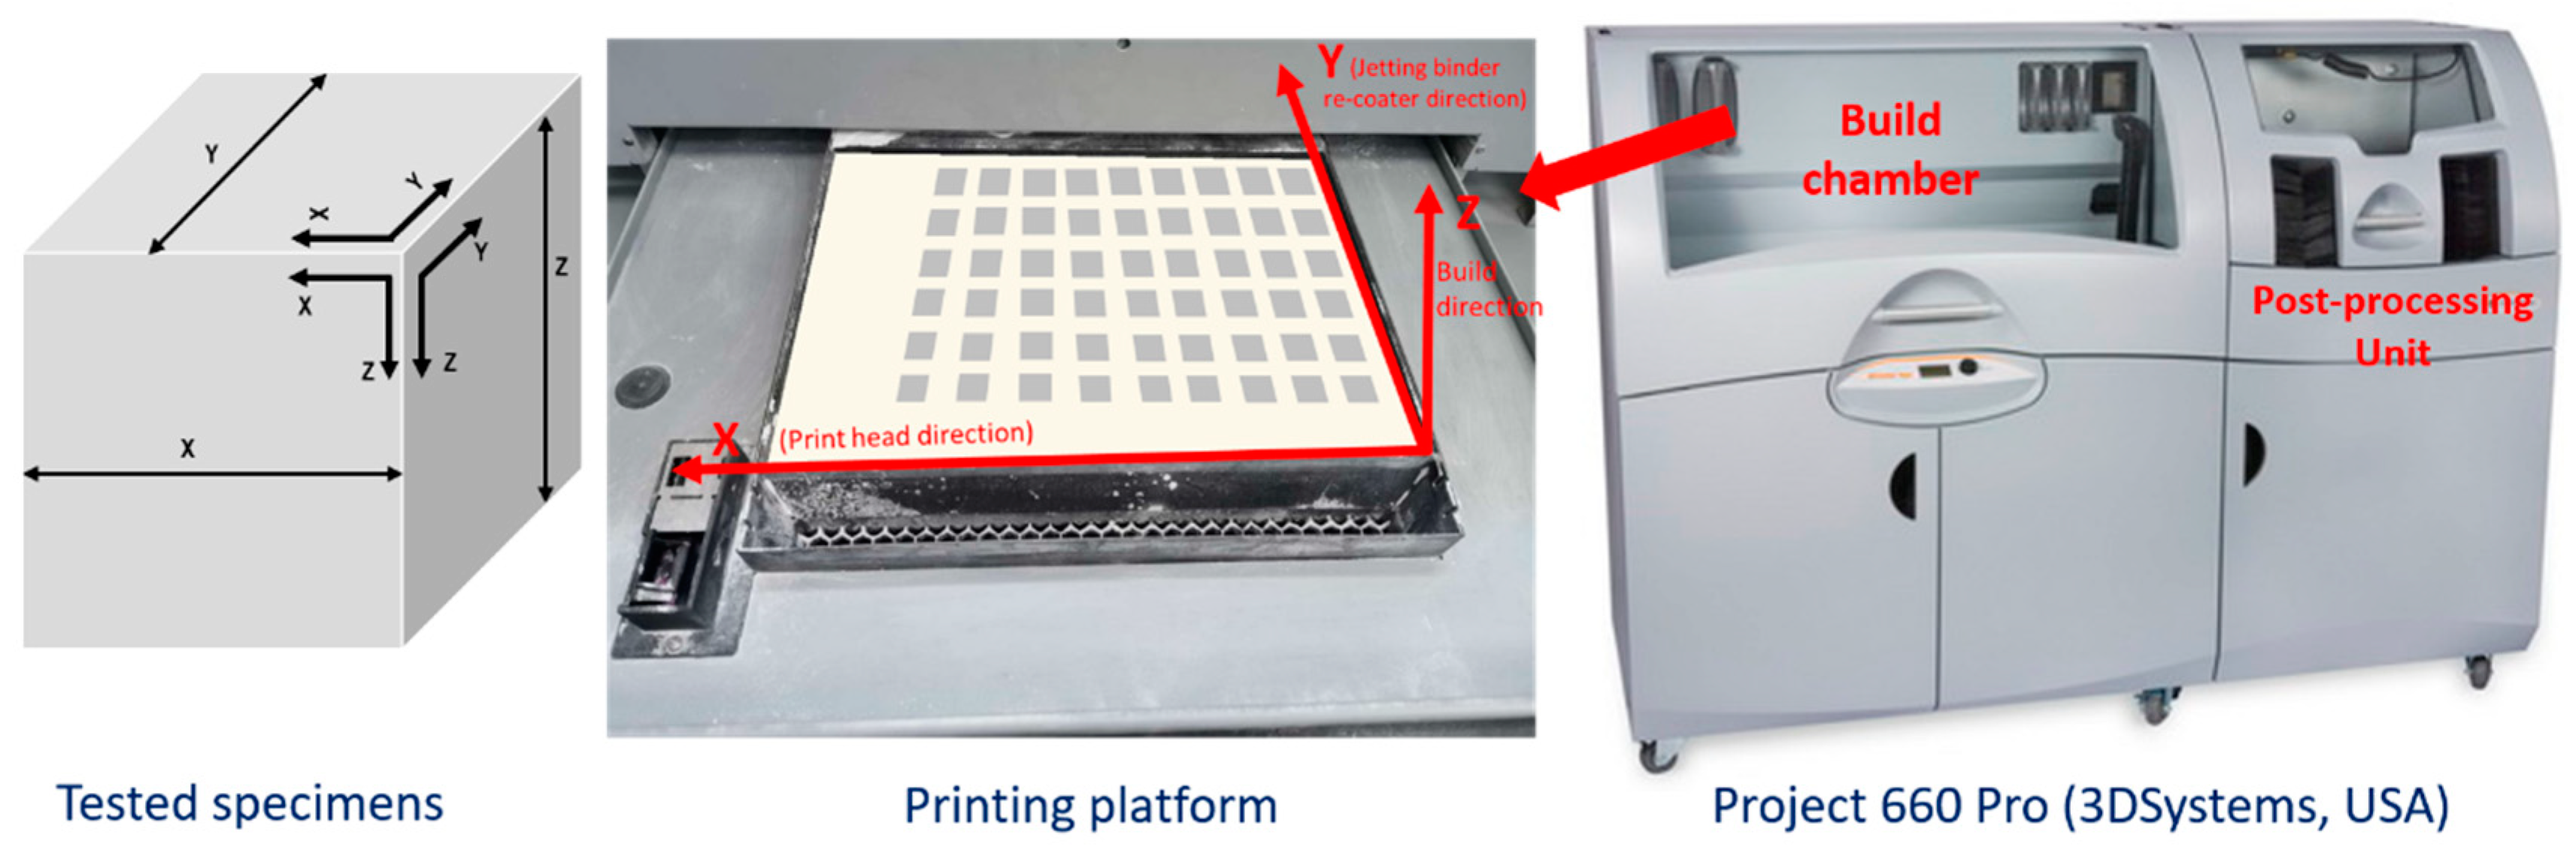
2.1. Manufacturing Test Specimens and Raw Materials
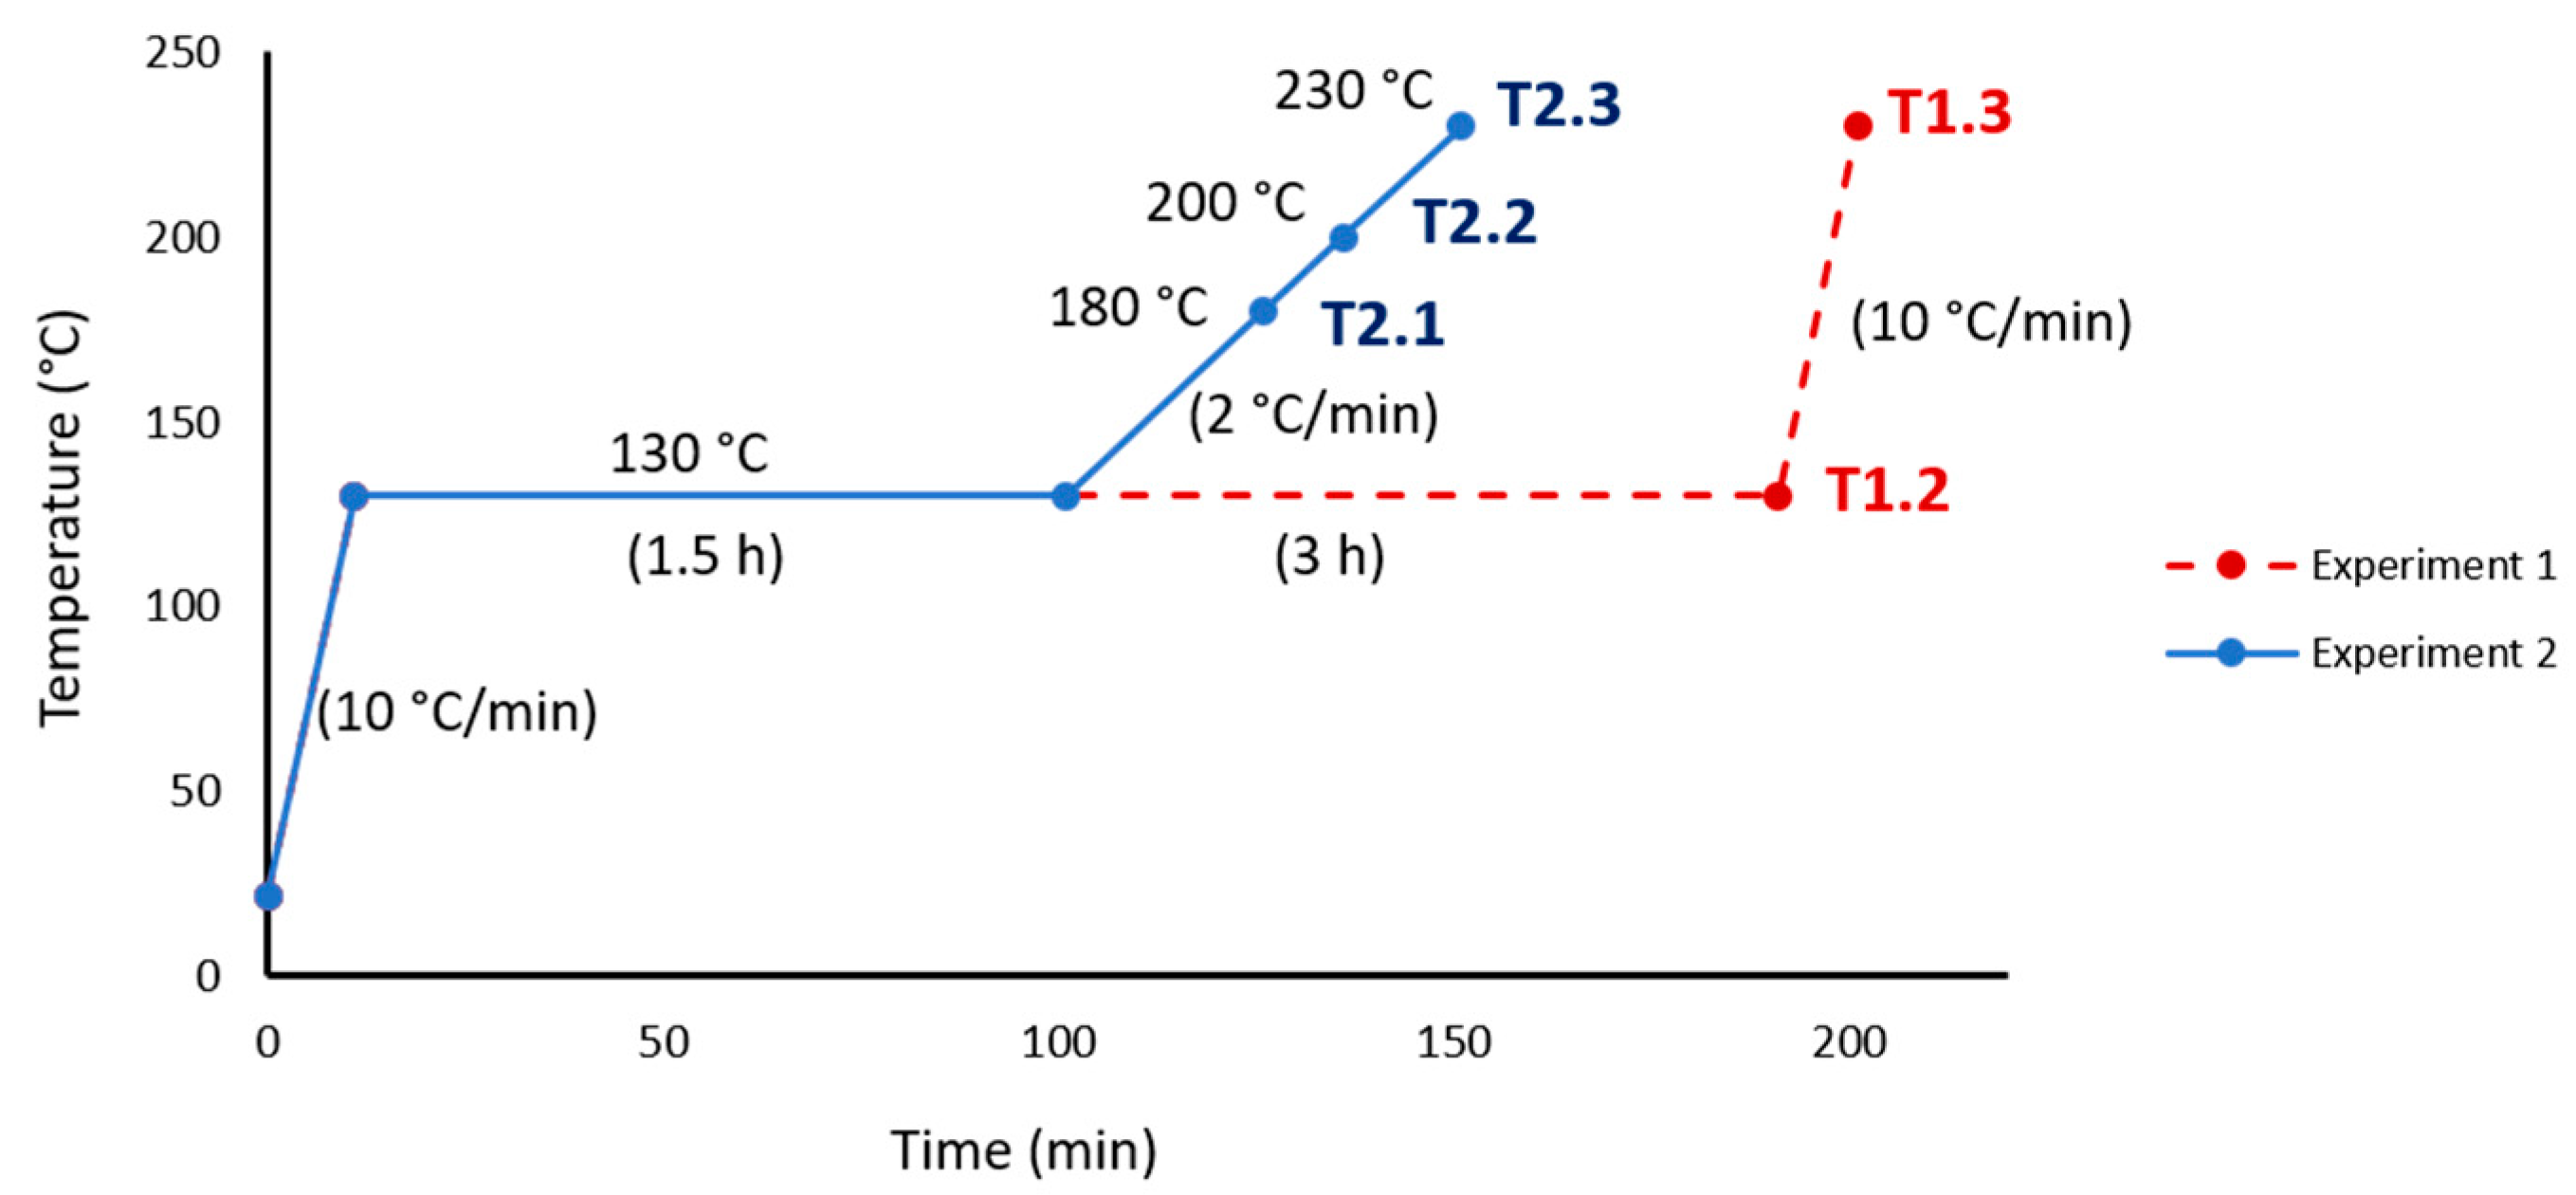
2.2. Specimens Preparation
2.3. Equipment and Tests Performed
3. Results and Discussion
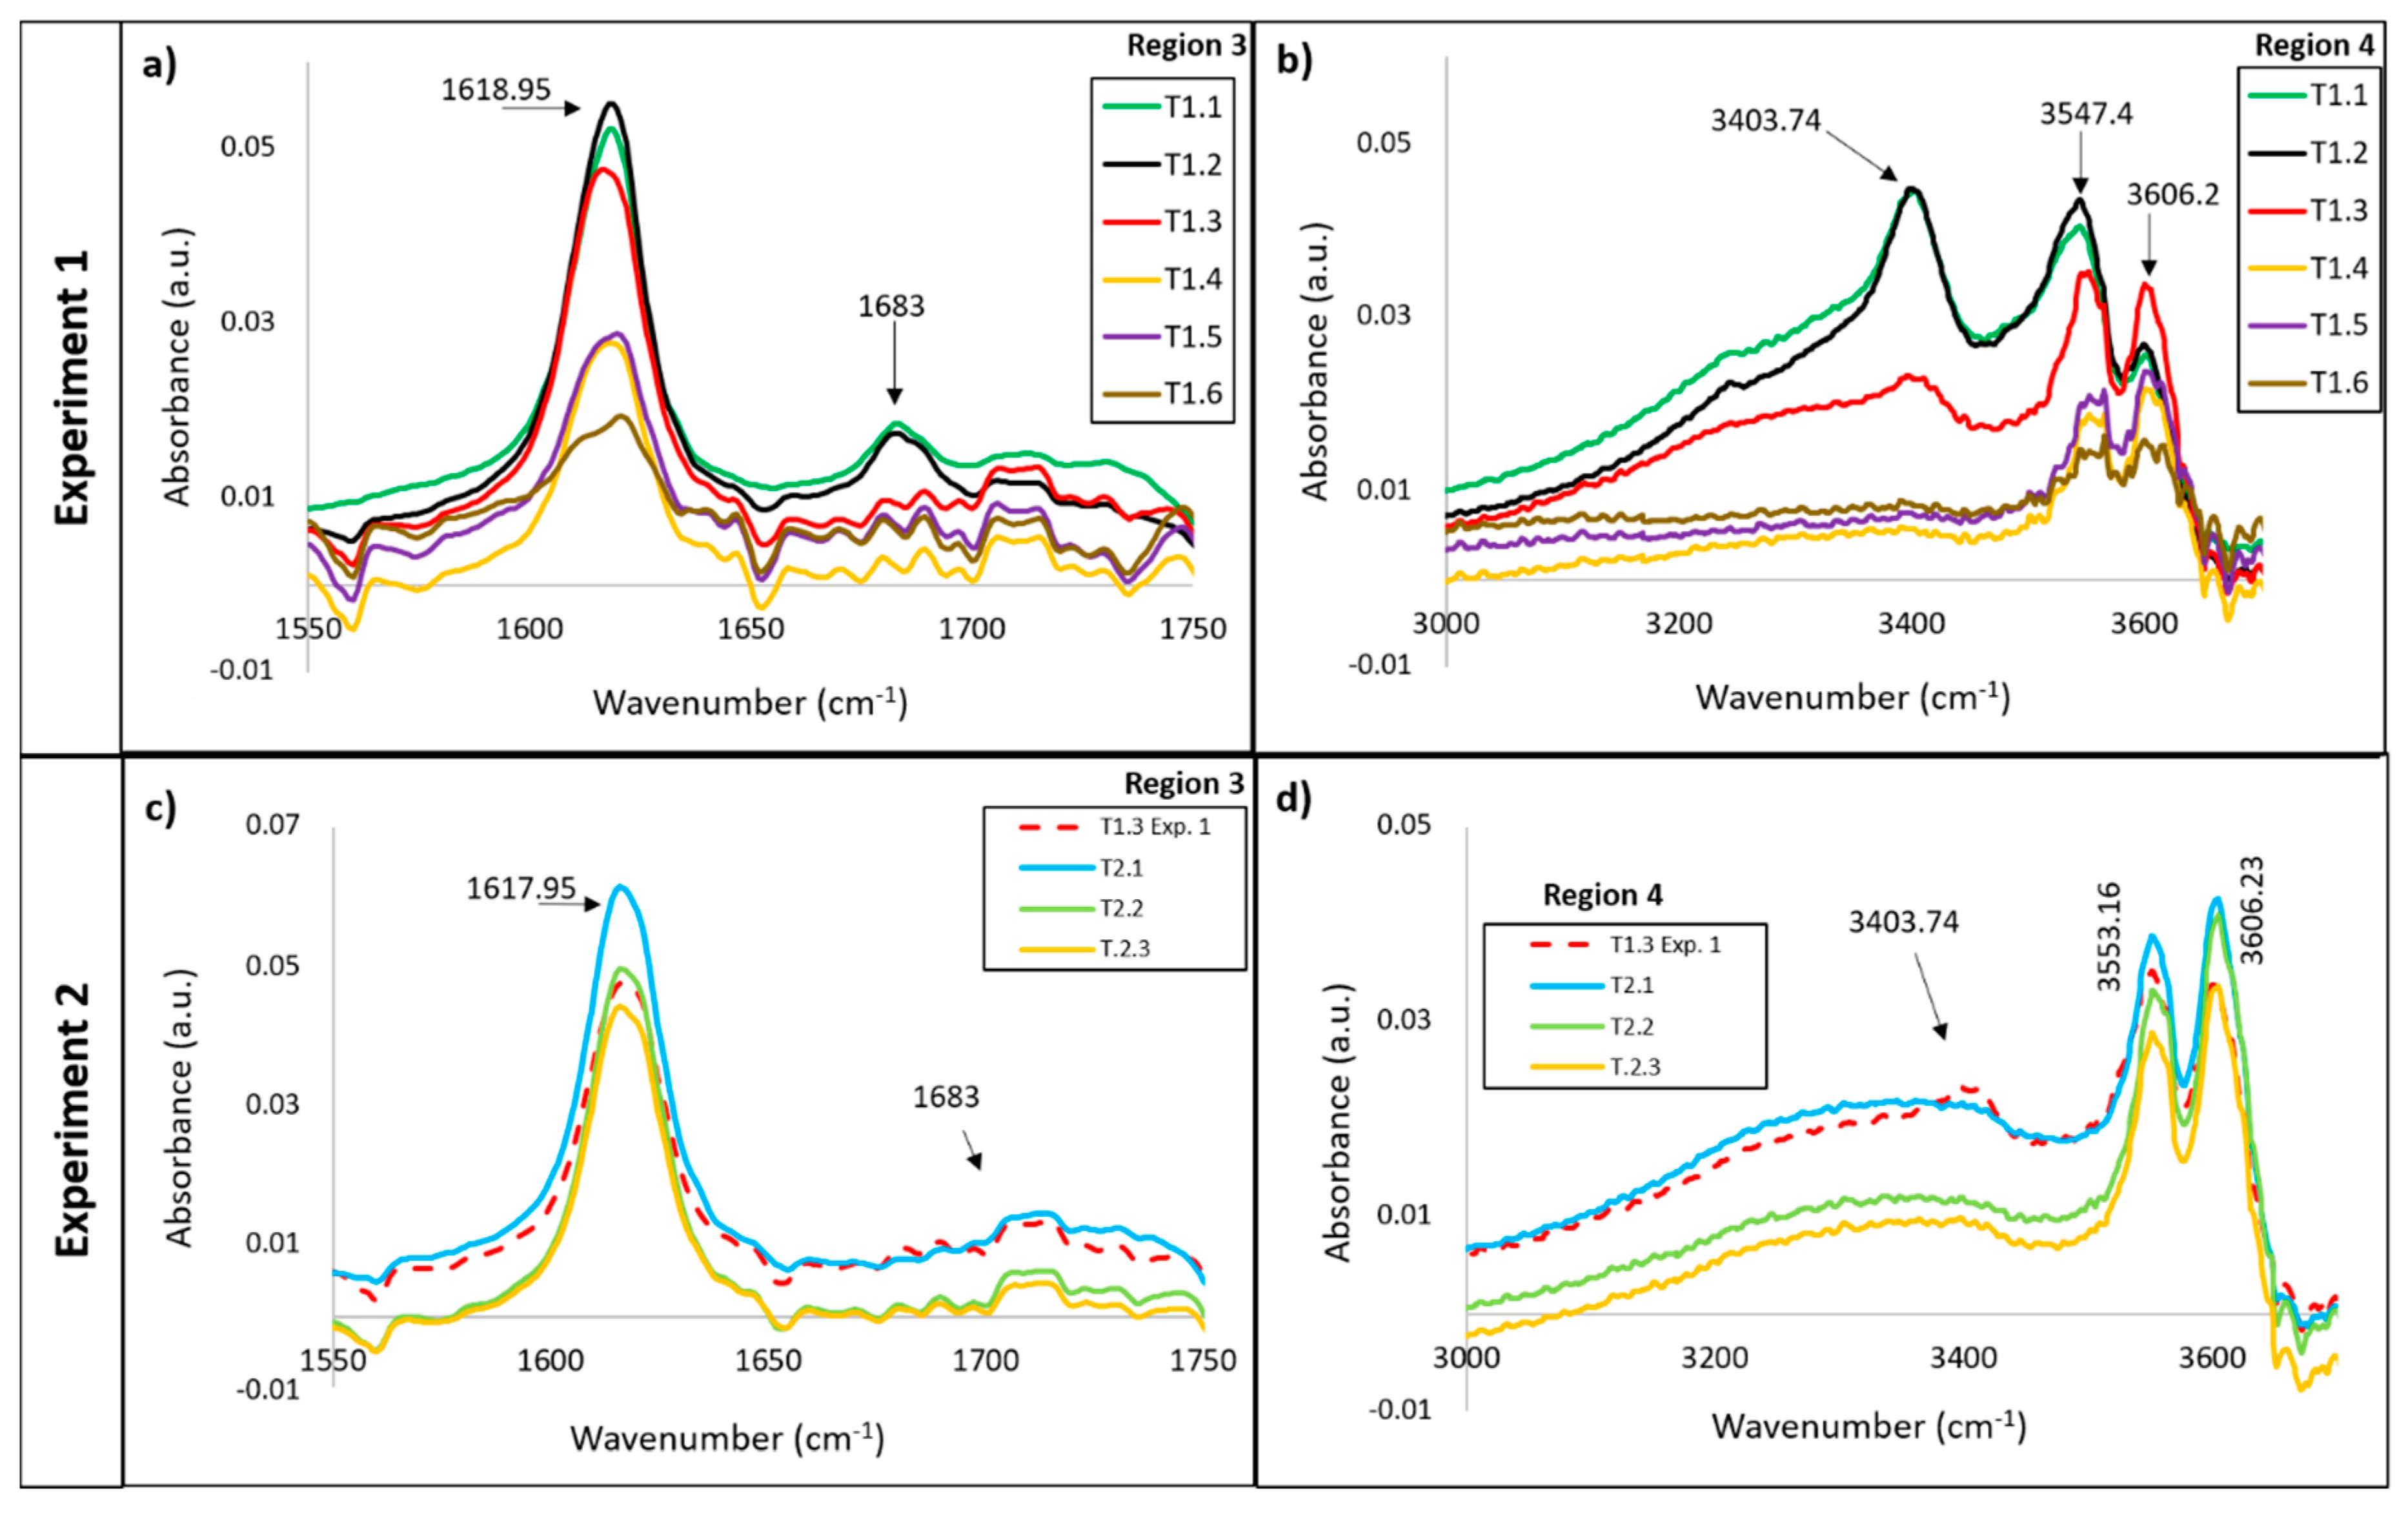
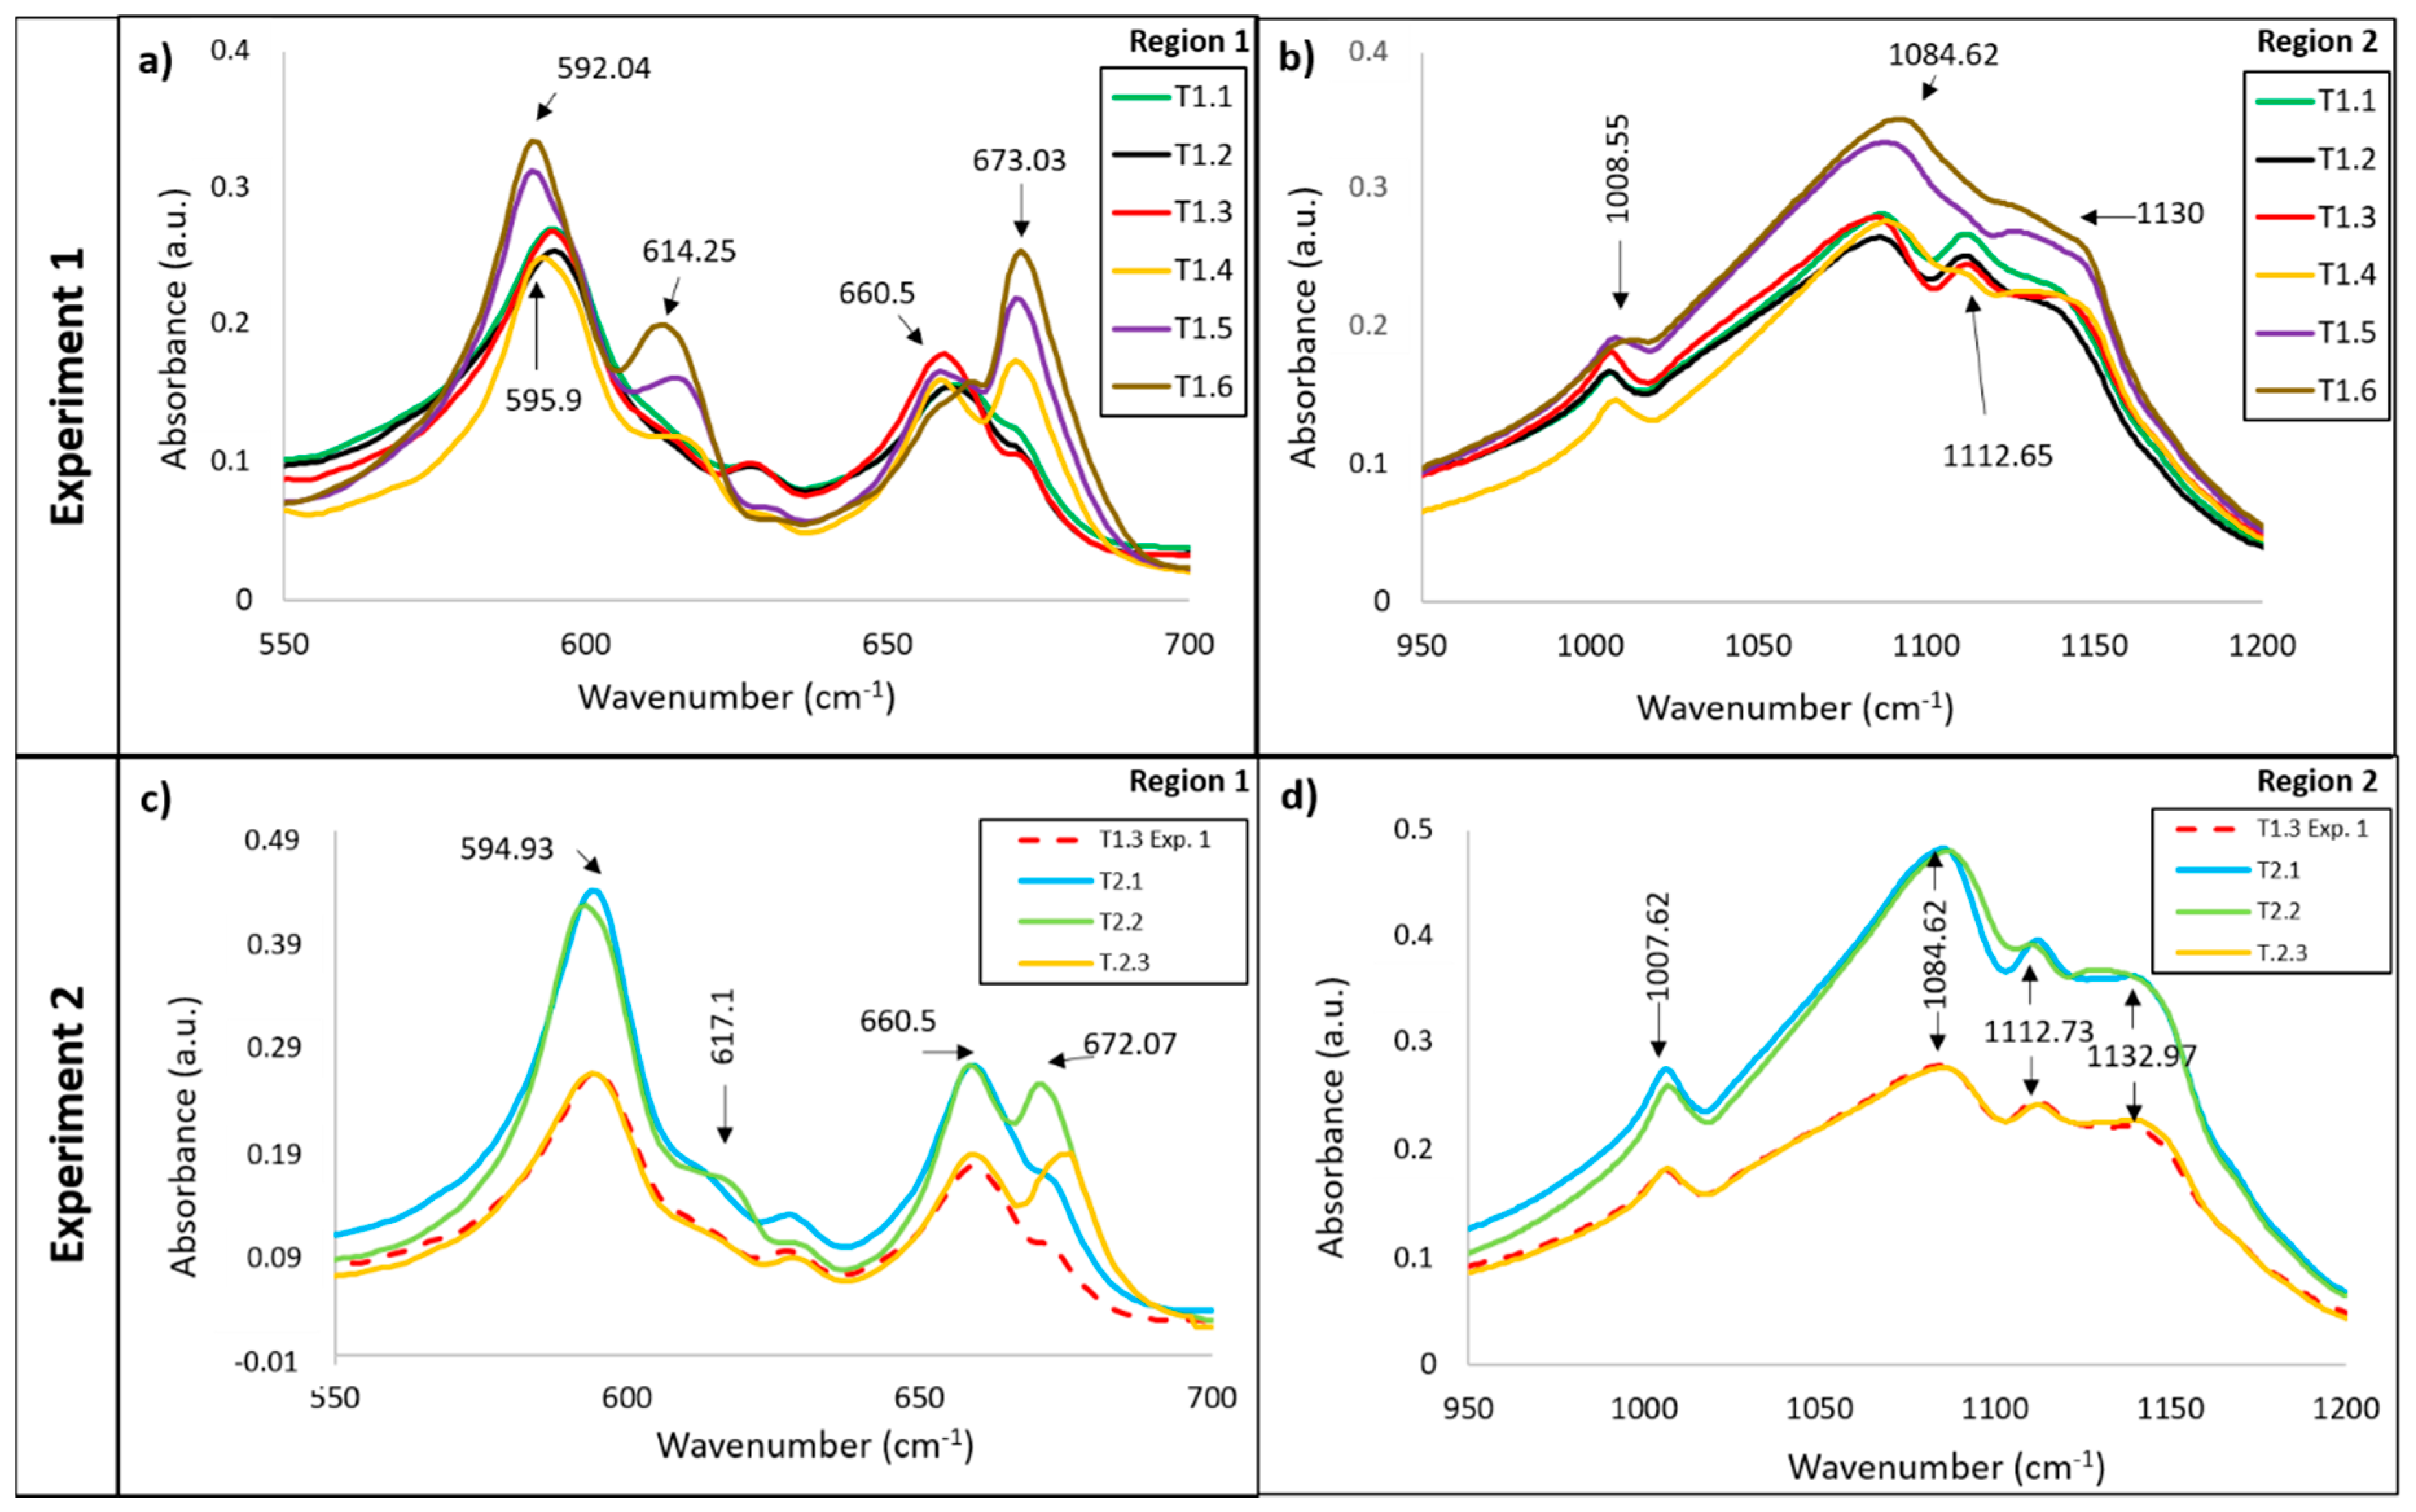
3.1. Infrared Analysis
- (a)
- Bending vibration of the SO4 tetrahedron in the 550–700 cm−1 range
- (b)
- Stretching vibration of the SO4 tetrahedron in the 1000–1200 cm−1 range
- (c)
- Bending vibration of O–H in the 1500–1700 cm−1 range
- (d)
- Stretching vibration of O–H in the 3000–3800 cm−1 range
3.1.1. Vibrations Bands of the H2O Molecule
3.1.2. Vibrations Bands of the SO42− Anion
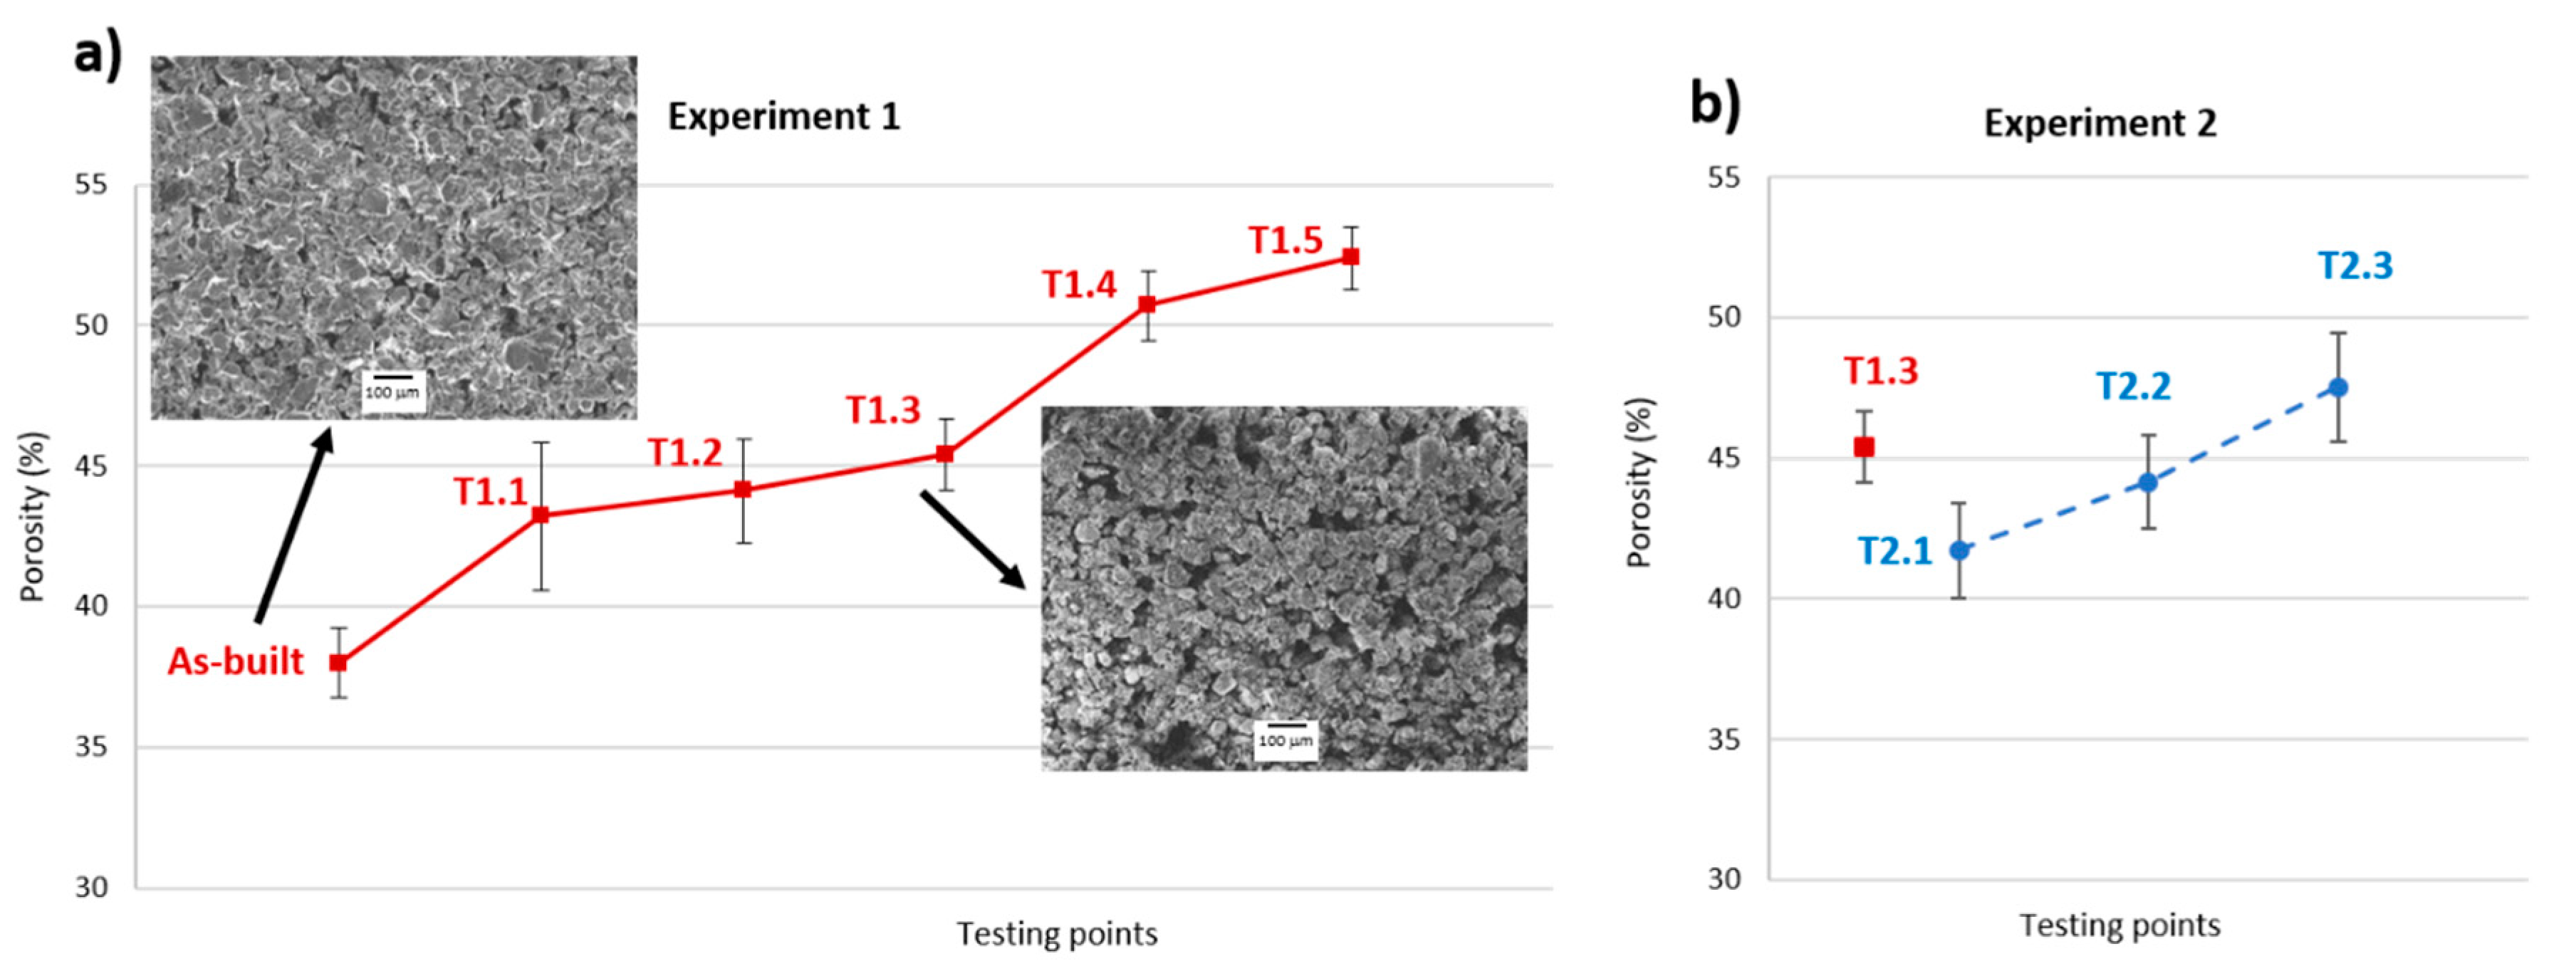
3.2. Weight Loss and Porosity
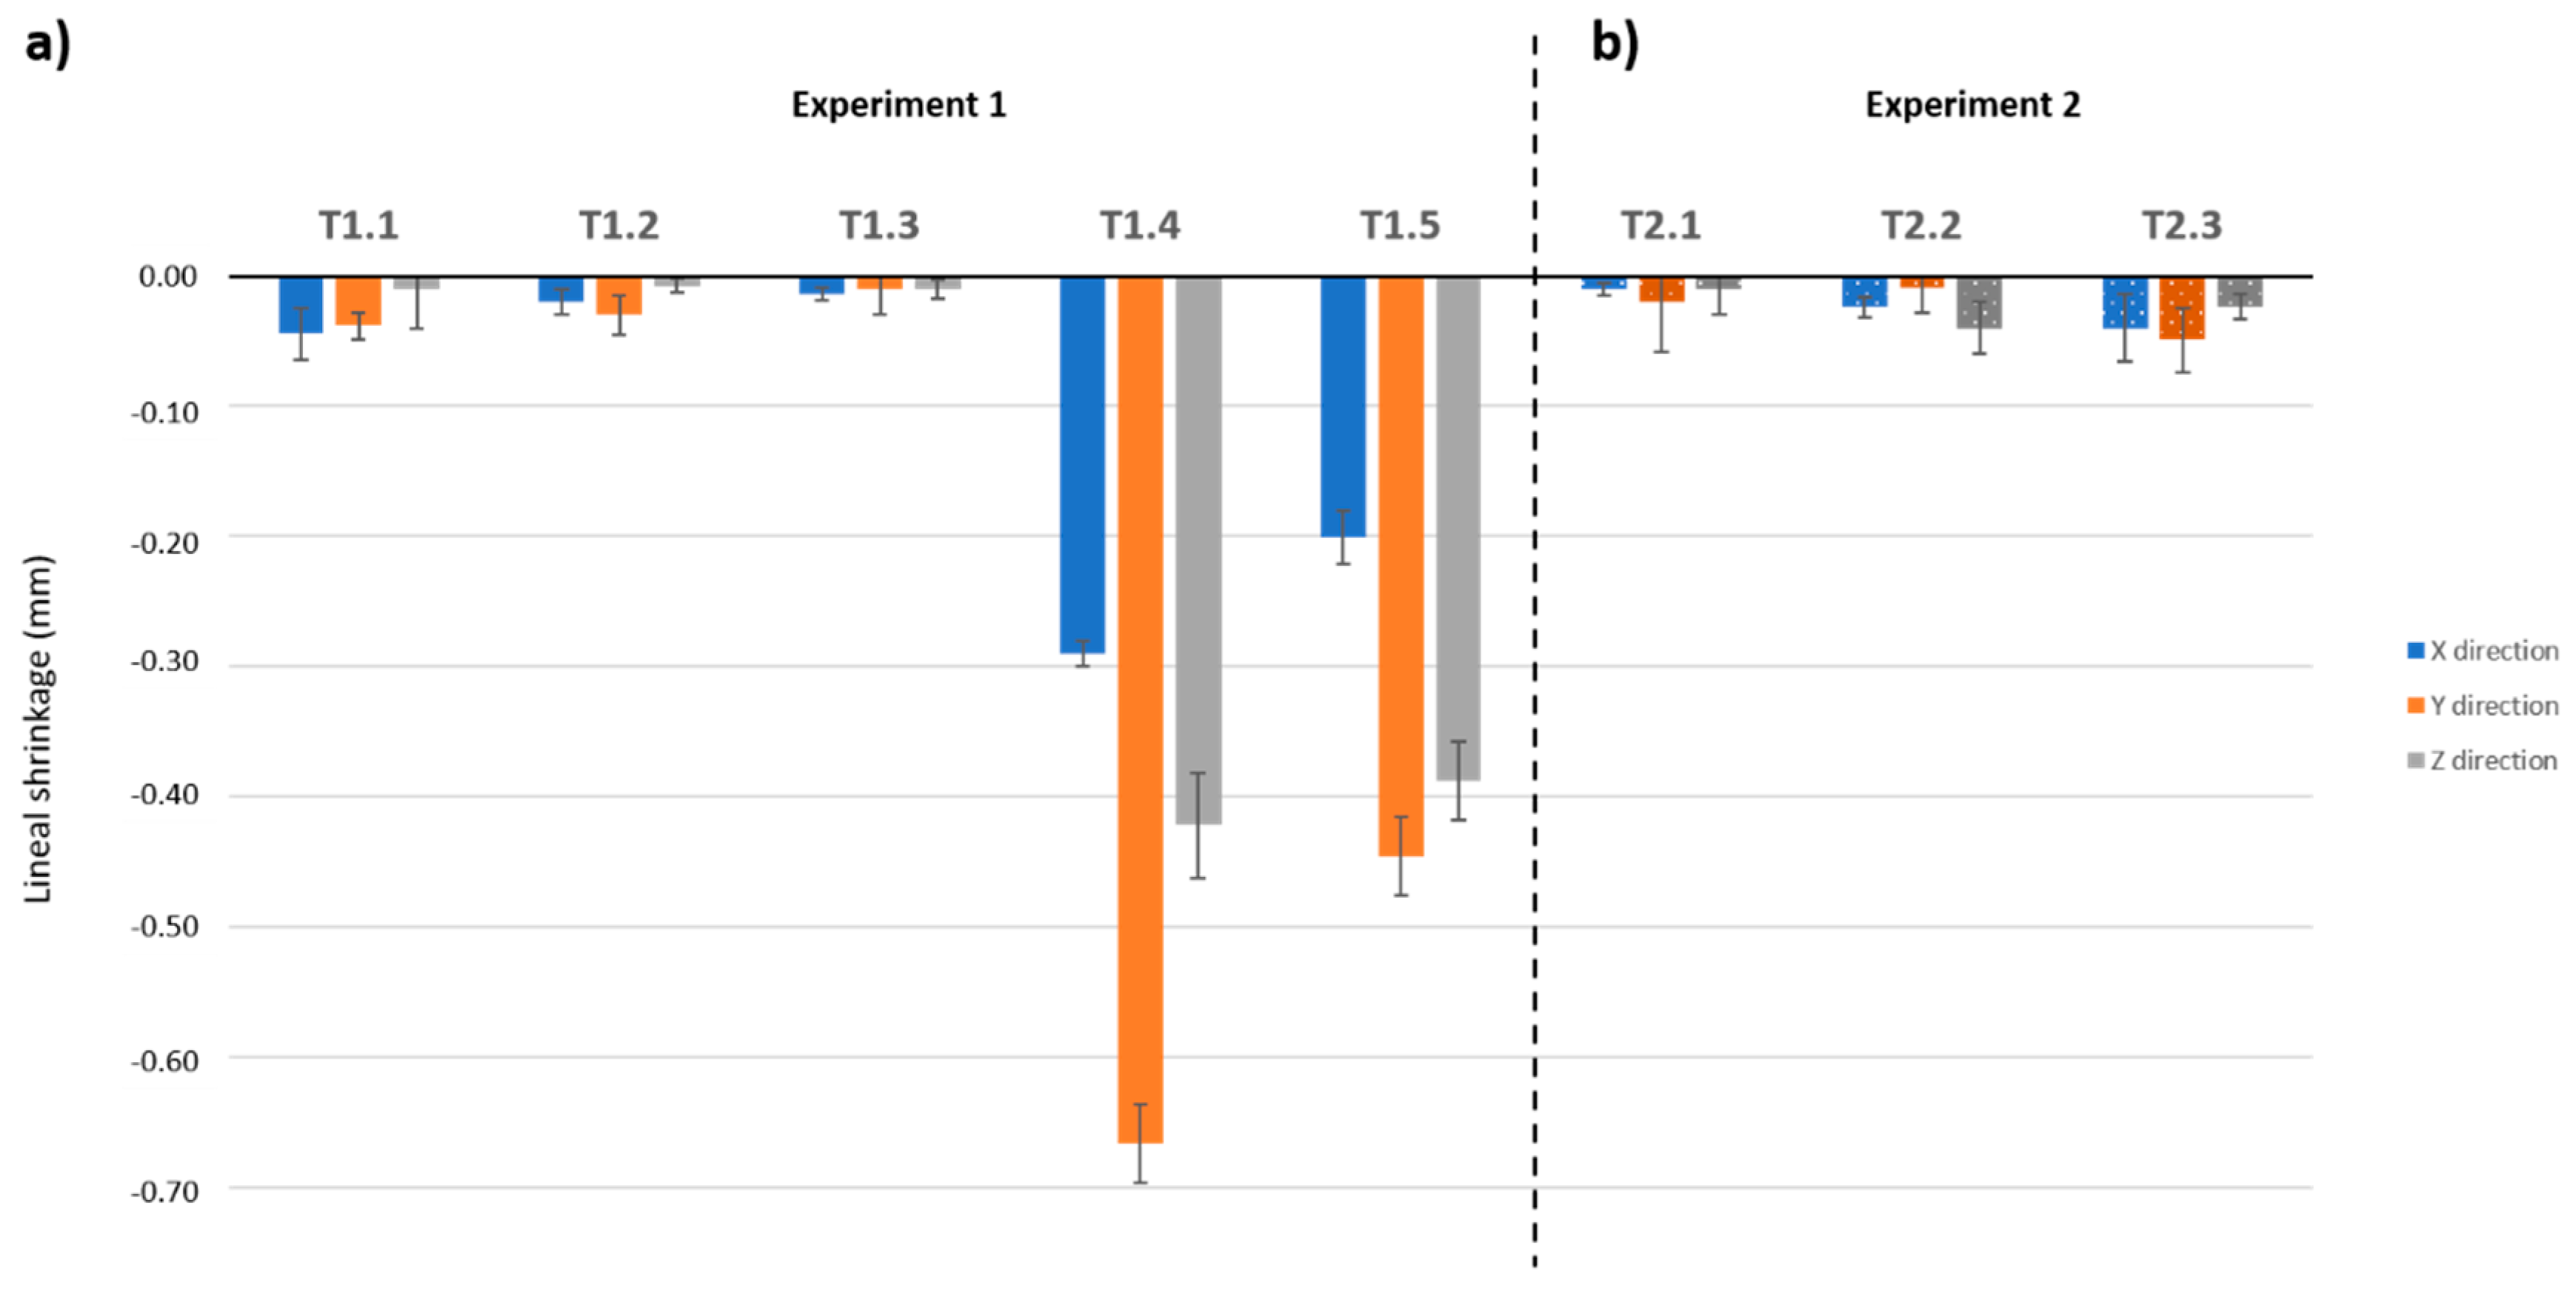
3.3. Dimensions
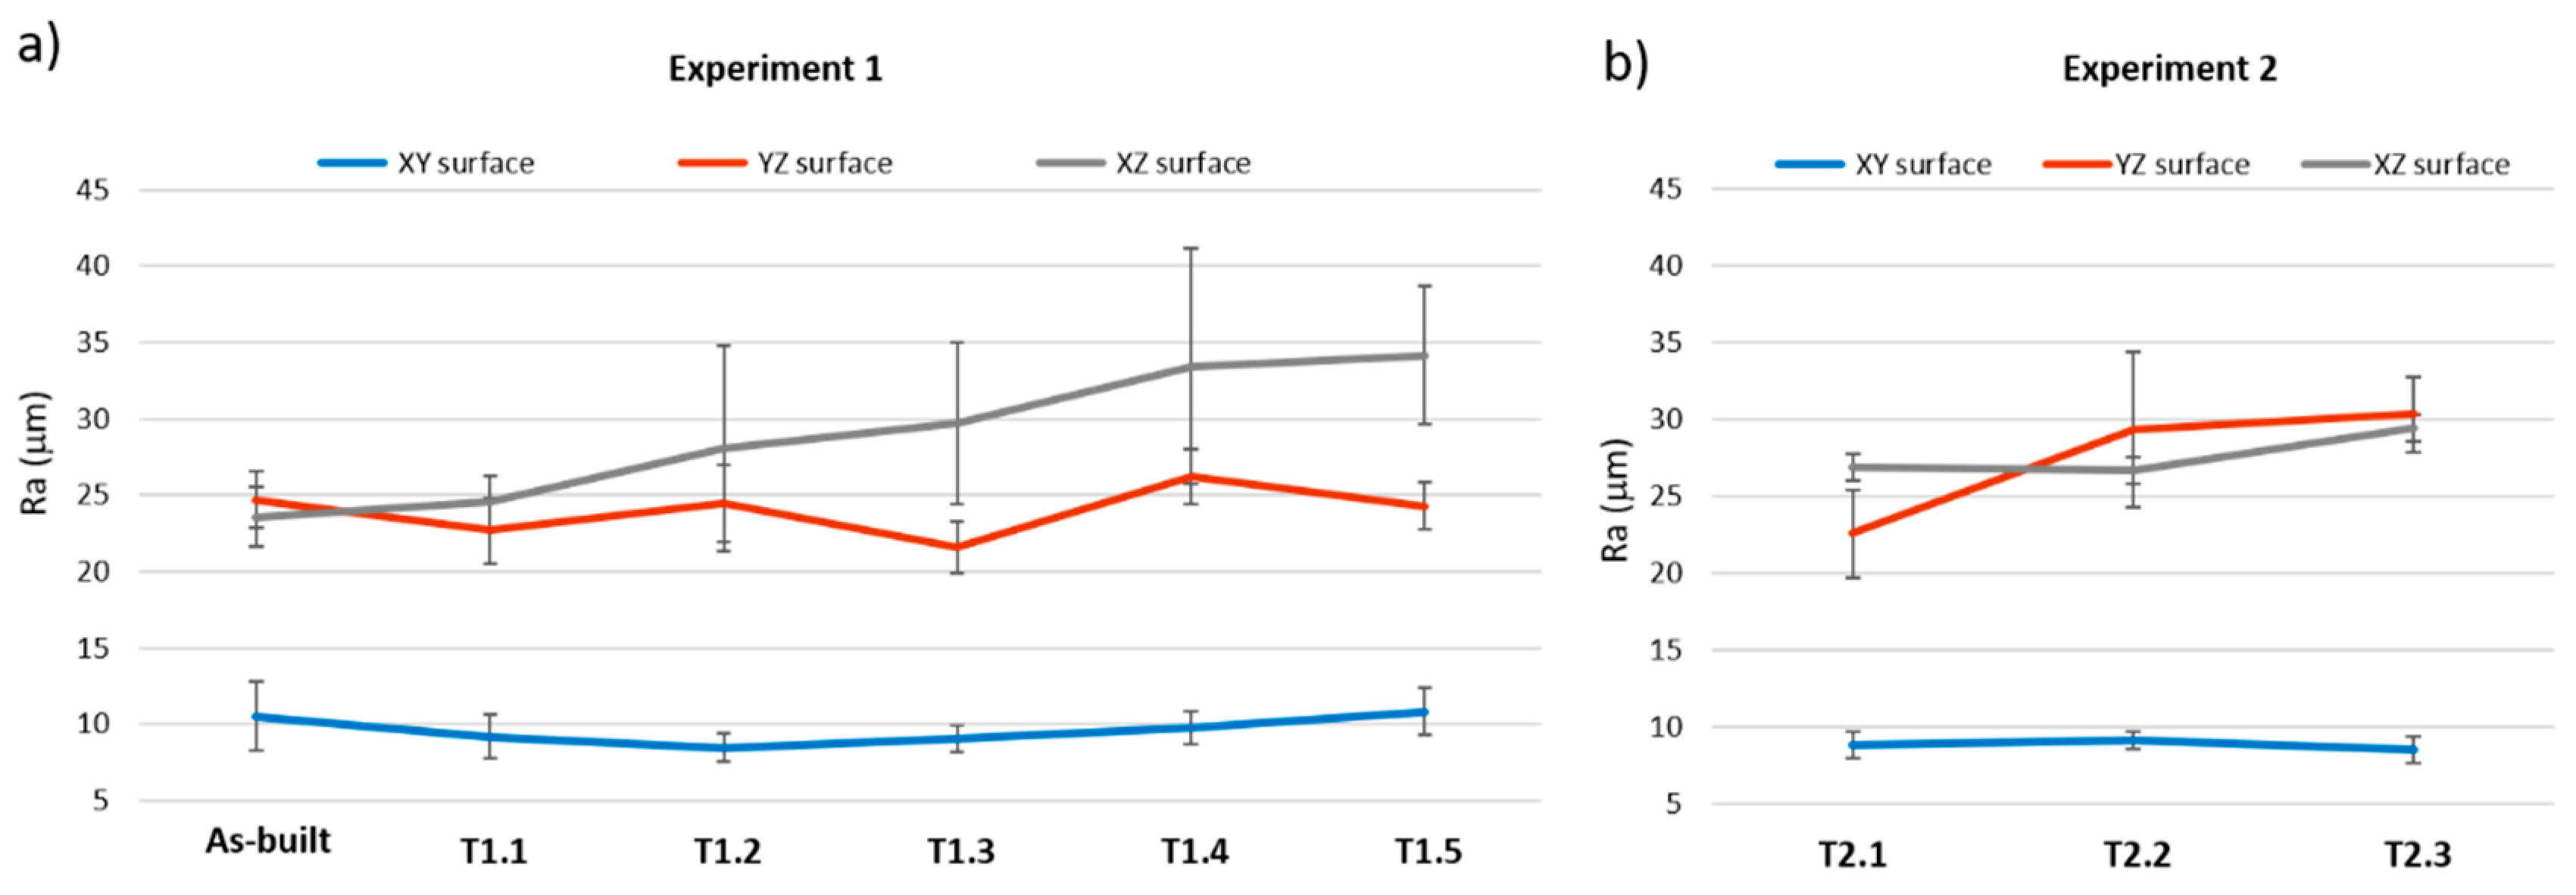
3.4. Roughness
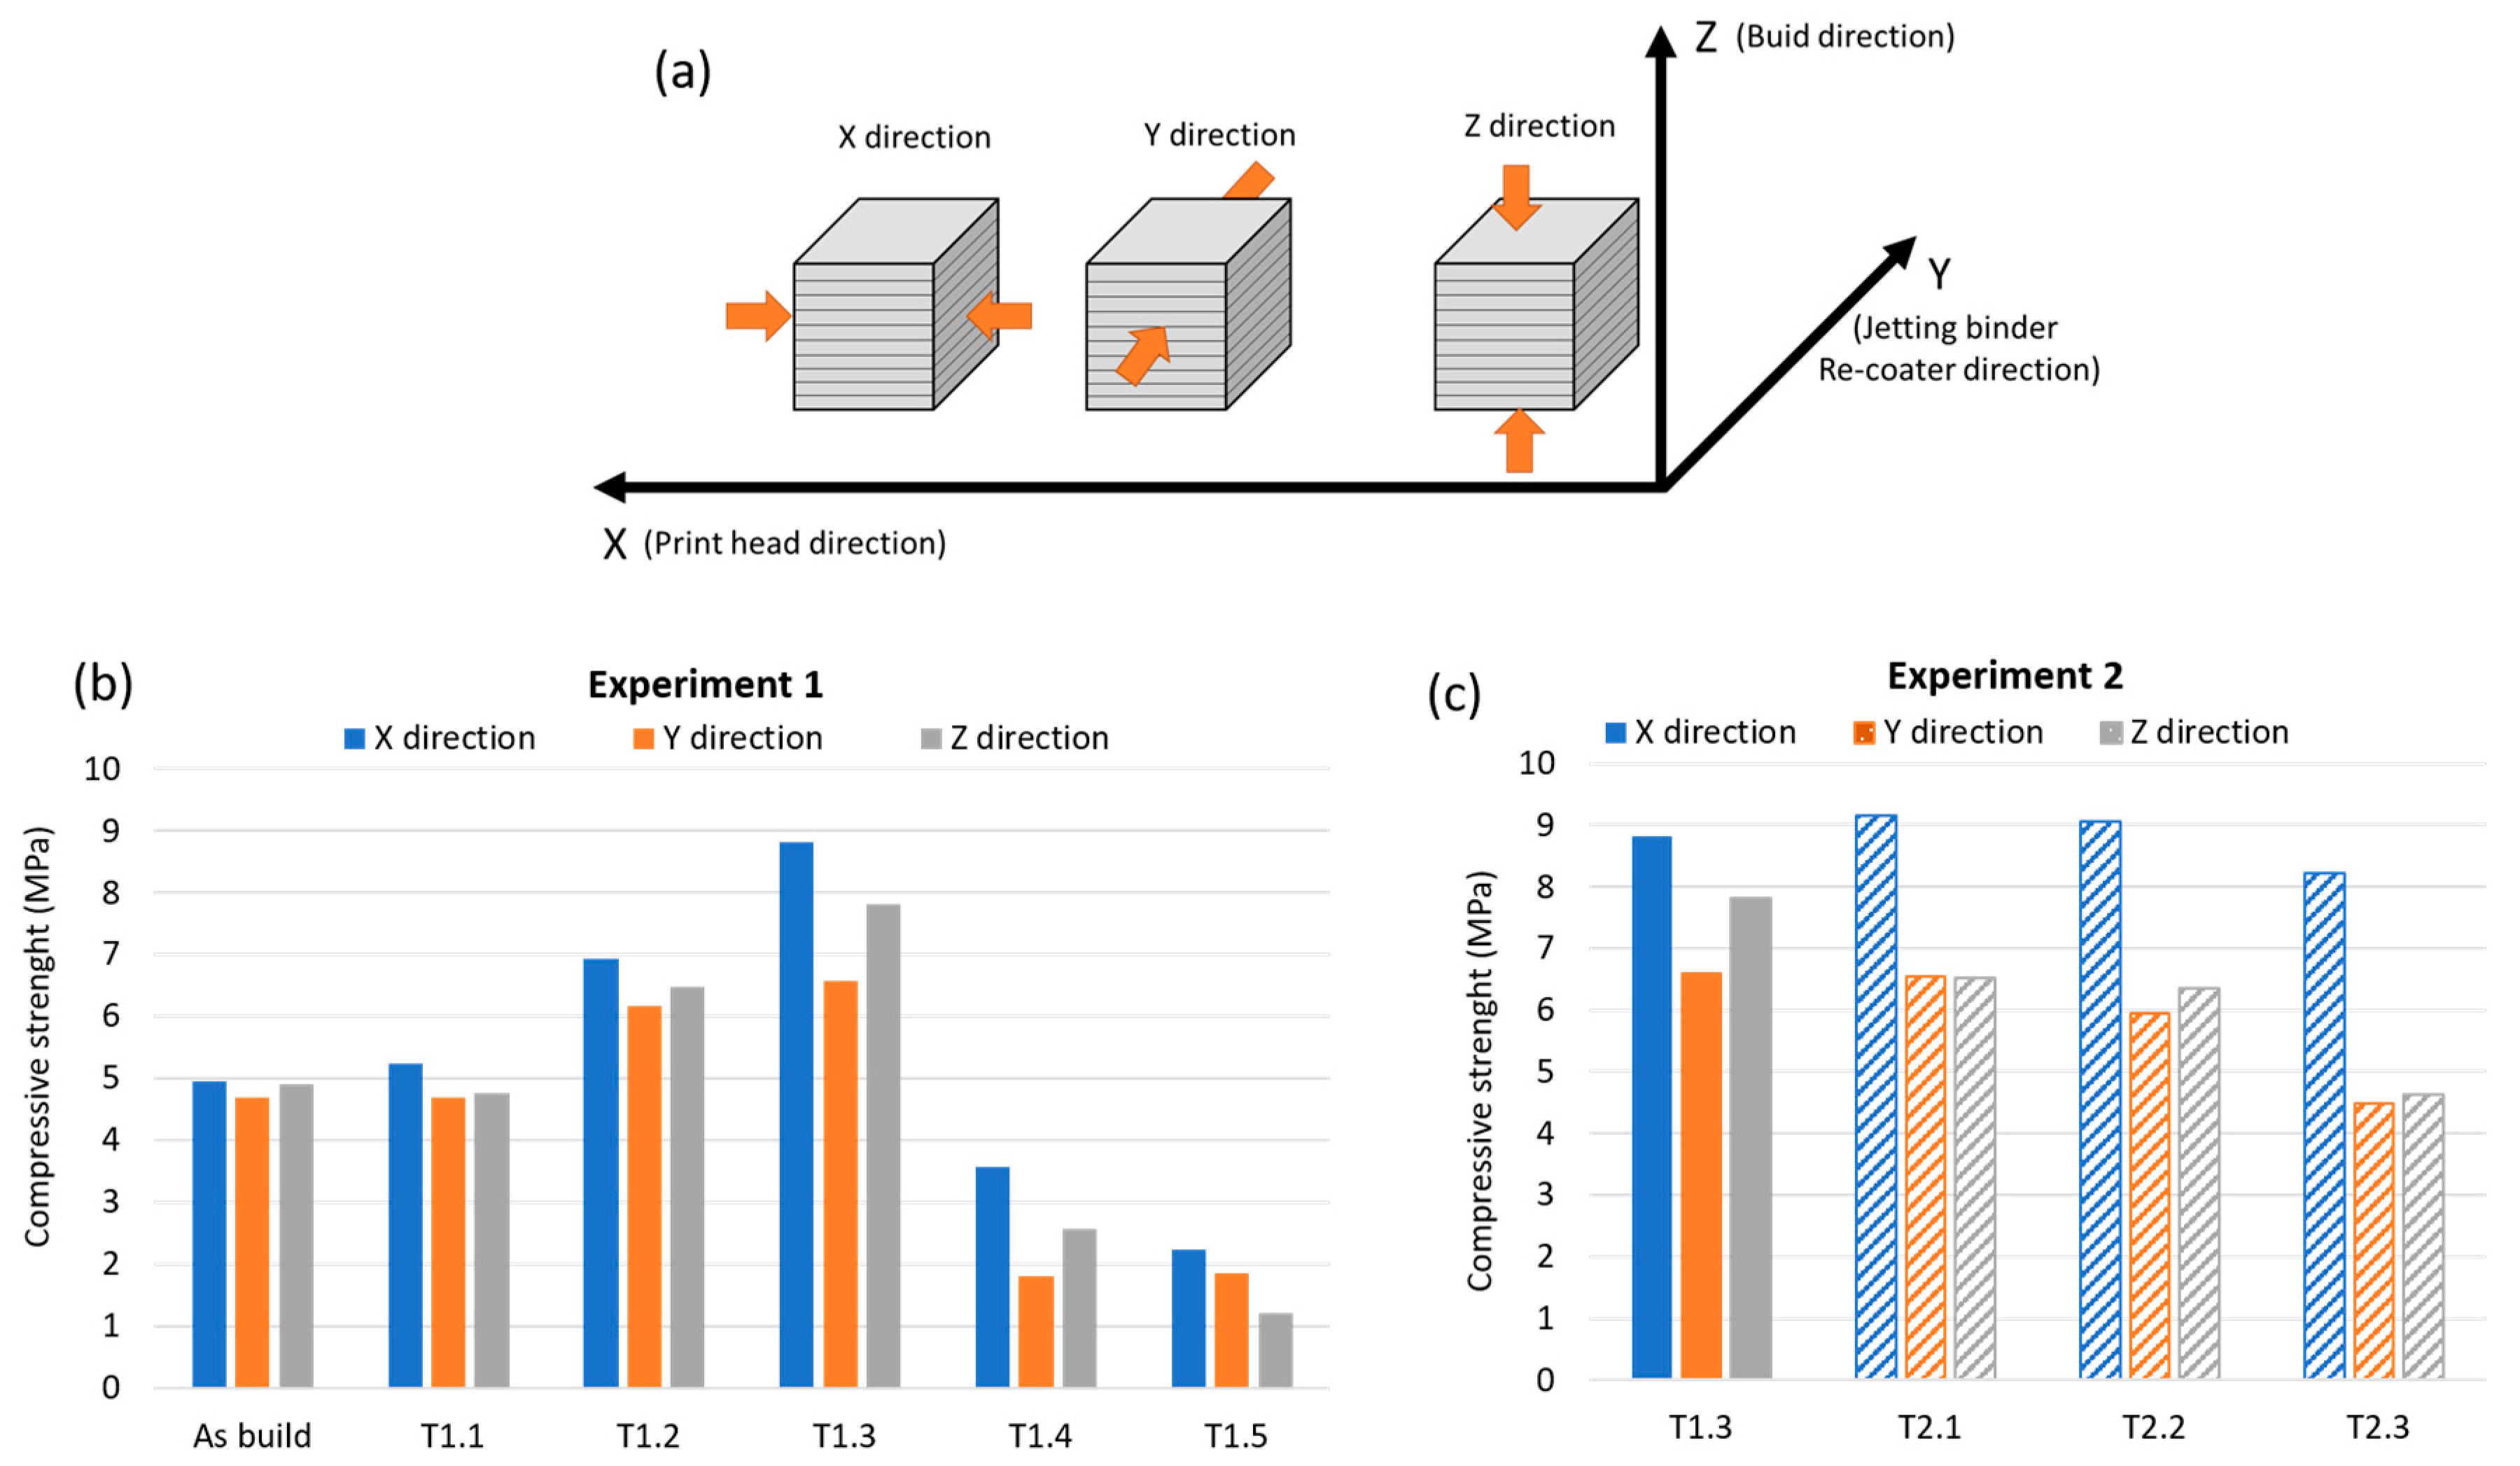
3.5. Compression Strength
4. Conclusions
Author Contributions
Funding
Conflicts of Interest
References
- Lee, J.-Y.; An, J.; Chua, C.K. Fundamentals and applications of 3D printing for novel materials. Appl. Mater. Today 2017, 7, 120–133. [Google Scholar] [CrossRef]
- America Makes & ANSI Additive Manufacturing Standardization Collaborative (AMSC). Standardization Roadmap for Additive Manufacturing; AMSC: New York, NY, USA, 2017. [Google Scholar]
- ISO 17296-2:2015. Additive manufacturing-General principles—Part 2: Overview of Process Categories and Feedstock; ISO—International Organization of Standards: Geneva, Switzerland, 2015. [Google Scholar]
- ISO/ASTM52900-15. Standard Terminology for Additive Manufacturing—General Principles—Terminology; ASTM International: West Conshohocken, PA, USA, 2015. [Google Scholar]
- Ziaee, M.; Crane, N. Binder jetting: A review of process, materials, and methods. Addit. Manuf. 2019, 28, 781–801. [Google Scholar] [CrossRef]
- Farzadi, A.; Waran, V.; Solati-Hashjin, M.; Rahman, Z.A.A.; Asadi, M.; Abu Osman, N.A. Effect of layer printing delay on mechanical properties and dimensional accuracy of 3D printed porous prototypes in bone tissue engineering. Ceram. Int. 2015, 41, 8320–8330. [Google Scholar] [CrossRef] [Green Version]
- Chen, H.; Zhao, Y.F. Process parameters optimization for improving surface quality and manufacturing accuracy of binder jetting additive manufacturing process. Rapid Prototyp. J. 2016, 22, 527–538. [Google Scholar] [CrossRef]
- Hsu, T.; Lai, W. Manufacturing parts optimization in the three-dimensional printing process by the Taguchi method. J. Chin. Inst. Eng. 2010, 33, 121–130. [Google Scholar] [CrossRef]
- Xu, X.; Meteyer, S.; Perry, N.; Zhao, Y.F. Energy consumption model of Binder-jetting additive manufacturing processes. Int. J. Prod. Res. 2014, 53, 7005–7015. [Google Scholar] [CrossRef]
- Magisetty, R.; Cheekuramelli, N.S. Additive manufacturing technology empowered complex electromechanical energy conversion devices and transformers. Appl. Mater. Today 2019, 14, 35–50. [Google Scholar] [CrossRef]
- Yao, A.W.; Tseng, Y. A robust process optimization for a powder type rapid prototyper. Rapid Prototyp. J. 2002, 8, 180–189. [Google Scholar] [CrossRef]
- Suwanprateeb, J.; Thammarakcharoen, F.; Wasoontararat, K.; Suvannapruk, W. Influence of printing parameters on the transformation efficiency of 3D-printed plaster of paris to hydroxyapatite and its properties. Rapid Prototyp. J. 2012, 18, 490–499. [Google Scholar] [CrossRef]
- Shrestha, S.; Manogharan, G. Optimization of Binder Jetting Using Taguchi Method. JOM 2017, 69, 491–497. [Google Scholar] [CrossRef]
- Asadi-Eydivand, M.; Solati-Hashjin, M.; Farzad, A.; Abu Osman, N.A. Effect of technical parameters on porous structure and strength of 3D printed calcium sulfate prototypes. Robot. Comput. Manuf. 2016, 37, 57–67. [Google Scholar] [CrossRef] [Green Version]
- Coniglio, N.; Sivarupan, T.; El Mansori, M. Investigation of process parameter effect on anisotropic properties of 3D printed sand molds. Int. J. Adv. Manuf. Technol. 2017, 94, 2175–2185. [Google Scholar] [CrossRef]
- Castilho, M.; Dias, M.; Gbureck, U.; Groll, J.; Bartolo, P.; Pires, I.; Gouveia, B.; Rodrigues, J.; Vorndran, E. Fabrication of computationally designed scaffolds by low temperature 3D printing. Biofabrication 2013, 5, 035012. [Google Scholar] [CrossRef] [PubMed]
- Miyanaji, H.; Momenzadeh, N.; Yang, L.; Miyanaj, H. Effect of printing speed on quality of printed parts in Binder Jetting Process. Addit. Manuf. 2018, 20, 1–10. [Google Scholar] [CrossRef]
- Miyanaji, H.; Momenzadeh, N.; Yang, L. Effect of powder characteristics on parts fabricated via binder jetting process. Rapid Prototyp. J. 2019, 25, 332–342. [Google Scholar] [CrossRef]
- Ocaña-Garzón, E.; Alves, F.J.L.; Neto, R.J. Study of the viability of manufacturing ceramic moulds by additive manufacturing for rapid casting. Ciência & Tecnologia dos Materiais 2017, 29, 275–280. [Google Scholar] [CrossRef]
- Castro, M.; Rodríguez-González, P.; Barreiro, J.; Fernández-Abia, A. Behaviour of infiltrating materials on Calcium Sulphate hemihydrate parts made by 3D printing. Procedia Manuf. 2017, 13, 848–855. [Google Scholar] [CrossRef]
- Watters, M.P.; Bernhardt, M.L. Modified curing protocol for improved strength of binder-jetted 3D parts. Rapid Prototyp. J. 2017, 23, 1195–1201. [Google Scholar] [CrossRef]
- Impens, D.; Urbanic, R. A comprehensive assessment on the impact of post-processing variables on tensile, compressive and bending characteristics for 3D printed components. Rapid Prototyp. J. 2016, 22, 591–608. [Google Scholar] [CrossRef]
- Ledingham, A.D.; English, J.D.; Akyalcin, S.; Cozad, B.; Ontiveros, J.C.; Kasper, F.K. Accuracy and mechanical properties of orthodontic models printed 3-dimensionally from calcium sulfate before and after various postprinting treatments. Am. J. Orthod. Dentofac. Orthop. 2016, 150, 1056–1062. [Google Scholar] [CrossRef]
- Maravola, M.; Conner, B.; Walker, J.; Cortes, P. Epoxy infiltrated 3D printed ceramics for composite tooling applications. Addit. Manuf. 2019, 25, 59–63. [Google Scholar] [CrossRef]
- Ayres, T.J.; Sama, S.R.; Joshi, S.B.; Manogharan, G. Influence of resin infiltrants on mechanical and thermal performance in plaster binder jetting additive manufacturing. Addit. Manuf. 2019, 30, 100885. [Google Scholar] [CrossRef]
- Miyanaji, H.; Zhang, S.; Yang, L. A new physics-based model for equilibrium saturation determination in binder jetting additive manufacturing process. Int. J. Mach. Tools Manuf. 2018, 124, 1–11. [Google Scholar] [CrossRef]
- James, S.; Navarro, C. Molecular Dynamics Simulation of Nanoparticle Infiltration during Binder Jet Printing Additive Manufacturing Process: A Preliminary Study. In Volume 1: Additive Manufacturing; Manufacturing Equipment and Systems; Bio and Sustainable Manufacturing; ASME International: New York, NY, USA, 2019. [Google Scholar]
- Mitra, S.; De Castro, A.R.; El Mansori, M. The effect of ageing process on three-point bending strength and permeability of 3D printed sand molds. Int. J. Adv. Manuf. Technol. 2018, 97, 1241–1251. [Google Scholar] [CrossRef] [Green Version]
- Bassoli, E.; Atzeni, E. Direct metal rapid casting: Mechanical optimization and tolerance calculation. Rapid Prototyp. J. 2009, 15, 238–243. [Google Scholar] [CrossRef]
- Zhou, Z.; Mitchell, C.A.; Buchanan, F.J.; Dunne, N. Effects of Heat Treatment on the Mechanical and Degradation Properties of 3D-Printed Calcium-Sulphate-Based Scaffolds. ISRN Biomater. 2013, 2013, 1–10. [Google Scholar] [CrossRef] [Green Version]
- Asadi-Eydivand, M.; Solati-Hashjin, M.; Shafiei, S.; Mohammadi, S.; Hafezi-Ardakani, M.; Abu Osman, N.A. Structure, Properties, and In Vitro Behavior of Heat-Treated Calcium Sulfate Scaffolds Fabricated by 3D Printing. PLoS ONE 2016, 11, e0151216. [Google Scholar] [CrossRef] [Green Version]
- Fleisher, A.; Zolotaryov, D.; Kovalevsky, A.; Muller-Kamskii, G.; Eshed, E.; Kazakin, M.; Popov, V.; Muller, G. Reaction bonding of silicon carbides by Binder Jet 3D-Printing, phenolic resin binder impregnation and capillary liquid silicon infiltration. Ceram. Int. 2019, 45, 18023–18029. [Google Scholar] [CrossRef]
- Castro-Sastre, A.; Fernández-Abia, A.; González, O.C.; Martínez-Pellitero, S.; García, J.B. Characterization of Materials Used in 3D-Printing Technology with Different Analysis Techniques. In Proceedings of the 29th DAAAM International Symposium, Zadar, Croatia, 21–28 October 2018; pp. 0947–0954. [Google Scholar]
- ISO 4288:1996. Geometrical Product Specifications (GPS)—Surface texture: Profile method—Rules and Procedures for the Assessment of Surface Texture Standard; International Organization for Standardization: Vernier, Geneva, Switzerland, 1996. [Google Scholar]
- ASTM C373-88. Standard Test Method for Water Absorption, Bulk Density, Apparent Porosity, and Apparent Specific Gravity of Fired Whiteware Products; ASTM International: West Conshohocken, PA, USA, 2006. [Google Scholar]
- EN 13279-2:2014. Gypsum Binders and Gypsum Plasters—Part 2: Test Methods; European Committee for Standardization; CEN-CENELEC Management Centre: Brussels, Belgium, 2014. [Google Scholar]
- Mandal, P.K.; Mandal, T.K. Anion water in gypsum (CaSO4·2H2O) and hemihydrate (CaSO4·1/2H2O). Cem. Concr. Res. 2002, 32, 313–316. [Google Scholar] [CrossRef]
- Prasad, P.; Chaitanya, V.K.; Rao, D.N. Direct formation of the -CaSO4 phase in dehydration process of gypsum: In situ FTIR study. Am. Miner. 2005, 90, 672–678. [Google Scholar] [CrossRef]
- Fukuda, J.-I. Water in Rocks and Minerals—Species, Distributions, and Temperature Dependences. In Infrared Spectroscopy—Materials Science, Engineering and Technology; InTech: London, UK, 2012. [Google Scholar] [CrossRef] [Green Version]
- Bishop, J.L.; Lane, M.D.; Dyar, M.D.; King, S.J.; Brown, A.J.; Swayze, G.A. Spectral properties of Ca-sulfates: Gypsum, bassanite, and anhydrite. Am. Miner. 2014, 99, 2105–2115. [Google Scholar] [CrossRef]


| ICP-OES | |||||
|---|---|---|---|---|---|
| Analite | Mg (285.213) | Na (589.592) | K (766.490) | Al (396.153) | Si (251.611) |
| CaSO4·½H2O (mg/kg) | <4 | 508.26 | 679.66 | <4 | 253.75 |
| Binder (mg/L) | 0.13 | 73.20 | 2.24 | <0.10 | − |
| Test | Equipment | Methodology |
|---|---|---|
| Roughness Measurement | Mitutoyo Surftest SJ-500 Profilometer | ISO 4288:1996 standard |
| Dimension Measurement | Micrometre Mitutoyo | Three measurements in each direction (X, Y, Z) for each specimen |
| Weight Measurement | Balance Cobos CB Complet (accuracy of 0.01 g) | Three measurements for each specimen |
| Porosity | Balance Cobos CB Complet (accuracy of 0.01 g). Toluene. | ASTM C373-88 standard (Archimedes method) |
| Compression Test | Universal Testing Machine Servosis ME-402/5 | EN 13279-2:2014 standard |
| Composition Analysis | Jasco FT/IR-4700 FT-IR + ATR | IR radiation is passed through the sample |
| Wavenumber (cm−1) in This Study | Phase of The System CaSO4·H2O | Corresponding Vibration | References |
|---|---|---|---|
| 595.9 | CaSO4·½H2O | ν 4 SO4 | [37] |
| 614.25 | CaSO4 | ν 4 SO4 | |
| 660.5 | CaSO4·½H2O | ν 4 SO4 | |
| 673.03 | CaSO4 | ν 4 SO4 | |
| 1008.55 | CaSO4·½H2O | ν 1 SO4 | [38] |
| 1084.62 | CaSO4·½H2O | ν 3 SO4 | |
| 1112.65 * | CaSO4·½H2O | ν 3 SO4 | |
| 1130 | CaSO4 | ν 3 SO4 | |
| 1618.95 | CaSO4·2H2O CaSO4·½H2O | ν 2 H2O | |
| 1683 | CaSO4·2H2O | ν 2 H2O | |
| 3403 | CaSO4·2H2O | ν 1H2O | |
| 3550 | CaSO4·2H2O CaSO4·½H2O | ν 3 H2O ν 1 H2O | |
| 3606 | CaSO4·½H2O | ν 3 H2O |
© 2020 by the authors. Licensee MDPI, Basel, Switzerland. This article is an open access article distributed under the terms and conditions of the Creative Commons Attribution (CC BY) license (http://creativecommons.org/licenses/by/4.0/).
Share and Cite
Castro-Sastre, M.Á.; Fernández-Abia, A.I.; Piep, J.; Rodríguez-González, P.; Barreiro, J. Towards Functional Parts by Binder Jetting Calcium-Sulphate with Thermal Treatment Post-Processing. Materials 2020, 13, 3818. https://doi.org/10.3390/ma13173818
Castro-Sastre MÁ, Fernández-Abia AI, Piep J, Rodríguez-González P, Barreiro J. Towards Functional Parts by Binder Jetting Calcium-Sulphate with Thermal Treatment Post-Processing. Materials. 2020; 13(17):3818. https://doi.org/10.3390/ma13173818
Chicago/Turabian StyleCastro-Sastre, María Ángeles, Ana Isabel Fernández-Abia, Janik Piep, Pablo Rodríguez-González, and Joaquín Barreiro. 2020. "Towards Functional Parts by Binder Jetting Calcium-Sulphate with Thermal Treatment Post-Processing" Materials 13, no. 17: 3818. https://doi.org/10.3390/ma13173818
APA StyleCastro-Sastre, M. Á., Fernández-Abia, A. I., Piep, J., Rodríguez-González, P., & Barreiro, J. (2020). Towards Functional Parts by Binder Jetting Calcium-Sulphate with Thermal Treatment Post-Processing. Materials, 13(17), 3818. https://doi.org/10.3390/ma13173818