Article

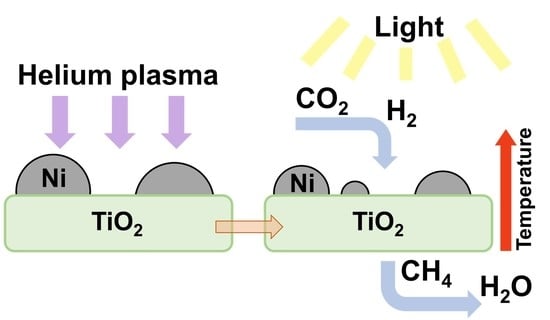
Plasma-Induced Catalyst Support Defects for the Photothermal Methanation of Carbon Dioxide

Particles and Catalysis Research Group, School of Chemical Engineering, The University of New South Wales, Sydney, NSW 2052, Australia
*
Authors to whom correspondence should be addressed.
Materials 2021, 14(15), 4195; https://doi.org/10.3390/ma14154195
Submission received: 4 June 2021 / Revised: 16 July 2021 / Accepted: 20 July 2021 / Published: 28 July 2021
(This article belongs to the Special Issue Materials for Light-Assisted Catalytic Reactions)

Abstract

:
The presence of defects in a catalyst support is known to benefit catalytic activity. In this work, a He-plasma treatment-based strategy for introducing and stabilising defects on a Ni/TiO2 catalyst for photothermal CO2 hydrogenation was established. The impact of pretreatment step sequence—which comprised He-plasma treatment and reduction/passivation—on defect generation and stabilisation within the support was evaluated. Characterisation of the Ni/TiO2 catalysts indicated that defects created in the TiO2 support during the initial plasma treatment stage were then stabilised by the reduction/passivation process, (P-R)Ni/TiO2. Conversely, performing reduction/passivation first, (R-P)Ni/TiO2, invoked a resistance to subsequent defect formation upon plasma treatment and consequently, poorer photothermal catalytic activity. The plasma treatment altered the metal-support interaction and ease of catalyst reduction. Under photothermal conditions, (P-R)Ni/TiO2 reached the highest methane production in 75 min, while (R-P)Ni/TiO2 required 165 min. Decoupling the impacts of light and heat indicated thermal dominance of the reaction with CO2 conversion observed from 200 °C onwards. Methane was the primary product with carbon monoxide detected at 350 °C (~2%) and 400 °C (~5%). Overall, the findings demonstrate the importance of pretreatment step sequence when utilising plasma treatment to generate active defect sites in a catalyst support.

Graphical Abstract

1. Introduction

The transformation of carbon dioxide (CO2) to valuable hydrocarbon products is a promising approach to mitigate CO2 emissions to the atmosphere [1,2]. Amongst the fuels and chemicals which can be produced, methane is a desirable product as it can be used directly within our existing natural gas infrastructure [3,4]. One approach to driving the methanation reaction is through exploiting photothermal conditions, which relies on a temperature increase from light absorption by the catalyst. The photothermal conditions allow the reaction to occur without external heating and promote a sustainable approach for catalytic activity.
To date, studies surrounding photothermal CO2 methanation have focused on understanding the role of light and catalyst design, encompassing different active metals and catalysts [5,6,7]. Amongst the active metals studied for thermal CO2 hydrogenation, nickel (Ni) has been probed expansively due to its performance in CO2 hydrogenation and relative abundance [3,8,9,10,11]. With regard to catalyst supports, titania (TiO2) has been studied comprehensively for thermal CO2 methanation [9,12,13]. TiO2, a semiconductor support, can harness light primarily in the ultraviolet (UV) region [14]. While catalysts have been prepared with varied metals and supports, the methods of catalyst modification, such as to induce defects, have not been reported extensively. The photothermal reaction is influenced by factors such as light harnessing, ease of catalyst reduction, and interaction with CO2 and H2 [15,16,17]. Therefore, pretreatments to alter catalyst structure can enhance the reaction.
One approach to modifying catalytic properties is by pretreating the catalyst [18,19,20,21]. Plasma treatment is capable of rapidly form defects without requiring additional chemicals or complex reactor set-ups. Non-thermal plasma pretreatment induce defects by bombarding the catalyst surface with excited species, typically easily ionised gases such as argon (Ar) or helium (He) [22,23]. This surface bombardment can result in a range of physical and chemical changes to the catalyst surface including etching, reducing the surface and altering metal deposit size and support interaction [22,23]. Plasma pretreatment has shown significant impacts on both metal oxide supports alone, as well as metal-supported catalysts. For example, Horlyck et al. examined the use of He plasma pretreatment on TiO2/SiO2 composites and found a significant increase in defect formation as a result of prolonged plasma treatment [24]. In the case of metal-supported catalysts, the effect of cold Ar plasma treatment on Pt/CeO2 for the water–gas shift reaction has been studied. Compared to calcined Pt/CeO2, the plasma treatment step altered the Pt species and resulted in an increase in electron density, stronger Pt-Ce interaction, and higher CO adsorption [25].
Plasma treatment, as a means of defecting catalysts and altering Ni properties, has not been investigated for pretreating catalysts used in the photothermal methanation of CO2. Overall, applying a plasma at different stages of catalyst preparation has been reported to impact material characteristics such as structural properties and metal-support interaction; subsequently influencing the catalytic performance.
In this work, plasma treatment was utilised to induce defects on Ni/TiO2 catalysts for the photothermal conversion of CO2 to methane. A TiO2 support was prepared by flame spray pyrolysis (FSP) and loaded with Ni. Plasma treatment was applied to either: (i) as-prepared NiO/TiO2 prior to reduction/passivation; or (ii) after reduction/passivation of the as-prepared NiO/TiO2. The plasma pretreatment can induce defects in the TiO2 support as well as influence the Ni catalyst properties. Its application at different points within the catalyst preparation process enables us to examine its influence on the Ni/TiO2 catalyst characteristics and their subsequent catalyst activity. The Ni/TiO2 catalysts were assessed for CO2 reduction under photothermal conditions in a batch-circulated reactor system, where light was the sole driving force for the reaction. To decouple the influence of light and heat on the catalytic process, the reaction was undertaken in a continuous flow reactor system. Within the continuous flow reactor, catalyst activity/selectivity under only either thermal stimulus or combined thermal-light stimuli, can be determined. The materials were characterised to gain an appreciation of the impact plasma treatment had on inducing defects in the TiO2 support and altering the Ni catalyst properties, and the ensuing catalytic activity for photothermal CO2 methanation.

2. Materials and Methods

2.1. Catalyst Synthesis

TiO2 was prepared by flame spray pyrolysis (FSP), with the synthesis conditions described elsewhere [26]. Briefly, titanium (IV) isopropoxide (97%, Sigma-Aldrich, St. Louis, MO, USA) was mixed with absolute ethanol (Chem-Supply, Adelaide, Australia) to form a 1.26 M precursor solution. The mixture was then fed into the flame via a syringe pump at a rate of 5 mL/min. A 5 L/min O2 sheath (oxygen, >99.9%, Coregas, Yennora, Australia) aided upward movement of the synthesised particles into the vacuum hood. The flame was supported with a mix of 1.5 L/min CH4 (>99.95%, Coregas) and 3.2 L/min O2. The precursor was dispersed using a 5 L/min gas flow of O2, with the pressure drop across the nozzle maintained at 150 kPa. A vacuum pump connected to a Whatmann filter paper located above the flame was used to collect the product.
NiO/TiO2 catalyst was prepared via impregnation and calcination. During the synthesis, nickel (II) nitrate hexahydrate (99.999%, Sigma-Aldrich) was dissolved in Milli-Q water (18.2 MΩ·cm, Merck Millipore, Billerica, MA, USA) to form a 0.3 M solution. The FSP-prepared TiO2 was added to the Ni solution and stirred at 120 °C until a paste formed. The paste was further dried at 110 °C in an oven for 16 h and then ground with a mortar and pestle. The powder was loaded into a glass reactor with a 10 mm internal diameter and calcined at 400 °C for 3 h under dry air (Coregas, 50 mL/min) at ramp rate of 5 °C/min.
The NiO/TiO2 catalysts were reduced and passivated in a Micromeritics Autochem 2910 (Micromeritics, Norcross, GA, USA). For the reduction step, ~300 mg of NiO catalyst was reduced in 10.18% H2/Ar (20 mL/min) ramped to 500 °C at 5 °C/min, held for 1 h, and then cooled under Ar. The reduced Ni catalyst was then passivated under 10 mL/min 0.97% O2/He (Coregas) for 12 h at room temperature, after which it was ground with a mortar and pestle.
Plasma treatment was undertaken using a Dielectric Barrier Discharge (DBD) plasma system (CTP-2000K Plasma Generator, Corona Lab, Nanjing, China), with a discharge gap of ~8 mm, as reported elsewhere [24]. Typically, ~250 mg of catalyst was loaded into the plasma chamber and subjected to plasma under a 30 mL/min He (>99.996%, Coregas) flow for 20 min. Plasma treatment was conducted on either: (i) the as-prepared NiO/TiO2 prior to reduction and passivation; or (ii) samples that had been initially reduced and passivated. The catalysts are labelled based on the pretreatment order where reduced/passivated and then plasma treated is (R-P)Ni/TiO2, plasma treated and then reduced/passivated is (P-R)Ni/TiO2. A catalyst that has been only reduced/passivated (i.e., no plasma treatment) is referred to as (R)Ni/TiO2. A catalyst that has been only plasma-treated (i.e., no reduction/passivation) is referred to as (P)NiO/TiO2.

2.2. Catalyst Characterisation

To determine the actual Ni loading on the catalyst, the as-prepared NiO/TiO2 was digested in aqua regia using microwave assistance and subject to inductively coupled plasma optical emission spectrometry (ICP–OES) using a PerkinElmer OPTIMA 7300 ICP-OES instrument (PerkinElmer, Waltham, MA, USA).
Specific surface area (SSA) was measured using N2 adsorption/desorption isotherms (Micromeritics Tristar 3030) at −196 °C. The samples were pretreated under vacuum for 3 h at 150 °C prior to analysis. The SSA was determined by the Brunauer–Emmet–Teller (BET) method. Material phases and crystallinity were analysed using X-ray diffraction (XRD) with a PANalytical Xpert Multipurpose X-ray Diffraction System (MPD) (Malvern, UK). The XRD instrument was set at 45 kV and 40 mA with a Cu Kα source. The pattern was collected over the range of 2θ = 20°–100° with a scan rate of 0.01°/min and a step size of 0.026°. The Scherrer equation was used to calculate the crystal size using the 100% intensity peak and a shape factor of 0.9.
As light absorbance by the Ni catalysts is critical for driving the photothermal methanation reaction, the materials were characterised by ultraviolet-visible-near infrared (UV-vis-NIR) spectrometry using a Shimadzu UV-Vis 3600 (Shimadzu, Kyoto, Japan). The collected reflectance spectra were converted to absorbance spectra via the Kubelka–Munk equation, referenced to barium sulphate. Subsequently, the converted spectra of nickel-loaded samples were normalised against absorbance of TiO2.
Catalyst reducibility was characterised using a Micromeritics Autochem 2910 (Micromeritics, Norcross, GA, USA). For the hydrogen-temperature programmed reduction (H2–TPR) procedure, approximately 50 mg of catalyst was loaded into a quartz U-tube, supported by a plug of quartz wool. The catalyst was pretreated under an argon (>99.997%, Coregas) flow (20 mL/min) where it was heated to 150 °C at a rate of 10 °C/min and held for 0.5 h. The sample was then cooled to 50 °C prior to introducing 10.18% H2/Ar (Coregas) at 20 mL/min. Heating from 50 °C to 700 °C at a ramp rate of 5 °C/min was applied and the H2 consumed was measured by a TCD. CO2-temperature programmed desorption (CO2–TPD) experiments were also conducted on the Micromeritics Autochem 2910. Here, approximately 50 mg of sample was placed into the quartz U-tube. The catalyst was initially reduced in 10.18% H2/Ar (20 mL/min) ramped at 5 °C/min up to 500 °C, held for 1 h, and cooled to 50 °C in 20 mL/min He. The sample was next exposed to 20 mL/min CO2 (>99.5%, Coregas) for 1 h at 50 °C after the gas flow was swapped to He for 1 h. The CO2–TPD was conducted in 20 mL/min He from 50 °C to 700 °C at a ramp rate 10 °C/min.
Surface species present on the pretreated Ni/TiO2 catalysts were identified by X-ray photoelectron spectroscopy (XPS). Shifts in binding in energy were referenced to the Carbon 1s peak (284.8 eV) and the spectra were collected using an ESCALAB 250Xi (Thermo Scientific, Waltham, MA, USA) equipped with an Al Kα X-ray source. Transmission electron microscopy (TEM) images and energy-dispersive spectroscopy (EDS) mapping were taken by a JEOL JEM-ARM200F microscope (JEOL Ltd., Tokyo, Japan), operating at 200 kV. Prior to the imaging, the Ni/TiO2 catalysts were ultrasonically dispersed in ethanol and drop-cast onto lacy carbon-coated copper grids. Defects present in the TiO2 were evaluated using electron paramagnetic resonance (EPR) and Raman spectroscopies. EPR was conducted at −153 °C (cooled by liquid nitrogen) using 20 mg of sample loaded in a 4 mm (internal diameter) quartz tube and analysed by a Bruker EMX X-Band ESR spectrometer (Bruker, Billerica, MA, USA). Raman spectroscopy was performed using a Renishaw inVia 2 Raman Microscope (532 nm) (Renishaw, Wotton-under-Edge, UK).

2.3. Activity Tests

Two styles of activity testing were conducted to gain an understanding of the impacts of plasma treatment on catalyst performance for the photothermal methanation of CO2: (i) the first utilised a batch-circulated reactor system; (ii) the second employed a continuous flow reactor system where the effects of light and heat on catalyst performance could be decoupled. Details on the two reactor configurations and associated catalyst activity/selectivity evaluation are available in an earlier study [16].
In the case of the batch-circulated reactor system, illumination was provided from the top of the reactor using a 300 W Xenon lamp (Peccell CX-04E with an Eagle R300-3J lamp housing) (Peccell Technologies, Yokohama, Japan). No other heat source was employed. The catalyst was supported on a glass fibre filter (Merck Millipore, Billerica, MA, USA) within the reactor. To load the catalyst, 100 mg of sample was ultrasonically dispersed in Milli-Q water and drop-cast on to a 7 cm2 region of the filter, dried and then placed in the reactor. A reactant mixture comprising ~15 kPa CO2 and ~60 kPa hydrogen (H2, >99.99%, Coregas) was injected into, and continuously circulated around, the reactor. The reactor was illuminated using the Xenon lamp (20 A current output) to initiate the photothermal methanation reaction. Reactants and products were analysed using a gas chromatograph (Shimadzu GC-2010 Plus with a Supelco Carboxen 1010 column) (Shimadzu, Kyoto, Japan). The gas chromatograph was equipped with a methaniser, flame ionisation detector (FID) and TCD. The change in temperature of the catalyst was monitored using a thermocouple in direct contact with the catalyst-loaded filter.
In the case of the continuous flow reactor system, heat was supplied from beneath the reactor using a tube furnace. The catalyst was illuminated by a Xenon lamp (300 W, 20 A current output) through a quartz window in the top of the reactor. The catalyst (100 mg) was loaded on an (1.5 cm × 1.5 cm) aluminium plate and placed in the reactor facing upwards. Under thermal-only reaction conditions, the temperature increased from 50–400 °C, at 50 °C intervals, under a 4 mL/min CO2 and 16 mL/min H2 reactant flow. The temperature was ramped at 2.5 °C/min and held for 1 h at each temperature interval. The impact of light was studied by replicating the thermal reaction conditions with the addition of catalyst illumination from above. Reactants and products from the reactor effluent were identified using a Shimadzu GC-2010 gas chromatograph (Shimadzu, Kyoto, Japan) equipped with an Agilent J&W HP-PLOT Q capillary column, methaniser and FID. A schematic of the apparatus can be found in Tan et al. [27].

3. Results and Discussion

3.1. Catalyst Properties

The structural properties of Ni/TiO2 are displayed in Table 1. As determined from ICP-OES, the actual Ni loading was 9.2 wt.%, close to the nominal 10 wt.% loading. The as-prepared FSP TiO2 had a SSA of 104 m2/g. The type III N2 adsorption/desorption isotherms of TiO2 (Figure S2) indicates a non-porous structure. The pore size distribution (Figure S2) shows a maximum at approximately 3.46 nm for TiO2. After loading the TiO2 with Ni and subsequent calcination (NiO/TiO2), the SSA decreased to 66 m2/g. Plasma-treating the NiO/TiO2 ((P)NiO/TiO2) saw the SSA increase slightly to 75 m2/g. Both NiO/TiO2 and (P)NiO/TiO2 displayed type V isotherms. Two peaks, centred at 4.2–5.1 nm and 8.7–9.1 nm, were observed in the pore size distribution of the nickel catalysts. As the catalysts are non-porous, the porosity observed from N2 adsorption/desorption isotherm is likely to stem from spaces between the particles. The catalyst structure and metal distribution are discussed at the end of this section.
The crystal phase and size of the TiO2 support and Ni deposits were determined from the XRD patterns (Figure S2). Both anatase and rutile TiO2 were detected; however, the anatase phase was dominant, which is consistent with TiO2 synthesised by FSP [26]. The TiO2 crystal phase was not affected by plasma treatment or Ni addition and calcination. Plasma treatment had a minimal impact on the NiO crystallite size (NiO/TiO2: 7.7 nm, (P)NiO/TiO2: 9.3 nm) and the TiO2 crystal size (21 nm) remained unchanged. Upon reduction/passivation, the Ni crystal sizes were similar ((P-R)Ni/TiO2: 13.7 nm, (R)Ni/TiO2: 13.1 nm, (R-P)Ni/TiO2: 12.7 nm), indicating that the plasma treatment had little impact on this characteristic. The BET and XRD results indicate the plasma pretreatment does not impart any undesirable morphological changes.
As plasma treatment has the potential to induce defects on the TiO2 support, the as-prepared, plasma-treated and reduced/passivated TiO2 (without Ni loading) were studied by EPR and Raman spectroscopy (Figure 1). The EPR spectrum exhibits a peak at g = 2.0020 for the as-prepared TiO2, associated with the presence of oxygen vacancies [28,29]. The peak representing Ti3+ (g ≈ 1.94) was not observed [28]. The EPR spectrum remains unchanged after plasma treating the TiO2 ((P)TiO2), with no shift in the g = 2.0020 peak position and no new peaks appearing. Similarly, the EPR spectrum for the passivated/reduced sample (Figure S3a) remains unchanged.
Raman spectroscopy was used to further understand the influence of plasma treatment on the TiO2 (Figure 1b,c). Peaks corresponding to the anatase phase of TiO2 were evident for both samples (143/144 cm−1, 396/397 cm−1, 516 cm−1, and 638/639 cm−1) [30,31]. This is consistent with the presence of anatase from XRD (Figure S2). The peak at 143/144 cm−1 is the linear combination of asymmetric bending of O–Ti–O bonds, while 197/198 cm−1 can be attributed to the presence of the brookite phase [30]. Consistent with the XRD results, no significant peak shifts or broadening was evident as a consequence of the plasma treatment, indicating no major structural changes. A peak at 1050 cm−1 appeared for (P)TiO2, which is not commonly observed in TiO2. Surmacki et al. [32] observed a peak at 1048 cm−1 in an electron beam irradiated N-doped TiO2 sample which was not observed in the non-irradiated sample. They attributed it to a new species from the interaction of the TiO2 and N-dopant under irradiation, although it was not assigned to a specific feature of TiO2. Plasma treatment of FSP SiO2–TiO2 saw the emergence of a new Raman peak at 440 cm−1 for that sample, which was attributed to structural distortion [24]. Although the peak at 1050 cm−1 (Figure 1c) has not been defined in the literature, the formation the additional peak for (P)TiO2 indicates that a structural change occurred due to the plasma treatment. A similar change in the Raman spectra of (R)TiO2, (P-R)TiO2, and (R-P)TiO2 was not apparent, suggesting that the reduction/passivation may constrain the effect of plasma on the TiO2.
As the photothermal CO2 hydrogenation reaction utilises light to heat conversion, the light absorbance of Ni/TiO2 was studied by UV-vis-NIR spectroscopy (Figure 2a). The as-prepared TiO2 absorbed light in the UV region and exhibited a bandgap of 3.4 eV. The calculated bandgap was consistent with the literature, particularly for anatase TiO2 at ~3.2 eV. [33,34], which was the dominant phase present in the materials. Upon Ni addition and pretreatment, the light absorbance extends from the UV region into the visible and near infrared. The absorbance in the Vis and NIR regions can be attributed to the presence of metallic Ni deposits, consistent with group VIII metals [35]. Specifically, the broadband absorbance is driven by intraband transition within overlaid partially filled 3d sub-orbitals [36]. All Ni/TiO2 catalysts exhibited full spectrum absorbance, coinciding with the spectrum profile of the Xenon lamp, which allows utilisation of the full solar spectrum for the photothermal CO2 reaction.
To understand the impact of plasma treatment on the support, CO2-TPD analyses were conducted on the neat TiO2 (Figure 2b). A CO2 desorption peak was centred at 190 °C and 194 °C for TiO2 and (P)TiO2, respectively, which indicates medium-strength basic sites [37]. The desorption temperature is favourable, as it is within the temperature range of photothermal CO2 methanation. Relative to TiO2, the area under the peak for (P)TiO2 increased by 11%, indicating a mild increase in CO2 adsorption and the effectiveness of plasma treatment in inducing defects in TiO2. Defects present on TiO2 can behave as sites for CO2 adsorption [38]. Subsequently, the increase in CO2 desorption peak area can be a contributing factor to the improved activity.
The reducibility of NiO/TiO2 and pretreated Ni/TiO2 catalysts was characterised by H2-TPR (Figure 2c,d). As shown in Figure 2c, the as-prepared TiO2 has a low intensity peak between 200–250 °C, which may arise from the partial reduction in TiO2 [39] or the removal of residual surface species resulting from the flame synthesis. For NiO/TiO2, peaks are observed at ~205 °C, 335 °C, and 425 °C. The ratio of integrated H2-TPR peak area was 0.97:1 for (P)NiO/TiO2:NiO/TiO2, which indicated that slightly less H2 was required to reduce (P)NiO/TiO2. The lower temperature reduction peaks for NiO/TiO2 can be attributed to the reduction in NiO that weakly interacts with TiO2. The reduction in nickel oxide occurs at ~400 °C [40]. The broad peak extending up to ~500 °C can be attributed to NiO with a strong NiO–TiO2 interaction [41]. After plasma treatment, (P)NiO/TiO2 (Figure 2c) displayed a slight decrease in reduction temperature of all peaks to ~195 °C, 310 °C, and 400 °C, implying an ease in reducibility and a slight variation to the metal-support interaction. An increase in the ratio of the lowest temperature peak (~200 °C) to the higher reduction peak (~250 °C to ~500 °C) was observed for (P)NiO/TiO2. The peak at ~205 °C for NiO/TiO2 accounted for 27% of its reduction profile, while the peak at ~195 °C for (P)NiO/TiO2 accounted for 32% of its reduction profile. The 5% increase in the low temperature peak in (P)NiO/TiO2 relative to NiO/TiO2 depicts an increase in NiO with weak metal-support interaction due to plasma treatment.
Following reduction/passivation, the Ni/TiO2 was reducible at temperatures below 250 °C (Figure 2d). The oxygen passivation was conducted to prevent uncontrolled oxidation after catalyst reduction. The decrease in the reduction temperature post-passivation, relative to as-prepared NiO/TiO2, is important, as the onset temperature reached in the photothermal system is approximately 200 °C [16]. The post-passivation reduction peaks for (R)Ni/TiO2 and (P-R)Ni/TiO2 can be deconvoluted into two peaks ((R)Ni/TiO2: ~190 °C and 205 °C, (P-R)Ni/TiO2: ~210 °C and 220 °C. The post-passivation reduction profile for (R-P)Ni/TiO2 was different, with only one reduction peak present at ~215 °C and a shoulder at 200 °C. These peaks are indicative of the re-reduction in the surface oxidised Ni deposits after passivation. The peak ratio, integrated from ~180 °C to ~270 °C and normalised to (R)Ni/TiO2, was (R-P)Ni/TiO2 (1.01) > (R)Ni/TiO2 (1) > (P-R)Ni/TiO2 (0.83). The extent of re-oxidation from the oxygen passivation was calculated: (R-P)Ni/TiO2 (7.5%) ≈ (R)Ni/TiO2 (7.4%) > (P-R)Ni/TiO2 (6.3%). Whilst the percent oxidation was comparable between the catalysts, a clear difference in profile features is evident for the (R-P)Ni/TiO2 compared to (R)Ni/TiO2 and (P-R)Ni/TiO2, where two reduction peaks are present, whilst in the case of the (R-P)Ni/TiO2 sample, a peak with a lower temperature shoulder is evident. This may be an impact of the re-reduction in different Ni sizes (vide infra). The change in reduction profile for (R-P)Ni/TiO2 compared to (R)Ni/TiO2 and (P-R)Ni/TiO2 indicates that the plasma treatment had the most significant impact on the Ni deposits when implemented after reduction and passivation. However, (P-R)Ni/TiO2 required the least H2 for re-reduction and subsequently ease of catalyst activation.
XPS was conducted on the Ni/TiO2 to examine their surface oxidation state (Figure 3). Peaks corresponding to Ni2+ (nickel oxide) and Ni0 (metallic nickel) were identified as seen in Figure 3a, while the unlabelled peaks (at 861.4 eV and 856.6 eV) are satellite peaks [42]. The ratio of Ni2+ to Ni0 was calculated to be (R-P)Ni/TiO2 (6.0) > (R)Ni/TiO2 (4.6) > (P-R)Ni/TiO2 (4.3). The ratio was consistent with the H2-TPR results for Ni/TiO2 (Figure 2d) for which (P-R)Ni/TiO2 had the lowest quantity of NiO. As is evident in Figure 3b, only a peak corresponding to Ti4+ was present in all samples. A shift in the binding energy of Ti4+ was observed as a consequence of the impact of plasma, indicating the presence of oxygen vacancy (Ti3+) formation [43]. The shift in the Ti4+ peak for (P-R)Ni/TiO2 (from 458.6 eV to 458.4 eV) and (R-P)Ni/TiO2 (from 458.6 eV to 458.4 eV), compared to (R)Ni/TiO2 indicates a change in Ti oxidation state arising from plasma treatment. The O 1s spectrum of (R)Ni/TiO2 can be deconvoluted to lattice oxygen (529.7 eV), -OH bond (531.2 eV), and adsorbed water (532.7 eV) [44,45]. Corresponding shifts of the oxygen lattice from plasma treatment were observed in (P-R)Ni/TiO2 and (R-P)Ni/TiO2, from 529.7 eV in (R)Ni/TiO2 to 529.6 eV. A slight decrease in oxygen lattice peak position due to plasma treatment has been previously observed [46].
To further understand the interaction between Ni and the TiO2 support, TEM images were taken and EDS mapping was performed (Figure 4). The Ni deposits display little difference in size between the (R)Ni/TiO2 (17 ± 5 nm) and (P-R)Ni/TiO2 (18 ± 5 nm) samples, consistent with the XRD crystallite sizes (Table 1). The (R-P)Ni/TiO2 sample also exhibited Ni deposits of a similar size (16 ± 5 nm). However, also present were additional finely dispersed Ni deposits. The sizes of the fine Ni deposits were not able to be accurately measured and, as such, were not included in the associated histogram (Figure 4).
Characterisation of the catalyst properties indicates that plasma treatment modifies the TiO2. The modification is evident in changes to the surface texture of the TiO2 (Figure 4) and the shift in the Ti 2p peak shift in the XPS spectra (Figure 3) for the plasma-treated samples. Plasma treatment also leads to an increase in CO2 adsorption by the neat TiO2 (Figure 2b) and structural modification as illustrated by the emergence of a new peak for (P)TiO2 in the Raman spectra (Figure 1). Plasma treatment affected the Ni deposit properties, impacting the reducibility of (R-P)Ni/TiO2 (Figure 1c,d). To understand the impact of the altered characteristics of the Ni/TiO2 catalyst arising from the plasma treatment, the activity/selectivity of the catalysts for CO2 methanation under (i) photothermal (batch-circulated reactor system) and (ii) decoupled photo and thermal (continuous flow reactor system) conditions was evaluated.

3.2. CO2 Methanation Results

The effects of the pretreatment conditions on catalyst activity for the photothermal methanation reaction within the batch-circulated reactor system are shown in Figure 5a,b.
Within the batch-circulated reactor system, the methane formation trend followed the order: (P-R)Ni/TiO2 > (R)Ni/TiO2 > (R-P)Ni/TiO2 (Figure 5a). (P-R)Ni/TiO2 and (R)Ni/TiO2 required 75 min and 90 min, respectively, to achieve maximum CH4 formation with ≈ 100% selectivity (with trace CO). A longer time period was required for methane formation to stabilise in the case of (R-P)Ni/TiO2. The temperature profile for each of the Ni/TiO2 samples is included in Figure 5b. The temperature for all catalysts reached 175–200 °C within the first 15 min due to the initial photothermal heating of the catalyst combined with the later exothermic heat from methane formation. Given the Ni in the pretreated Ni/TiO2 catalysts was reducible below 250 °C (Figure 2d) following reduction and passivation of the catalysts, it is anticipated that catalysts are converted to their reduced form during the batch reaction. Absorbance by the Ni/TiO2 catalysts in the infrared region contributed to the localised heating [47]. Consequently, the capacity of the catalysts for full spectrum absorbance was beneficial for the reaction. With increasing methane production, the temperature further increased and reached 250–280 °C after 3 h. The further temperature increase arising from the exothermic nature of methanation can promote better catalyst reduction and contribute to greater methane production [16]. Both (P-R)Ni/TiO2 and (R)Ni/TiO2 exhibit a similar temperature profile while the temperature profile for (R-P)Ni/TiO2 was generally lower. It is apparent that the temperature profile can be correlated to methane formation with (P-R)Ni/TiO2 achieving the highest temperature, followed by (R)Ni/TiO2 and (R-P)Ni/TiO2.
The influences of light and heat were decoupled in the continuous flow reactor system, where a furnace (separate from the light source) was used to heat the catalyst bed. CO2 conversion and methane selectivity for thermal-only input are shown in Figure 5c,d. CO2 conversion under thermal-only conditions was observable from 200 °C onwards, which is consistent with the findings from the batch photothermal catalytic reactor. A significant increase in CO2 conversion was observed with increasing temperature for all catalysts, particularly from 300 °C to 350 °C, with methane as the sole product up to 350 °C. A significant difference in CO2 conversion is not apparent over the temperature range 250–400 °C for any of the catalysts. Despite the different pretreatments inducing variations to the catalyst properties, such as reducibility and defect density, the CO2 conversion and methane selectivity were not altered. The indifference indicates that the catalyst modification was only effective under photothermal conditions.
Adding illumination to the thermal stimulus can provide better understanding on the influence of light on the reaction, particularly across the UV-visible region. The addition of light, Figure S5, to the thermal conditions did not lead to any significant increase in CO2 conversion or change to product selectivity. Subsequently, photothermal CO2 conversion by the Ni/TiO2 catalysts appears to be thermally dominant. Under both conditions—thermal-only and light-plus-thermal conditions—methane selectivity decreased from 350 °C onwards in favour of CO formation due to the reverse-water gas shift reaction [11].
The thermal dominance during photothermal CO2 conversion indicates that the absorbance of light from the NIR portion of the spectrum is crucial for reaction feasibility. While catalyst modifications induced by pretreatment, such as greater CO2 adsorption, TiO2 defects, and a change in metal-support interaction, did not promote greater CO2 conversion under the decoupled photo-and-thermal condition (continuous flow reactor), they do significantly influence the photothermal catalytic activity (cyclic batch reactor). Importantly, the order in which the plasma and reduction/passivation treatments were applied influenced the catalytic activity of the Ni/TiO2.
Others have examined defects generated in TiO2 as a consequence of plasma treatment. Bharti et al. reported that plasma treatment in an air environment could induce Ti3+ and oxygen vacancies in a TiO2 thin film [46]. The higher activity of (P-R)Ni/TiO2 compared to (R-P)Ni/TiO2 in our work can be related to additional defects formed and their ensuing stability arising from the different pretreatment sequences. Chen et al. found that plasma treating Pt/CeO2 followed by 20% H2/N2 thermal treatment led to higher toluene catalytic oxidation, compared to thermal then plasma treatment. The plasma treatment affected the surface oxygen defects and Pt-Ce interaction. When thermally treating the catalyst after plasma treatment, more defects could be generated via greater hydrogen dissociation on the plasma-generated defect sites [48]. In our case, while the impact of plasma treatment was most prominent for (R-P)Ni/TiO2, the changes were not necessarily beneficial for enhancing photothermal CO2 hydrogenation relative to (R)Ni/TiO2. The thermal treatment can stabilise the catalyst structure and subsequently minimise the impact of any ensuing plasma treatment [24]. Consequently, the results suggest that the most effectual approach for the Ni/TiO2 catalyst is to thermally treat the defected catalyst to stabilise the defects generated from the plasma treatment.

4. Conclusions

The influence of Ni/TiO2 catalyst pretreatment strategy on the generation and stabilisation of surface defects active for the photothermal CO2 methanation reaction was examined. The sequence of two pretreatment steps, involving a He-plasma stage and a reduction/passivation stage, were switched, with the ensuing impact on defect generation and, in turn, catalyst activity, assessed. The catalyst comprised a TiO2 support prepared via FSP which was loaded with a Ni catalyst. When the as-prepared NiO/TiO2 was treated with plasma, the subsequent reduction/passivation step stabilised the plasma-generated defects on the TiO2 support, as evident from XPS, and Raman analysis. This increase in defects resulted in an increased CO2 interaction (shown in the CO2-TPD of the plasma-treated TiO2). Ultimately, these increased surface TiO2 defects resulted in higher photothermal catalytic performance. When reduction/passivation was performed prior to plasma treatment, the reduction/passivation imbued the NiO/TiO2 with a greater resistance to subsequent defecting by the plasma treatment. It was evident, through H2-TPR of the Ni/TiO2 samples (after reduction and passivation), that a change in metal–support interaction occurred as a result of plasma treatment after reduction. Deconvolution of the light and heat effects demonstrated that the photothermal catalytic reaction was thermally dominant with the light as a heat source. The work highlights the importance of the material pretreatment strategy when using plasma as a means to generate active defect sites within a catalyst. If not performed correctly, the potential benefits of plasma treatment can be lost.

Supplementary Materials

The following are available online at https://www.mdpi.com/article/10.3390/ma14154195/s1, Figure S1: N2 adsorption/desorption isotherm and pore size distribution of (a,d) TiO2, (b,e) NiO/TiO2, and (c,f) (P)NiO/TiO2, respectively, Figure S2: XRD patterns of (a) TiO2 and NiO/TiO2 and (b) Ni/TiO2 catalysts following different pretreatment approaches. R = reduced/passivated, P = plasma treated. JCPDS: 00-044-1159 (NiO), 00-004-0850 (Ni), 00-021-1272 (anatase TiO2), and 98-005-3997 (rutile TiO2), Figure S3: (a) EPR and (b) Raman spectra of as-prepared TiO2 following different pretreatment approaches. R = reduced/passivated, P = plasma treated, Figure S4: The influence of Ni/TiO2 catalyst pretreatment on (a) CO2 conversion and (b) methane selectivity during decoupled photo and-thermal CO2 methanation in a continuous flow reactor system. Catalyst loading = 100 mg; Reacting gas flow rate = 4 mL/min CO2 and 16 mL/min H2; illumination provided by a 300 W Xenon lamp. Thermal only reaction indicated by the filled markers (●). Photo-and-thermal reaction indicated by the open markers (○). R = reduced/passivated, P = plasma treated.

Author Contributions

Conceptualization, S.J., E.C.L., R.A. and J.S.; formal analysis, S.J., S.L., E.C.L., T.H.T. and B.X.; investigation, S.J., S.L., J.H., E.C.L. and B.X.; supervision, E.C.L., T.H.T., R.A. and J.S.; writing—original draft, S.J.; writing—review—editing, J.H., E.C.L., T.H.T., R.A. and J.S. All authors have read and agreed to the published version of the manuscript.

Funding

The work was supported by the Australian Research Council under the Laureate Fellowship Scheme—FL140100081 and is gratefully acknowledged.

Institutional Review Board Statement

Not applicable.

Informed Consent Statement

Not applicable.

Data Availability Statement

The data presented in this study are available in this article and the Supplementary Information.

Acknowledgments

Characterisation conducted at the UNSW Mark Wainwright Analytical Centre and the University of Wollongong Electron Microscopy Centre (David Mitchell) was invaluable to the research. We would also like to thank Constantine Tsounis for his assistance with TEM and EDS at UNSW.

Conflicts of Interest

The authors declare no conflict of interest. The funders had no role in the design of the study; in the collection, analyses, or interpretation of data; in the writing of the manuscript, or in the decision to publish the results.

References

  1. Liu, Q.; Wu, L.; Jackstell, R.; Beller, M. Using carbon dioxide as a building block in organic synthesis. Nat. Commun. 2015, 6. [Google Scholar] [CrossRef]
  2. Cuéllar-Franca, R.M.; Azapagic, A. Carbon capture, storage and utilisation technologies: A critical analysis and comparison of their life cycle environmental impacts. J. CO2 Util. 2015, 9, 82–102. [Google Scholar] [CrossRef]
  3. Ghaib, K.; Nitz, K.; Ben-Fares, F.-Z. Chemical Methanation of CO2: A Review. ChemBioEng Rev. 2016, 3, 266–275. [Google Scholar] [CrossRef]
  4. Mac Kinnon, M.A.; Brouwer, J.; Samuelsen, S. The role of natural gas and its infrastructure in mitigating greenhouse gas emissions, improving regional air quality, and renewable resource integration. Prog. Energy Combust. Sci. 2018, 64, 62–92. [Google Scholar] [CrossRef]
  5. Jia, J.; Wang, H.; Lu, Z.; O’Brien, P.G.; Ghoussoub, M.; Duchesne, P.; Zheng, Z.; Li, P.; Qiao, Q.; Wang, L.; et al. Photothermal Catalyst Engineering: Hydrogenation of Gaseous CO2 with High Activity and Tailored Selectivity. Adv. Sci. 2017, 4. [Google Scholar] [CrossRef] [Green Version]
  6. Meng, X.; Wang, T.; Liu, L.; Ouyang, S.; Li, P.; Hu, H.; Kako, T.; Iwai, H.; Tanaka, A.; Ye, J. Photothermal conversion of CO2 into CH4 with H2 over Group VIII Nanocatalysts: An alternative approach for solar fuel production. Angew. Chem. Int. Ed. 2014, 4, 11662–11666. [Google Scholar] [CrossRef]
  7. Ren, J.; Ouyang, S.; Xu, H.; Meng, X.; Wang, T.; Wang, D.; Ye, J. Targeting Activation of CO2 and H2 over Ru-Loaded Ultrathin Layered Double Hydroxides to Achieve Efficient Photothermal CO2 Methanation in Flow-Type System. Adv. Energy Mater. 2016, 1601657. [Google Scholar] [CrossRef]
  8. Le, T.A.; Kang, J.K.; Park, E.D. CO and CO2 Methanation Over Ni/SiC and Ni/SiO2 Catalysts. Top. Catal. 2018, 61, 1537–1544. [Google Scholar] [CrossRef]
  9. Zhou, R.; Rui, N.; Fan, Z.; Liu, C. Effect of the structure of Ni/TiO2 catalyst on CO2 methanation. Int. J. Hydrog. Energy 2016, 41, 22017–22025. [Google Scholar] [CrossRef]
  10. Wierzbicki, D.; Baran, R.; Dębek, R.; Motak, M.; Grzybek, T.; Gálvez, M.E.; Da Costa, P. The influence of nickel content on the performance of hydrotalcite-derived catalysts in CO2 methanation reaction. Int. J. Hydrog. Energy 2017, 42, 23548–23555. [Google Scholar] [CrossRef]
  11. Kesavan, J.K.; Luisetto, I.; Tuti, S.; Meneghini, C.; Iucci, G.; Battocchio, C.; Mobilio, S.; Casciardi, S.; Sisto, R. Nickel supported on YSZ: The effect of Ni particle size on the catalytic activity for CO2 methanation. J. CO2 Util. 2018, 23, 200–211. [Google Scholar] [CrossRef]
  12. Kim, A.; Sanchez, C.; Patriarche, G.; Ersen, O.; Moldovan, S.; Wisnet, A.; Sassoye, C.; Debecker, D.P. Selective CO2 methanation on Ru/TiO2 catalysts: Unravelling the decisive role of the TiO2 support crystal structure. Catal. Sci. Technol. 2016, 6, 8117–8128. [Google Scholar] [CrossRef] [Green Version]
  13. Qin, Z.; Wang, X.; Dong, L.; Su, T.; Li, B.; Zhou, Y.; Jiang, Y.; Luo, X.; Ji, H. CO2 methanation on Co/TiO2 catalyst: Effects of Y on the support. Chem. Eng. Sci. 2019, 210, 115245. [Google Scholar] [CrossRef]
  14. Low, J.; Cheng, B.; Yu, J. Surface modification and enhanced photocatalytic CO2 reduction performance of TiO2: A review. Appl. Surf. Sci. 2017, 392, 658–686. [Google Scholar] [CrossRef]
  15. Xu, M.; Hu, X.; Wang, S.; Yu, J.; Zhu, D.; Wang, J. Photothermal effect promoting CO2 conversion over composite photocatalyst with high graphene content. J. Catal. 2019, 377, 652–661. [Google Scholar] [CrossRef]
  16. Jantarang, S.; Lovell, E.C.; Tan, T.H.; Scott, J.; Amal, R. Role of support in photothermal carbon dioxide hydrogenation catalysed by Ni/CexTiyO2. Prog. Nat. Sci. Mater. Int. 2018, 28, 168–177. [Google Scholar] [CrossRef]
  17. Li, Z.; Liu, J.; Shi, R.; Waterhouse, G.I.N.; Wen, X.D.; Zhang, T. Fe-Based Catalysts for the Direct Photohydrogenation of CO2 to Value-Added Hydrocarbons. Adv. Energy Mater. 2021, 11, 2002783. [Google Scholar] [CrossRef]
  18. Batzill, M.; Morales, E.H.; Diebold, U. Influence of nitrogen doping on the defect formation and surface properties of TiO2 rutile and anatase. Phys. Rev. Lett. 2006, 96. [Google Scholar] [CrossRef]
  19. Pecchi, G.; Jiliberto, M.G.; Buljan, A.; Delgado, E.J. Relation between defects and catalytic activity of calcium doped LaFeO3 perovskite. Solid State Ion. 2011, 187, 27–32. [Google Scholar] [CrossRef]
  20. Li, Z.H.; Tian, S.X.; Wang, H.T.; Tian, H.B. Plasma treatment of Ni catalyst via a corona discharge. J. Mol. Catal. A Chem. 2004, 211, 149–153. [Google Scholar] [CrossRef]
  21. Liu, C.J.; Yu, K.; Zhang, Y.P.; Zhu, X.; He, F.; Eliasson, B. Characterization of plasma treated Pd/HZSM-5 catalyst for methane combustion. Appl. Catal. B Environ. 2004, 47, 95–100. [Google Scholar] [CrossRef]
  22. Liu, F.; Leung, Y.H.; Djurišić, A.B.; Ng, A.M.C.; Chan, W.K.; Ng, K.L.; Wong, K.S.; Liao, C.; Shih, K.; Surya, C. Effect of plasma treatment on native defects and photocatalytic activities of zinc oxide tetrapods. J. Phys. Chem. C 2014, 118, 22760–22767. [Google Scholar] [CrossRef]
  23. Quaas, M.; Wulff, H.; Ivanova, O.; Helm, C.A. Plasma chemical reactions of thin nickel films. Surf. Interface Anal. 2008, 40, 552–555. [Google Scholar] [CrossRef]
  24. Horlyck, J.; Nashira, A.; Lovell, E.; Daiyan, R.; Bedford, N.; Wei, Y.; Amal, R.; Scott, J. Plasma Treating Mixed Metal Oxides to Improve Oxidative Performance via Defect Generation. Materials 2019, 12, 2756. [Google Scholar] [CrossRef] [Green Version]
  25. Pastor-Pérez, L.; Belda-Alcázar, V.; Marini, C.; Pastor-Blas, M.M.; Sepúlveda-Escribano, A.; Ramos-Fernandez, E.V. Effect of cold Ar plasma treatment on the catalytic performance of Pt/CeO2 in water-gas shift reaction (WGS). Appl. Catal. B Environ. 2018, 225, 121–127. [Google Scholar] [CrossRef] [Green Version]
  26. Saputera, W.H.; Tahini, H.A.; Sabsabi, M.; Tan, T.H.; Bedford, N.M.; Lovell, E.; Cui, Y.; Hart, J.N.; Friedmann, D.; Smith, S.C.; et al. Light-Induced Synergistic Multidefect Sites on TiO2/SiO2 Composites for Catalytic Dehydrogenation. ACS Catal. 2019, 9, 2674–2684. [Google Scholar] [CrossRef]
  27. Tan, T.H.; Scott, J.; Ng, Y.H.; Taylor, R.A.; Aguey-Zinsou, K.F.; Amal, R. Understanding Plasmon and Band Gap Photoexcitation Effects on the Thermal-Catalytic Oxidation of Ethanol by TiO2-Supported Gold. ACS Catal. 2016, 6, 1870–1879. [Google Scholar] [CrossRef]
  28. Shah, M.W.; Zhu, Y.; Fan, X.; Zhao, J.; Li, Y.; Asim, S.; Wang, C. Facile Synthesis of Defective TiO2−x Nanocrystals with High Surface Area and Tailoring Bandgap for Visible-light Photocatalysis. Sci. Rep. 2015, 5. [Google Scholar] [CrossRef] [Green Version]
  29. Duan, Y.; Zhang, M.; Wang, L.; Wang, F.; Yang, L.; Li, X.; Wang, C. Plasmonic Ag-TiO2−x nanocomposites for the photocatalytic removal of NO under visible light with high selectivity: The role of oxygen vacancies. Appl. Catal. B Environ. 2017. [Google Scholar] [CrossRef]
  30. Kalaiarasi, S.; Sivakumar, A.; Martin Britto Dhas, S.A.; Jose, M. Shock wave induced anatase to rutile TiO2 phase transition using pressure driven shock tube. Mater. Lett. 2018, 219, 72–75. [Google Scholar] [CrossRef]
  31. Tian, F.; Zhang, Y.; Zhang, J.; Pan, C. Raman spectroscopy: A new approach to measure the percentage of anatase TiO2 exposed (001) facets. J. Phys. Chem. C 2012, 116, 7515–7519. [Google Scholar] [CrossRef]
  32. Surmacki, J.; Wroński, P.; Szadkowska-Nicze, M.; Abramczyk, H. Raman spectroscopy of visible-light photocatalyst—Nitrogen-doped titanium dioxide generated by irradiation with electron beam. Chem. Phys. Lett. 2013, 566, 54–59. [Google Scholar] [CrossRef]
  33. Yu, J.; Xiang, Q.; Zhou, M. Preparation, characterization and visible-light-driven photocatalytic activity of Fe-doped titania nanorods and first-principles study for electronic structures. Appl. Catal. B Environ. 2009, 90, 595–602. [Google Scholar] [CrossRef]
  34. Yin, W.J.; Chen, S.; Yang, J.H.; Gong, X.G.; Yan, Y.; Wei, S.H. Effective band gap narrowing of anatase TiO2 by strain along a soft crystal direction. Appl. Phys. Lett. 2010, 96. [Google Scholar] [CrossRef] [Green Version]
  35. Mateo, D.; Morlanes, N.; Maity, P.; Shterk, G.; Mohammed, O.F.; Gascon, J. Efficient Visible-Light Driven Photothermal Conversion of CO2 to Methane by Nickel Nanoparticles Supported on Barium Titanate. Adv. Funct. Mater. 2021, 31. [Google Scholar] [CrossRef]
  36. Chen, J.; Albella, P.; Pirzadeh, Z.; Alonso-González, P.; Huth, F.; Bonetti, S.; Bonanni, V.; Åkerman, J.; Nogués, J.; Vavassori, P.; et al. Plasmonic nickel nanoantennas. Small 2011, 7, 2341–2347. [Google Scholar] [CrossRef] [Green Version]
  37. Nguyen Thanh, D.; Kikhtyanin, O.; Ramos, R.; Kothari, M.; Ulbrich, P.; Munshi, T.; Kubička, D. Nanosized TiO2—A promising catalyst for the aldol condensation of furfural with acetone in biomass upgrading. Catal. Today 2016, 277, 97–107. [Google Scholar] [CrossRef]
  38. Liu, L.; Zhao, H.; Andino, J.M.; Li, Y. Photocatalytic CO2 reduction with H2O on TiO2 nanocrystals: Comparison of anatase, rutile, and brookite polymorphs and exploration of surface chemistry. ACS Catal. 2012, 2, 1817–1828. [Google Scholar] [CrossRef]
  39. Inturi, S.N.R.; Suidan, M.; Smirniotis, P.G. Influence of synthesis method on leaching of the Cr-TiO2 catalyst for visible light liquid phase photocatalysis and their stability. Appl. Catal. B Environ. 2016, 180, 351–361. [Google Scholar] [CrossRef]
  40. Meeyoo, V.; Panchan, N.; Phongprueksathat, N.; Traitangwong, A.; Guo, X.; Li, C.; Rirksomboon, T. Low Temperature Methanation of CO2 on High Ni Content Ni-Ce-ZrOδ Catalysts Prepared via One-Pot Hydrothermal Synthesis. Catalysts 2019, 10, 32. [Google Scholar] [CrossRef] [Green Version]
  41. Shen, Y.; Lua, A.C. Sol-gel synthesis of Ni and Ni supported catalysts for hydrogen production by methane decomposition. RSC Adv. 2014, 4, 42159–42167. [Google Scholar] [CrossRef]
  42. Grosvenor, A.P.; Biesinger, M.C.; Smart, R.C., St.; McIntyre, N.S. New interpretations of XPS spectra of nickel metal and oxides. Surf. Sci. 2006, 600, 1771–1779. [Google Scholar] [CrossRef]
  43. An, H.R.; Park, S.Y.; Kim, H.; Lee, C.Y.; Choi, S.; Lee, S.C.; Seo, S.; Park, E.C.; Oh, Y.K.; Song, C.G.; et al. Advanced nanoporous TiO2 photocatalysts by hydrogen plasma for efficient solar-light photocatalytic application. Sci. Rep. 2016, 6. [Google Scholar] [CrossRef] [PubMed]
  44. Rodríguez, J.L.; Poznyak, T.; Valenzuela, M.A.; Tiznado, H.; Chairez, I. Surface interactions and mechanistic studies of 2,4-dichlorophenoxyacetic acid degradation by catalytic ozonation in presence of Ni/TiO2. Chem. Eng. J. 2013, 222, 426–434. [Google Scholar] [CrossRef]
  45. Tahir, M.; Tahir, B.; Amin, N.A.S.; Muhammad, A. Photocatalytic CO2 methanation over NiO/In2O3 promoted TiO2 nanocatalysts using H2O and/or H2 reductants. Energy Convers. Manag. 2016, 119, 368–378. [Google Scholar] [CrossRef]
  46. Bharti, B.; Kumar, S.; Lee, H.N.; Kumar, R. Formation of oxygen vacancies and Ti3+ state in TiO2 thin film and enhanced optical properties by air plasma treatment. Sci. Rep. 2016, 6. [Google Scholar] [CrossRef]
  47. Li, J.; Ye, Y.; Ye, L.; Su, F.; Ma, Z.; Huang, J.; Xie, H.; Dorokin, D.E.; Zimina, A.; Grunwaldt, J.-D.; et al. Sunlight induced photo-thermal synergistic catalytic CO2 conversion via localized surface plasmon resonance of MoO3−x. J. Mater. Chem. A 2019, 7, 2821–2830. [Google Scholar] [CrossRef] [Green Version]
  48. Chen, B.; Wang, B.; Sun, Y.; Wang, X.; Fu, M.; Wu, J.; Chen, L.; Tan, Y.; Ye, D. Plasma-Assisted Surface Interactions of Pt/CeO2 Catalyst for Enhanced Toluene Catalytic Oxidation Bingxu. Catalysts 2019, 9, 2. [Google Scholar] [CrossRef] [Green Version]
Figure 1. (a) EPR spectra of TiO2 and plasma-treated TiO2 ((P)TiO2); Raman spectra of TiO2 and (P)TiO2 (b) 0−1200 cm−1 and (c) magnified spectra at 1000−1100 cm−1. P = plasma treated.
Materials 14 04195 g001
Figure 2. (a) UV-vis-NIR absorbance of TiO2 and pretreated Ni/TiO2; (b) CO2-TPD of TiO2 and plasma-treated TiO2 ((P)TiO2); H2-TPR of (c) TiO2 and NiO/TiO2 and (d) pretreated Ni/TiO2. R = reduced/passivated, P = plasma treated.
Materials 14 04195 g002
Figure 3. XPS spectra of pretreated Ni/TiO2: (a) Ni 2p3/2, (b) Ti 2p, and (c) O 1s. R = reduced/passivated, P = plasma treated.
Materials 14 04195 g003
Figure 4. TEM images and EDS mapping of (a) (R)Ni/TiO2, (b) (P-R)Ni/TiO2 and (c) (R-P)Ni/TiO2 including: (i,v) bright field images; (ii,vi) dark field images; (iii,vii) EDS mapping; and (iv,viii) particle size distribution histograms with range of particle counts = 50–100. R = reduced/passivated, P = plasma treated.
Materials 14 04195 g004
Figure 5. The influence of Ni/TiO2 catalyst pretreatment on (a) methane formation and (b) the temperature profile during photothermal CO2 methanation in a batch-circulated reactor system. Catalyst loading = 100 mg; Initial reactant pressure = ~15 kPa CO2 and ~60 kPa H2; illumination provided by a 300 W Xenon lamp. The influence of Ni/TiO2 catalyst pretreatment on (c) CO2 conversion and (d) methane selectivity during decoupled photo-and-thermal CO2 methanation in a continuous flow reactor system. Catalyst loading = 100 mg; reacting gas flow rate = 4 mL/min CO2 and 16 mL/min H2; illumination provided by a 300 W Xenon lamp. Thermal only reaction indicated by the filled markers (●). R = reduced/passivated, P = plasma treated.
Materials 14 04195 g005
Table 1. BET specific surface area and crystallite size (TiO2, NiO, and Ni) of as-prepared and pretreated Ni/TiO2.
CatalystPretreatment aSBET (m2/g) bTiO2 Crystal Size (nm) cNiO Crystal Size (nm) cNi Crystal Size (nm) c
TiO2N/A10422.0N/AN/A
NiO/TiO2N/A6621.07.7N/A
(R)Ni/TiO2ReducedN.D.23.6N/A13.1
(P)NiO/TiO2Plasma treated7521.09.3N/A
(P-R)Ni/TiO2Plasma treated then reducedN.D.22.6N/A13.7
(R-P)Ni/TiO2Reduced then plasma treatedN.D.23.0N/A12.7
a “Reduced” refers to “reduction/passivation”. b BET specific surface area. c Calculated from 100% intensity peak of XRD pattern (Figure S2).
Publisher’s Note: MDPI stays neutral with regard to jurisdictional claims in published maps and institutional affiliations.

