Abstract
This study sought to examine the performance design of concrete mix proportions to ensure chloride resistance and early strength with respect to C35 (35 MPa), which is the minimum compressive strength class of concrete used in a marine environment. For the proposed concrete mixture, C24 (24 MPa) was selected and binders for concrete were manufactured using a blend of OPC (ordinary Portland cement), EPC (early Portland cement), and GGBS (ground granulated blast-furnace slag). The results of the experiment confirmed that the combined use of EPC and GGBS greatly improve the early-strength development and chloride resistance of concrete. An analysis revealed that the time for removal of forms can be reduced by 5–9 h from the aspect of early concrete strength. Moreover, in terms of construction productivity, EPC and GGBS were reduced by up to 16.39 h/cycle compared to other concretes. Regarding economic and environmental impacts, EPC and GGBS were more effective than C35 concrete. This study is significant as its findings help make it possible to examine the most economical concrete mix design in relation to strength development according to the application of EPC, GGBS, and PC-based admixtures.
1. Introduction
Reinforced concrete (RC) structures in a marine environment should ensure the durability of steel-reinforced concrete against chloride ion ingress in consideration of the local-area circumstances. In concrete, a passive film is formed on the steel surface to block contact with water and oxygen and thus prevent the corrosion of the reinforcement. The presence of chloride ions (Cl−) in the marine environment affects the corrosion of ferrous (Fe2+) metals [1,2,3,4]. The corrosion of the reinforcement leads to concrete cover cracking and degrading in the RC structure due to volume expansion, resulting in the deterioration of the durability of the concrete [5,6,7,8,9].
Chloride, which is a major factor in the corrosion of the reinforcement, can be incorporated into cement, aggregates, mixing water, and admixtures, etc., in the process of concrete mix design. It can also occur in a variety of environments, such as airborne chlorides, groundwater elution, and seawater [10,11].
Therefore, to limit the chloride introduced in the process of mixing concrete, the current structural design codes [12,13,14] prescribe that quality tests be carried out in the production of concrete. The limit value of the chloride content in concrete placed through the onsite quality control does not significantly affect the reinforcement corrosion until the end of the required durability period. This is not the case, however, with chlorides introduced from the external environment, or the outside. Chloride that penetrates from the outside is continuously absorbed by the surface of the concrete due to airborne chloride ingress resulting from the effects of wind near coastal areas. In addition, concrete structures built in marine conditions and those with high groundwater levels have very high chloride concentrations in the water. Therefore, there is a need to not only control the amount of chloride during the manufacturing process but also consider the chloride penetrating from the outside [6,7,15,16,17,18].
In order to secure the durability of concrete structures by controlling the chloride that penetrates from the outside, various design standards have been proposed from different countries. Correspondingly, concrete mix design considering the thickness of the concrete cover, the increase of the concrete strength, and the replacement of the functional admixtures has been recommended in most cases. The Euro code and ACI (such as ACI 201 2016, BSI 2004, EN 13670 2010, Euro 1993, etc.) suggest that the minimum strength grade of concrete in a marine environment should be C35 (characteristic value of concrete 35 MPa) or higher [1,19,20,21]. It is also stipulated that functional admixtures such as GGBS (ground granulated blast-furnace slag), fly ash, and silica fume should be mixed to improve the chloride penetration resistance properties through the watertightness of the concrete [22,23,24,25]. Due to its long-term watertightness improvement and superior chloride ion biding capacity, GGBS has been recommended for use in coastal areas [26,27,28,29].
Meanwhile, the durability design criteria for concrete structures proposed based on national standards are excellent in terms of structural stability but cannot be considered performance design criteria considering the properties of materials. Furthermore, they can lead to excessive design depending on the regional characteristics. In addition, concrete using GGBS delays early-strength development, which may result in a decline in construction productivity. Therefore, it has been recommended that mineral admixtures like GGBS should be used to replace only a portion of the entire binder [30,31,32].
When the mineral admixture is used in concrete mix proportions, the concrete strength specification is improved to secure the strength required for the removal of forms and to reduce the construction duration. In the actual construction site, there is an urgent need for a method to promote economic efficiency and to reduce the construction duration for the improvement of the construction productivity, and it is continuously required to ensure the early strength of concrete. In addition, the demand for sustainability in consideration of the durability of concrete is continuously increasing, and research results are also being reported [33,34,35].
In this regard, this study sought to examine the performance design of concrete mix proportions to secure durability and economic efficiency compared with the C35 concrete recommended and used in coastal areas. Towards this end, the concrete mix proportion table used in the local area was utilized in the experiment. Based on the total weight of the binder, a 20 wt.% GGBS content was added to secure the chloride resistance performance of concrete, and the EPC (early Portland cement) was replaced with 50 wt.% of the total binder of OPC (ordinary Portland cement) to secure the early-strength performance of concrete. To secure the stable strength of concrete, the unit water content was reduced with the use of polycarboxylic superplasticizers to decrease the water/binder (W/B).
Based on the evaluation of the compressive strength, chloride penetration depth, chloride ion diffusion coefficient, and pore structures, the improvement of the chloride resistance of concrete was examined. In addition, productivity analysis was conducted to identify productivity improvement due to the reduction of the time for the removal of forms. Additionally, the economic and environmental impacts of concrete were analyzed.
2. Experiment Procedure
2.1. Materials
Table 1 shows the materials properties in this study. As binders for concrete used in this study, OPC, EPC, and GGBS were used. Table 2 shows the chemical compositions of the used binders. The most dominant ingredients of OPC, EPC, and GGBS are CaO, SiO2, and Al2O3, and the SiO2, Al2O3, and MgO contents of GGBS are larger than those of OPC and EPC.

Table 1.
Physical properties of the used materials.
Table 2.
Chemical compositions on used binders.
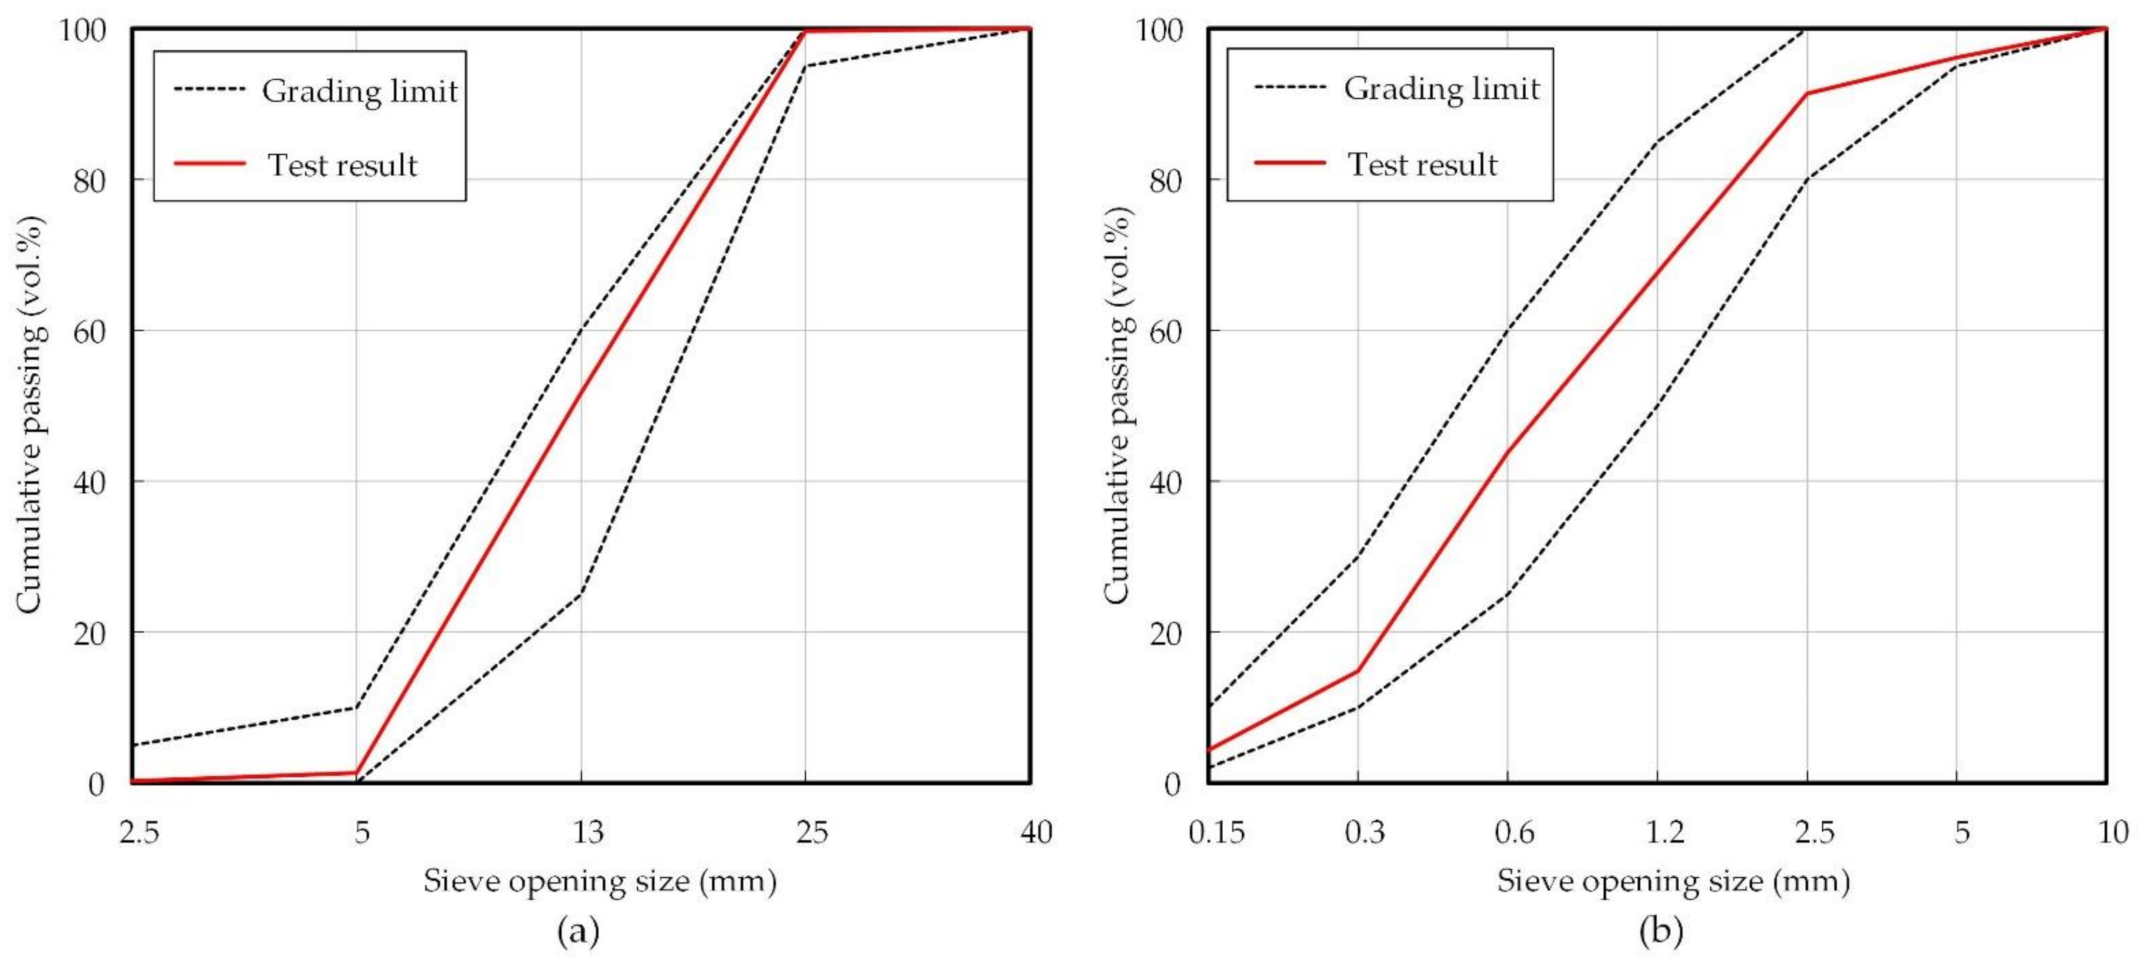
The mixture of washed sea sand and crushed sand was used for the fine aggregate, and a 25 mm crushed granitic aggregate was used as the coarse aggregate. Figure 1 shows the gradation sieve analysis curves of the aggregates used. The experiment was conducted after confirming that the aggregate used satisfies a range of the standard particle size distribution curve. The naphthalene group and polycarboxylic acid group were used as chemical admixtures to secure the sufficient workability of concrete.
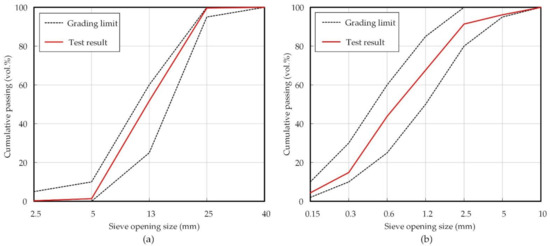
Figure 1.
Gradation sieve curves of aggregates used: (a) coarse aggregates and (b) fine aggregates.
2.2. Experiment Plan and Mix Proportions
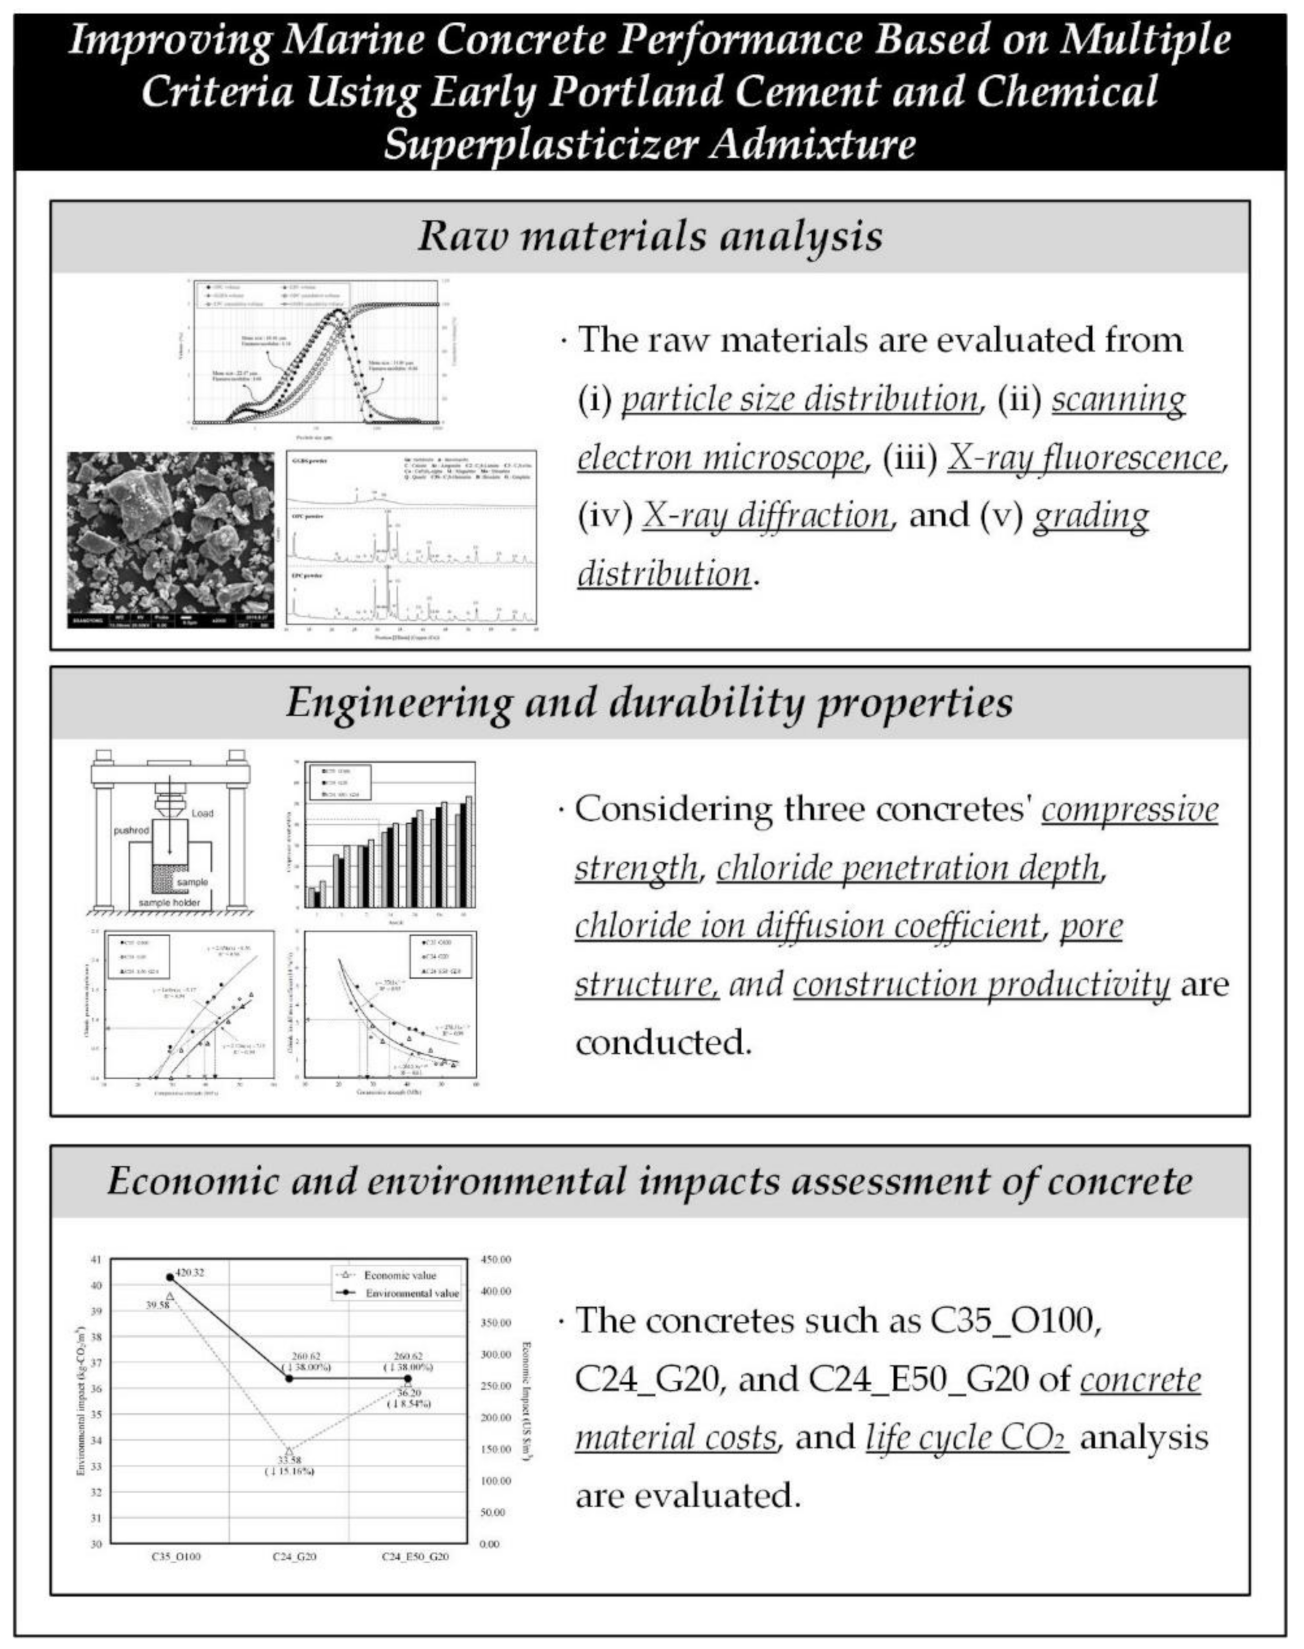
Figure 2 shows the research process that was employed in this study, which included the following three steps: raw material analysis, engineering and durability properties, and economic and environmental impact assessment of concrete. A detailed explanation of this is as follows.

Figure 2.
Research process.
Table 3 shows the experiment plan of this study. For the analysis of concrete, raw materials were analyzed, and the physical and chemical properties of concrete were examined based on the analysis. For the analysis of raw materials, the particle size distribution, grading distribution, and the results of X-ray fluorescence, scanning electron microscopy, and X-ray diffraction were examined as evaluation items.
Table 3.
Experimental plan.
The compressive strength of the concrete that was used in this study was set to C35 (characteristic value of concrete 35 MPa), which is the minimum strength class for exposure conditions in areas vulnerable to chloride attack recommended by the Euro code [1,19]. For C35_O100, reference was made to the mix proportion table utilized in the actual production by a ready-mix concrete company in a local area, and 100% cement was used. In addition, a comparison experiment was conducted with reference to the mix proportion used as the mix ratio for C24 (characteristic value of concrete 24 MPa) concrete. For C24_G20, GGBS was replaced at 20% of the total binder, which is a range that does not significantly reduce compressive strength while ensuring chloride resistance. For C24_E50_G20, 50% of the EPC was replaced to increase the early strength of concrete due to the replacement of GGBS. In addition, polycarboxylic superplasticizer was used in combination to improve the workability and strength of concrete.
The evaluation items included the compressive strength, chloride penetration depth, chloride ion diffusion coefficient, and pore structure.
Table 4 shows the concrete mix proportions in this study. For the mix proportions that were used in this study, the mix table for concrete produced at the ready-mix concrete plant was used. In the case of C35_O100, the unit water content was 185 kg/m3, and the amount of OPC used was 444 kg/m3. For C24_G20 and C24_E50_G20, the unit water content was 163 kg/m3, and the powder content was 340 kg/m3. Based on the existing literature, the quantity of GGBS replacement was set to 20% of the total unit weight of binder considering the long-term strength development of concrete. The concrete slump was set to 180 ± 25 mm to satisfy sufficient workability considering the construction site conditions, and the air contents (%) were set to satisfy the 4.5 ± 1.5% range.
Table 4.
Mixing proportions of concrete.
2.3. Experiment Method
2.3.1. Binder Raw Material Analysis
Table 5 shows the test methods for the raw materials of binders. For the binder raw material analysis, the particle size distribution was measured in accordance with ASTM C204 [36], SEM was done in accordance with ASTM C1723 [37], XRF was done in accordance with ASTM C114 [38], and XRD was done in accordance with ASTM C1365 [39].
Table 5.
Test methods for raw materials of binders.
2.3.2. Fresh and Hardened Properties of Concrete
To evaluate the fresh properties of concrete, a slump test was conducted in compliance with ASTM C143 [40], and the air contents were measured in accordance with ASTM C231 [41]. The evaluation of concrete compressive strengths was conducted on the Ø100 × 200 mm cylindrical specimens at set ages. For the test results, the average value of all the three specimens was obtained in accordance with ASTM C873 [42] and ASTM C39 [43].
2.3.3. Durability Properties of Concrete
Table 6 shows the test methods for the durability properties of concrete. The specimen was coated with epoxy resins except for the top surface so that the chloride could penetrate only from one side. The specimen was taken out of the solution at the established ages of 3, 7, 14, 28, 56, and 91 days and was split. The surface was then sprayed with 0.1 N AgNO3 solution for measuring the discoloration depth.
Table 6.
Test methods for engineering and durability properties of concrete.
The chloride diffusion coefficient was evaluated in accordance with the Nordic standard NT BUILD 492 [44]. For the fabrication of a specimen used for the chloride diffusion test, part of the cylindrical specimen was cut into Ø100 × 200-mm-thick disks. The cut specimen was exposed to a 0.3 N NaOH solution (NaOH 12 g in 1 L of water) at the positive electrode, and to a 10% NaCl solution (NaCl 100 g + distilled water 900 g) at the negative electrode, to evaluate the current value when a 30 V voltage was applied. The test was conducted by selecting the applied voltage level and the duration of the test based on the evaluated current value. The chloride penetration depth was determined using AgNO3 solution, and the chloride diffusion coefficient was calculated using Equations (1)–(3).
where Dnssm is the non-steady-state migration coefficient (m2/s); R is the gas constant, R = 8.314 J/(K·mol); T is the average value of the initial and final temperatures in the anolyte solution; z is the absolute value of the ion valence for chloride, z = 1; F is the Faraday constant, F = 9.648 × 10⁴ J/(V·mol); L is the thickness of the specimen, m; U is the absolute value of the applied voltage, V, K; Xd is the average value of the penetration depths, m; t is the test duration, seconds; erf−1 is the inverse of the error function; C0 is the chloride concentration in the catholyte solution, C0 ≈ 2 N; and Cd is the chloride concentration at which the color changes, Cd ≈ 0.07 N for OPC concrete.
The test method used for the chloride penetration depth was in accordance with NT Build 443 [45]. The concrete specimen was fabricated with a 100 × 100 × 400 mm size and was immersed in a 2.8 M NaCl brine solution until the planned age. There were three concrete specimens used in the experiment, and the average value was derived by measuring three places except for the poured upper surface.
The porosity of the inner concrete was examined to evaluate its influence on the compressive strength and air permeability according to the changes in the porosity of concrete at a given age. The test on the porosity of concrete was performed in accordance with ASTM D 4404 [46]. In general, mercury intrusion porosimetry (MIP), which is a technique used for porosity evaluation, is based on the capillary phenomenon, in which a liquid penetrates the micropores. Pressure from the outside is required for non-wetting liquids such as mercury to penetrate the pores. The smaller the pore is, the greater the pressure needed to penetrate it. Through the correlation between the pressure and the pore, the measurement result can be represented as a function of the cumulative penetration volume or the volume of mercury depending on the pressure (or the pore size).
2.3.4. Assessment of the Construction Productivity on Concrete
Based on the elapsed time of concrete (C35_O100, C24_G20, and C24_E50_G20), the construction productivity was analyzed using discrete event simulation. The results showed how much elapsed time affects the construction productivity through the Discrete Event Simulation (DES). Before analyzing the construction productivity, it was important to select the target project [47]. Multi-family housing is one of the most common construction projects. Moreover, several previous researches explored the productivity of structure works in a multi-family housing project [48,49]. Therefore, structure works in a multi-family housing project was selected as a case study for the following reasons. In terms of the construction project, the multi-family housing project accounted for 26% of total construction revenue, which was very large in proportion to other construction projects in South Korea [50]. In terms of the construction works, the structure works which included form installation work, rebar arrangement work, and concrete pouring work, took up to 50% of the total construction project period and 45% of the total construction cost in a multi-family housing project. Therefore, the structure works should be focused on to improve construction productivity [49].
The data were the number of workers and working hours which were established to analyze the construction productivity using DES. The concrete curing hour was considered by elapsed time on concretes. The data were obtained from a practical expert who worked as a general contractor in the multi-family housing project. The collected data was presented in the Supplementary Materials (See Tables S1 and S2). The construction productivity was calculated by using Stroboscope, which was one of the construction productivity simulations as DES. Stroboscope could take into consideration the diversity of resource characteristics relative to other DESs [51]. In the multi-family housing project, the structure works composed start and finish on each floor. Therefore, one cycle indicated the frequency of the structure works on one floor from conducting marking to checking the strength. In this study, the data were insufficient because only one case study had been collected. Thus, this study used a triangular distribution, which was not affected by the number of data and could involve easy and accurate collection of data [49]. The DES was therefore set with 1000 cycles. The DES diagram can be seen in the Supplementary Materials (See Figure S1).
2.3.5. Assessment of Economic and Environmental Impacts on Concrete
For economic and environmental impact assessments, the sum of material costs was obtained and life cycle CO2 analysis of concrete (C35_O100, C24_G20, and C24_E50_G20) was conducted. The following two assumptions were established to obtain the results: (i) the analysis approach; and (ii) the significant cost of ownership [47,52,53,54].
- Analysis approach: In terms of the economic impact, the data of the material unit cost (USD/kg) were obtained from a concrete product manufacturing company in South Korea. In terms of the environmental impact, the data of the material unit CO2 emissions (CO2-kg) were obtained from the life cycle inventory data in South Korea. The material unit cost (USD/kg) and unit CO2 emissions (CO2-kg) are presented in Table 7 [55,56,57,58,59,60].
Table 7. Data of the material unit costs and CO2 emissions.
- Significant cost of ownership: In terms of the economic impact, to present the economic impacts, the cost of the concrete materials is displayed. The cost of concrete materials is calculated by multiplying material unit weight (refer to Table 4) with material unit cost (refer to Table 7) using Equation (4).where CC is the cost of the concrete material (USD/m3).
In terms of the environmental impact, the LCCO2 was calculated using Equation (5).
where CIi is the characterized impact of category (i); CIi is the characterized impact of list item (i); Loadi is the environmental load of list item (i); and eqvi is the characterization coefficient value of list item (i).
In terms of the economic and environmental impacts, the costs and CO2 content of concrete (C35_O100, C24_G20, and C24_E50_G20) were considered from the life cycle perspective.
3. Experiment Results
3.1. Results of the Binder Raw Material Analysis
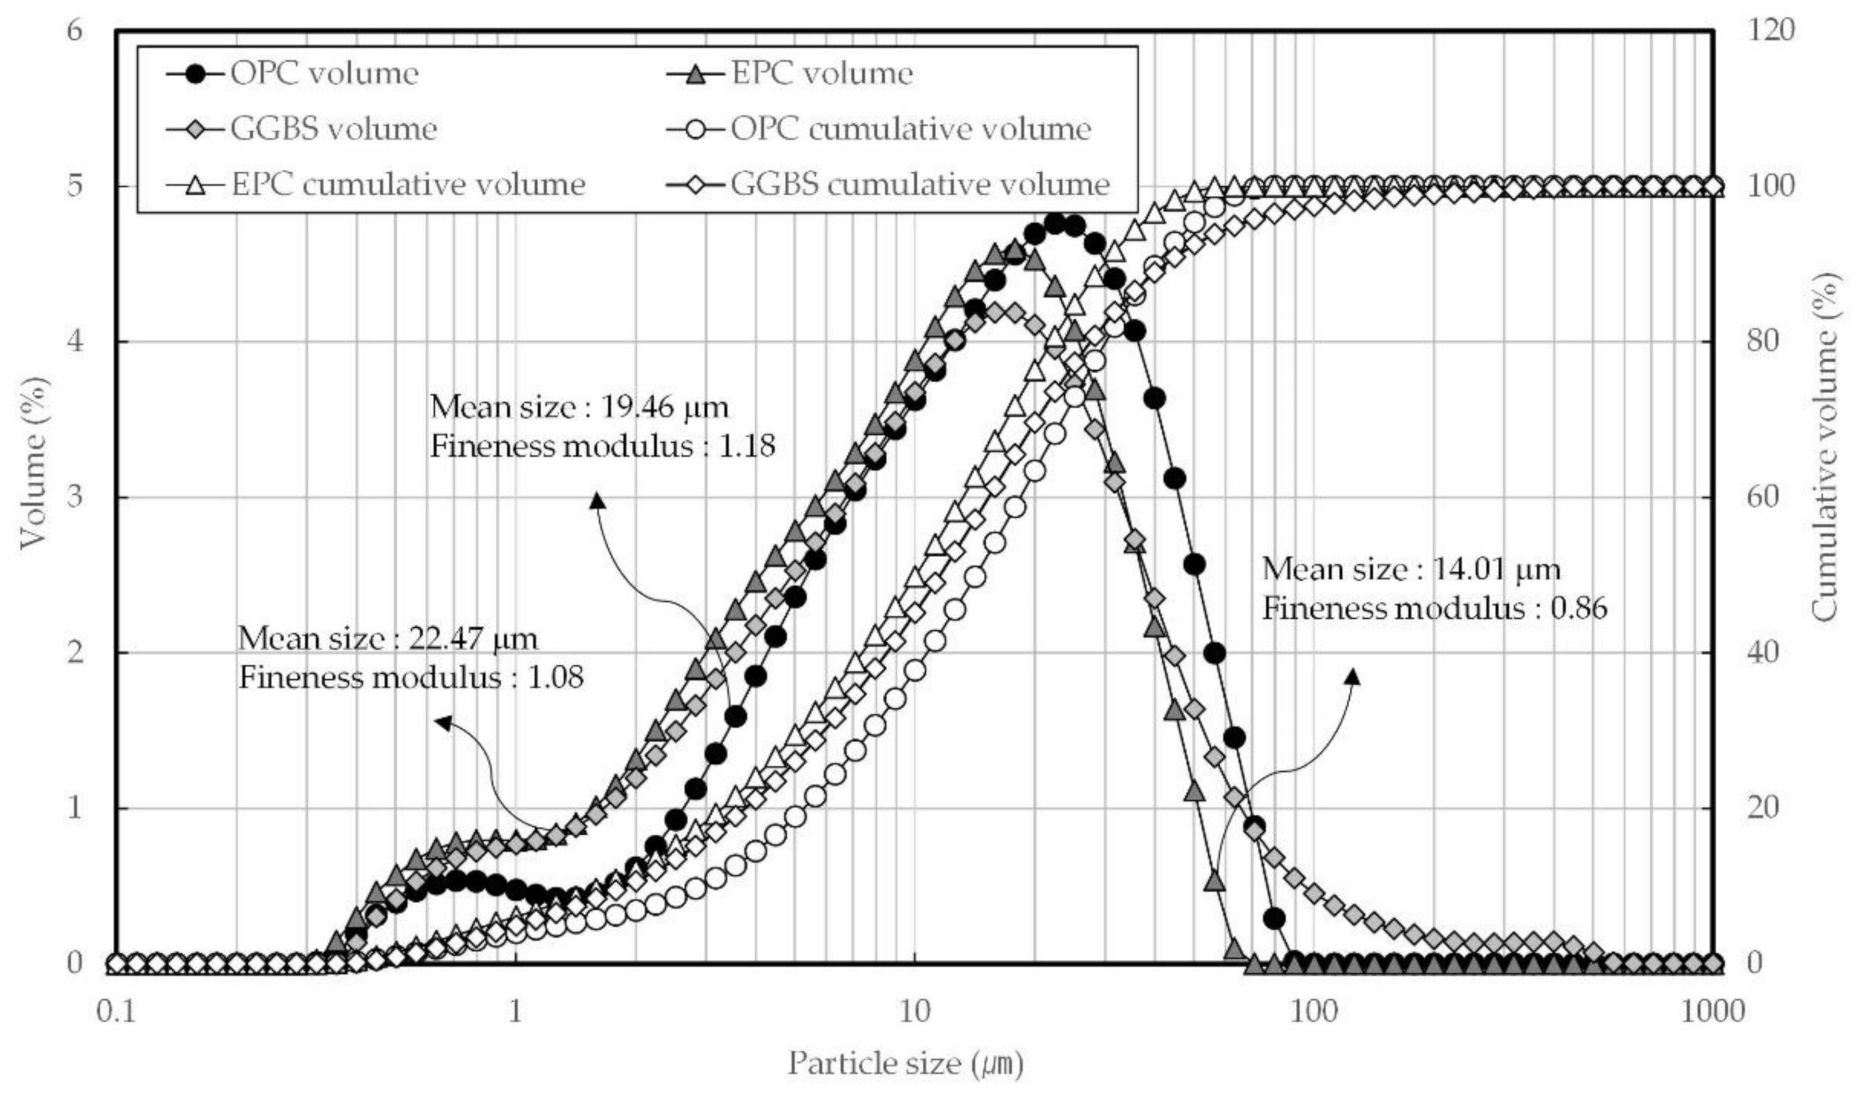
Figure 3 shows the particle size distributions of OPC, EPC, and GGBS. The mean size and fineness modulus were determined to be 19.46 µm and 1.18, respectively, for OPC; 14.01 µm and 10.86 for EPC; and 22.47 µm and 1.08 for GGBS. The number of fine particles was highest in EPC, followed by GGBS and then OPC, while coarse particles larger than 10 µm were most common in OPC. Figure 4 shows the SEM micrograph. OPC was observed to have had irregular polyhedral particles larger than 10 µm and amorphous crystals smaller than 10 µm. The GGBS and EPC particles were found to have had irregular geometries but generally showed fine crystalline phases.

Figure 3.
The particle size distribution of OPC (ordinary Portland cement), EPC (early Portland cement), and GGBS (ground granulated blast-furnace slag).
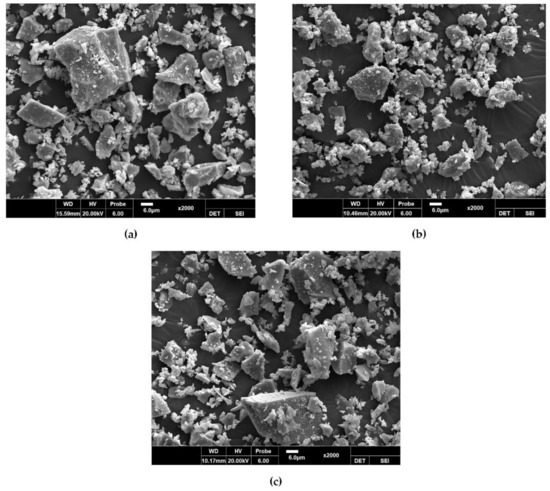
Figure 4.
Scanning electron microscope micrograph: (a) OPC; (b) EPC; (c) GGBS.
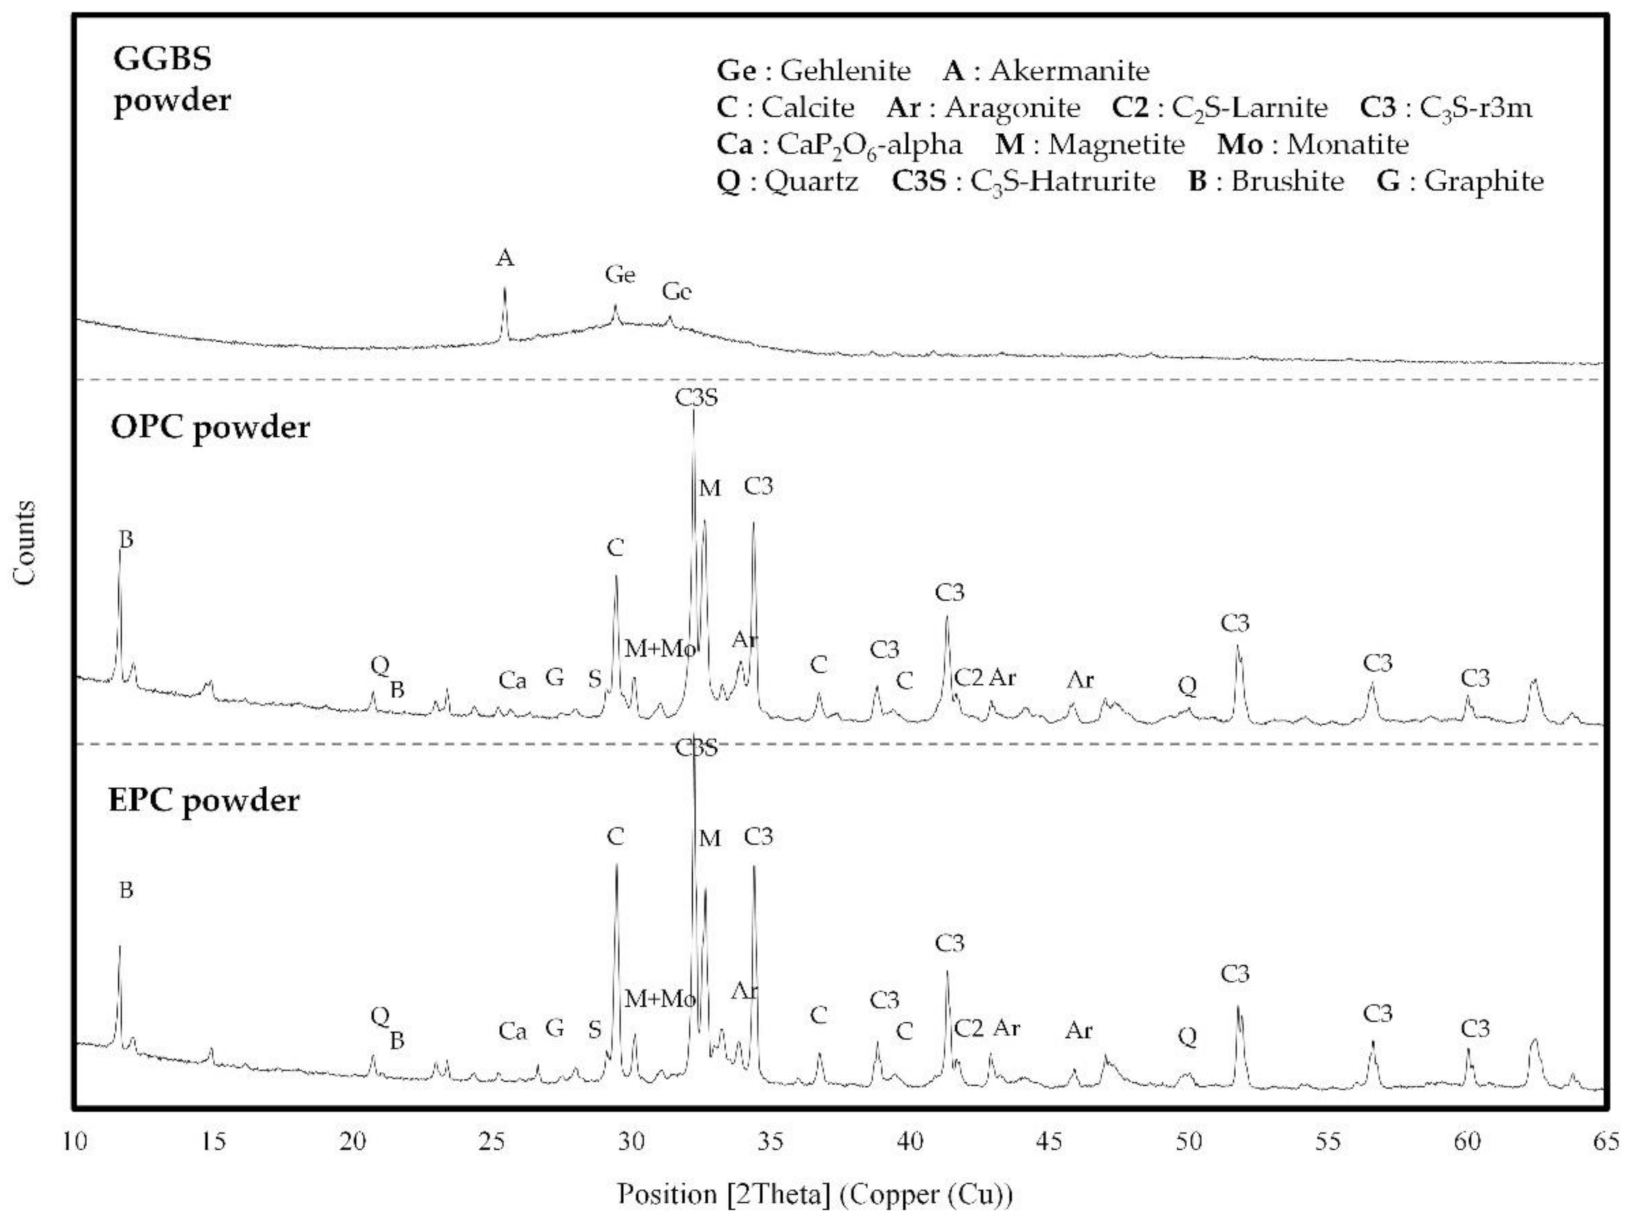
Figure 5 shows the XRD patterns of OPC, EPC, and GGBS. Both OPC and EPC are mainly made up of minerals like C3S (3CaO∙SiO2), C2S (2CaO∙SiO2), C3A (3CaO∙Al2O3), and C4AF (4CaO∙Al2O3∙Fe2O3). It was found that a higher C3S crystalline phase was formed in EPC than in OPC, which suggests that it is more effective during the early-strength development. GGBS is composed mostly of gehlenite and akermanite.

Figure 5.
X-ray diffraction patterns of GGBS, OPC, and EPC.
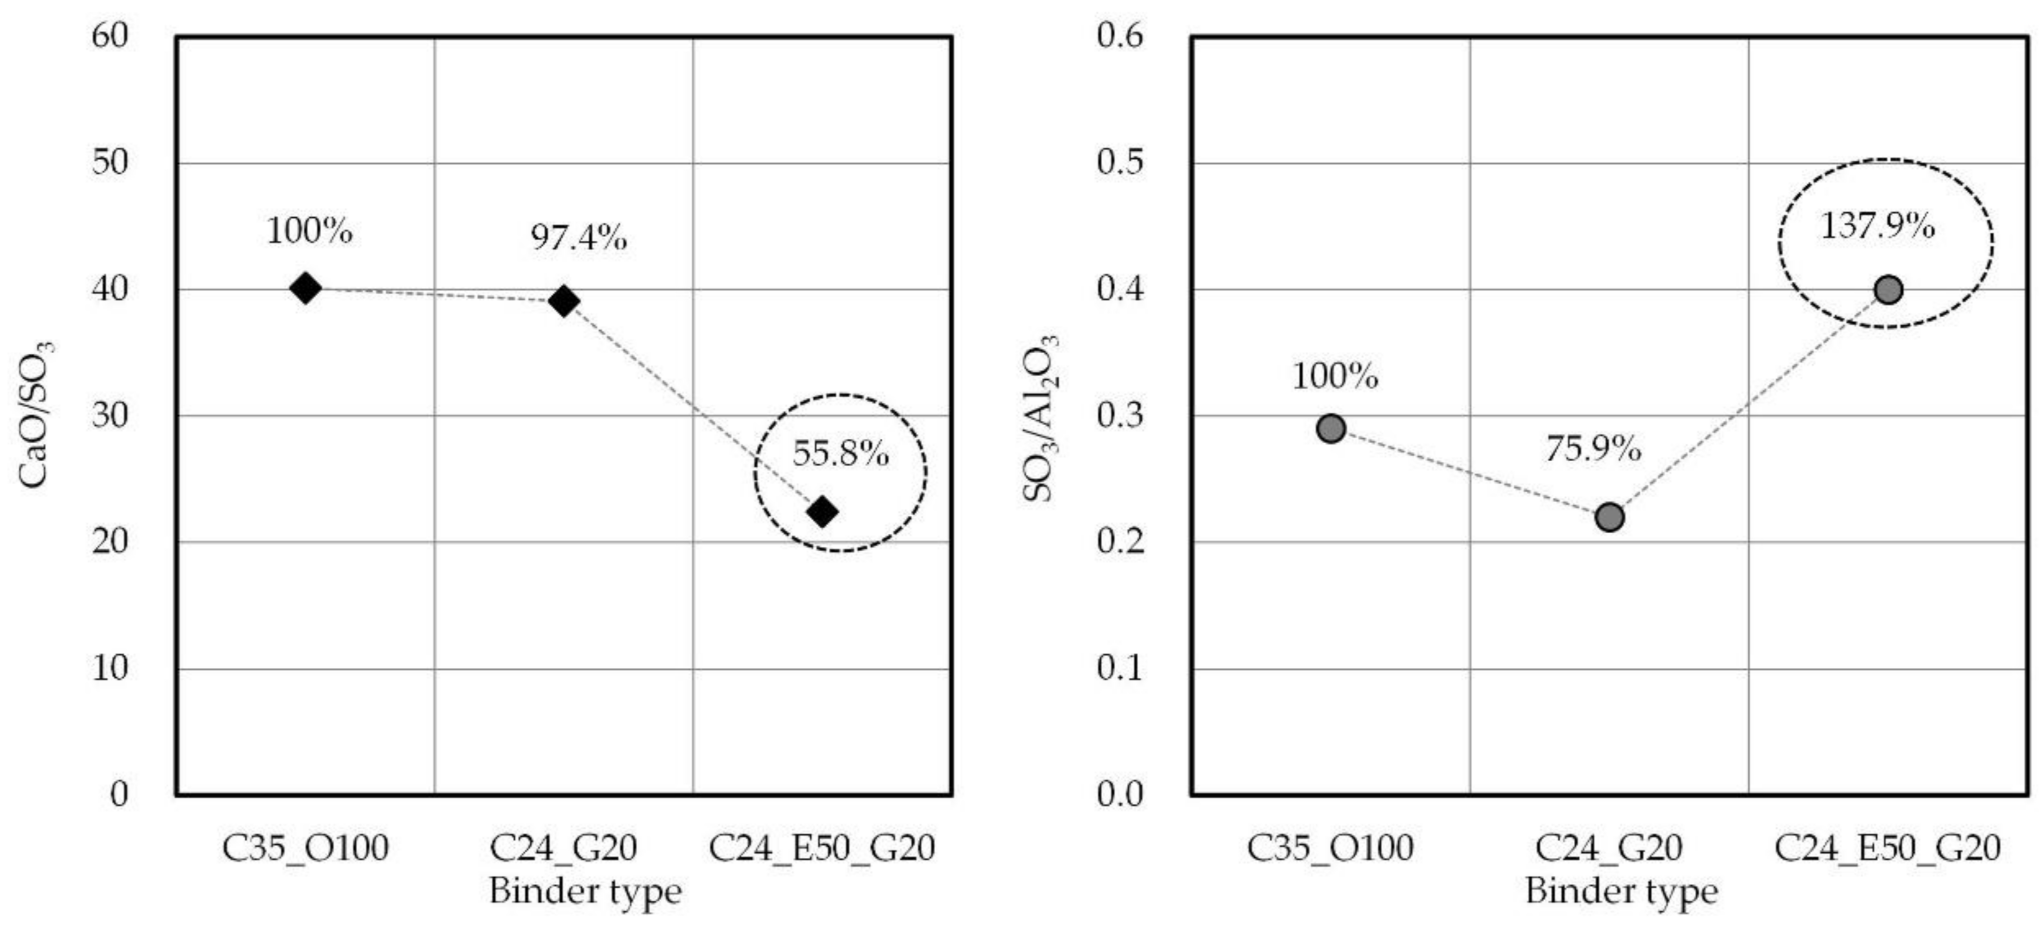
Figure 6 shows the CaO/SO3 and SO3/Al2O3 by binder type. The CaO/SO3 was 97.4% for C24_G20 and 55.8% for C24_E50_G20 compared with C35_O100. In addition, the SO3/Al2O3 was 75.9% for C24_G20 and 137.9% for C24_E50_G20 compared to C35_O10. Therefore, it was confirmed that EPC with a relatively higher SO3 content is more advantageous for early-strength development. The results of the research conducted by Lee et al. reported that an SO3 content less than 5% is advantageous for early-strength development under similar CaO content conditions [61,62,63,64]. Therefore, it is expected that in the case of C24_E50_G20, EPC incorporation can contribute to the early-strength development of concrete.

Figure 6.
CaO/SO3 and SO3/Al2O3 ratios in binder type.
3.2. Fresh and Hardened Properties on Concrete
Table 8 shows the fresh properties of concrete. It was found that in all the concrete mix proportions, the target value (180 ± 25 mm) was satisfied immediately after the mixing and at 60 min of elapsed time. In the case of the C35_O100 mix, the slump decline was 35 mm at 60 min of elapsed time, but 15 mm was found in the other mix proportions. The air content of concrete met the target air volume of 4.5 ± 1.5% in all the mix proportions. Even after a 60-min elapsed-time change, similar results were found in all the mix proportions.
Table 8.
Fresh properties of concrete.
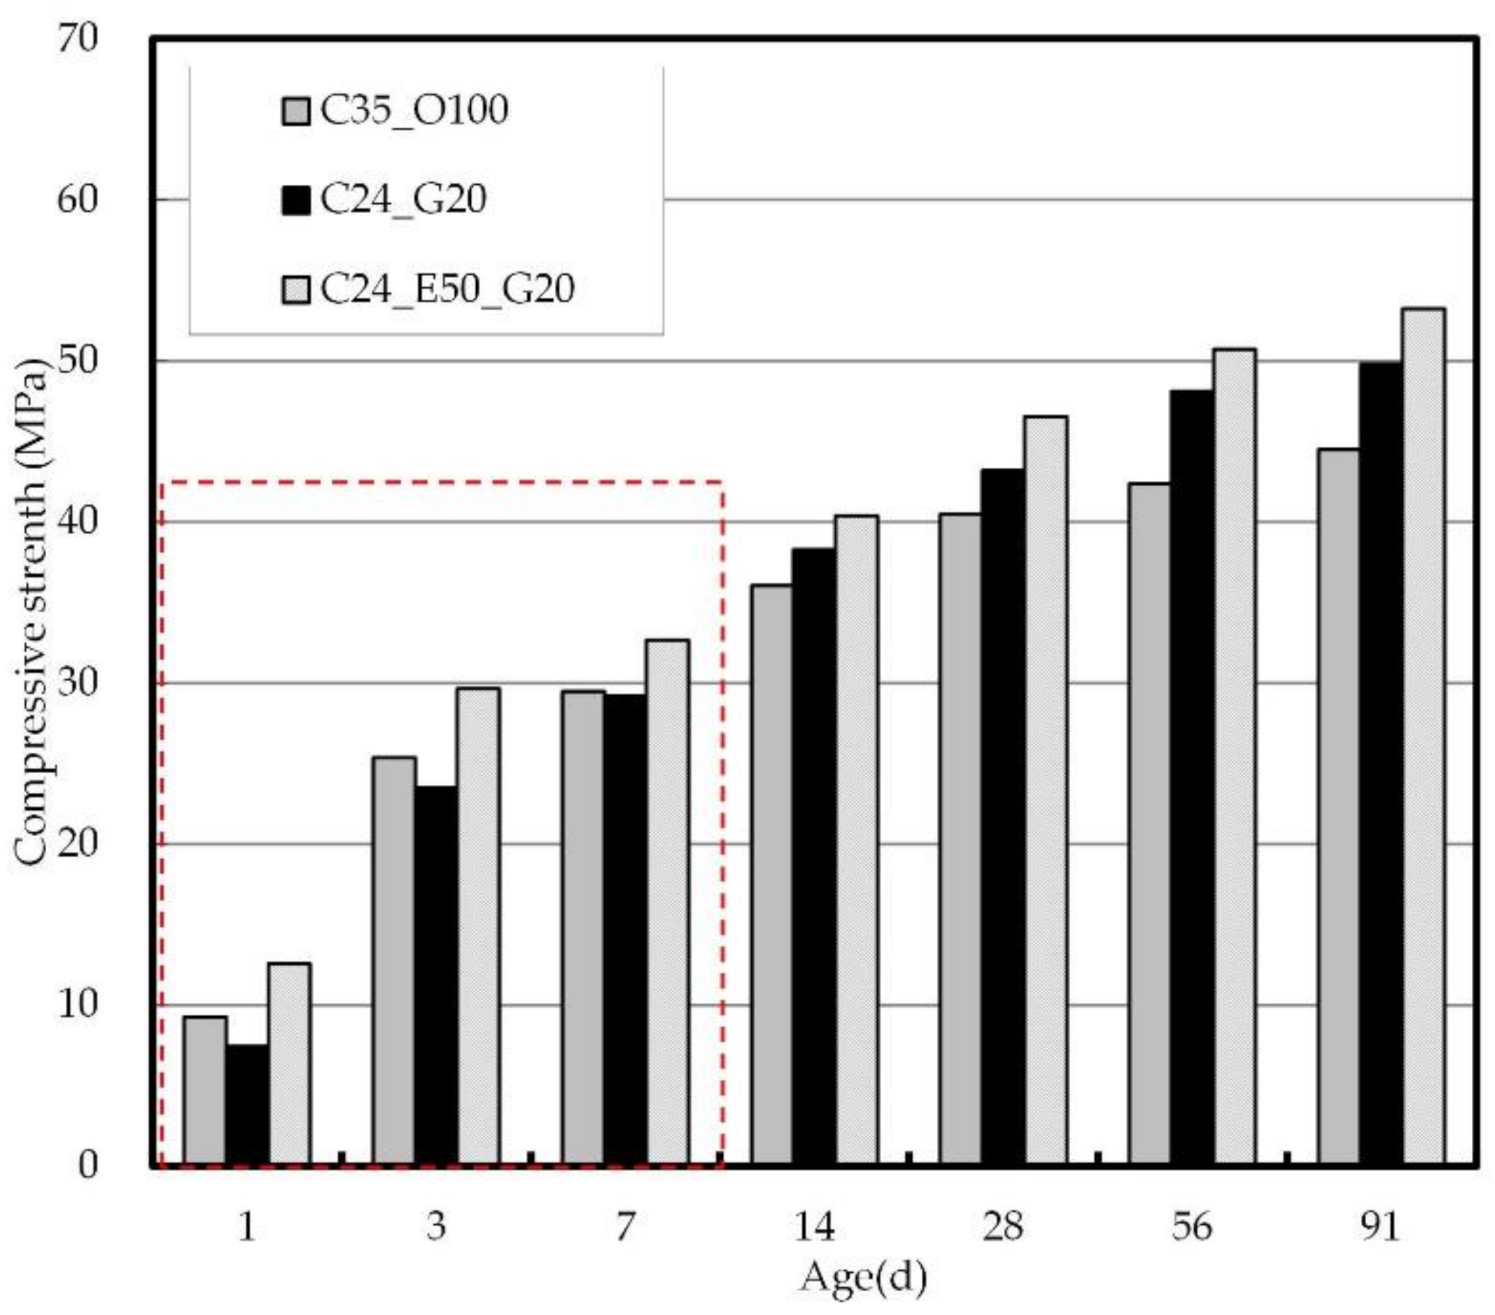
Figure 7 shows the compressive strength of concrete at different ages. With respect to the compressive strength of concrete by mix proportion, C24_E50_G20 exhibited the highest value, whereas C24_G20 showed the lowest value at the early ages of less than or equal to 7 days. Meanwhile, after 7 days, the strength of C24_G20 continued to increase, and the long-term strength was higher than that of C35_O100. The early strength of C24_E50_G20 was high, and the long-term strength development was also found to continue. It is known that EPC has a high C3S content and higher fineness, which is advantageous for the early-strength development of concrete due to the heat of hydration but is unfavorable in terms of long-term strength development [62,65].
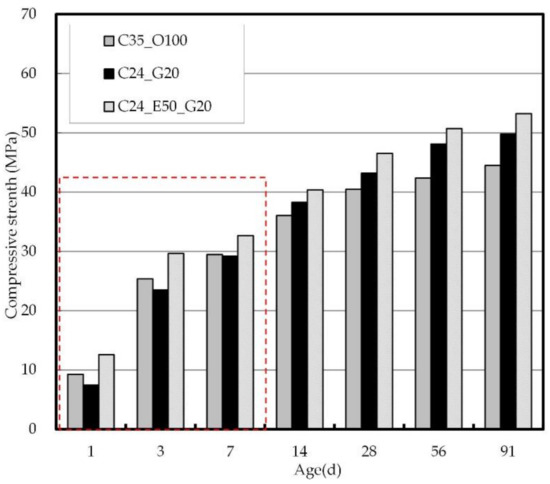
Figure 7.
Compressive strength of concrete by age.
In this study, however, the incorporation of GGBS, which is advantageous for long-term strength development, was found to make up for the shortcomings of EPC and to have a positive influence on long-term strength development. It was also found that the use of a PC-based superplasticizer could reduce the unit water content of concrete despite the low power content compared to C35_O100, thereby contributing to the development of the compressive strength. Therefore, it is expected that the use of EPC and GGBS as binders in combination with a PC-based superplasticizer will make an effective contribution to the development of the compressive strength of concrete while significantly reducing the total binder amount.
3.2.1. Chloride Penetration Depth and Chloride Ion Diffusion
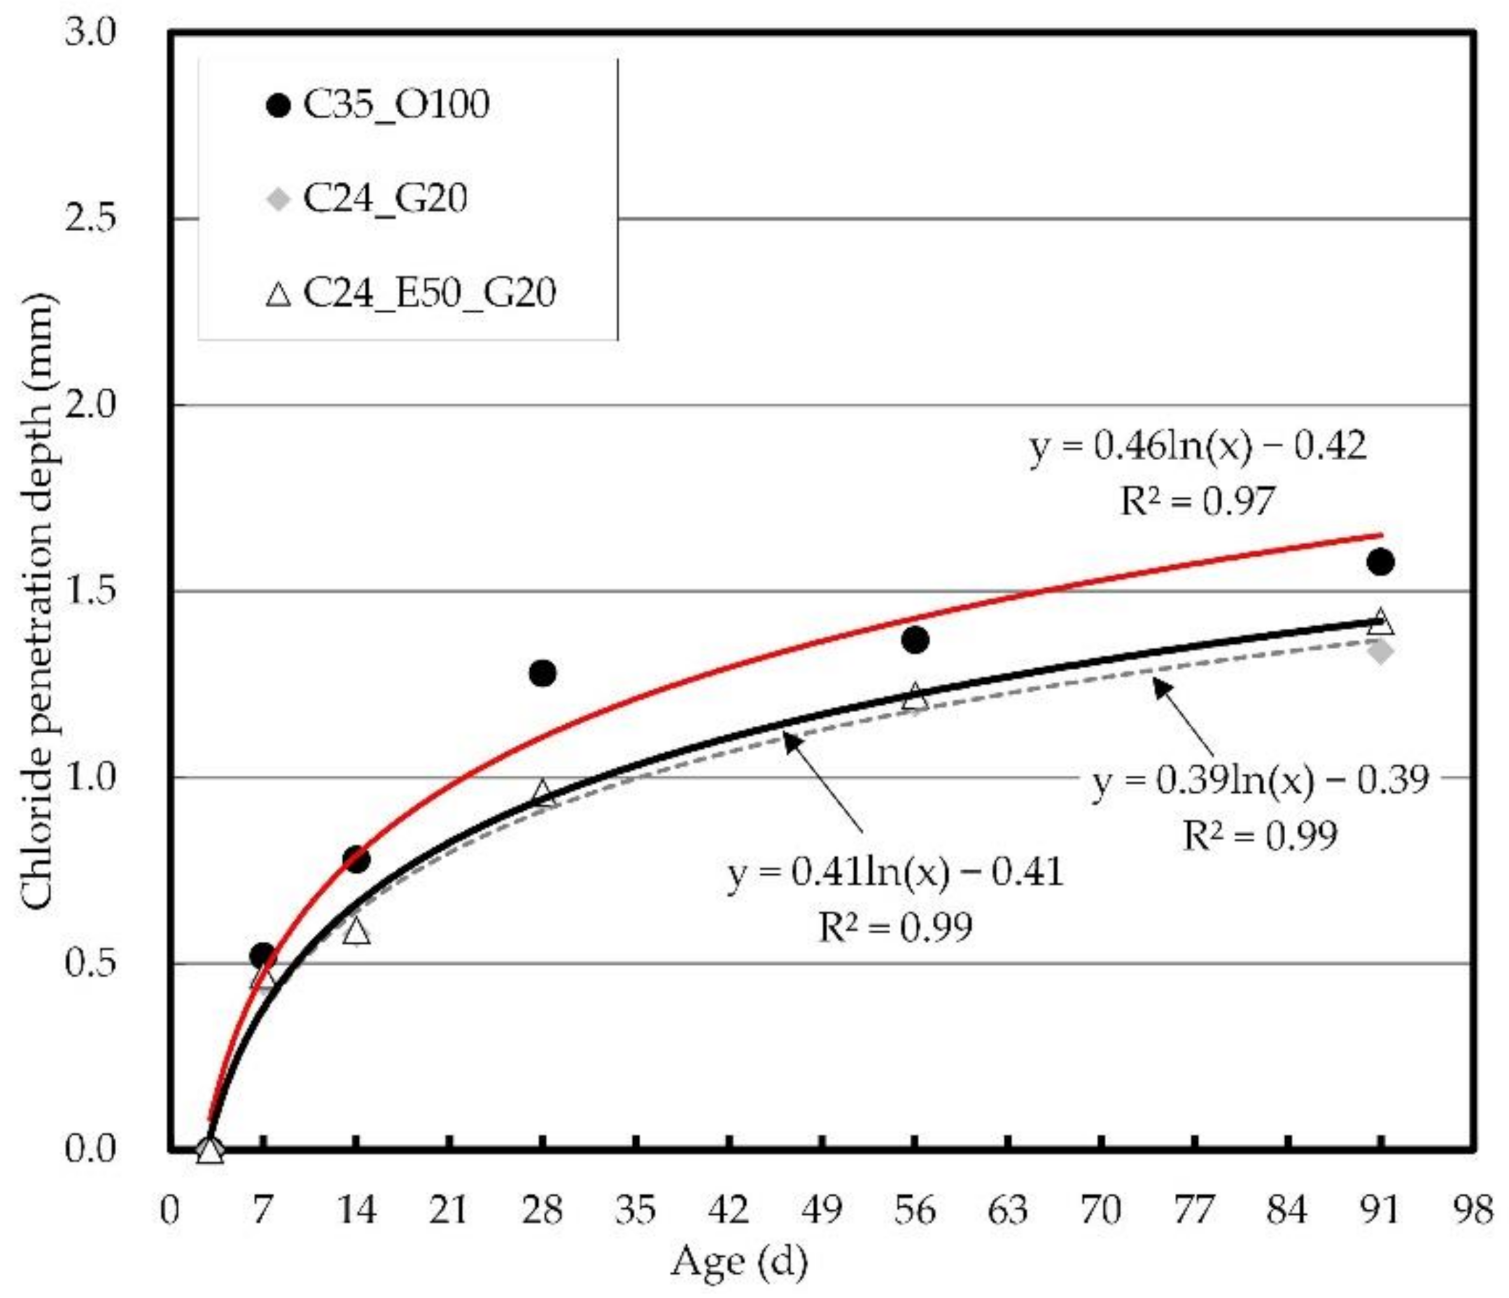
Figure 8 shows the chloride penetration depth at different ages. The chloride penetration depth could not be measured because penetration did not occur until the early age of 3 days. It was then confirmed that after 7 days, chloride penetration of concrete began, and the penetration depth increased with age in all the mix proportions. Meanwhile, C35_O100 was found to have the largest chloride penetration depth, and the difference varied significantly depending on the age. C24_G20 and C24_E50_G20 exhibited similar chloride penetration depths.

Figure 8.
Chloride penetration depth by age.
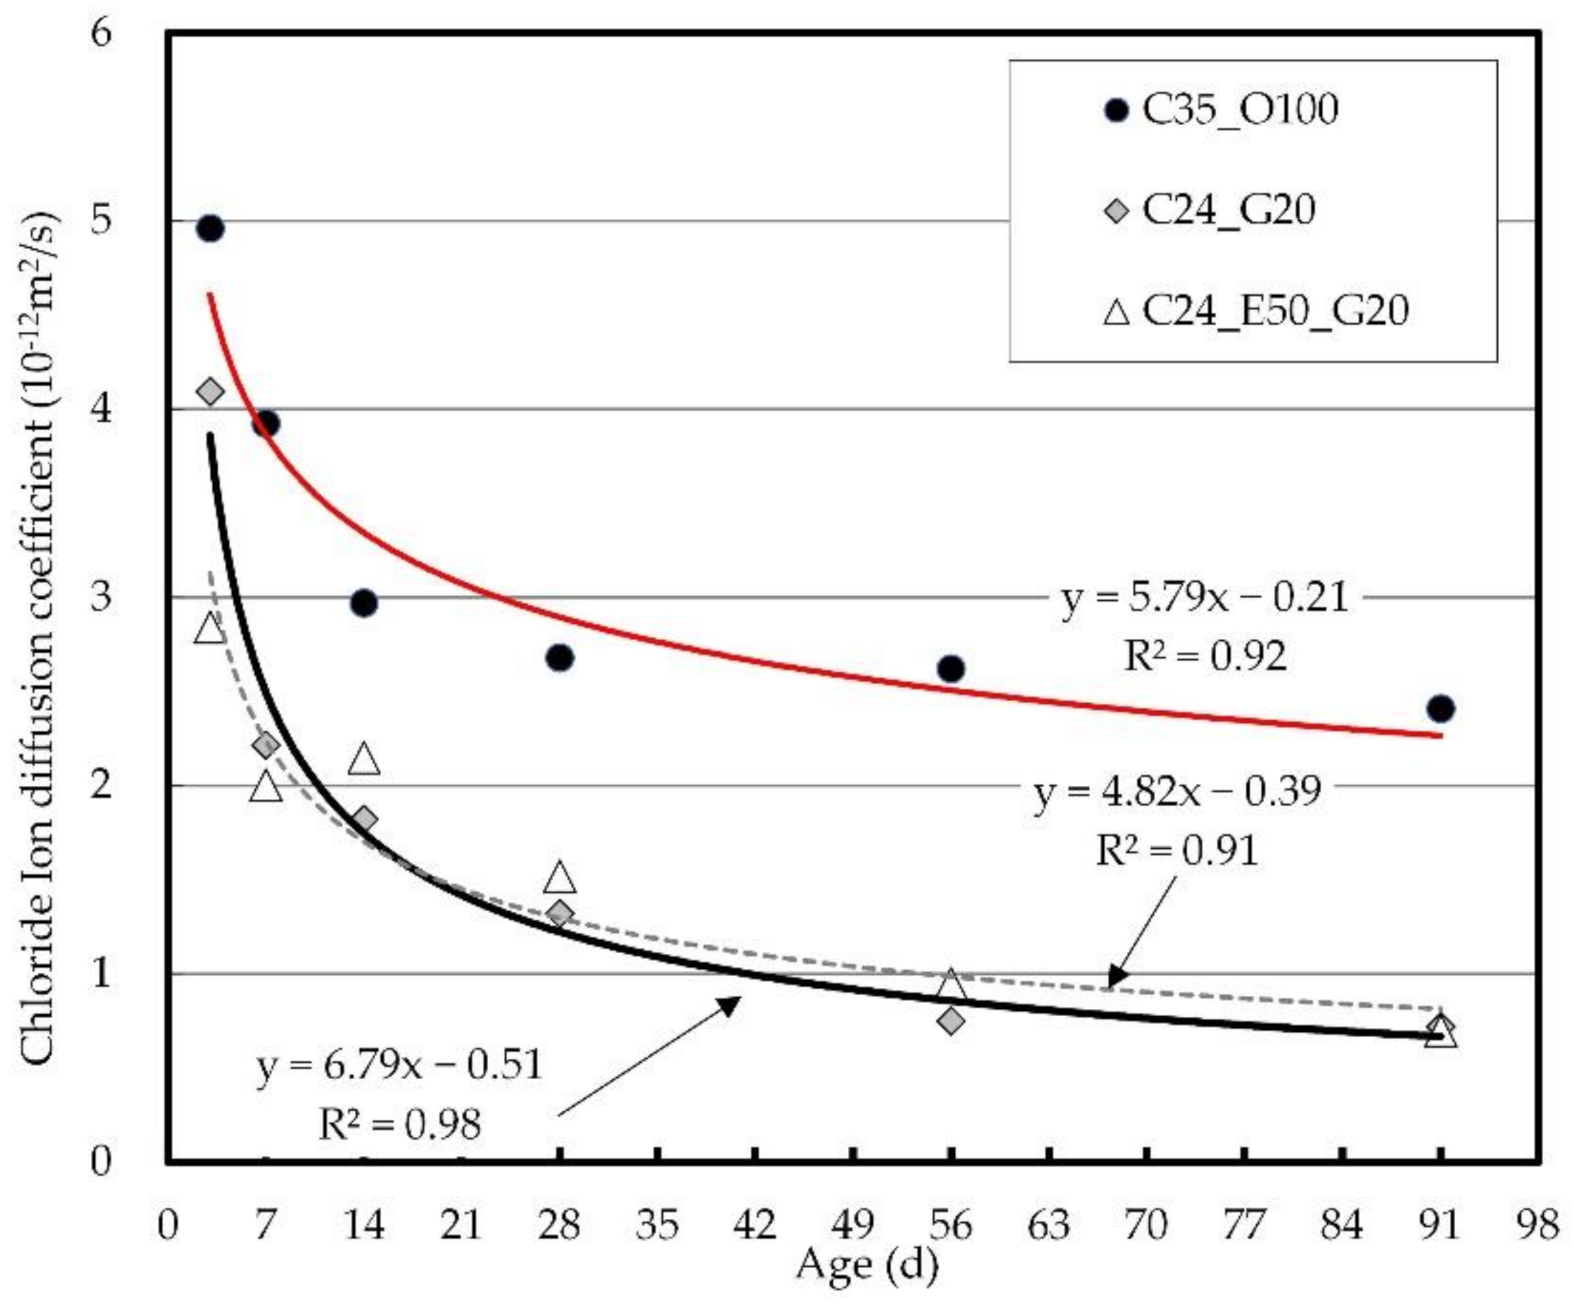
Figure 9 shows the chloride ion diffusion coefficient at different ages. The evaluation of the chloride ion diffusion coefficient is a criterion for reviewing long-term chloride resistance through an acceleration test. The test revealed that in all the mix proportions, the chloride diffusion coefficient continuously decreased after the early-strength development, and the chloride diffusion coefficients converged after 91 days. The C35_O100 exhibited a gradual decrease from 5 × 10⁻¹² m2/s at the early ages to 2.4 × 10⁻¹² m2/s at 91 days, showing a 1/2 decrease, while C24_G20 and C24_E50_G20 exhibited patterns similar to those of the chloride penetration depth results and showed a gradual decrease from 4.0 × 10⁻¹² to 0.7 × 10⁻¹² m2/s at 91 days, indicating a 1/7 decrease. It was confirmed that the value was only about 30% of the chloride diffusion coefficient compared to C35_O100.

Figure 9.
Chloride ion diffusion coefficient by age.
3.2.2. Porosity of Concrete
Figure 10 shows the results of the internal porosity of concrete by age. The internal porosity of concrete tended to decrease with increasing age, and this tendency was most dominant in C35_O100. The porosity of C35_O100 was about 20 vol.% at the early ages but decreased to 5.6 vol.% at 91 days. The C24_G20 exhibited 15 vol.% porosity at the early ages, but the internal porosity decreased significantly with time, showing about a 2.5 vol.% value. C24_E50_G20 showed 7.8% porosity at the early ages and then a gradual decrease to a final value of 2.5 vol.%.
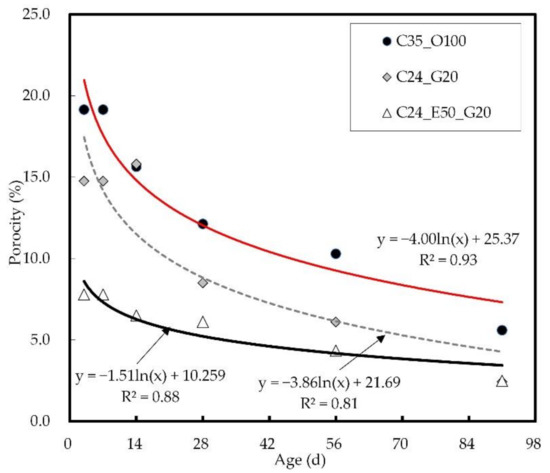
Figure 10.
Result of internal porosity of concrete by age.
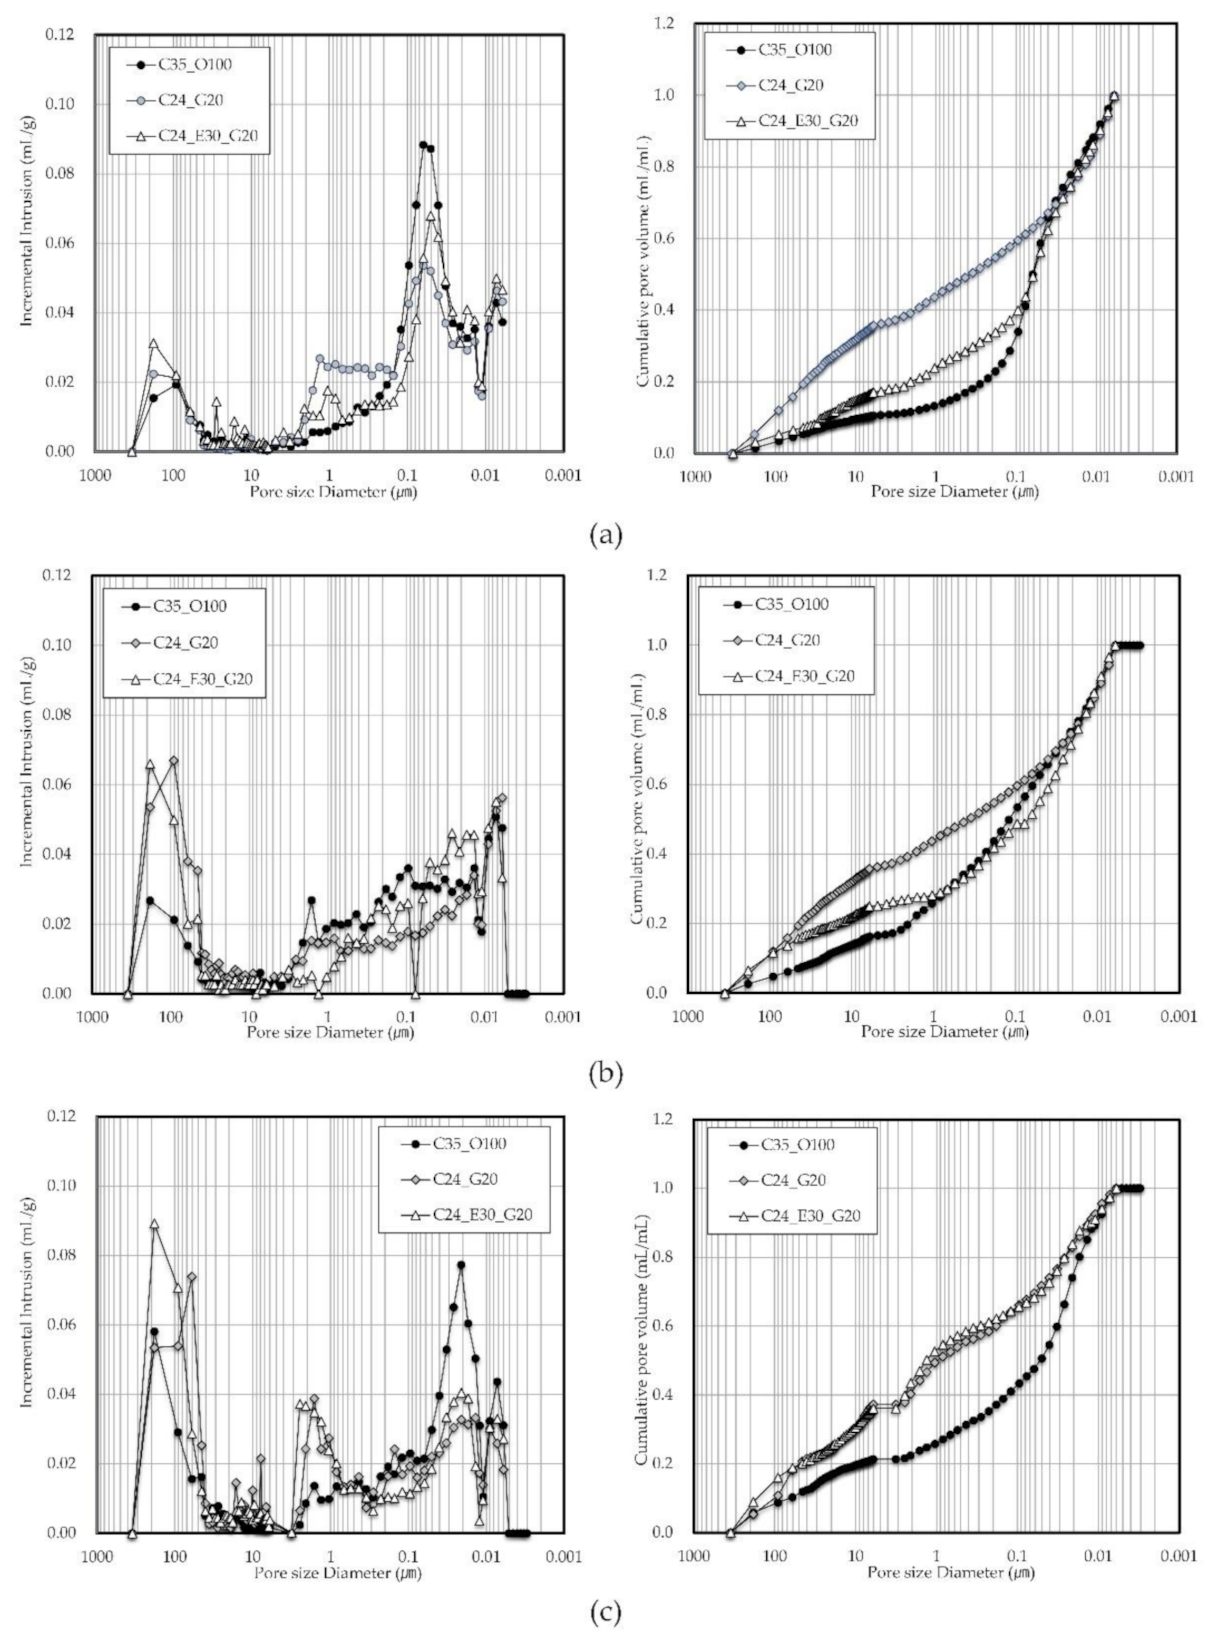
Figure 11 shows the pore structure results from mercury intrusion porosimetry. With regard to the internal porosity of each mix proportion, the pore size distributions can be divided into 100–1000 and 1–0.01 µm ranges, and the pore size ranging from 0.01 to 1 µm increased. In addition, the results of the accumulated amount of pores revealed that the 0.1–10 µm pore size range was most common in C24_G20, which showed a porosity distribution similar to that of C24_E50_G20 with increasing age. It was also confirmed that the incorporation of GGBS significantly influences the formation of pores with a 0.1–10 µm size.
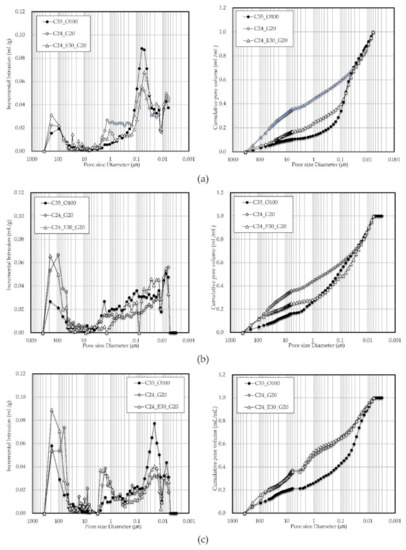
Figure 11.
Results of pore structure by mercury intrusion porosimetry: (a) 7 days; (b) 28 days; (c) 91 days.
4. Discussion
4.1. Effect of EPC and GGBS on the Compressive Strength and Chloride Resistance of Concrete
Figure 12 shows the relation between the compressive strength and chloride penetration depth of concrete. The chloride penetration depth continued to increase even after the C35 strength development stage presented in the Euro code was reached. The slope of the curve was smaller in C35_O100 than in C24_G20 and C24_E50_G20 using GGBS. It was confirmed that at the early ages, C24_E50_G20 is advantageous for chloride penetration resistance as it exhibited further progress in strength development in this study compared to C24_G20. Meanwhile, C24_E50_G20 and C24_G20 had similar strengths at the long-term age of 91 days, but GGBS was assumed to be advantageous at the later ages.
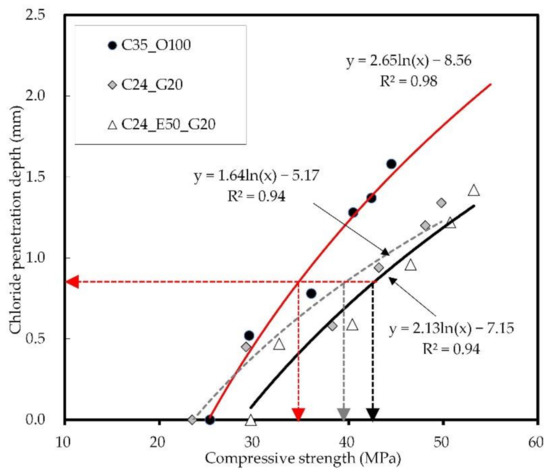
Figure 12.
Relation between concrete strength and chloride penetration depth.
Figure 13 shows the relation between the concrete strength and chloride ion diffusion coefficient of concrete. As mentioned earlier, it is difficult to measure the chloride penetration depth of concrete in the long term and to accurately analyze its effects due to the influence of chloride accumulation on it. In the case of the chloride ion diffusion coefficient, however, its performance can be examined through a chloride acceleration test for estimation from a long-term perspective.
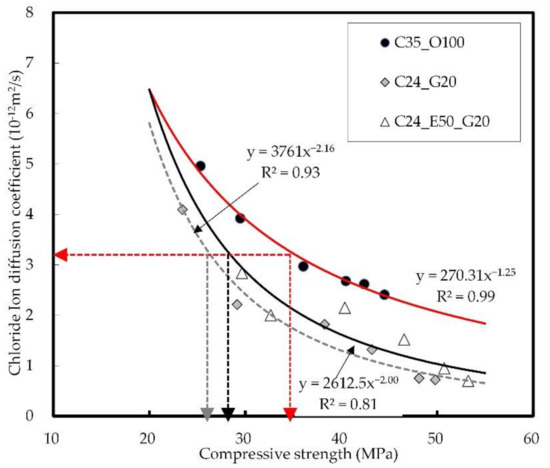
Figure 13.
Relation between concrete strength and chloride ion diffusion coefficient.
When the compressive strength of C35_O100 is 35 MPa, the chloride ion diffusion coefficient is 3.2 × 10⁻¹² m2/s. To achieve the same performance, C26 is required for C24_G20 and C28 for C24_E50_G20. It was confirmed that the sole use of GGBS ensures the greatest effectiveness in chloride resistance performance by the chloride ion diffusion coefficient. Continuous exposure to chloride at the early ages, however, leads to an increase in the concentration of surface chloride ions, which may increase the chloride diffusion coefficient. Therefore, the use of EPC needs to be considered to ensure chloride ion penetration resistance through the surface watertightness at the early ages. In this connection, it is expected that the additional incorporation of GGBS will make it possible to improve the internal watertightness of the blast-furnace slag and the chloride ion binding capacity, thus ensuring satisfactory performance [66,67].
4.2. Relation between the Porosity and Compressive Strength of Concrete and Chloride Resistance
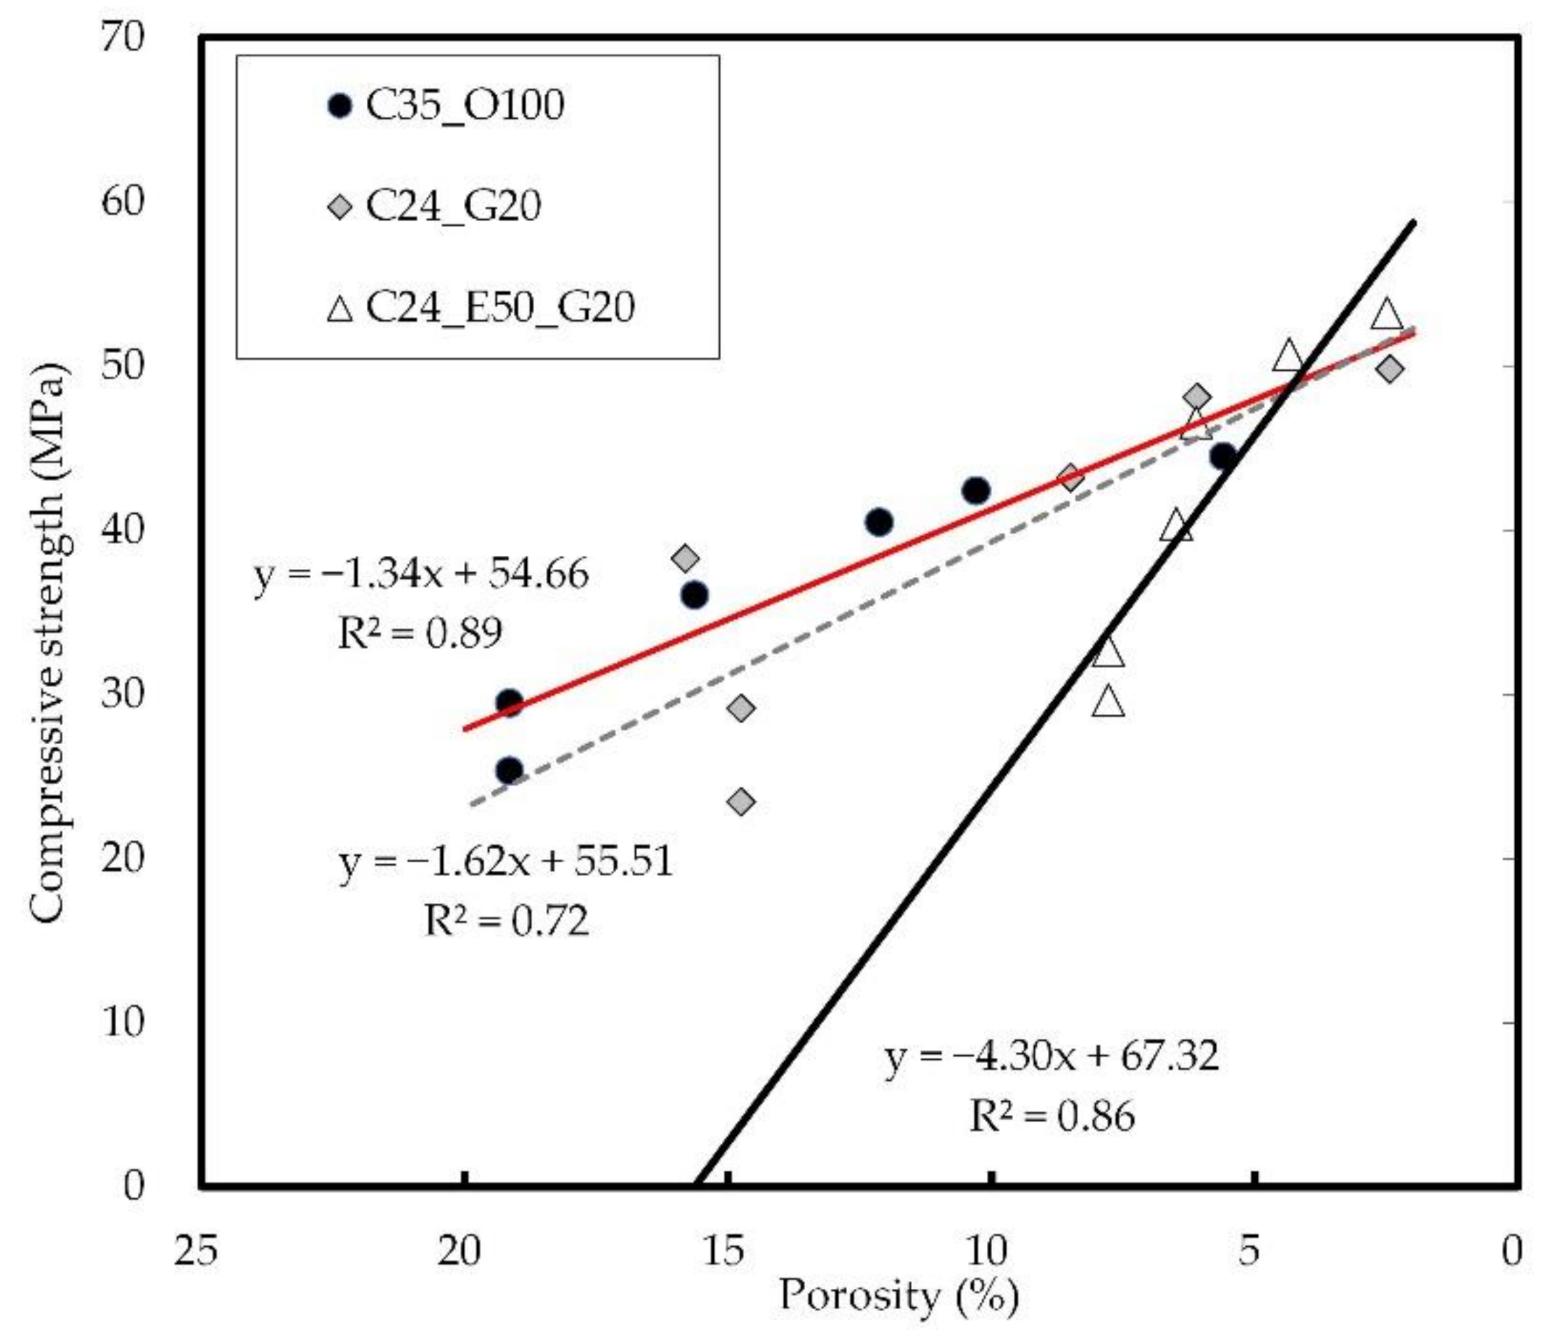
Figure 14 shows the relation between the internal porosity and concrete strength of concrete. It was confirmed that the two generally have a linear relationship. In C35_O100 and C24_G20, the strength developed as the porosity decreased, indicating a similar pattern. For C24_E50_G20 incorporating EPC, the porosity was low due to rapid reactivity at the early ages, which is advantageous for early-strength development (see Figure 6).
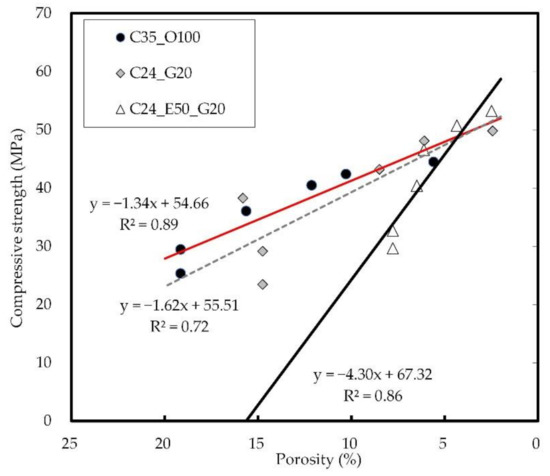
Figure 14.
Relation between internal porosity and compressive strength on concrete.
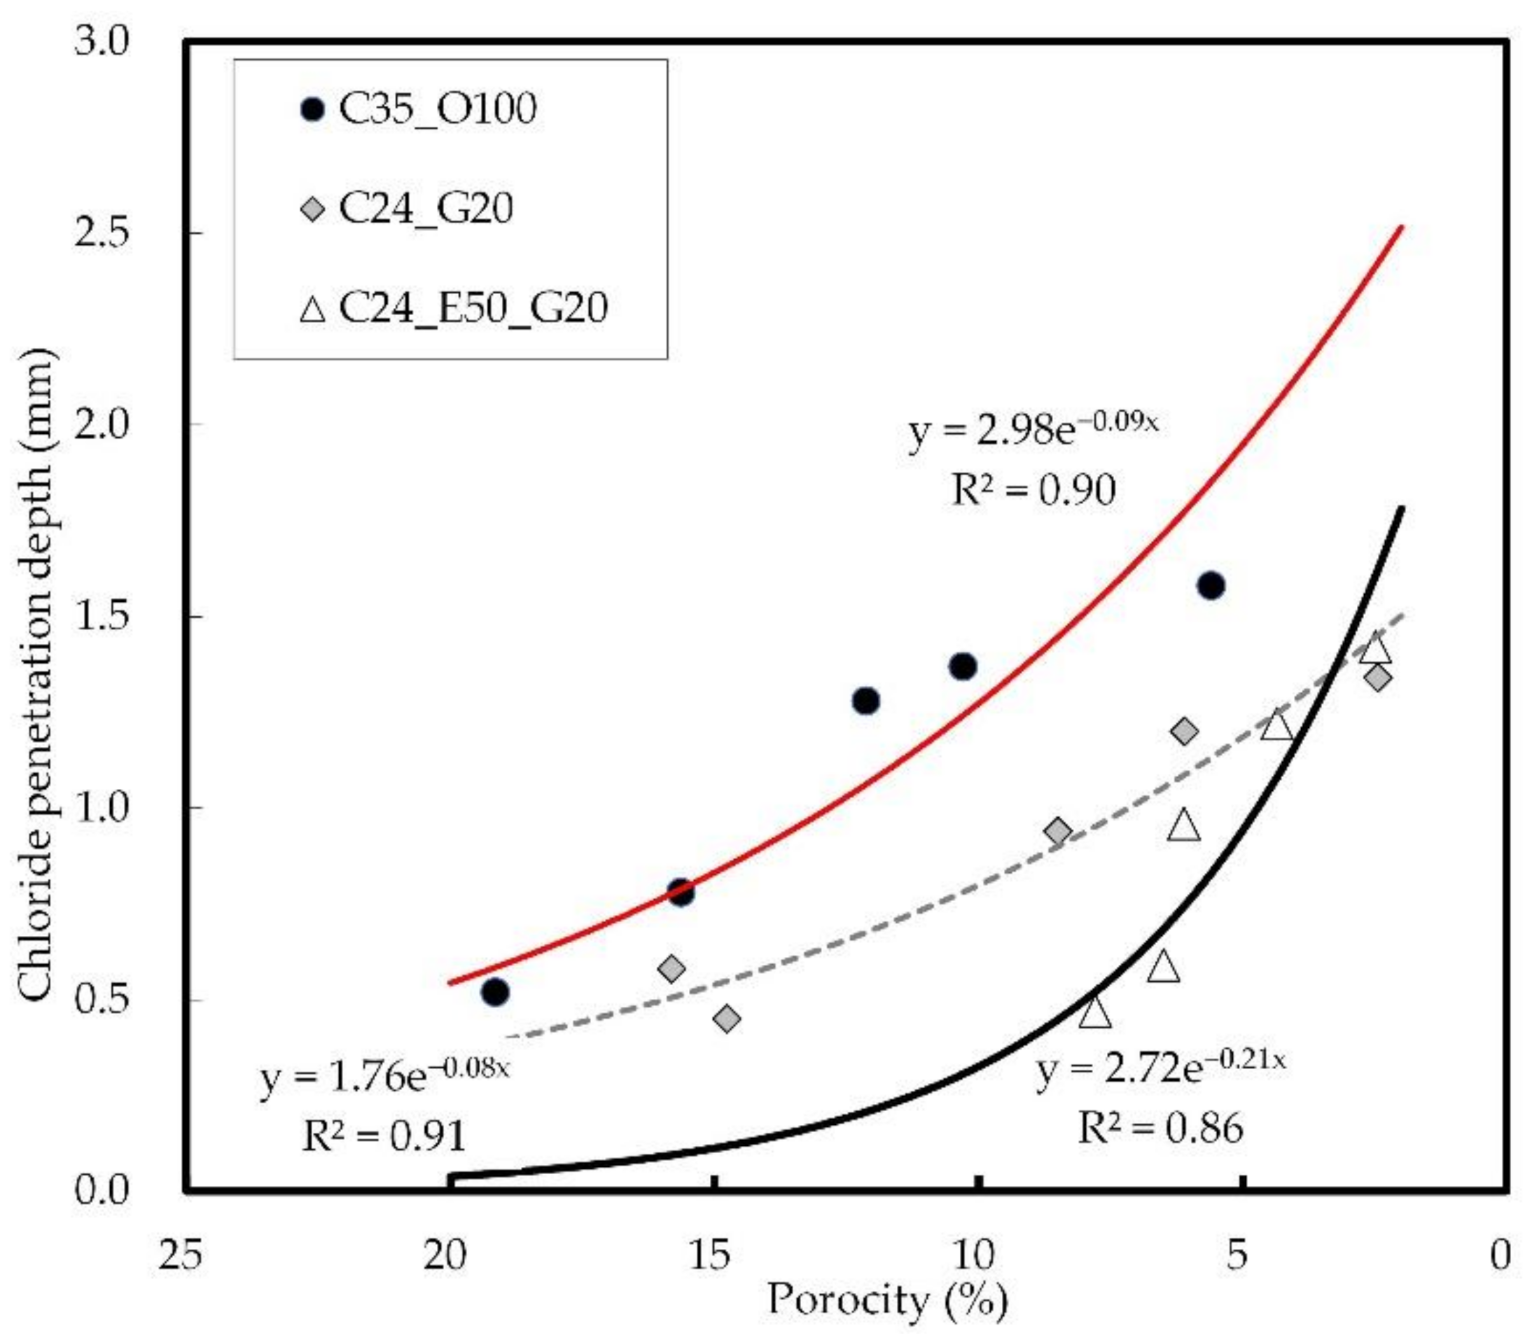
Figure 15 shows the relation between the internal porosity and the chloride penetration depth of concrete. The chloride penetration depth increased even when the porosity decreased, and C35_O100 exhibited a higher value than C24_E50_G20 and C24_G20 under the same porosity conditions. In addition, the difference between C24_G20 and C35_O100 tended to be larger as the porosity decreased, which suggests that the effect of reducing the chloride ion penetration rate of concrete becomes greater in this case. It was confirmed that C24_E50_G20 showed an increase in chloride penetration depth as the porosity decreased, but it eventually exhibited a value similar to that of C24_G20.
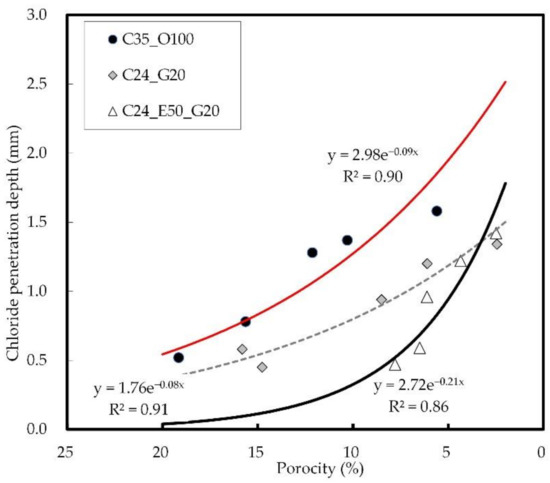
Figure 15.
Relation between internal porosity and chloride penetration depth on concrete.
Figure 16 shows the relation between the internal porosity and the chloride ion diffusion coefficient of concrete. The chloride ion diffusion coefficient decreased as the porosity of concrete decreased, and this tendency was identified as most pronounced in C24_E50_G20, followed by C24_G20 and then C35_O100. It was reported in a study conducted by Sakai (2019) that there is a high correlation between the internal porosity and the chloride ion diffusion coefficient of concrete [68,69]. In this study, it was confirmed that the chloride penetration is reduced by the formation of micropores due to the effects of GGBS at long-term ages when the internal porosity decreases as the initial reactivity increases with the use of the PC-based superplasticizer.
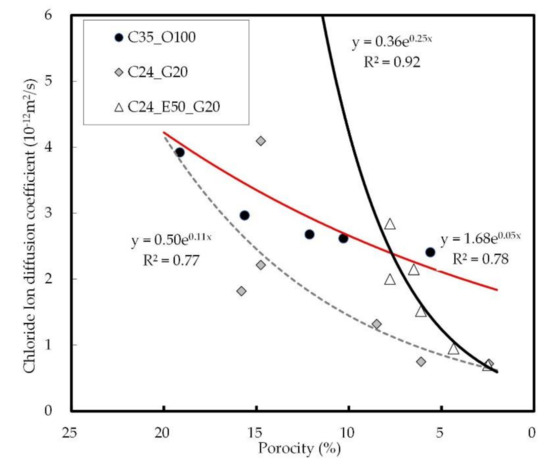
Figure 16.
Relation between internal porosity and chloride ion diffusion coefficient on concrete.
4.3. Analysis of the Removal of Forms
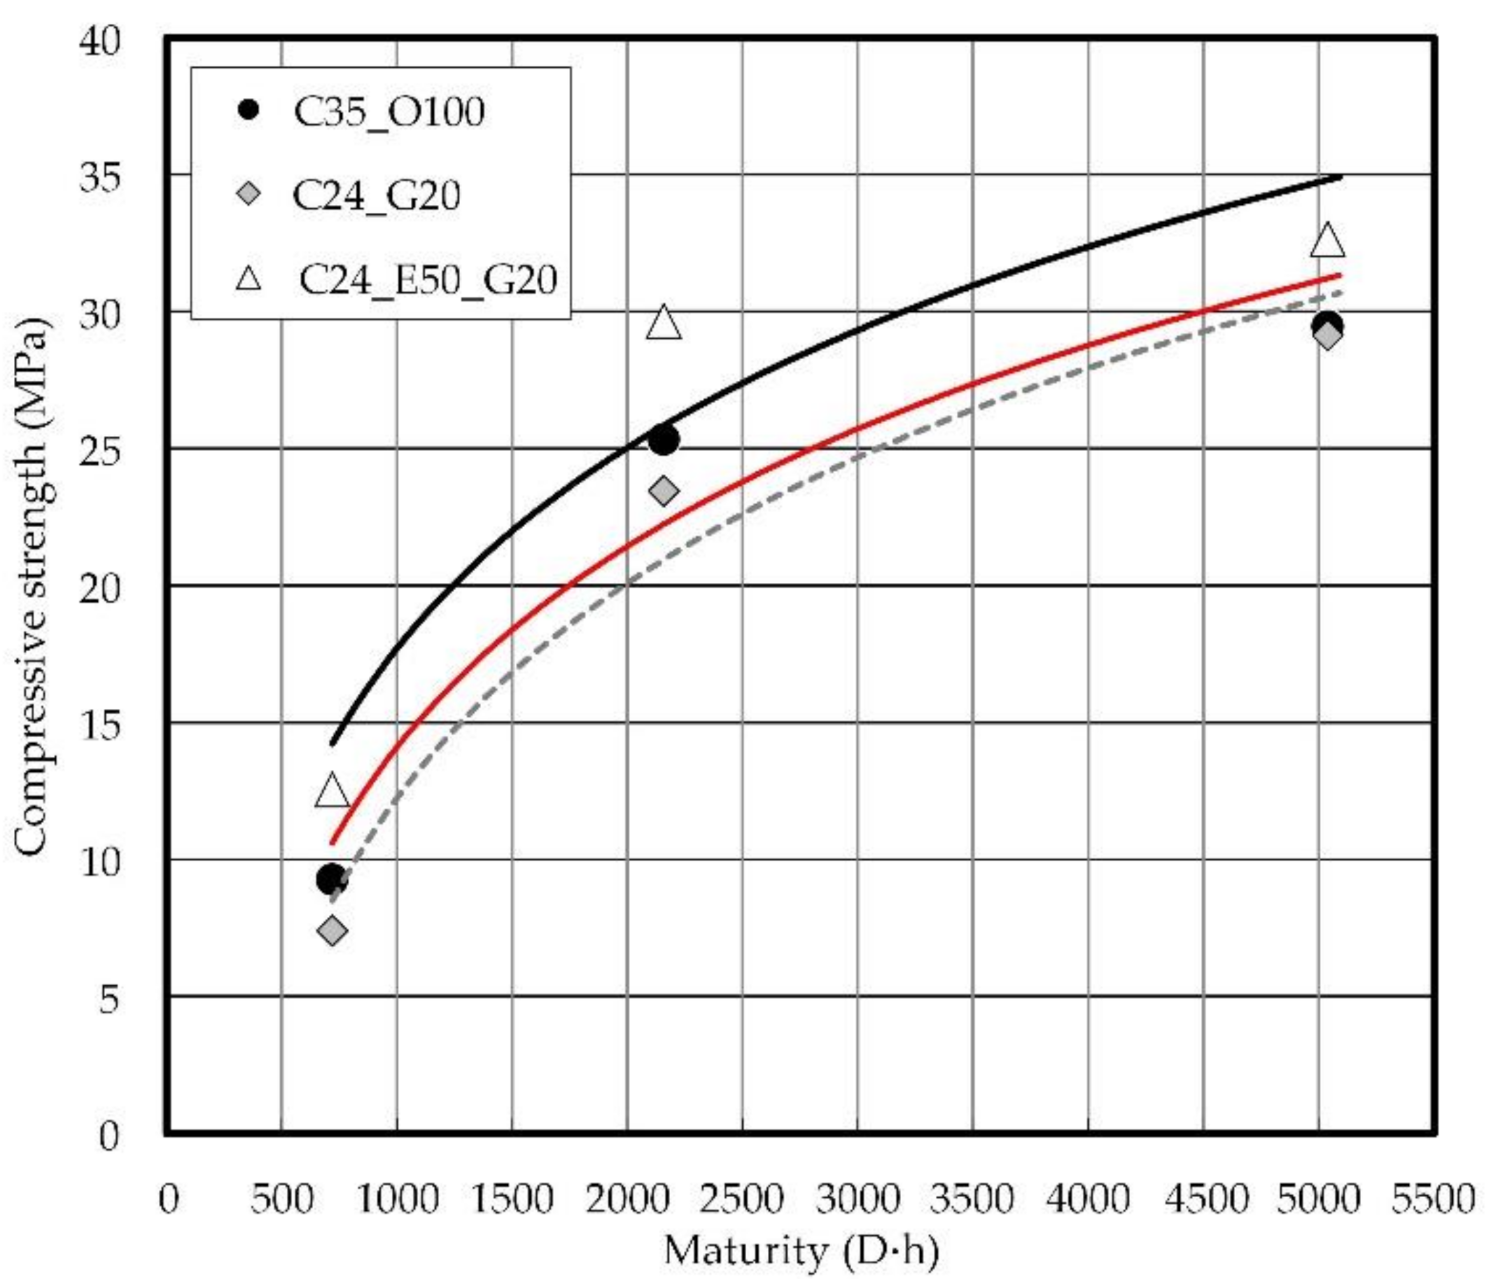
This study revealed that the use of EPC and chemical superplasticizer in concrete mix proportions makes it possible to reduce the quantity of cement and the unit water content of the existing C35 concrete mix as well as to secure the early strength of concrete. Figure 17 shows the relation between the maturity and the compressive strength of concrete. The evaluation of the resistance to chloride attack confirmed that C24_G20 has slightly superior performance compared to C24_E50_G20 but is disadvantageous in terms of the early strength of concrete. If the correlation between the average curing temperature and the compressive strength of concrete is derived from the relationship between the maturity and the compressive strength, it is possible to predict the strength of the removal of forms [70]. The early-strength development of concrete has many advantages in increasing the productivity of construction sites.
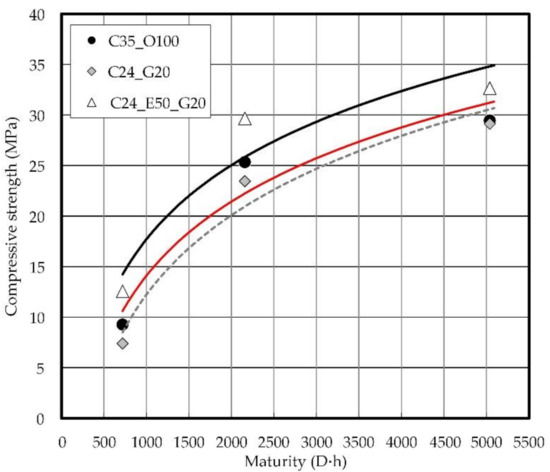
Figure 17.
Relation between maturity and compressive strength on concrete.
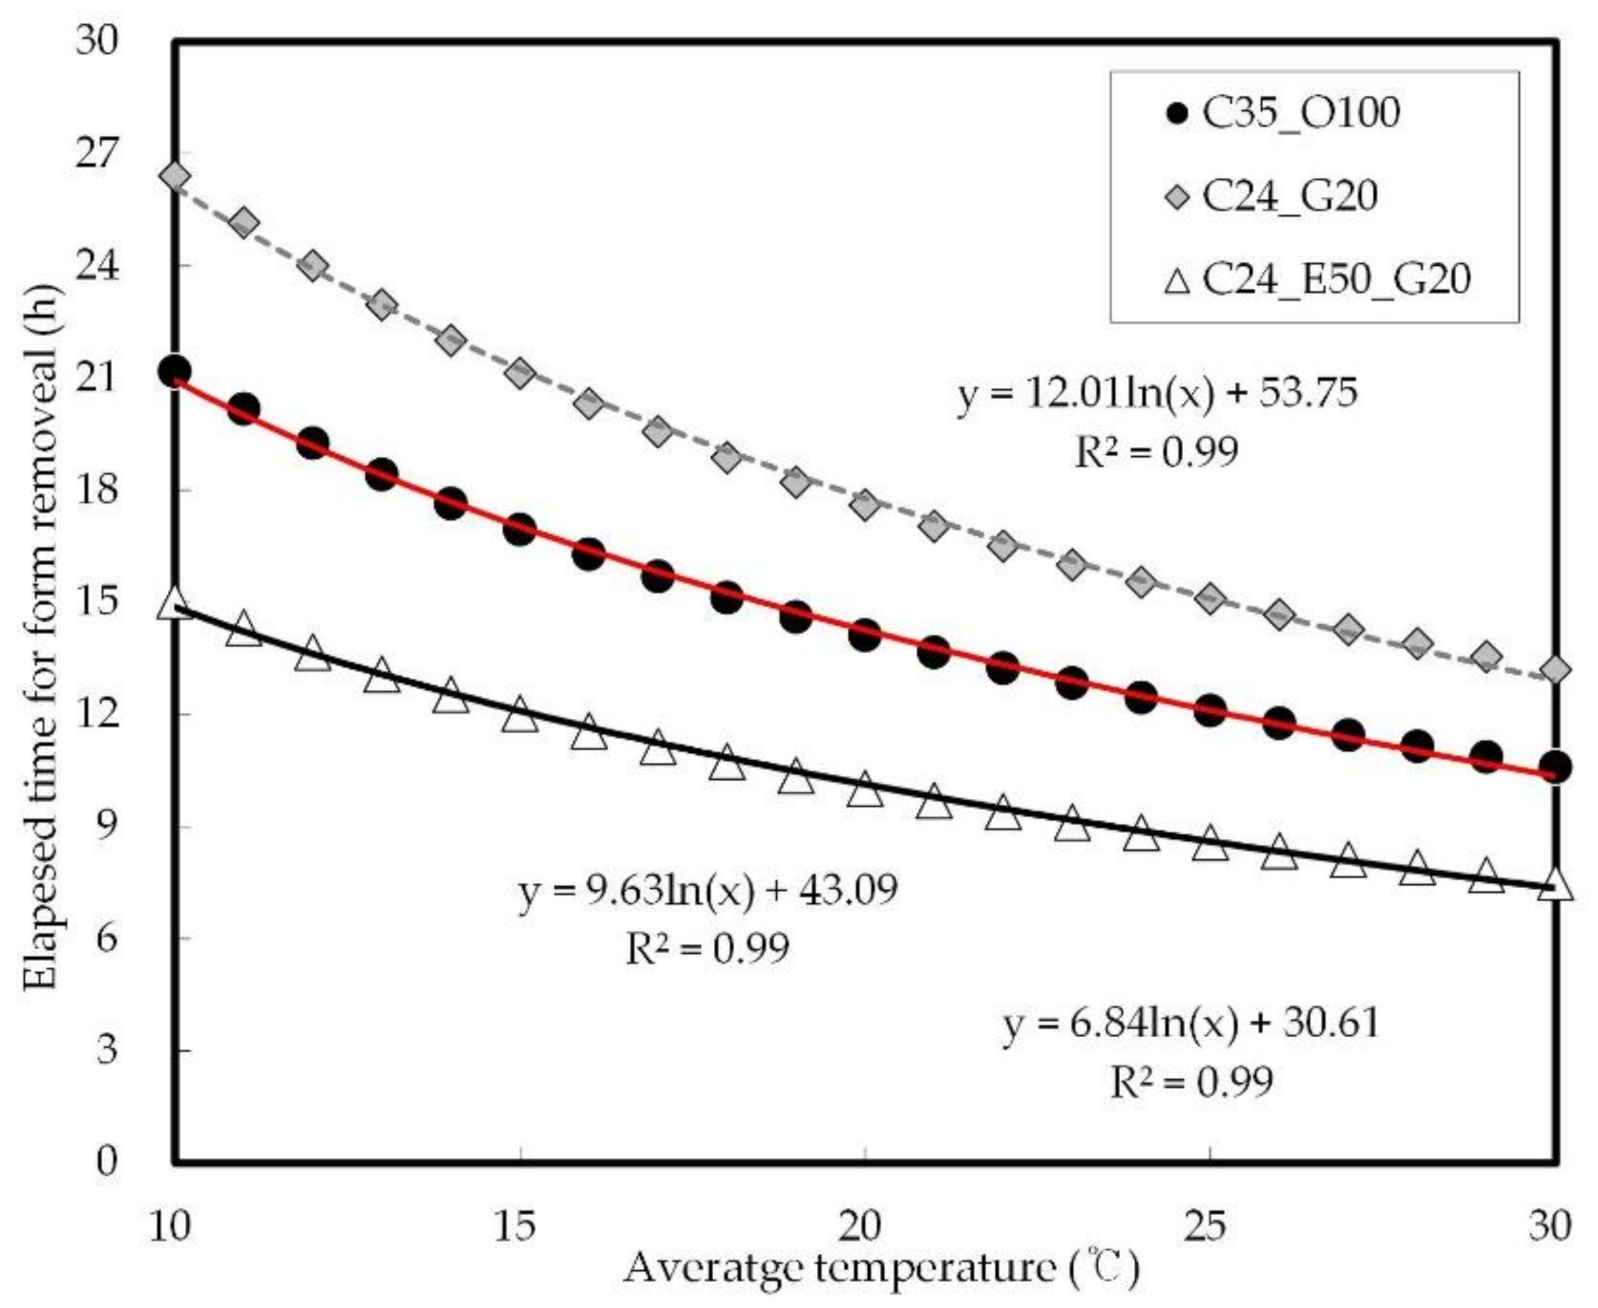
The standard time for the removal of vertical forms varies by country. In the U.S. and Europe, the removal time period is defined as the elapsed time according to the curing temperature (15 °C or higher, 12 h), while in Asia (Japan and South Korea), the point in time of 5 MP of strength development is defined as the formwork removal time. Therefore, this study was conducted based on the Asian standards presenting detailed strength values.
Figure 18 shows the prediction of the elapsed time at 5 MPa concrete strength according to the curing temperature. It was confirmed that at an average curing temperature of 15 °C, the elapsed time is 21 h for C24_G20, 17 h for C35_O100, and 12 h for C24_E50_G20. With respect to chloride resistance, similar results were obtained for C24_G20 and C24_E50_G20. C24_E50_G20, however, was found to be superior in early strength. Therefore, the mix proportions of C24_E50_G20 need to be applied for construction productivity.
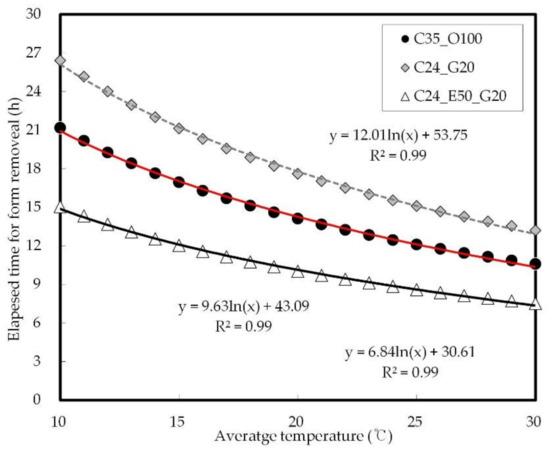
Figure 18.
Prediction of elapsed time at a strength of 5 MPa on concrete according to curing temperature.
4.4. Analysis of Construction Productivity on Concrete
Based on the elapsed time of concrete (C35_O100, C24_G20, C24_E50_G20), a construction productivity analysis was conducted to validate how early strength can affect construction productivity. Figure 19 shows the construction productivity result at cycle times for the typical floor in a multiplex house. Each simulation was conducted 1000 times to analyze the construction productivity on concretes.
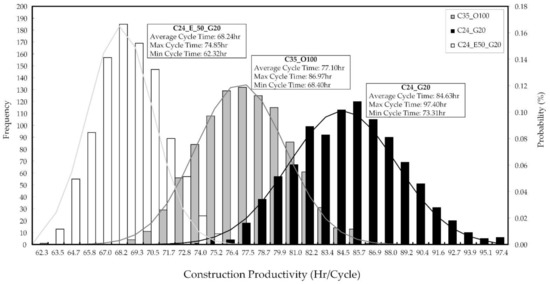
Figure 19.
Result of the construction productivity analysis based on elapsed time.
When comparing the construction productivity of concretes, the results are as follows: C35_O100 was 77.10 h/cycle; C24_G20 was 84.63 h/cycle; and C24_E50_G20 was 68.24 h/cycle. C24_E50_G20 was superior to other concretes in terms of construction productivity. As mentioned above, the elapsed time for C24_E50_G20 was up to nine hours different from other concretes. The construction productivity, however, was up to 16.39 h different from other concretes. Because the waiting time was caused by elapsed time, the other construction works could be affected and delayed. Therefore, when C24_E50_G20 is applied to an actual construction project, it results in time-saving (see Figure 19) [71].
4.5. Analysis of Economic and Environmental Impacts of Concrete
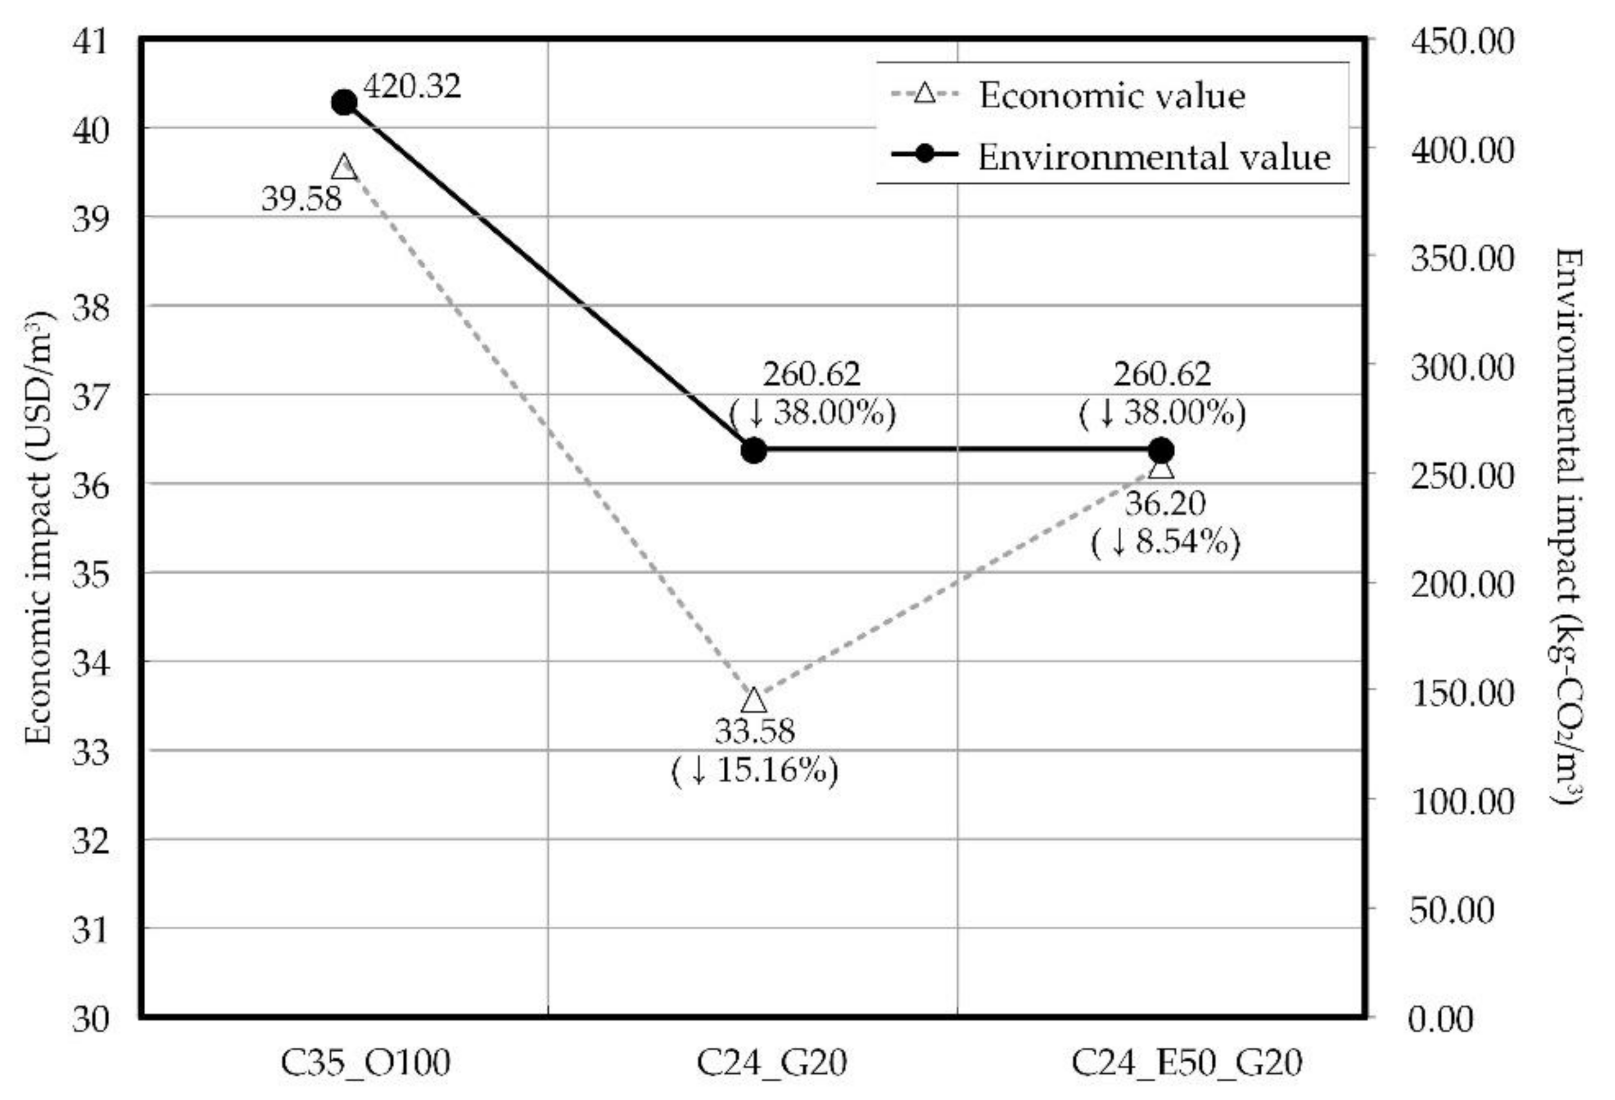
This study analyzed the economic and environmental impacts of C35_100, C24_G20, and C24_E50_G20 from the life cycle perspective. Figure 20 shows the economic and environmental impact results.

Figure 20.
Results of environmental and economic impacts on concrete.
In terms of the economic impact, the economic analysis on concrete is as follows: C35_O100, 39.58 USD/m3; C24_G20, 33.58 USD/m3; and C24_E50_G20, 36.20 USD/m3. C35_O100 is more expensive than C24_G20 and C24_E50_G20 for two reasons. First, the cement cost is higher than other materials’ costs, such as GGBS, sand, and gravel (see Table 7). Second, as mentioned in the previous section, C35_O100 contains more cement than C24_G20 or C24_E50_G20. As C35_O100 is more expensive than C24_G20 and C24_E50_G20, when it is replaced with C24_G20 and C24_E50_G20, the economic impact can be reduced by up to 15.16% and 8.54%, respectively.
In terms of the environmental impact, the LCCO2 is as follows: C25_O100, 420.32 kg-CO2/m3; C24_G20, 260.62 kg-CO2/m3; and C24_E50_G20, 260.62 kg-CO2/m3. The LCCO2 of C35_O100 is higher than those of C24_G20 and C24_E50_G20. As cement emits more CO2 than other materials, such as water, GGBS, sand, and gravel (see Table 7), C25_O100 has more cement than other concretes. Thus, when C24_G20 or C24_E50_G20 is used instead of C35_O100 in the actual construction site, the environmental impact can be reduced by 38.00%.
5. Conclusions
In this study, the chloride resistance performance of concrete was evaluated, and life cycle assessment was conducted on concrete using a binder based on early Portland cement (EPC) and chemical superplasticizer admixture. The results of the analysis of the experiment results are summarized as follows.
- (1)
- The analysis of raw materials revealed that EPC can help improve the early-strength development of concrete. In addition, it was confirmed that the use of EPC and ground granulated blast-furnace slag (GGBS) as concrete binders in combination with a PC-based superplasticizer can improve the early and long-term strengths of concrete while significantly reducing the total binder.
- (2)
- The results of the chloride ion diffusion coefficient and chloride penetration depth showed that when EPC and GGBS are used, chloride resistance is improved by the watertightness of the surface and by the chloride ion binding phenomenon as the rapid strength development progresses at early ages. In particular, its chloride diffusion coefficient was decreased significantly by about 30% compared with C35_O100.
- (3)
- The evaluation of the internal porosity of concrete confirmed that the mix proportions using EPC and GGBS could reduce the total pore volume and increase the watertightness of concrete, thereby improving its chloride resistance. It was also confirmed that C24_E50_G20 and C24_G20 have different degrees of porosity at early ages but exhibit almost similar degrees of porosity at long-term ages.
- (4)
- The analysis of the effects of EPC and GGBS on the compressive strength and chloride resistance of concrete revealed that the application of a chemical superplasticizer to concrete makes it possible to reduce the cement quantity and the unit water content of the existing C35 concrete mix. Based on the study results, it is possible to secure high chloride resistance at a low strength compared to C35_100, and to reduce the time for the removal of forms by 5–9 h in terms of the early strength.
- (5)
- The construction productivity was analyzed based on the elapsed time on concretes. The results were as follows. C24_E50_G20 was 68.24 h/cycle, which was superior to other concretes in terms of construction productivity. If C24_E50_G20 was applied to the structure works in a construction project, the construction period would be decreased compared to other concretes. Moreover, it was found that when C35_O100 was replaced with C24_G20 or C24_E50_G20, the economic and environmental impacts could be reduced by up to 15.16% and 38.00%, respectively.
The limitations of this study are as follows. First of all, it lacks a review of the mix proportions according to various EPC and GGBS replacement levels. Therefore, it is necessary to use a variety of materials for the economic review. In addition, there is a need to confirm the reproducibility of the early strength at the ready-mix concrete plant. Secondly, in terms of economic impact, C24_G20 was cheaper than C24_E50_G20; however, in terms of productivity for a 7-day cycle, it can be expected that C24_E50_G20 will be cheaper than C24_G20, so future research should be done to perform a productivity analysis between C24_G20 and C24_E50_G20 for a 7-day cycle.
The results of this study are expected to be used as basic data with reference to process management for the early removal of forms and the economical mix proportions of concrete at construction sites.
Supplementary Materials
The following are available online at https://www.mdpi.com/article/10.3390/ma14174903/s1, Figure S1: The discrete event simulation diagram for analysis of the construction productivity, Table S1: The data of the crew members of structure works for the discrete event simulation, Table S2: The data of the working hours of structure works for the discrete event simulation.
Author Contributions
T.L.: conceptualization, validation, visualization, writing—original draft; J.L.: methodology, resources, formal analysis, writing—original draft.; J.J. (Jaewook Jeong): supervision, project administration, writing—review & editing.; J.J. (Jaemin Jeong): visualization, formal analysis, writing—review & editing. All authors have read and agreed to the published version of the manuscript.
Funding
This research was financially supported by the Ministry of Trade, Industry and Energy (MOTIE) and the Korea Institute for Advancement of Technology (KIAT) through the International Cooperative R&D program (Project No. P0017191).
Institutional Review Board Statement
Not applicable.
Informed Consent Statement
Not applicable.
Data Availability Statement
The data presented in this study are available in the manuscript and in the supplementary material and can be requested from the corresponding authors.
Conflicts of Interest
The authors declare no conflict of interest.
References
- American Concrete Institute. ACI 201. 2R-16: Guide to Durable Concrete; American Concrete Institute: Farmington Hills, MI, USA, 2016. [Google Scholar]
- American Concrete Institute. ACI 22.3R-11: Guide to Design and Construction Practices to Mitigate Corrosion of Reinforcement in Concrete Structures; American Concrete Institute: Farmington Hills, MI, USA, 2011; pp. 1–28. [Google Scholar]
- American Concrete Institute. ACI 222R-01: Protection of Metals in Concrete Against Corrosion; American Concrete Institute: Farmington Hills, MI, USA, 2002; pp. 1–41. [Google Scholar]
- Mehta, P.K.; Monteiro, P.J. Concrete Microstructure, Properties and Materials, 3rd ed.; McGraw-Hill: New York, NY, USA, 2006. [Google Scholar]
- De Medeiros-Junior, R.A.; De Lima, M.G.; De Brito, P.C.; De Medeiros, M.H.F. Chloride penetration into concrete in an offshore platform-analysis of exposure conditions. Ocean Eng. 2015, 103, 78–87. [Google Scholar] [CrossRef]
- Glass, G.K.; Buenfeld, N.R. The influence of chloride binding on the chloride induced corrosion risk in reinforced concrete. Corros. Sci. 2000, 42, 329–344. [Google Scholar] [CrossRef]
- Ismail, M.; Ohtsu, M. Corrosion rate of ordinary and high-performance concrete subjected to chloride attack by AC impedance spectroscopy. Constr. Build. Mater. 2006, 20, 458–469. [Google Scholar] [CrossRef]
- Mingyu, H.; Fumei, L.; Mingshu, T. The thaumasite form of sulfate attack in concrete of Yongan Dam. Cem. Concr. Res. 2006, 36, 2006–2008. [Google Scholar] [CrossRef]
- Thomas, M.; Bremner, T. Performance of lightweight aggregate concrete containing slag after 25 years in a harsh marine environment. Cem. Concr. Res. 2012, 42, 358–364. [Google Scholar] [CrossRef]
- Li, P.; Ma, Z.; Li, X.; Lu, X.; Hou, P.; Du, P. Effect of Gypsum on Hydration and Hardening Properties of Alite Modified Calcium Sulfoaluminate Cement. Materials 2019, 12, 3131. [Google Scholar] [CrossRef] [Green Version]
- Li, L.Y.; Page, C.L. Modelling of electrochemical chloride extraction from concrete: Influence of ionic activity coefficients. Comput. Mater. Sci. 1998, 9, 303–308. [Google Scholar] [CrossRef]
- American Concrete Institute. Aci 318-99: Building Code Requirements for Structural Concrete; American Concrete Institute: Farmington Hills, MI, USA, 1999. [Google Scholar]
- Architectural Institute of Japan (AIJ). Japanese Architectural Standard Specification for Reinforced Concrete Work: JASS 5; Architectural Institute of Japan: Tokyo, Japan, 2009. [Google Scholar]
- Architectural Institute of Korea (AIK). Korea Architectural Standard Specification Reinforced Concrete Work: KASS 5; Architectural Institute of Korea: Seoul, Korea, 2009. [Google Scholar]
- Jensen, O.M.; Hansen, P.F.; Coats, A.M.; Glasser, F.P. Chloride ingress in cement paste and mortar. Cem. Concr. Res. 1999, 29, 1497–1504. [Google Scholar] [CrossRef]
- Ma, B.; Gao, X.; Byars, E.A.; Zhou, Q. Thaumasite formation in a tunnel of Bapanxia Dam in Western China. Cem. Concr. Res. 2006, 36, 716–722. [Google Scholar] [CrossRef]
- Meira, G.R.; Andrade, C.; Padaratz, I.J.; Alonso, C.; Borba, J.C., Jr. Chloride penetration into concrete structures in the marine atmosphere zone—Relationship between deposition of chlorides on the wet candle and chlorides accumulated into concrete. Cem. Concr. Compos. 2007, 29, 667–676. [Google Scholar] [CrossRef]
- Song, H.W.; Lee, C.H.; Ann, K.Y. Factors influencing chloride transport in concrete structures exposed to marine environments. Cem. Concr. Compos. 2008, 30, 113–121. [Google Scholar] [CrossRef]
- British Standards Institution (BSI). Eurocode 2: Design of Concrete Structures: Part 1-1: General Rules and Rules for Buildings; British Standards Institution: London, UK, 2004. [Google Scholar]
- Euro, C. CEB-FIP Model Code 1990: Design Code; Tomas Telford Ltd. 102: London, UK, 1993. [Google Scholar]
- European Committee for Standardization. EN 13670: 2009 Execution of Concrete Structures; European Standard; European Committee for Standardization: London, UK, 2009. [Google Scholar]
- Lee, J.; Lee, T.; Jeong, J.; Jeong, J. Sustainability and performance assessment of binary blended low-carbon concrete using supplementary cementitious materials. J. Clean. Prod. 2021, 280, 124373. [Google Scholar] [CrossRef]
- Rashad, A.M.; Sadek, D.M. An investigation on Portland cement replaced by high-volume GGBS pastes modified with micro-sized metakaolin subjected to elevated temperatures. Int. J. Sustain. Built Environ. 2017, 6, 91–101. [Google Scholar] [CrossRef] [Green Version]
- Sojobi, A.O. Evaluation of the performance of eco-friendly lightweight interlocking concrete paving units incorporating sawdust wastes and laterite. Cogent Eng. 2016, 3, 1255168. [Google Scholar] [CrossRef]
- Çakır, Ö.; Aköz, F. Effect of curing conditions on the mortars with and without GGBFS. Constr. Build. Mater. 2008, 22, 308–314. [Google Scholar] [CrossRef]
- Mohan, A.; Mini, K.M. Strength and durability studies of SCC incorporating silica fume and ultra fine GGBS. Constr. Build. Mater. 2018, 171, 919–928. [Google Scholar] [CrossRef]
- Uysal, M.; Sumer, M. Performance of self-compacting concrete containing different mineral admixtures. Constr. Build. Mater. 2011, 25, 4112–4120. [Google Scholar] [CrossRef]
- Juradin, S.; Vlajić, D. Influence of Cement Type and Mineral Additions, Silica Fume and Metakaolin, on the Properties of Fresh and Hardened Self-compacting Concrete. Adv. Struct. Mater. 2015, 251–267. [Google Scholar] [CrossRef]
- Kavitha, S.; Kala, T.F. Evaluation of Strength Behavior of Self-Compacting Concrete using Alccofine and GGBS as Partial Replacement of Cement. Indian J. Sci. Technol. 2016, 9, 1–5. [Google Scholar] [CrossRef]
- Huang, C.H.; Wu, C.H.; Lin, S.K.; Yen, T. Effect of Slag Particle Size on Fracture Toughness of Concrete. Appl. Sci. 2019, 9, 805. [Google Scholar] [CrossRef] [Green Version]
- Ganesh, P.; Murthy, A.R. Tensile behaviour and durability aspects of sustainable ultra-high performance concrete incorporated with GGBS as cementitious material. Constr. Build. Mater. 2019, 197, 667–680. [Google Scholar] [CrossRef]
- Suda, V.R.; Rao, P.S. Experimental investigation on optimum usage of Micro silica and GGBS for the strength characteristics of concrete. Mater. Today Proc. 2020, 27, 805–811. [Google Scholar] [CrossRef]
- Homayoonmehr, R.; Ramezanianpour, A.A.; Mirdarsoltany, M. Influence of metakaolin on fresh properties, mechanical properties and corrosion resistance of concrete and its sustainability issues: A review. J. Build. Eng. 2021, 44, 103011. [Google Scholar] [CrossRef]
- Hrabová, K.; Lehner, P.; Ghosh, P.; Konečný, P.; Teplý, B. Sustainability Levels in Comparison with Mechanical Properties and Durability of Pumice High-Performance Concrete. Appl. Sci. 2021, 11, 4964. [Google Scholar] [CrossRef]
- Irico, S.; Qvaeschning, D.; Mutke, S.; Deuse, T.; Gastaldi, D.; Canonico, F. Durability of high performance self-compacting concrete with granulometrically optimized slag cement. Constr. Build. Mater. 2021, 298, 123836. [Google Scholar] [CrossRef]
- American Society of Testing and Materials. ASTM C204. Standard test methods for fineness of hydraulic cement by air-permeability apparatus. In ASTM C204, Annual Book of ASTM Standards; American Society of Testing and Materials: West Conshohocken, PA, USA, 2007. [Google Scholar]
- American Society of Testing and Materials. Standard guide for examination of hardened concrete using scanning electron microscopy. In ASTM C1723-16, Annual Book of ASTM Standards; American Society of Testing and Materials: West Conshohocken, PA, USA, 2010. [Google Scholar]
- American Society of Testing and Materials. Standard Test Methods for Chemical Analysis of Hydraulic Cement. In ASTM C114-18, Annual Book of ASTM Standards; American Society of Testing and Materials: West Conshohocken, PA, USA, 2018. [Google Scholar]
- American Society of Testing and Materials. Standard Test Method for Determination of the Proportion of Phases in Portland Cement and Portland-Cement Clinker Using X-Ray Powder Diffraction Analysis. In ASTM C1365-18, Annual Book of ASTM Standards; American Society of Testing and Materials: West Conshohocken, PA, USA, 2018. [Google Scholar]
- American Society of Testing and Materials. Standard Test Method for Slump of Hydraulic-Cement Concrete, ASTM C143/C143M. In Annual Book of ASTM Standards; American Society of Testing and Materials: West Conshohocken, PA, USA, 2015. [Google Scholar]
- American Society of Testing and Materials. Standard Test Method for Air Content of Freshly Mixed Concrete by the Pressure Method, ASTM C231/C231M. In Annual Book of ASTM Standards; American Society of Testing and Materials: West Conshohocken, PA, USA, 2017. [Google Scholar]
- American Society of Testing and Materials. Standard Test Method for Compressive Strength of Concrete Cylinders Cast in Place in Cylindrical Molds, ASTM C873/C873M. In Annual Book of ASTM Standards; American Society of Testing and Materials: West Conshohocken, PA, USA, 2015. [Google Scholar]
- American Society of Testing and Materials. Standard Test Method for Compressive Strength of Cylindrical Concrete Specimens, ASTM C39/C39M. In Annual Book of ASTM Standards; American Society of Testing and Materials: West Conshohocken, PA, USA, 2018. [Google Scholar]
- NT BUILD 492. Concrete, Mortar and Cement-Based Repair Materials: Chloride Migration Coefficient from Non-Steady-State Migration Experiments; Nordtest Method: Espoo, Finland, 1999. [Google Scholar]
- Nordtest, N.T. Concrete, Hardened: Accelerated Chloride Penetration; Nordtest NT Build: Espoo, Finland, 1995; p. 443. [Google Scholar]
- American Society of Testing and Materials. Standard Test Method for Determination of Pore Volume and Pore Volume Distribution of Soil and Rock by Mercury Intrusion Porosimetry, ASTM D4404. In Annual Book of ASTM Standards; American Society of Testing and Materials: West Conshohocken, PA, USA, 2018. [Google Scholar]
- Jeong, J.; Hong, T.; Ji, C.; Kim, J.; Lee, M.; Jeong, K.; Lee, S. An integrated evaluation of productivity, cost and CO2 emission between prefabricated and conventional columns. J. Clean. Prod. 2017, 142, 2393–2406. [Google Scholar] [CrossRef]
- Arashpour, M.; Arashpour, M. Analysis of Workflow Variability and Its Impacts on Productivity and Performance in Construction of Multistory Buildings. J. Manage. Eng. 2015, 31, 04015006. [Google Scholar] [CrossRef]
- An, S.; Ji, S.; Hyun, C.; Han, S. A model-based productivity improvement of reinforced concrete work in a multi-housing project. KSCE J. Civ. Eng. 2015, 19, 1183–1192. [Google Scholar] [CrossRef]
- Korean Statistical Information Service (KOSIS). Available online: https://kosis.kr (accessed on 1 May 2021).
- Martinez, J.C. STROBOSCOPE: State and Resource Based Simulation of Construction Processes. Ph.D. Thesis, University of Michigan, Ann Arbor, MI, USA, 1996. [Google Scholar]
- Jeong, J.; Hong, T.; Kim, J.; Chae, M.; Ji, C. Multi-criteria analysis of a self-consumption strategy for building sectors focused on ground source heat pump systems. J. Clean. Prod. 2018, 186, 68–80. [Google Scholar] [CrossRef]
- Weng, Y.; Li, M.; Ruan, S.; Wong, T.N.; Tan, M.J.; Yeong, K.L.O.; Qian, S. Comparative economic, environmental and productivity assessment of a concrete bathroom unit fabricated through 3D printing and a precast approach. J. Clean. Prod. 2020, 261, 121245. [Google Scholar] [CrossRef]
- Poulikidou, S.; Jerpdal, L.; Björklund, A.; Åkermo, M. Environmental performance of self-reinforced composites in automotive applications—Case study on a heavy truck component. Mater. Des. 2016, 103, 321–329. [Google Scholar] [CrossRef]
- Poulikidou, S.; Schneider, C.; Björklund, A.; Kazemahvazi, S.; Wennhage, P.; Zenkert, D. A material selection approach to evaluate material substitution for minimizing the life cycle environmental impact of vehicles. Mater. Des. 2015, 83, 704–712. [Google Scholar] [CrossRef] [Green Version]
- Kim, J.; Hong, T.; Jeong, J.; Koo, C.; Jeong, K.; Lee, M. Multi-criteria decision support system of the photovoltaic and solar thermal energy systems using the multi-objective optimization algorithm. Sci. Total Environ. 2019, 659, 1100–1114. [Google Scholar] [CrossRef]
- Kim, T.H.; Tae, S.H.; Park, J.H.; Lee, K.J. A study on Reduction of Concrete CO2 Emissions by Substitution of Blast furnace slag. In Proceedings of the Korea Concrete Institute Conference, Gyeongju, South Korea, 3 May 2012; pp. 191–192. [Google Scholar]
- Demertzi, M.; Garrido, A.; Dias, A.C.; Arroja, L. Environmental performance of a cork floating floor. Mater. Des. 2015, 82, 317–325. [Google Scholar] [CrossRef]
- Hassan, O.A.; Öberg, F.; Gezelius, E. Cross-laminated timber flooring and concrete slab flooring: A comparative study of structural design, economic and environmental consequences. J. Build. Eng. 2019, 26, 100881. [Google Scholar] [CrossRef]
- Korea Environmental Industry and Technology Institute (KEITI). Available online: http://www.epd.or.kr (accessed on 15 December 2020).
- Lee, J.; Lee, T. Effects of High CaO Fly Ash and Sulfate Activator as a Finer Binder for Cementless Grouting Material. Materials 2019, 12, 3664. [Google Scholar] [CrossRef] [PubMed] [Green Version]
- Lee, J.; Lee, T. Influences of Chemical Composition and Fineness on the Development of Concrete Strength by Curing Conditions. Materials 2019, 12, 4061. [Google Scholar] [CrossRef] [PubMed] [Green Version]
- Li, D.; Li, L.Y.; Wang, X. Chloride diffusion model for concrete in marine environment with considering binding effect. Mar. Struct. 2019, 66, 44–51. [Google Scholar] [CrossRef] [Green Version]
- Wang, Y.; Yu, J.; Wang, J.; Guan, X. Effects of Aluminum Sulfate and Quicklime/Fluorgypsum Ratio on the Properties of Calcium Sulfoaluminate (CSA) Cement-Based Double Liquid Grouting Materials. Materials 2019, 12, 1222. [Google Scholar] [CrossRef] [Green Version]
- Bost, P.; Regnier, M.; Horgnies, M. Comparison of the accelerating effect of various additions on the early hydration of Portland cement. Constr. Build. Mater. 2016, 113, 290–296. [Google Scholar] [CrossRef]
- Kumar, M.P.; Mini, K.; Rangarajan, M. Ultrafine GGBS and calcium nitrate as concrete admixtures for improved mechanical properties and corrosion resistance. Constr. Build. Mater. 2018, 182, 249–257. [Google Scholar] [CrossRef]
- Luo, R.; Cai, Y.; Wang, C.; Huang, X. Study of chloride binding and diffusion in GGBS concrete. Cem. Concr. Res. 2003, 33, 1–7. [Google Scholar] [CrossRef]
- Hu, X.; Shi, C.; Yuan, Q.; Zhang, J.; De Schutter, G. Changes of pore structure and chloride content in cement pastes after pore solution expression. Cem. Concr. Compos. 2020, 106, 103465. [Google Scholar] [CrossRef]
- Sakai, Y. Relationship between pore structure and chloride diffusion in cementitious materials. Constr. Build. Mater. 2019, 229, 116868. [Google Scholar] [CrossRef]
- American Society of Testing and Materials. Standard Practice for Estimating Concrete Strength by the Maturity Method, ASTM C1074. In Annual Book of ASTM Standards; American Society of Testing and Materials: West Conshohocken, PA, USA, 2019; pp. 1–10. [Google Scholar]
- Berg, A.C.; Bank, L.C.; Oliva, M.G.; Russell, J.S. Construction and cost analysis of an FRP reinforced concrete bridge deck. Constr. Build. Mater. 2006, 20, 515–526. [Google Scholar] [CrossRef]


Publisher’s Note: MDPI stays neutral with regard to jurisdictional claims in published maps and institutional affiliations. |
© 2021 by the authors. Licensee MDPI, Basel, Switzerland. This article is an open access article distributed under the terms and conditions of the Creative Commons Attribution (CC BY) license (https://creativecommons.org/licenses/by/4.0/).