Article

Co-Bonded Hybrid Thermoplastic-Thermoset Composite Interphase: Process-Microstructure-Property Correlation

by
Jamal Seyyed Monfared Zanjani
* and
Ismet Baran
*
Faculty of Engineering Technology, University of Twente, 7500AE Enschede, The Netherlands
*
Authors to whom correspondence should be addressed.
Materials 2021, 14(2), 291; https://doi.org/10.3390/ma14020291
Submission received: 3 December 2020 / Revised: 24 December 2020 / Accepted: 29 December 2020 / Published: 8 January 2021
(This article belongs to the Special Issue Modeling of Materials Manufacturing Processes)

Abstract

:
Co-bonding is an effective joining method for fiber-reinforced composites in which a prefabricated part bonds with a thermoset resin during the curing process. Manufacturing of co-bonded thermoset-thermoplastic hybrid composites is a challenging task due to the complexities of the interdiffusion of reactive thermoset resin and thermoplastic polymer at the interface between two plies. Herein, the interphase properties of co-bonded acrylonitrile butadiene styrene thermoplastic to unsaturated polyester thermoset are investigated for different processing conditions. The effect of processing temperature on the cure kinetics and interdiffusion kinetics are studied experimentally. The interphase thickness and microstructure are linked to the chemo-rheological properties of the materials. The interdiffusion mechanisms are explored and models are developed to predict the interphase thickness and microstructure for various process conditions. The temperature-dependent diffusivities were estimated by incorporating an inverse diffusion model. The mechanical response of interphases was analyzed by the Vickers microhardness test and was correlated to the processing condition and microstructure. It was observed that processing temperature has significant effect on the interdiffusion process and, consequently, on the interphase thickness, its microstructure and mechanical performance.

Graphical Abstract

1. Introduction

Advanced fiber-reinforced polymeric composites have emerged as structural materials with a very wide range of applications due to their significant weight reduction, extended durability, and higher design flexibility compared to other traditional material alternatives. However, there are ever-pressing industrial needs for further improving the performance of polymeric composites and to meet the requirements of demanding and cutting edge applications. Combining various advanced materials and creating hybrid or multi-material composites (MMCs) have the potential to push forward the mechanical performance of the manufactured part. The laminated MMCs consist of two or more different combinations of layers, which offer a design versatility to place each specific material, where they can exploit their best characteristics and properties to the benefit of the overall integrity of the structure. Hence, it is considered that the laminated MMCs have the potential to develop future structural materials with high performance [1,2]. Thermoplastic-thermoset hybrid polymer-based composites are one of the possibilities of MMCs with significant potential to address challenges for many state of the art applications [3]. Thermoplastic-thermoset MMCs combine the damage tolerance characteristics, and welding capability of thermoplastics with the strength and stiffness of thermoset composites resulting in more reliable structures with an extended lifetime [4,5,6]. However, joining thermoplastics to thermosets remains a challenging step despite the development of various joining technologies for composite structures including (i) mechanical fastening [7,8,9], (ii) welding [10,11,12,13], (iii) adhesive bonding [14,15,16], (iv) co-curing (parts are cured at the same time) [17,18], and (v) hybrid joints (combination of two or more of previous methods) [19,20,21]. Nevertheless, all these joining methods have disadvantages in terms of being unreliable, labour-intensive, time-consuming and expensive [22].
An alternative and effective joining method for composites is co-bonding (an uncured part is joined with one or more cured parts) [23,24]. The co-bonding method can be applied for jointing both similar or dissimilar materials including thermoplastics to thermosets. Co-bonding eliminates the needs for mechanical fasteners, and adhesives resulting in a more effective and applicable joining method for many applications. The interface between two parts in the co-bonding process is controlled by thermodynamic affinity and physical interactions in between and also the curing process of the reactive resin [10]. Several studies have been conducted on co-bonding process of thermoplastic-thermoset for epoxy thermoset resins and various thermoplastics. In [25], the difference in diffusion of a bisphenol A type epoxy resin and the corresponding diamine curing agent into polysulfone (PSU) was studied. The diffusivity of amine was found to be an order of magnitude larger than that for epoxy at different temperatures. As an extension to the aforementioned study, Rajagopalan et al. [26] showed that the amine enhanced the epoxy diffusivity into PSU by a factor of three due to amine swelling effect. In addition, they identified three chronological processes of diffusion, reaction, and phase separation which derive the interphase formation. In another study, Sonnenfeld et al. [27] improved the damage tolerance of epoxy matrix composites through manufacturing of thermoplastic/thermoset multilayer composites using semi-crystalline poly-ether-ether-ketone (PEEK) and polyphenylene sulfide (PPS). They demonstrated that the introduction of a layer which was compatible with both thermoplastic and thermoset sections such as poly-ether-imide (PEI) increased the adhesion energy by a factor of 15. Velthem et al. [28] studied the influence of the interdiffusion of two thermoplastics of poly(ether sulfone) (PES) and phenoxy in the epoxy system and they correlated the resulting interphase morphologies to the interlaminar fracture toughness. Nevertheless, all these studies were limited to epoxy as the thermoset resin and focused on the interdiffusion process and morphology of interphase.
Processing condition plays an essential role in interphase formation between thermosets and thermoplastics during co-bonding by altering the cure reaction kinetics, and interdiffusion process. The curing reaction of a thermosetting resin is a multi-stage complex and highly temperature-dependent process. In the curing of a thermoset resin, many reactions take place simultaneously such as the decomposition of the initiator, the polymerization of different monomers and oligomers, and termination reactions with changes in the physical behaviour of the resin. All these reactions influence the interdiffusion process and interphase formation since the degree of cure or degree of cross linking of the molecules increases as a function of process time and temperature as shown in [29,30]. Therefore, the interdiffusion kinetics and, consequently, the interdiffusion termination time as determining parameters on the interphase formation are closely linked to curing kinetics of the thermoset resin [31]. More specifically, as the cure reaction progresses the molecular weight and crosslinking density of the resin increase after which no polymer interdiffusion takes place. Regarding the cessation of the polymer interdiffusion at the thermoset-thermoplastic interface, the most accepted assumption is that diffusivity of the reacting resins terminates at the gel point defined as a time in which the resin switches its state from a viscous liquid to a semi-solid rubbery gel and loses its fluidity [12,32,33,34]. Accordingly, the kinetics of curing and interdiffusion determines the interphase thickness, its quality, and the microstructure. It is known that the mechanical performance and strength of interphase in hybrid composites are primarily determined by the interphase thickness [35,36]. Therefore, a physical and mechanical understanding of the interphase is critical to determine the load transfer efficiency across dissimilar materials and to oversee the overall integrity of the structure. To the best of the authors’ knowledge, there is no comprehensive study elaborating on the effect of processing conditions and cure kinetics on the micro-structure and mechanical response of the interphases in co-bonded thermoplastic-thermoset parts in the literature.
In this study, unsaturated polyester resin (UPR) for the first time is used to be co-bonded to a thermoplastic part. UPR is one of the widespread used thermoset resins in various industry due to its low cost and excellent processability in many applications such as wind energy and ship manufacturing industries [37,38]. On the other hand, a terpolymer of acrylonitrile, butadiene, and styrene with commercial name of acrylonitrile butadiene styrene (ABS) known to have excellent mechanical properties including high toughness, ductility, and very high impact strength is selected as the thermoplastic material [39]. Herein, the effect of processing temperature on the co-bonding of ABS and UPR and resultant interphase morphology and mechanical response are investigated. The interdiffusion kinetics and mechanisms during co-bonding are explained and linked to the chemo-rheological properties of UPR. Models are developed and utilized to predict the interphase thickness at various processing conditions and to provide information on interphase microstructure. The experimentally characterized gel time and interdiffusion thickness are used in a one-dimensional (1D) inverse diffusion model to estimate the diffusivity at different temperatures. Subsequently, the diffusivities are fit to an Arrhenius type of model. Vickers’ microhardness test was used to study the mechanical behaviour at the interphase of the specimens at various temperatures. Finally, a methodology is provided to assemble process-microstructure-property correlations at interphases which are essential to the design and manufacturing of reliable thermoplastic -thermoset MMCs.

2. Materials and Methods

2.1. Materials

An industrial medium reactive orthophthalic unsaturated polyester resin (UPR) designed for resin transfer moulding and vacuum injection moulding processes as described in [40] was used as thermoset resin. This resin contained 45% styrene with an acid number of 25 mgKOH/g. A liquid peroxide system specialized for curing of the unsaturated polyester and vinyl ester resins at room temperature with low peak exotherm, and long working time (gel time) was used as an initiator. ABS in the sheet form with grade name of VIKUREEN ABS PLAAT GLANS WIT 0291 (Epsotech, Jülich Kirchberg, Germany), with strong resistance to corrosive chemicals and/or physical impacts, was used as thermoplastic material in this study.

2.2. Interphase between Thermoset and Thermoplastic

To study the interdiffusion of thermoset resin into thermoplastic, ABS specimens were prepared by cutting them using a wet saw into parts with estimated dimensions of 15 mm × 15 mm × 3 mm followed by edge sanding with #500 SiC foil to remove any debris. Next, an isopropyl alcohol and a mixture of water were utilized to wash ABS specimens to remove any remaining particles and contamination. Specimens were dried in the oven at a temperature of 60 °C for 24 h and then left in a desiccator to reach room temperature. Afterward, ABS specimens were placed vertically in the middle of a cylindrical embedding mould with a diameter of 25 mm by using a couple of metallic clamping rings. The degassed UPR resin mixture was poured onto the ABS specimens until the resin completely covered them. Effect of temperature on the interphase was studied by preparing the samples and placing of the moulds in the preheated oven fixed at the set temperatures of 25 °C, 35 °C, 40 °C, 50 °C, and 60 °C and curing for 24 h followed by a post-curing process at 60 °C for 24 h. After the de-moulding of samples, Struers polishing system (Teramin-30, Struers, Cleveland, OH, USA) was employed to polish the cross-sections of specimens with SiC foil of #500, #1000, #2000 and #4000, in the given order. The final polishing of the embedded specimens were done by using OP-S NonDry. A schematic view of the cross-section for the co-bonded ABS-UPR sample and the resulting interphase due to polymer interdiffusion are shown in Figure 1.

2.3. Characterizations

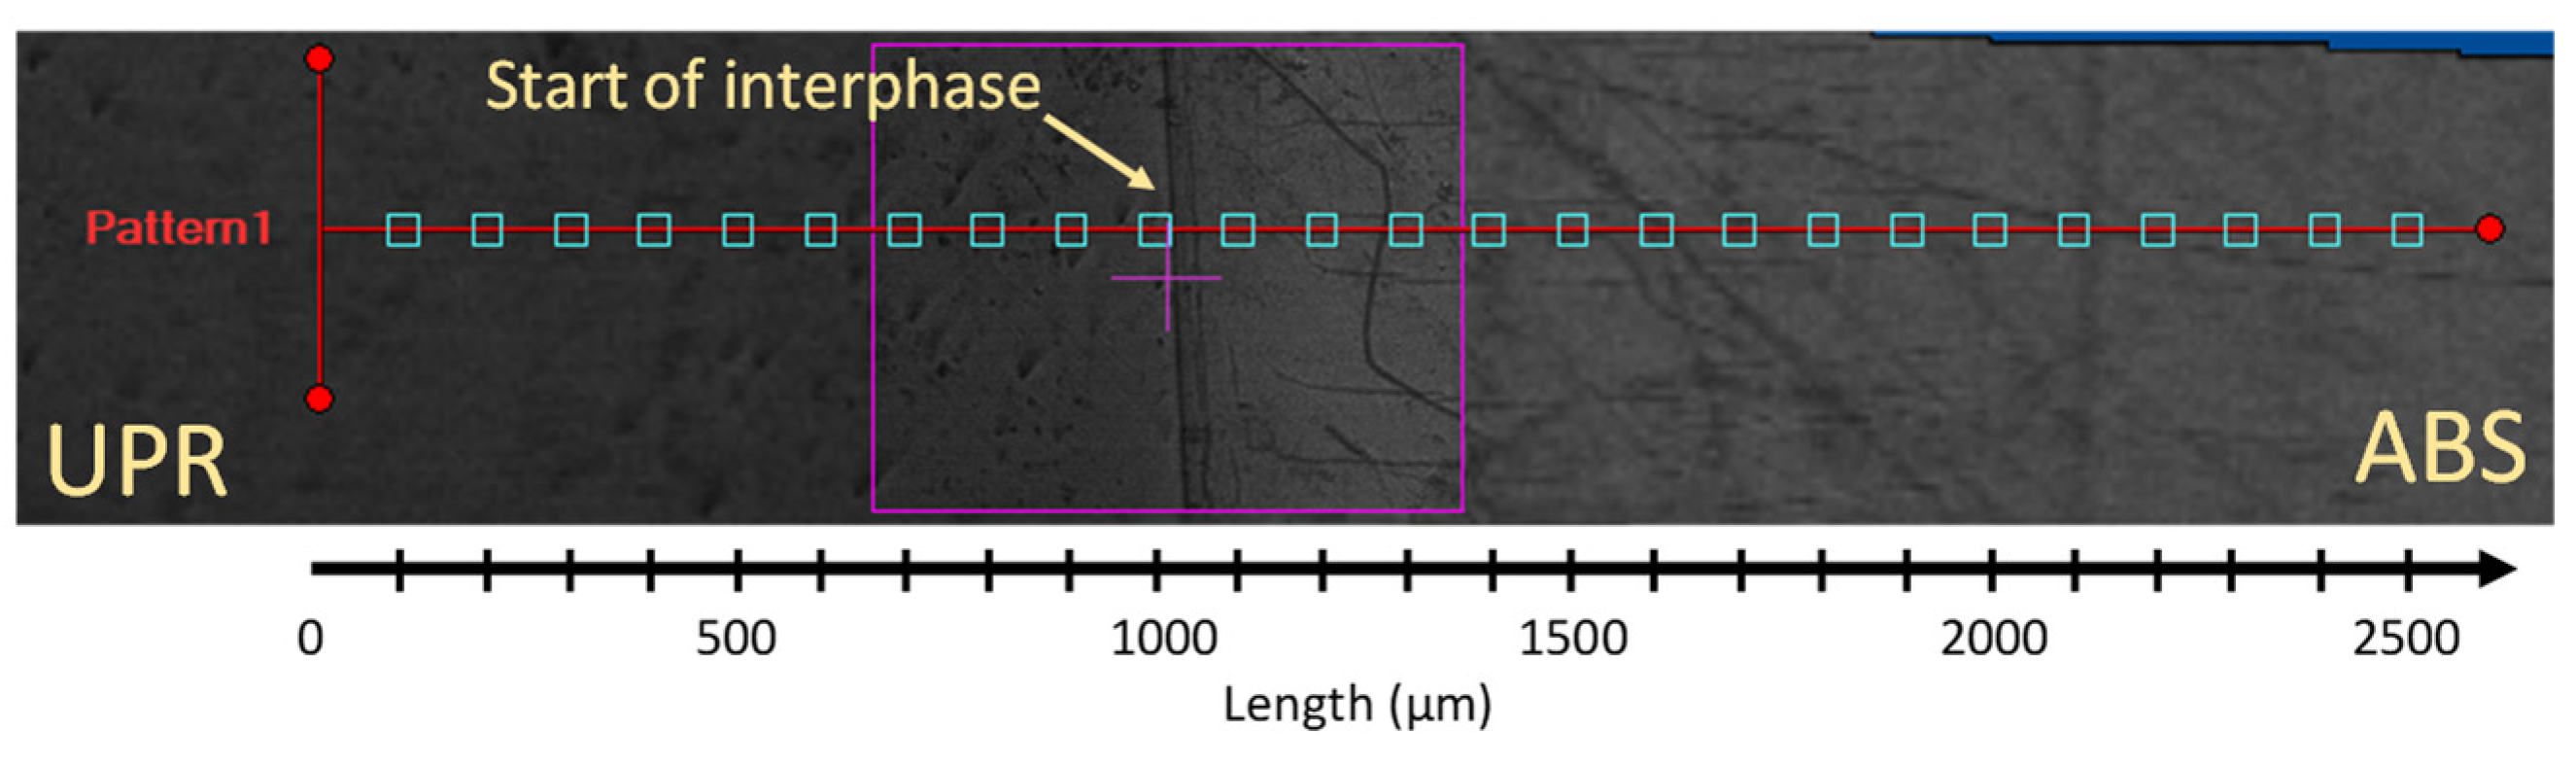
2.3.1. Microscopic Analysis of Unsaturated Polyester Resin-Acrylonitrile Butadiene Styrene (UPR-ABS) Interphase+

The polished cross-section of interphases formed between the co-bonded ABS and UPR systems at various processing conditions were analysed by using a Keyence VHX-5000 digital microscope (Keyence, Osaka, Japan) equipped with a VH-100UR lens. 2D stitching function of the microscope software was used to joint several captured images to obtain a sufficiently large cross-section of the interface. The interphase thickness values were reported for each temperature as the average measurements at mid-section of the interface far from the clamps and obtained from at least three specimens for each temperature.

2.3.2. Surface Swelling Measurements

Furthermore, the surface swelling of ABS by UPR resin were examined at room temperature. For this, a parallel plate apparatus of the rheometer (in stationary mode) (Anton Paar Germany GmbH, Ostfildern, Germany) was employed to confine the resin between the head plate and ABS sheet (as the bottom plate) as shown in Figure 2a. The nominal normal force was set to 0.1 N in the rheometer. The normal force was kept constant to ensure the contact of resin to the rheometer head and surface of the specimen and to prevent resin starvation due to diffusion at the study surface. The capillary forces between UPR and the plates which might cause a possible resin flow out was prevented by the plate-plate configuration. Herein, 50 mm × 50 mm ABS plates were cut, edge sanded as mentioned in detail in Section 2.2, and then were glued on the surface of the bottom plate of the rheometer. The plate-plate distance was set to 0.5 mm and was filled with UPR, i.e., without mixing it with the liquid peroxide system, and kept for 60 min. Next, Keyence VK-9700 confocal microscope was used to capture the changes in the surface topology of ABS due to swelling by UPR. The height and spatial resolutions were 1 and 120 nm in the confocal microscope which had a laser with 408 nm wavelength. As seen from Figure 2b, the confocal microscopy measurements were performed on the path which covered the region with and without UPR to define the surface swelling of APB. The length of the scanned length by the confocal microscopy was approximately 8 mm.

2.3.3. Chemo-Rheology of UPR

The chemo-rheological properties of the UPR were characterized by using the Anton Paar-Physica MCR 501 rheometer (Anton Paar Germany GmbH, Ostfildern, Germany) in “plate–plate” mode. The effect of processing temperature on the viscosity, storage modulus (G′) and loss modulus (G″) were investigated. All the measurements were performed by using circular aluminium plates of 25 mm diameter in oscillatory mode at a 0.5% strain and a 1 Hz with a plate-plate spacing of 0.3 mm. The temperature-dependent gel time of the resin, as an indication of the cure kinetics of UPR resin, was estimated from the crossing point of storage modulus (G′) and loss modulus (G″) of UPR mixture including the liquid peroxide [41]. The rheometer measurements were performed at seven different isothermal temperatures of 25 °C, 35 °C, 40 °C, 50 °C, 60 °C, 80 °C and 100 °C and final gel time at each temperature was reported as the average of at least three repetitions. In the gel-time measurements, the rheometer was maintained at the set temperature for 30 min before placing the resin to achieve a uniform and stabilised temperature in the measurement chamber. The relation between temperature-dependent gel time values and temperature was describe by employing an Arrhenius relationship as [42]:
( 1 t G ) = ( 1 t 0 ) e x p ( Δ E R T )
where tG was gel time, t0 was the pre-exponential time constant, R was the universal gas constant, and ΔE is the activation energy of the gelation. Herein, gel time as an index of cure kinetics was employed to monitor the changes during the curing reaction and to determine the cure kinetics effect on interphase formation. The viscosity measurement was performed on the UPR (without initiator) with a ramp of 1.5 °C/min between room temperature to 85 °C where measurements were taken every 10 s and resulted in 240 measurement points.

2.3.4. Diffusivity Coefficient of UPR in ABS

1D Inverse Diffusion Model

The 1D interdiffusion of the UPR into ABS as schematically shown in Figure 3 was modelled using the Fick’s second law [43] as:
c ( x , t ) t = D 2 c ( x , t ) x 2
where c ( x , t ) was the UPR concentration in ABS, D was the diffusivity or coefficient of diffusion. By assuming D is constant at a certain temperature and the volume of ABS does not change with the diffusion of UPR into ABS, Equation (2) can be solved analytically as [44]:
c ( x , t ) c ( 0 , t ) c ( x , 0 ) c ( 0 , t ) = erf ( x 2 D t )
where erf was the error function, c ( 0 , t ) was the concentration at x = 0 and c ( x , 0 ) was the initial concentration. Since the interdiffusion distance ( x i n t ) was experimentally determined, the corresponding D can be obtained from Equation (3) by considering the conditions in the following:
  • c ( 0 , t ) = 1 for   t t g e l and c ( 0 , t ) = 0 for t > t g e l where t g e l was the gelation time of the polyester resin which was determined experimentally in Section 2.3.3.
  • The concentration was assumed to be relatively small by using a value of 10−5 at t = t g e l and at x = x i n t , i.e., c ( x i n t , t g e l ) = 10 5 (see Figure 3).
Accordingly, D was obtained using Equation (4). Note that D was estimated for different t g e l and x i n t which were obtained at different process temperatures.
D = 1 t g e l ( x i n t 2 erf 1 ( 1 c ( x i n t , t g e l ) ) ) 2

Temperature Dependent Diffusivity Model

The obtained D values from the 1D inverse diffusion model for different temperatures were fit with an Arrhenius type of equation as follows [44]:
D = D 0 exp ( E 1 R T )
which was the diffusivity model also used in [25,26,44]. In Equation (4), D0 was the pre-exponential constant, E1 was the activation energies, R was the universal gas constant and T was the temperature in K. A linear regression was employed for the fitting procedure by transforming the non-linear relation in Equation (5) into a linear one as:
ln ( D ) = ln ( D 0 ) E 1 R T

2.3.5. Resin Uptake

The kinetics of the interdiffusion was investigated by resin uptake experiments where ABS specimens were immersed into a UPR bath (without initiator) and the weight of the absorbed resin by specimens were measured at different times of 60, 300, 600, 1200, 1800, 3600 and 7200 s after immersion and temperatures of 25 °C, 35 °C, 40 °C, 50 °C, and 60 °C. The nominal dimensions of the ABS specimens were 30 mm × 30 mm which were measured by using a micrometre with a precision of ±0.01 mm. An analytical balance was used to measure the dry weight of specimens. The immersion of the specimens in to the resin was carried out by using the metallic clamps. The excess resin on the specimen surface after the immersion step was washed by using an ethanol. In addition, non-sticking and absorbent fabrics were used to clean the specimen surfaces. After drying, resin uptake weight were measured by the analytical balance and the uptake values per contact area (M*) were calculated using the below formula:
M * = W i W d A
where Wi and Wd were the resin uptake weight and dry ABS specimen weight, respectively, M* was the mass uptake per unit area and A was the surface area. As the length and width of specimens were considerably (over 10 times) larger than the thickness, the resin uptake from the edges of ABS samples was neglected. The measured data were fitted to Equation (8) in order to evaluate the transport type and associated diffusion kinetics (resin uptake) [45].
M * = k t n
where k was an empirical rate constant, t was the time and n was the transport exponent of diffusion. The type of diffusion is indicated by n in Equation (8), i.e., n = 0.5 for Fickian diffusion, 0.5 < n<1 for an anomalous diffusion, and n = 1 for Case II diffusion [45].
Nevertheless, to obtain a kinetics model for a continuous range of temperatures based on Equation (8), it was needed to have a model for n and k over experimental temperatures. Herein, n and k are approximated by Equations (9) and (10) as:
n = A n e x p ( N 0 T )
k = k 1 + k 2 T
where An, N0, k1, k2 were defined as constants to be determined through fitting of experimental results.

2.3.6. Resin Volume Fraction at Interphase

To correlate the diffusion kinetics to resin curing kinetics and consequently interphase formation, Equations (1) and (8)–(10) are combined into Equation (11). This eliminated the time term from resin uptake equation (Equation (8)) for the reactive resin and yield to a model for amount of diffused reactive resin per unit area (M*) into ABS at given temperature.
M * = ( k 1 + k 2 T ) ( t 0 e x p ( Δ E R T ) ) ( A n exp ( N 0 T ) )
Moreover, the relation between M* and Vr (the volume of the diffused resin) was obtained by using the following relation:
M * = M A = ρ V r A = ρ V r *
where ρ and A were the density of uncured resin (1.05 gr/cm3) and contact surface area, respectively. Herein, Vr* was defined as V r * = V r A and so-called reduced resin volume (diffused volume per unit of contact area). Vr* values at any given temperature were obtained from combining Equations (11) and (12) as:
V r * = ( 1 ρ ) ( k 1 + k 2 T ) ( t 0 e x p ( Δ E R T ) ) ( A n exp ( N 0 T ) )
Accordingly, the ratio of Vr* to reduced volume of interface Vint* which corresponds to interphase thickness provided the volume fraction of resin at the interphase (φ) as an essential microstructure indicator in binary interphases defined as:
φ = V r * V i n t *

2.3.7. Hardness Measurement at Interphase

The Vickers microhardness test was employed to analyse the changes in the mechanical response at the UPR-ABS interphase. The hardness obtained by this method was described as the resistance of the surface to indentation [46]. Vickers microhardness mapping was conducted using the LECO LM100AT micro-hardness tester by applying a load of 10 gr and an indent spacing of 100 µm. The Vickers diamond pyramid hardness number, HV, was defined as the ratio of the applied load, P, to the pyramidal contact area of the indentation:
H v = α P d 2
where d was the diagonal length of the resultant impression, and α was defined as 1.8544 for the Vickers indenter [47]. Figure 4 shows an example pattern and sample configuration used in the microhardness measurements in the vicinity of interphase for ABS and UPR. A total of 25 indentations for each line were conducted with 100 µm intervals in the width of interphase as shown in Figure 1 in which the initial 1000 µm was for the UPR and the rest covered the interphase and ABS regions. The hardness profiles were reported for each temperature determined from the average measurements for at least three specimens.

3. Results and Discussion

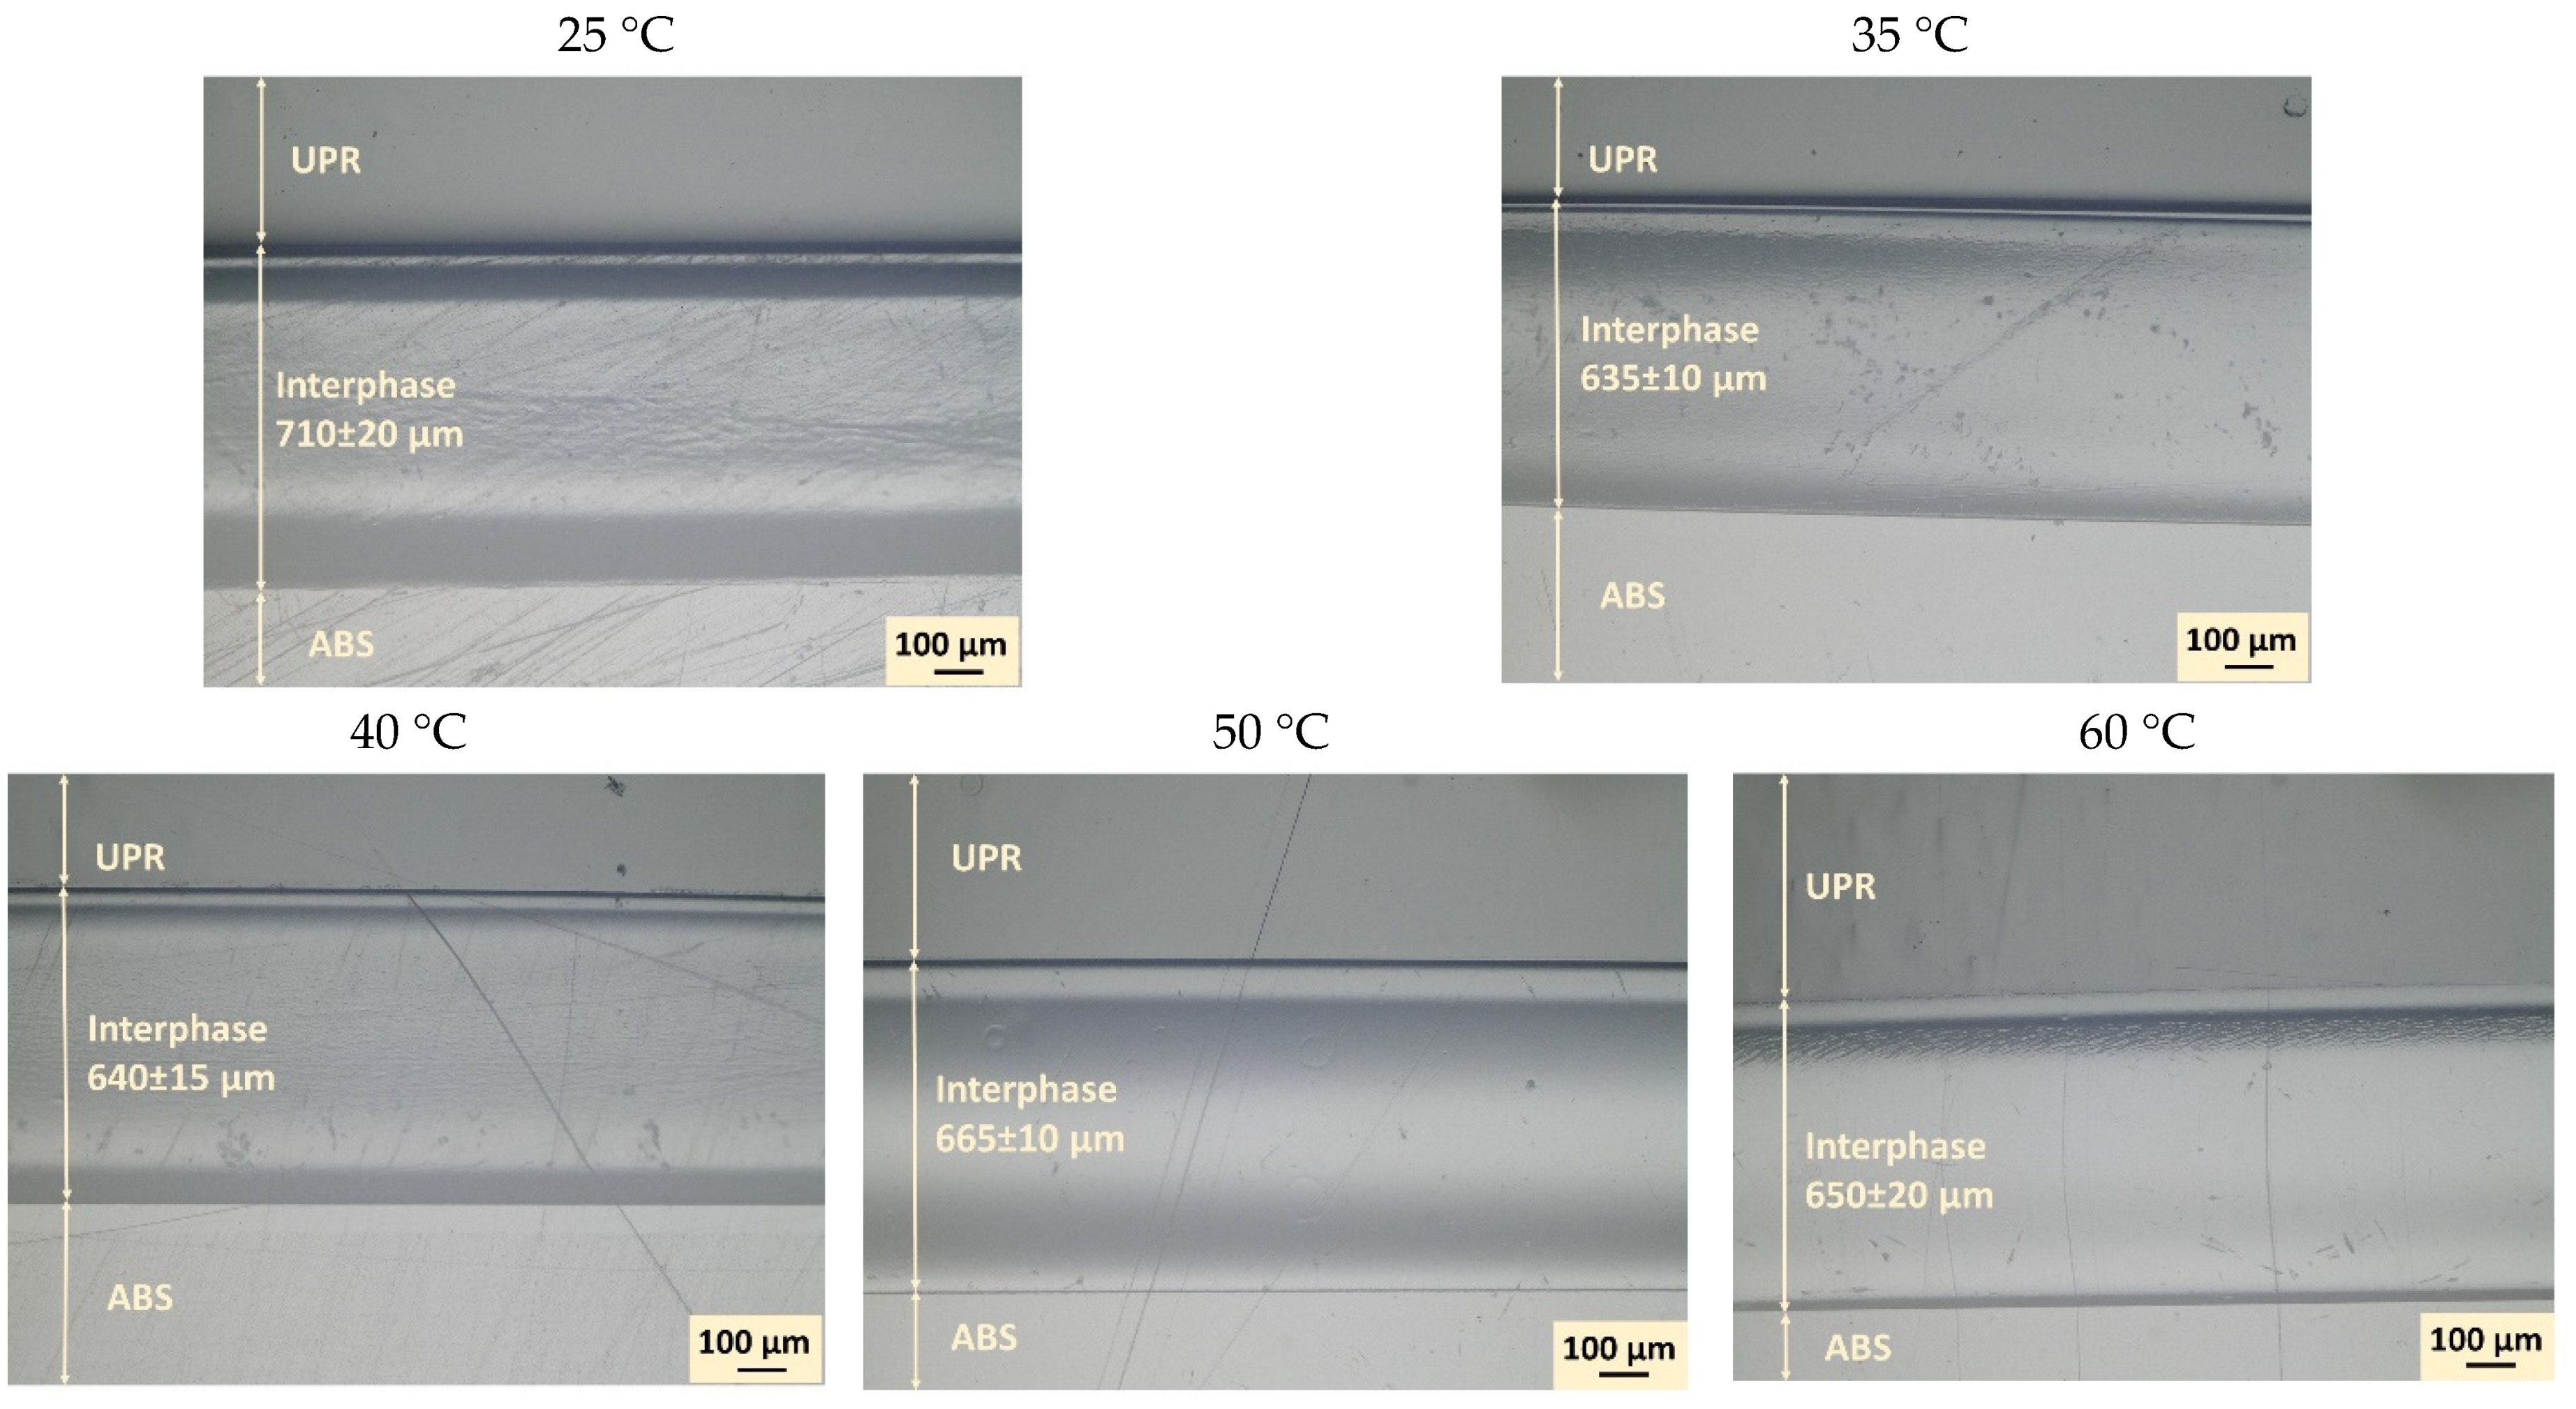
3.1. Interphase Formation and Processing Temperature Effect

Figure 5 reveals the optical microscopic observations of ABS-UPR interphases indicating the average interphase thickness formed at different temperatures ranging from 25 °C to 60 °C. It was observed that an interphase was formed between ABS and UPR at all temperature ranges with no visible gradient of diffusion. Nonetheless, the interdiffusion fronts in both sides of formed interphases were slightly different from inner sections which implies the contribution of various phenomena in interphase formation. Therefore, an overview image of interphase formed around the ABS specimen at 25 °C was constructed by stitching several overlapping microscopic images as shown in Figure 6 to illustrate the effect of boundary conditions and constraints such as metallic clamps on the interphase formation. In Figure 6, a dash-lined frame is inserted in the image to estimate the boundaries of the original ABS specimen before interactions with UPR. The frame size and location were approximated, based on the location of metallic clamping rings and nominal thickness of the ABS sample before embedding. Figure 6 reveals that the interphase formed around the ABS noticeably exceeded the boundaries of the original ABS sample (dashed frame). To elaborate, it was expected to have the diffusion in both directions of UPR into ABS and ABS into UPR. Nevertheless, diffusion of ABS into UPR was at a much lower level compared to UPR into ABS due to the higher molecule size and lower molecular mobility of ABS as compared with liquid UPR [48,49]. However, the difference in the interphase thicknesses inside and outside of the frame was not as significant as it was anticipated. Therefore, swelling of ABS with UPR was a contributing parameter in the interphase thickness. In this regard, the swelling behaviour of ABS in contact with UPR was studied by placing the UPR on the surface of the ABS sample in the rheometer as mentioned. Figure 7 depicts the confocal microscopy results of the surface profile of ABS after being in contact with UPR in the rheometer. It is clearly seen that the ABS surface was swelled and its height increased approximately 70 μm as compared with the rest of the specimen. The increase in the ABS sheet thickness confirmed the swelling behaviour of ABS in contact with UPR.
Moreover, it can be seen in Figure 5 that the process temperature influenced the interphase thickness considerably. Figure 8 displays the changes in interphase thickness with respect to the process temperature. It is seen that the thickest interphase was achieved for specimen prepared at 25 °C with an interphase thickness of 710 ± 20 μm while the thinnest interphase was observed at 35 °C as 635 ± 10 μm. It can be seen in Figure 8 that the interphase thickness sharply decreased by increasing the temperature from 25 °C to 35 °C followed by a gradual increase after 35 °C up to 50 °C and slightly drops from 50 °C to 60 °C. The controversy effect of temperature on interphase thickness under and above 35 °C can be described by the effect of temperature on the cure kinetics and diffusion kinetics of the resin. An increase in temperature was expected to accelerate the curing kinetics leading to a decrease in the time available for the interdiffusion process (decreasing factor for interphase thickness). However, the rate of change in the cure kinetic is different at low and high temperatures. At higher temperature, the peroxide was already over its thermal activation temperature threshold (the employed initiator was designed for application in room temperature and above it). Therefore, the acceleration rate was lower while at the lower temperature an increase in temperature can provide the necessary activation energy for peroxides and boost the reaction kinetics significantly [50]. To obtain a comprehensive understanding of the effect of temperature on the interphase formation, cure kinetics and its mechanical properties, and interdiffusion process were investigated and further described in the next section.

3.2. Resin Curing and Diffusion Kinetics

Figure 9a shows the gel time obtained with respect to isothermal rheometer tests. It is seen that the gel time changed linearly in the logarithmic scale with temperature indicating that the gel time was considerably shortened by an increase in temperature. Herein, Equation (1) is reorganized as Equation (16) to determine the constants from the fit line in the graph ln(tG) vs. 1000/T graph as presented in Figure 9b.
ln ( 1 t G ) = ln ( 1 t 0 ) Δ E / R T
The slope and intercept for Equation (16) of the fit line were calculated to be −8.005 K and 17.77, respectively, which correspond to the pre-exponential time constant of 2 × 10⁻⁸ s and activation energy of 66.5 kJ/mol.
Moreover, the changes in the temperature were associated with the alterations in interdiffusion kinetics by increasing the molecular mobilities indicated by a reduction in the viscosity of the resin as seen in Figure 9c [28,51]. In Figure 9c, it was found that the viscosity of UPR changed linearly with temperature in logarithmic scale and a small increase in temperature reduces the viscosity considerably which can promote the interdiffusion and result in thicker interphase. It is worth noting that to eliminate the effect of curing on the viscosity of the resin, initiator was not added to the resin in viscosity measurement tests [30].
These observations regarding the changes in cure kinetics via the gel time and resin viscosity by temperature clearly described the drop in the interphase thickness between 25 °C and 35 °C, i.e., the gel time decreased significantly in this region. On the other hand, after 35 °C the change in gel time took place at much lower levels. To elaborate, the gel time dropped approximately from 12500 s at 25 °C to 4000 s at 35 °C. This indicated that 8500 s less time was available for the polymer diffusion. The gel time difference between 40 °C and 50 °C was only about 900 s and it further declined from 50 °C to 60 °C as the gel time difference was obtained as approximately 360 s. On the other hand, at higher temperatures viscosity of the resin dropped to much lower values compared to the viscosity at lower temperatures. This low viscosity at high temperatures promoted the interdiffusion process with limited change in the gel time leading to a gradual increase in the interphase thickness between 35 °C to 50 °C. Furthermore, the significantly shorter gel time at 60 °C compared to 50 °C is the reason to its lower interphase thickness.

3.3. Diffusivity Coefficient and Model

The diffusivity of UPR into ABS was estimated by using Equation (4) and the results obtained are shown in Figure 10. The inverse diffusion model resulted in an exact value for the interdiffusion thickness as seen in Figure 10b for the corresponding diffusivity values. It can be seen in Figure 10a that the fitted diffusivity was found to be in the range of 10−12–10−10 (m2/s) for the temperature range of 25–60 °C. The estimated magnitudes of the diffusivities matched with the reported diffusivities of other systems such as epoxy-PSU [26,52], amine-PSU [26,52], toluene-PEEK (for 0% initial crystallinity of PEEK) [53], CS2-PEEK (for 0% initial crystallinity of PEEK) [53] and toluene-PVAc (for mass fraction of toluene of 0.1) [54] as seen in Figure 10a. The trend of the temperature dependent diffusivity was captured well with the temperature dependent model given in Equation (5) with D 0 = 1.69 × 10 1 m2/s and E 1 = 7.52 × 10 4 cal/mol. The diffusivity coefficient magnitude obtained and its trend with temperature was in conformity with available literature. The relation between the experimentally obtained viscosity and the temperature dependent diffusivity obtained by the inverse diffusion model is shown in Figure 10c. It can be seen that the diffusivity was found to be inversely proportional which supported the aforementioned observations regarding the interdiffusion thickness and viscosity. In addition the trend obtained for the diffusivity vs viscosity also matches with the findings in [55] for the diffusion of organic molecules in sucrose–water solutions.

3.4. Kinetics of Interdiffusion and Its Correlation to Interphase Microstructure

Figure 11a depicts the resin uptake per surface area (M*) vs. time at the different temperatures ranging from 25 °C to 60 °C. It can be seen that increasing the temperature enhanced the resin uptake value for all the measurement times. A line fitting was employed for the relation between Ln (M*) and Ln (t) seen in Figure 11b to determine k and n (see Equation (8)) and the results obtained are listed in Table 1. It was observed that n value changed with a change in temperature however it remained between 0.5 and 1 which indicated the anomalous nature of the diffusion process. More specifically, the value of n in Equation (8) sharply dropped from 0.7001 at 25 °C to 0.5717 at 35 °C and thereafter it followed a gradually decreasing trend by an increase in the temperature down to 0.5251 at 60 °C. Herein, An and N0 as the constants in Equation (9) were calculated as 0.048 and 775 K, respectively by linear fitting on the projection of n values on Ln (n) vs 1/T graph as shown in Figure 12a. Similarly, k values at any given temperature in our experimental range were evaluated by Equation (10) where k1 and k2 were calculated to be −4.13 × 10⁻⁵ gr/mm2. sn and 3.86 × 10⁻⁷ gr/mm2·sn. K by line fitting on the k vs. T graph as shown in Figure 12b.
Table 2 summaries the φ vales calculated based on Equation (14) for ABS-UPR interphases obtained at different temperatures. It can be seen that the volume fraction of resin at the interface decreases by increasing the process temperature. This can be explained by a difference in the progress of diffusion front line which was accelerated by an increase in the temperature while such an increase in temperature led to a faster curing and, therefore, lower diffusion time limiting the volume of diffused resin in the interphase area.

3.5. Interphase’s Mechanical Response by Microhardness

Figure 13a shows the variations of Vickers microhardness numbers in the vicinity of the interphase prepared at different temperatures. It was observed that the hardness numbers at the interphase for all the samples were lower than for both pure UPR and ABS. It can also be seen that there was a transition region from the UPR to ABS (between 1000 µm and 1200 µm) as a sharp drop in the hardness value followed by a minimum value plateau indicating the interphase area and ended by an increase to ABS hardness value. The plateau lengths were correlated with interphase thicknesses obtained by the microscopic observations. The drop in the hardness at the interphase regions can be explained by the plasticizing effect of unreacted UPR monomers due to the limited access to reaction components at the interphase area. It can be seen from Figure 13a that the interphase hardness is correlated with the processed temperature science a higher cure temperature results in an increase in interphase hardness.
To relate the microhardness at the interphase to the processing condition and microstructure of interphase, Figure 13b exhibits the averaged harness at the interphase (average of 1200 µm–1700 µm) and volume fraction of resin at the interphase (φ) calculated by Equation (14) on different processing temperatures. It can be seen that samples prepared at higher temperatures had a lower φ and hence a less resin presence at interphase to act as a plasticizer and consequently this resulted in a higher hardness values compared to specimens prepared at lower temperatures. On the other hand, samples prepared at lower temperatures showed a lower hardness due to higher volume fraction of resin at the interphase. Figure 13b provides a clear correlation on the process-microstructure and properties relation at the interphase of ABS with UPR.

4. Conclusions and Future Work

The interphase of a co-bonded ABS-UPR was investigated in this work by critically correlating the processing conditions, chemo-rheological behaviour, resulting microstructure and mechanical performance. The swelling of ABS with UPR was identified as a contributing parameter to the interphase size. It was observed that the interphase size changed with the processing temperature and it was correlated with thermal changes in the viscosity and cure kinetics of UPR through the gel time. The diffusivity of UPR into ABS was estimated by using the 1D inverse diffusion model in which the experimentally characterized temperature-dependent gelation time and interdiffusion thicknesses were utilized. The diffusivities obtained were fit to an Arrhenius relationship which can be used further for process simulations with various temperature ranges. More characterization experiments must be carried out to validate the diffusivities obtained and the developed diffusivity model. It was shown that the diffusivity was inversely proportional with the viscosity. The resin uptake experiments were employed to understand the kinetics of UPR diffusion into ABS at different temperatures. Accordingly, a resin uptake model was fitted to the experimentally obtained data by taking the processing temperature and cure kinetics of UR into account. The developed model was used to determine the volume fraction of the resin at the ABS-UPR interphase. The diffusivity coefficient obtained here is provide substantial information for future studies on the process modelling of multi-material composites and complex shaped hybrid structures. Microhardness tests showed that the hardness of interphase was lower than both ABS and UPR regions due to the plasticization effect of UPR molecules at the interphase. A correlation was created between the processing condition, resin volume fraction and its microhardness at the interphase which can be used for designing such a hybrid MMCs in the future.
In the current work, the effect of the normal force used in the swelling experiments with the rheometer on the polymer interdiffusion at the ABS-UPR interface was not taken into account which is considered as a future work. Similarly, the effect of processing temperature on the viscosity up to the gelation is also defined as future work because the change in viscosity might influence the interphase thickness which was assumed to be negligible in this study.

Author Contributions

Conceptualization, J.S.M.Z. and I.B.; methodology, J.S.M.Z. and I.B.; validation, J.S.M.Z. and I.B.; investigation, J.S.M.Z. and I.B.; resources, I.B.; data curation, J.S.M.Z. and I.B.; writing—original draft preparation, J.S.M.Z. and I.B.; writing—review and editing, J.S.M.Z. and I.B; visualization, J.S.M.Z. and I.B.; funding acquisition, I.B. All authors have read and agreed to the published version of the manuscript.

Funding

This research was funded by the research program Talent Scheme (Veni) with project number 15897, which is (partly) financed by the Netherlands Organization for Scientific Research (NWO) and TKI-Wind op Zee Topsector Energy subsidy from the Ministry of Economic Affairs, the Netherlands with the reference number TEWZ118008.

Data Availability Statement

The data presented in this study are available on request from the corresponding authors. The data are not publicly available due to legal and privacy issues.

Acknowledgments

Authors gratefully acknowledge LM Wind Power for consultations during the project and supply of polyester resin.

Conflicts of Interest

The authors declare no conflict of interest.

References

  1. Monfared Zanjani, J.S.; Okan, B.S.; Menceloglu, Y.Z.; Yildiz, M. Nano-engineered design and manufacturing of high-performance epoxy matrix composites with carbon fiber/selectively integrated graphene as multi-scale reinforcements. Rsc Adv. 2016, 6, 9495–9506. [Google Scholar] [CrossRef]
  2. Nash, N.H.; Young, T.M.; McGrail, P.T.; Stanley, W.F. Inclusion of a thermoplastic phase to improve impact and post-impact performances of carbon fibre reinforced thermosetting composites—A review. Mater. Des. 2015, 85, 582–597. [Google Scholar] [CrossRef]
  3. Seyyed Monfared Zanjani, J.; Baran, I.; Akkerman, R. Combatting rain erosion of offshore wind turbine blades by co-bonded thermoplastic-thermoset hybrid composites. IOP Conf. Ser. Mater. Sci. Eng. 2020, 942, 012024. [Google Scholar] [CrossRef]
  4. Selver, E.; Potluri, P.; Hogg, P.; Soutis, C. Impact damage tolerance of thermoset composites reinforced with hybrid commingled yarns. Compos. Part B Eng. 2016, 91, 522–538. [Google Scholar] [CrossRef]
  5. Dogan, A.; Arikan, V. Low-velocity impact response of E-glass reinforced thermoset and thermoplastic based sandwich composites. Compos. Part B Eng. 2017, 127, 63–69. [Google Scholar] [CrossRef]
  6. Ma, Y.; Yang, Y.; Sugahara, T.; Hamada, H. A study on the failure behavior and mechanical properties of unidirectional fiber reinforced thermosetting and thermoplastic composites. Compos. Part B Eng. 2016, 99, 162–172. [Google Scholar] [CrossRef]
  7. Thoppul, S.D.; Finegan, J.; Gibson, R.F. Mechanics of mechanically fastened joints in polymer–matrix composite structures—A review. Compos. Sci. Technol. 2009, 69, 301–329. [Google Scholar] [CrossRef]
  8. Hassan, J.; Feser, T.; O’Higgins, R.M.; Waimer, M.; McCarthy, C.T.; Toso, N.; Byrne, M.E.; McCarthy, M.A. Energy absorption capability of composite bolted joints undergoing extended bearing failure. Compos. Struct. 2020, 237, 111868. [Google Scholar] [CrossRef]
  9. Cao, Y.; Cao, Z.; Zhao, Y.; Zuo, D.; Tay, T.E. Damage progression and failure of single-lap thin-ply laminated composite bolted joints under quasi-static loading. Int. J. Mech. Sci. 2020, 170, 105360. [Google Scholar] [CrossRef]
  10. Stavrov, D.; Bersee, H.E.N. Resistance welding of thermoplastic composites-an overview. Compos. Part A Appl. Sci. Manuf. 2005, 36, 39–54. [Google Scholar] [CrossRef]
  11. Yousefpour, A.; Hojjati, M.; Immarigeon, J.-P. Fusion Bonding/Welding of Thermoplastic Composites. J. Thermoplast. Compos. Mater. 2004, 17, 303–341. [Google Scholar] [CrossRef]
  12. Villegas, I.F.; van Moorleghem, R. Ultrasonic welding of carbon/epoxy and carbon/PEEK composites through a PEI thermoplastic coupling layer. Compos. Part A Appl. Sci. Manuf. 2018, 109, 75–83. [Google Scholar] [CrossRef]
  13. Sahu, S.K.; Mishra, D.; Mahto, R.P.; Sharma, V.M.; Pal, S.K.; Pal, K.; Banerjee, S.; Dash, P. Friction stir welding of polypropylene sheet. Eng. Sci. Technol. Int. J. 2018, 21, 245–254. [Google Scholar] [CrossRef]
  14. Takeda, T.; Yasuoka, T.; Hoshi, H.; Sugimoto, S.; Iwahori, Y. Effectiveness of flame-based surface treatment for adhesive bonding of carbon fiber reinforced epoxy matrix composites. Compos. Part A Appl. Sci. Manuf. 2019, 119, 30–37. [Google Scholar] [CrossRef]
  15. Martínez-Landeros, V.H.; Vargas-Islas, S.Y.; Cruz-González, C.E.; Barrera, S.; Mourtazov, K.; Ramírez-Bon, R. Studies on the influence of surface treatment type, in the effectiveness of structural adhesive bonding, for carbon fiber reinforced composites. J. Manuf. Process. 2019, 39, 160–166. [Google Scholar] [CrossRef]
  16. Çoban, O.; Akman, E.; Bora, M.Ö.; Genc Oztoprak, B.; Demir, A. Laser surface treatment of CFRP composites for a better adhesive bonding owing to the mechanical interlocking mechanism. Polym. Compos. 2019, 40, 3611–3622. [Google Scholar] [CrossRef]
  17. Dahmen, V.; Redmann, A.J.; Austermann, J.; Quintanilla, A.L.; Mecham, S.J.; Osswald, T.A. Fabrication of hybrid composite T-joints by co-curing with 3D printed dual cure epoxy. Compos. Part B Eng. 2020, 183, 107728. [Google Scholar] [CrossRef]
  18. Zheng, C.; Wang, S.; Liang, S. Interface bonding mechanisms of co-cured damping carbon fiber reinforced epoxy matrix composites. J. Alloys Compd. 2020, 822, 153739. [Google Scholar] [CrossRef]
  19. Huang, Y.; Meng, X.; Xie, Y.; Li, J.; Si, X.; Fan, Q. Improving mechanical properties of composite/metal friction stir lap welding joints via a taper-screwed pin with triple facets. J. Mater. Process. Technol. 2019, 268, 80–86. [Google Scholar] [CrossRef]
  20. Kweon, J.-H.; Jung, J.-W.; Kim, T.-H.; Choi, J.-H.; Kim, D.-H. Failure of carbon composite-to-aluminum joints with combined mechanical fastening and adhesive bonding. Compos. Struct. 2006, 75, 192–198. [Google Scholar] [CrossRef]
  21. Zhao, T.; Palardy, G.; Villegas, I.F.; Rans, C.; Martinez, M.; Benedictus, R. Mechanical behaviour of thermoplastic composites spot-welded and mechanically fastened joints: A preliminary comparison. Compos. Part B Eng. 2017, 112, 224–234. [Google Scholar] [CrossRef] [Green Version]
  22. Karakaya, N.; Papila, M.; Özkoç, G. Overmolded hybrid composites of polyamide-6 on continuous carbon and glass fiber/epoxy composites: ‘An assessment of the interface’. Compos. Part A Appl. Sci. Manuf. 2020, 131, 105771. [Google Scholar] [CrossRef]
  23. Baran, I. Warpage prediction in over-infusion process of glass/polyester composite laminates. In Proceedings of the 21st International Conference on Composite Materials 2017, Xi’an, China, 20–25 August 2017. [Google Scholar]
  24. Leone, C.; Genna, S. Effects of surface laser treatment on direct co-bonding strength of CFRP laminates. Compos. Struct. 2018, 194, 240–251. [Google Scholar] [CrossRef]
  25. Immordino, K.M.; McKnight, S.H.; Gillespie, J.W. In-Situ Evaluation of the Diffusion of Epoxy and Amine in Thermoplastic Polymers. J. Adhes. 1998, 65, 115–129. [Google Scholar] [CrossRef]
  26. Rajagopalan, G.; Immordino, K.M.; Gillespie, J.W.; McKnight, S.H. Diffusion and reaction of epoxy and amine in polysulfone studied using Fourier transform infrared spectroscopy: Experimental results. Polymer 2000, 41, 2591–2602. [Google Scholar] [CrossRef]
  27. Sonnenfeld, C.; Mendil-Jakani, H.; Agogué, R.; Nunez, P.; Beauchêne, P. Thermoplastic/thermoset multilayer composites: A way to improve the impact damage tolerance of thermosetting resin matrix composites. Compos. Struct. 2017, 171, 298–305. [Google Scholar] [CrossRef]
  28. Van Velthem, P.; Ballout, W.; Daoust, D.; Sclavons, M.; Cordenier, F.; Henry, E.; Dumont, D.; Destoop, V.; Pardoen, T.; Bailly, C. Influence of thermoplastic diffusion on morphology gradient and on delamination toughness of RTM-manufactured composites. Compos. Part A Appl. Sci. Manuf. 2015, 72, 175–183. [Google Scholar] [CrossRef]
  29. Lu, M.G.; Shim, M.J.; Kim, S.W. Curing behavior of an unsaturated polyester system analyzed by Avrami equation. Thermochim. Acta 1998, 323, 37–42. [Google Scholar] [CrossRef]
  30. Baran, I.; Akkerman, R.; Hattel, J.H. Material characterization of a polyester resin system for the pultrusion process. Compos. Part B Eng. 2014, 64, 194–201. [Google Scholar] [CrossRef]
  31. Monfared Zanjani, J.S.; Baran, I.; Akkerman, R. Characterization of interdiffusion mechanisms during co-bonding of unsaturated polyester resin to thermoplastics with different thermodynamic affinities. Polymer 2020, 209, 122991. [Google Scholar] [CrossRef]
  32. Rajagopalan, G.; Gillespie, J.W., Jr.; McKnight, S.H. Diffusion of reacting epoxy and amine monomers in polysulfone: A diffusivity model. Polymer 2000, 41, 7723–7733. [Google Scholar] [CrossRef]
  33. Voleppe, Q.; Pardoen, T.; Bailly, C. Interdiffusion and phase separation upon curing in thermoset-thermoplastic interphases unravelled by the characterization of partially cured systems. Polymer 2016, 106, 120–127. [Google Scholar] [CrossRef]
  34. Lestriez, B.; Chapel, J.-P.; Gérard, J.-F. Gradient Interphase between Reactive Epoxy and Glassy Thermoplastic from Dissolution Process, Reaction Kinetics, and Phase Separation Thermodynamics. Macromolecules 2001, 34, 1204–1213. [Google Scholar] [CrossRef]
  35. Oyama, H.T.; Solberg, T.N.; Wightman, J.P. Electron microprobe analysis as a novel technique to study the interface between thermoset and thermoplastic polymers. Polymer 1999, 40, 3001–3011. [Google Scholar] [CrossRef]
  36. Ramos, J.A.; Blanco, M.; Zalakain, I.; Mondragon, I. Nanoindentation study of interphases in epoxy/amine thermosetting systems modified with thermoplastics. J. Colloid Interface Sci. 2009, 336, 431–437. [Google Scholar] [CrossRef] [PubMed]
  37. He, S.; Petkovich, N.D.; Liu, K.; Qian, Y.; Macosko, C.W.; Stein, A. Unsaturated polyester resin toughening with very low loadings of GO derivatives. Polymer 2017, 110, 149–157. [Google Scholar] [CrossRef]
  38. Adhikari, J.; Biswas, B.; Chabri, S.; Bandyapadhyay, N.R.; Sawai, P.; Mitra, B.C.; Sinha, A. Effect of functionalized metal oxides addition on the mechanical, thermal and swelling behaviour of polyester/jute composites. Eng. Sci. Technol. Int. J. 2017, 20, 760–774. [Google Scholar] [CrossRef] [Green Version]
  39. Bee, S.-T.; Sin, L.T.; Ratnam, C.T.; Chew, W.S.; Rahmat, A.R. Enhancement effect of trimethylopropane trimethacrylate on electron beam irradiated acrylonitrile butadiene styrene (ABS). Polym. Bull. 2018, 75, 5015–5037. [Google Scholar] [CrossRef]
  40. Dunnigan, R.; Clemens, J.; Cavalli, M.N.; Kaabouch, N.; Gupta, S. Beneficial usage of recycled polymer particulates for designing novel 3D printed composites. Prog. Addit. Manuf. 2018, 3, 33–38. [Google Scholar] [CrossRef]
  41. Hsu, C.; Lee, L.J. Free-radical crosslinking copolymerization of styrene/unsaturated polyester resins: 3. Kinetics-gelation mechanism. Polymer 1993, 34, 4516–4523. [Google Scholar] [CrossRef]
  42. Amir, Z.; Said, I.M.; Jan, B.M. In situ organically cross-linked polymer gel for high-temperature reservoir conformance control: A review. Polym. Adv. Technol. 2019, 30, 13–39. [Google Scholar] [CrossRef] [Green Version]
  43. Crank, J. The Mathematics of Diffusion; Oxford University Press: Oxford, UK, 1979. [Google Scholar]
  44. Tsige, M.; Grest, G.S. Molecular dynamics simulation of solvent–polymer interdiffusion: Fickian diffusion. J. Chem. Phys. 2004, 120, 2989–2995. [Google Scholar] [CrossRef] [PubMed] [Green Version]
  45. Shaw, P.E.; Burn, P.L. Real-time fluorescence quenching-based detection of nitro-containing explosive vapours: What are the key processes? Phys. Chem. Chem. Phys. 2017, 19, 29714–29730. [Google Scholar] [CrossRef]
  46. Jagannatha, T.; Harish, G. Mechanical properties of carbon/glass fiber reinforced epoxy hybrid polymer composites. Int. J. Mech. Eng. Robot. Res. 2015, 4, 131–137. [Google Scholar]
  47. Gong, J.; Wu, J.; Guan, Z. Examination of the indentation size effect in low-load vickers hardness testing of ceramics. J. Eur. Ceram. Soc. 1999, 19, 2625–2631. [Google Scholar] [CrossRef]
  48. Zanjani, J.S.M.; Saner Okan, B.; Menceloglu, Y.Z.; Yildiz, M. Design and fabrication of multi-walled hollow nanofibers by triaxial electrospinning as reinforcing agents in nanocomposites. J. Reinf. Plast. Compos. 2015, 34, 1273–1286. [Google Scholar] [CrossRef]
  49. Sperling, L.H. Introduction to Physical Polymer Science; John Wiley & Sons: Hoboken, NJ, USA, 2005. [Google Scholar]
  50. Christensen, H.; Sehested, K.; Corfitzen, H. Reactions of hydroxyl radicals with hydrogen peroxide at ambient and elevated temperatures. J. Phys. Chem. 1982, 86, 1588–1590. [Google Scholar] [CrossRef]
  51. Dumont, D.; Seveno, D.; De Coninck, J.; Bailly, C.; Devaux, J.; Daoust, D. Interdiffusion of thermoplastics and epoxy resin precursors: Investigations using experimental and molecular dynamics methods. Polym. Int. 2012, 61, 1263–1271. [Google Scholar] [CrossRef]
  52. Rajagopalan, G.; Narayanan, C.; Gillespie, J.W.; McKnight, S.H. Diffusion and reaction of epoxy and amine in polysulfone-transport modeling and experimental validation. Polymer 2000, 41, 8543–8556. [Google Scholar] [CrossRef]
  53. Wolf, C.J.; Grayson, M.A. Solubility, diffusion and swelling of fluids in thermoplastic resin systems. Polymer 1993, 34, 746–751. [Google Scholar] [CrossRef]
  54. Reis, R.; Vladimir Oliveira, J.; Nobrega, R. Diffusion coefficients in polymer-solvent systems for highly concentrated polymer solutions. Braz. J. Chem. Eng. 2001, 18, 367–384. [Google Scholar] [CrossRef]
  55. Chenyakin, Y.; Ullmann, D.A.; Evoy, E.; Renbaum-Wolff, L.; Kamal, S.; Bertram, A.K. Diffusion coefficients of organic molecules in sucrose–water solutions and comparison with Stokes–Einstein predictions. Atmos. Chem. Phys. 2017, 17, 2423–2435. [Google Scholar] [CrossRef] [Green Version]
Figure 1. Schematic view of the interphase region in the acrylonitrile butadiene styrene-unsaturated polyester resin (ABS-UPR) co-bonded specimen [31].
Materials 14 00291 g001
Figure 2. (a) Schematic view of the rheometer setup for the swelling experiments by placing UPR on ABS surface, and (b) measurement direction in confocal microscopy.
Materials 14 00291 g002
Figure 3. Schematic view of the 1D diffusion of UPR into ABS (left). The resulting concentration distribution (right).
Materials 14 00291 g003
Figure 4. Vickers microhardness measurement pattern and sample configuration.
Materials 14 00291 g004
Figure 5. Micrographs showing the interphase formation between ABS and UPR at different temperatures.
Materials 14 00291 g005
Figure 6. Overall view of the interphase formed between ABS and UPR at 25 °C.
Materials 14 00291 g006
Figure 7. Confocal microscopy measurement of surface swelling of ABS in contact with UPR.
Materials 14 00291 g007
Figure 8. Interphase thickness formation between ABS and UPR for different processing temperatures.
Materials 14 00291 g008
Figure 9. (a) change in gel time vs. temperature, (b) ln(1/tG) vs. 1000/T and fitted line based on Equation (16), and (c) viscosity change as a function of temperature for UPR.
Materials 14 00291 g009
Figure 10. (a) Diffusivity vs temperature for UPR-ABS in comparison to material pairs from literature, (b) interphase thickness change by temperature through fitted inverse model, and (c) viscosity dependency of the diffusivity for UPR-ABS.
Materials 14 00291 g010
Figure 11. (a) Resin uptake vs. time for ABS, and (b) Ln(M*) vs. Ln(t) based on Equations (7) and (8).
Materials 14 00291 g011
Figure 12. Line fitting on (a) n and (b) k changes by temperature to obtain predictive models based on Equations (9) and (10).
Materials 14 00291 g012
Figure 13. (a) Vickers microhardness values at the interphase vicinity for UPR-ABS interphase, and (b) correlation between interphase hardness and resin volume fraction.
Materials 14 00291 g013
Table 1. Empirical rate constant (k), and transport exponent (n) for ABS-UPR at different temperatures.
Temperature (°C)2535405060
n0.70020.57170.55380.52540.5251
k (gr/mm2·sn)3.86 × 10−71.88 × 10−62.62 × 10−64.12 × 10−65.25 × 10⁻⁶
Table 2. Volume fraction of UPR (φ) at the ABS/ UPR interphase obtained from Equation (14).
Temperature (°C)2535405060
φ 0.400.340.260.210.20
Publisher’s Note: MDPI stays neutral with regard to jurisdictional claims in published maps and institutional affiliations.

