
Structural Lattice Topology and Material Optimization for Battery Protection in Electric Vehicles Subjected to Ground Impact Using Artificial Neural Networks and Genetic Algorithms

Abstract
:1. Introduction
2. Design and Finite-Element Modeling
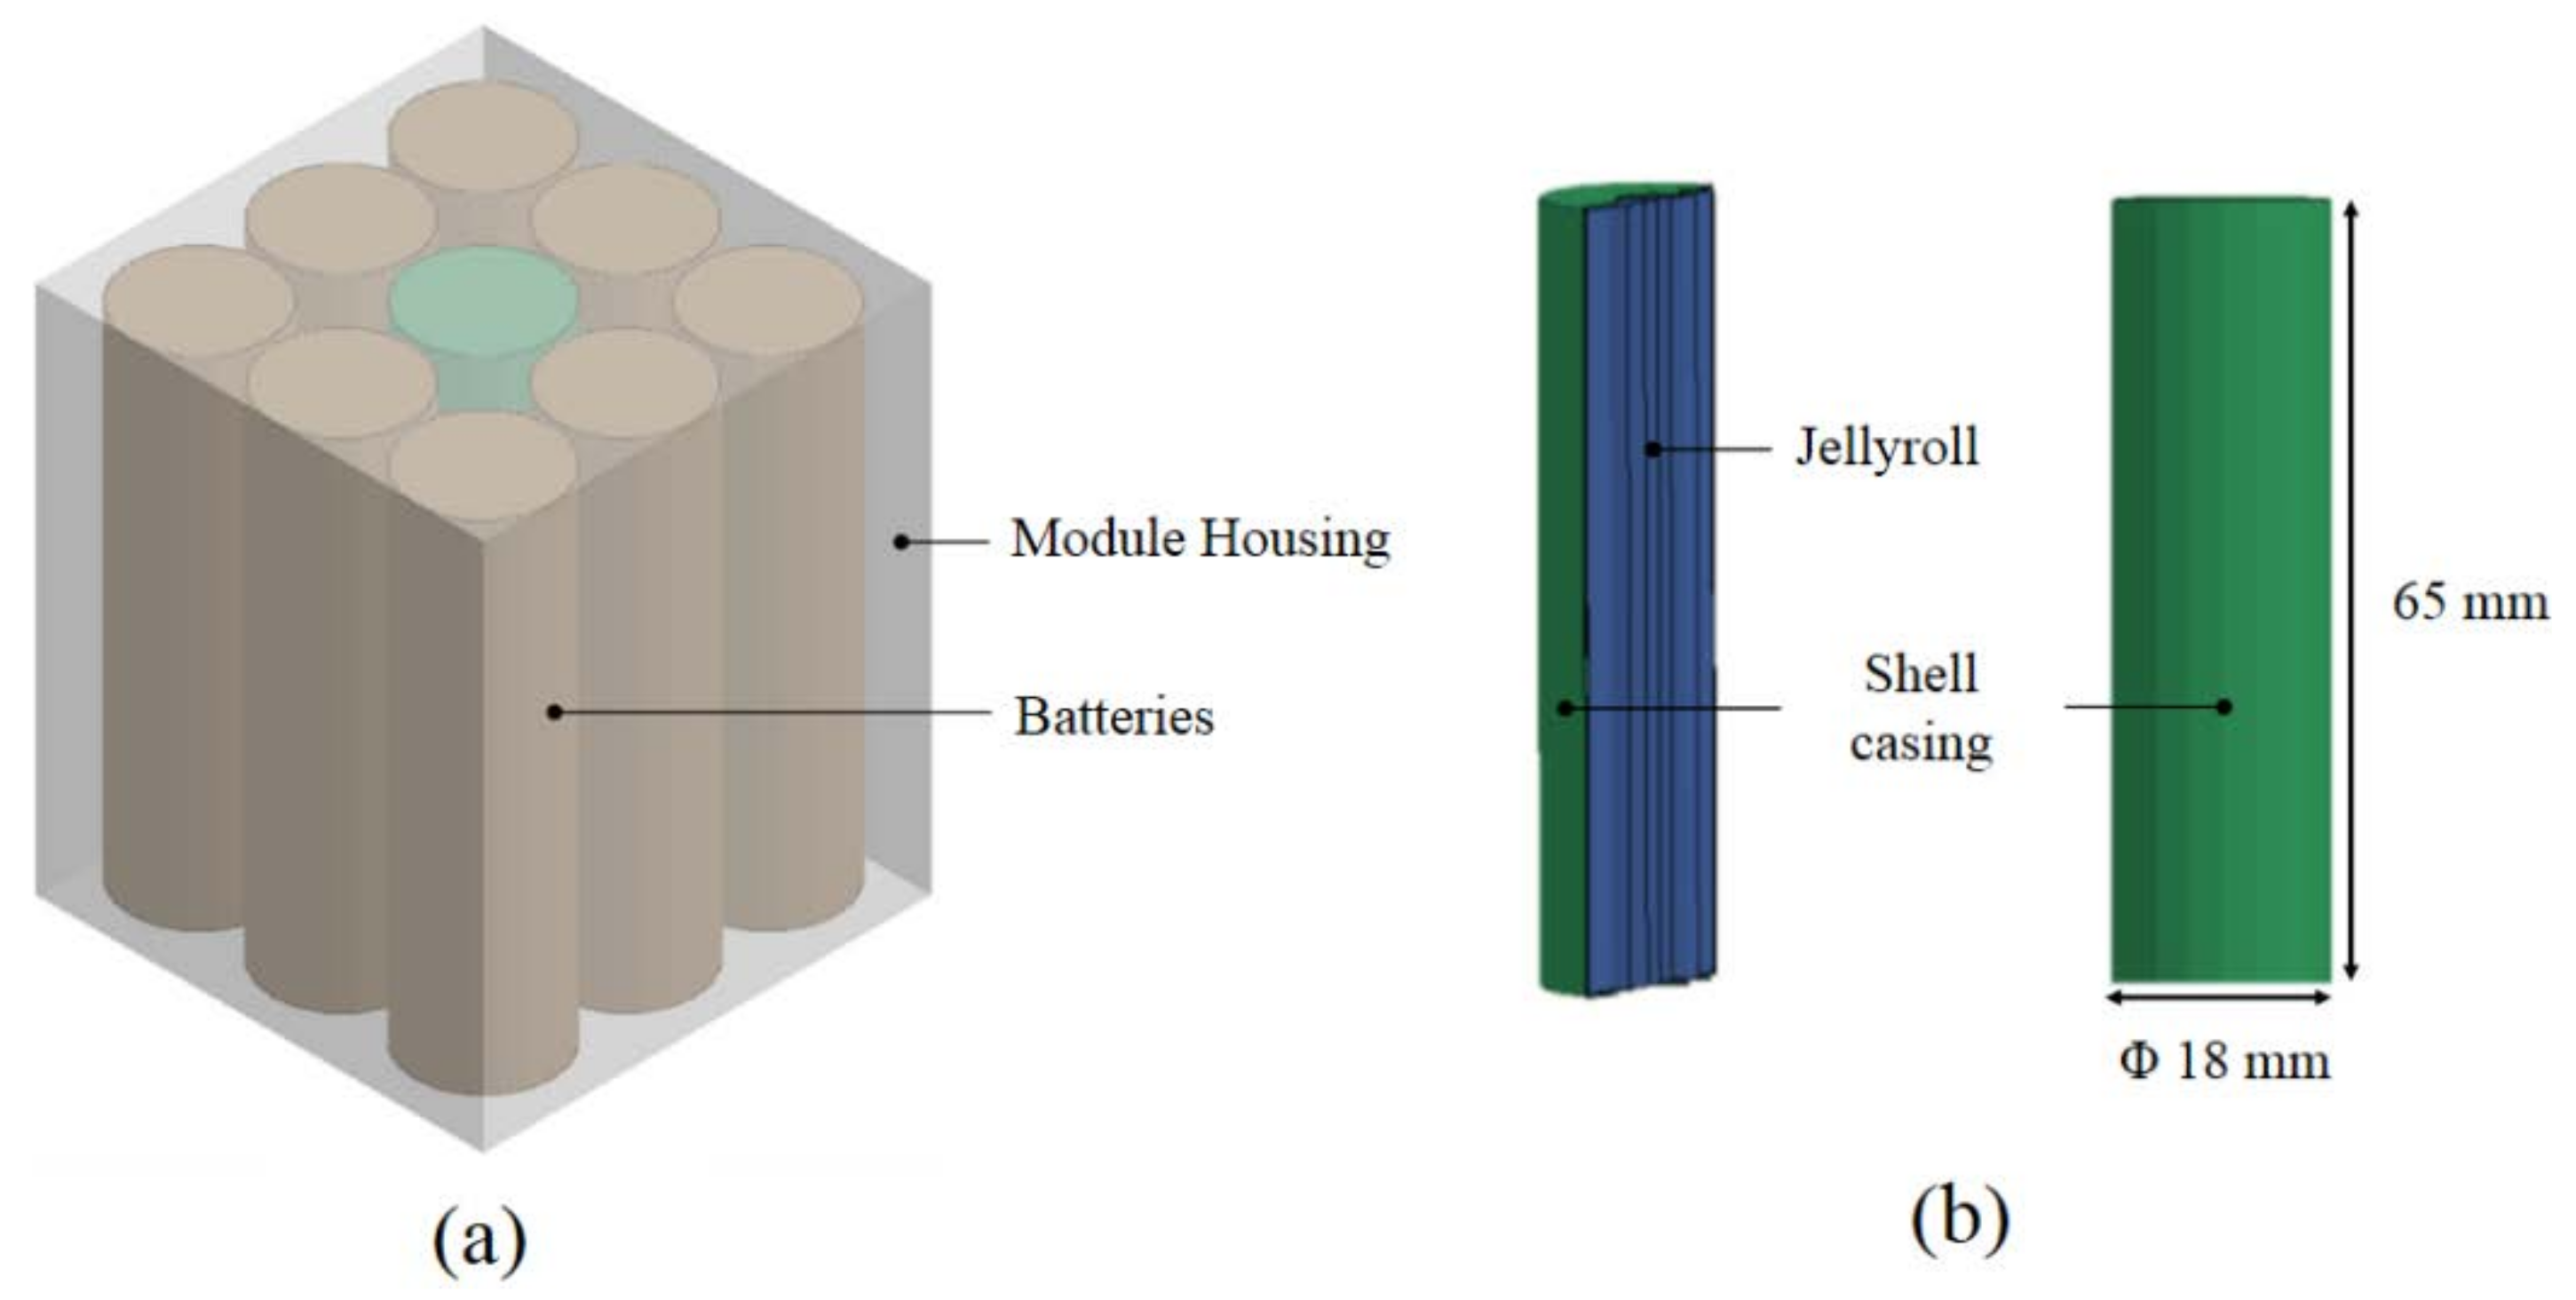
2.1. Battery Model
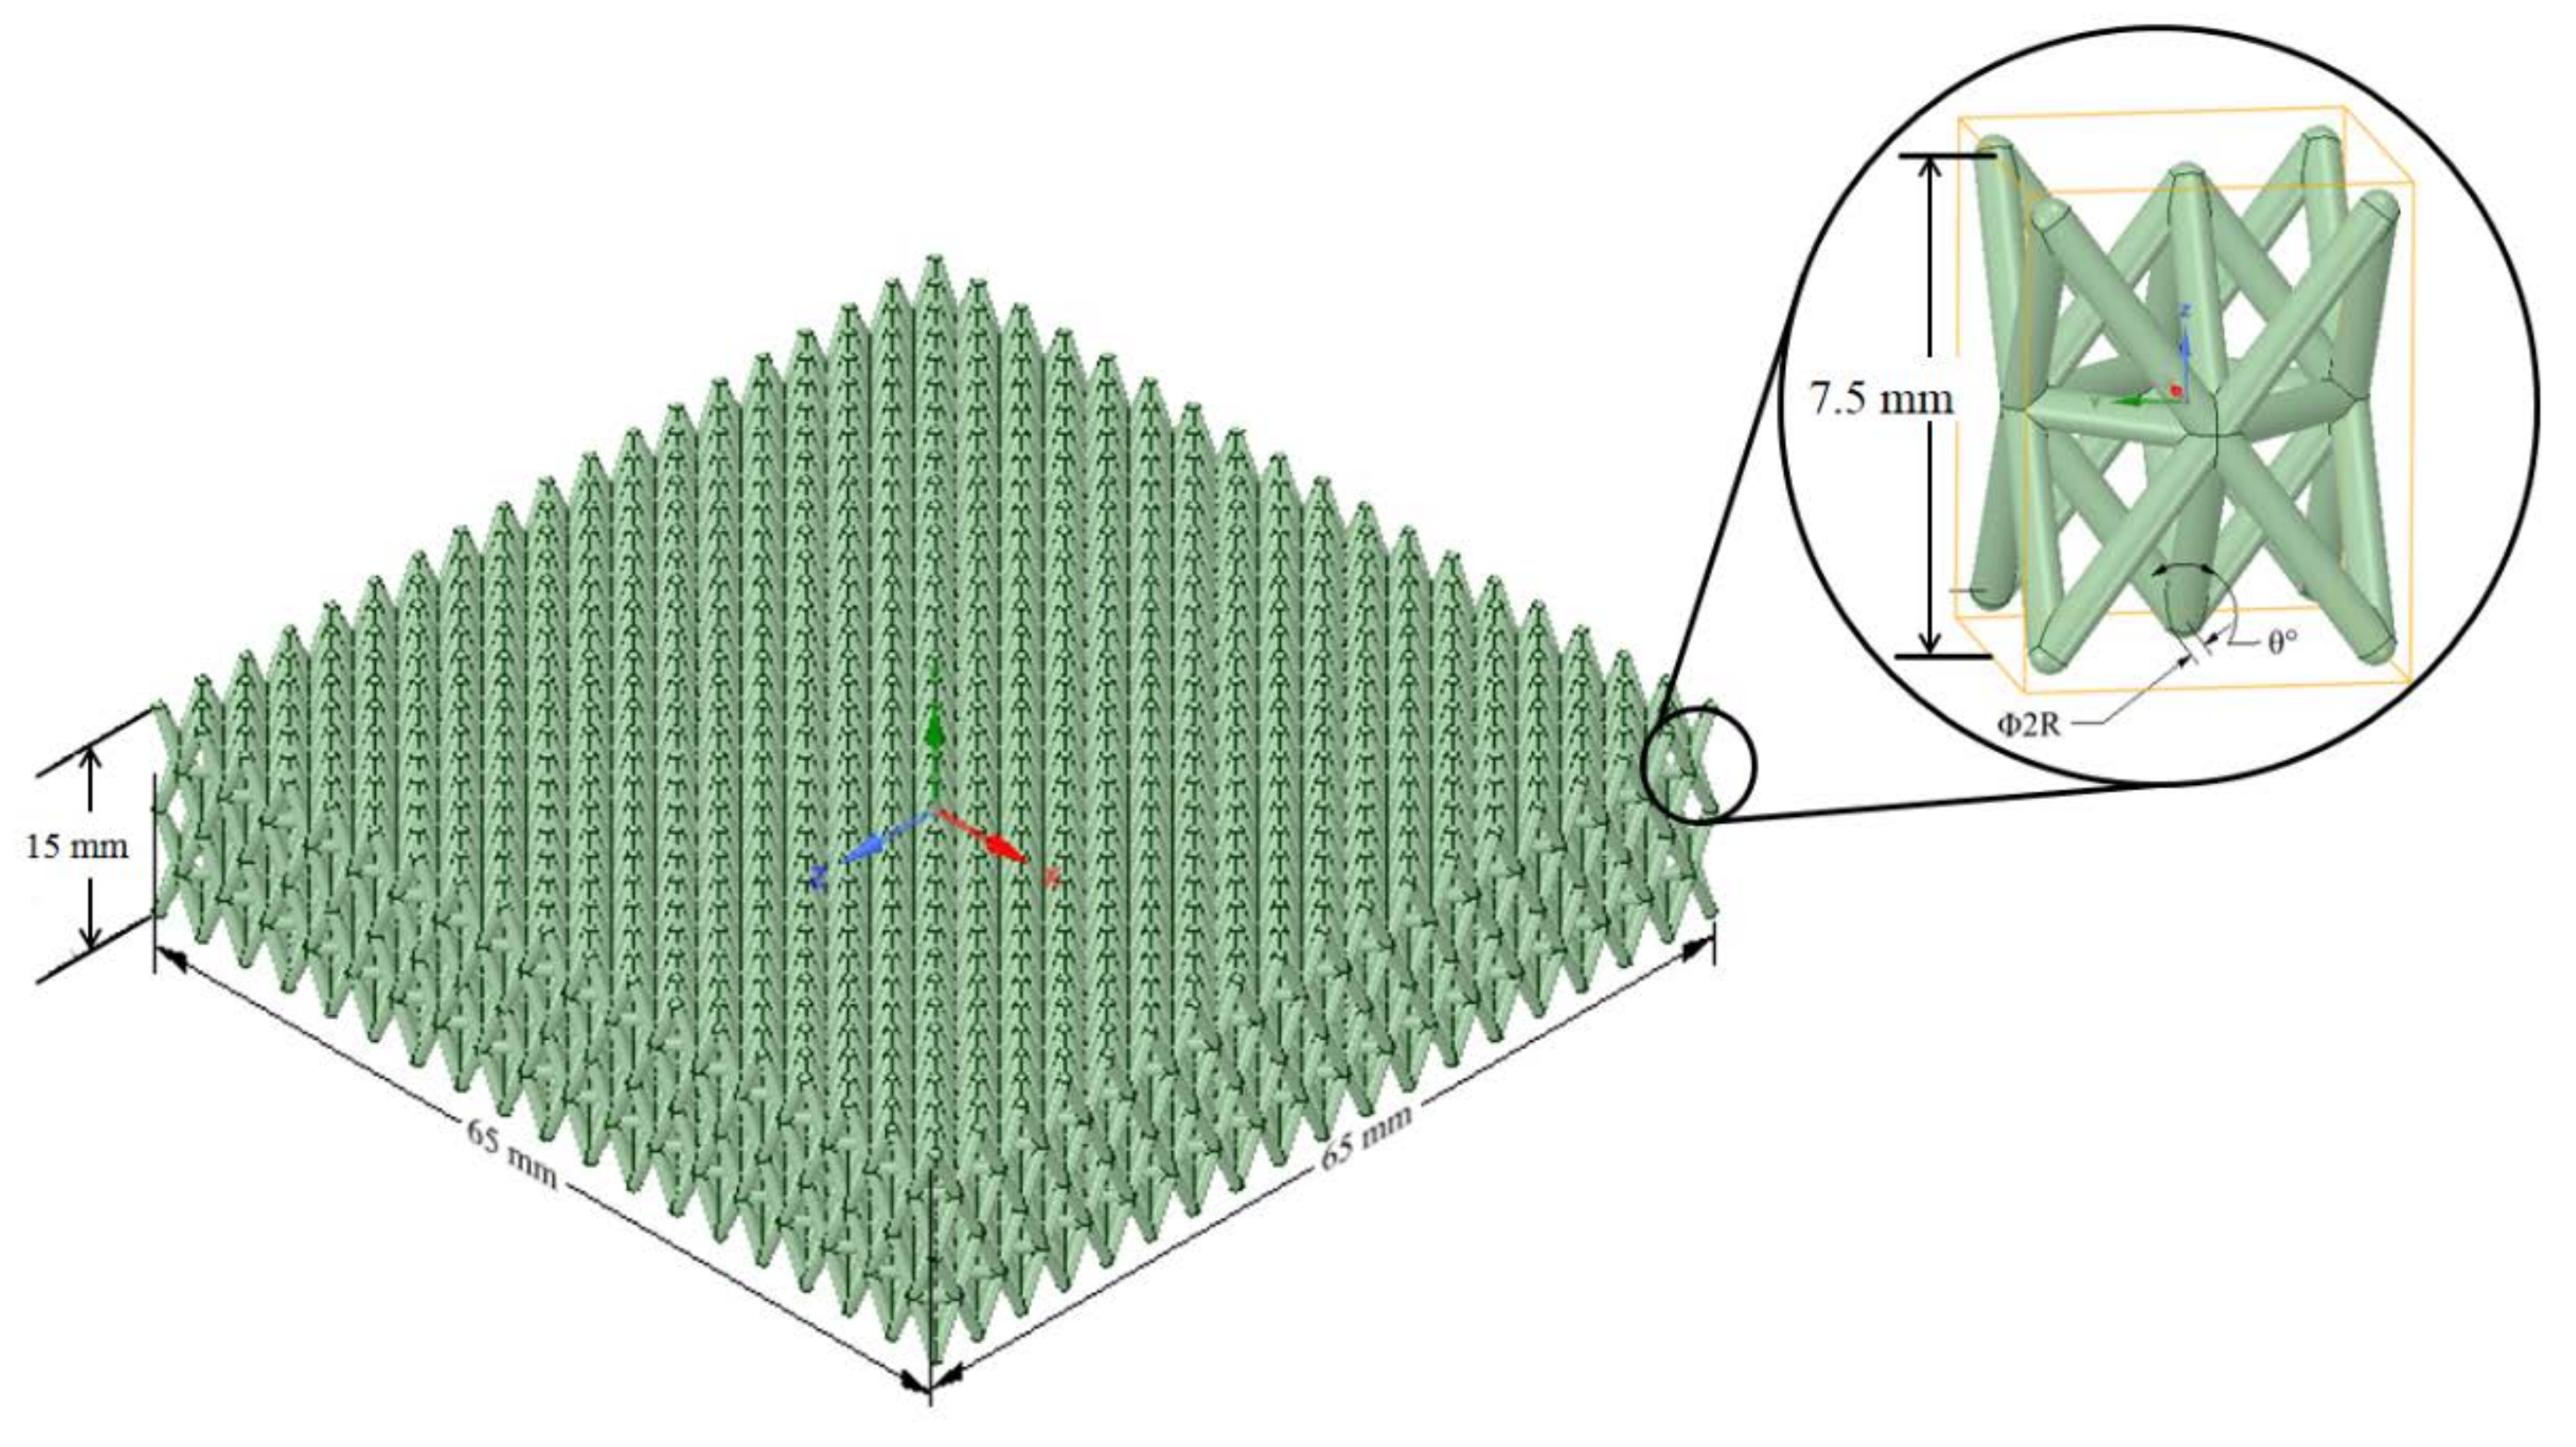
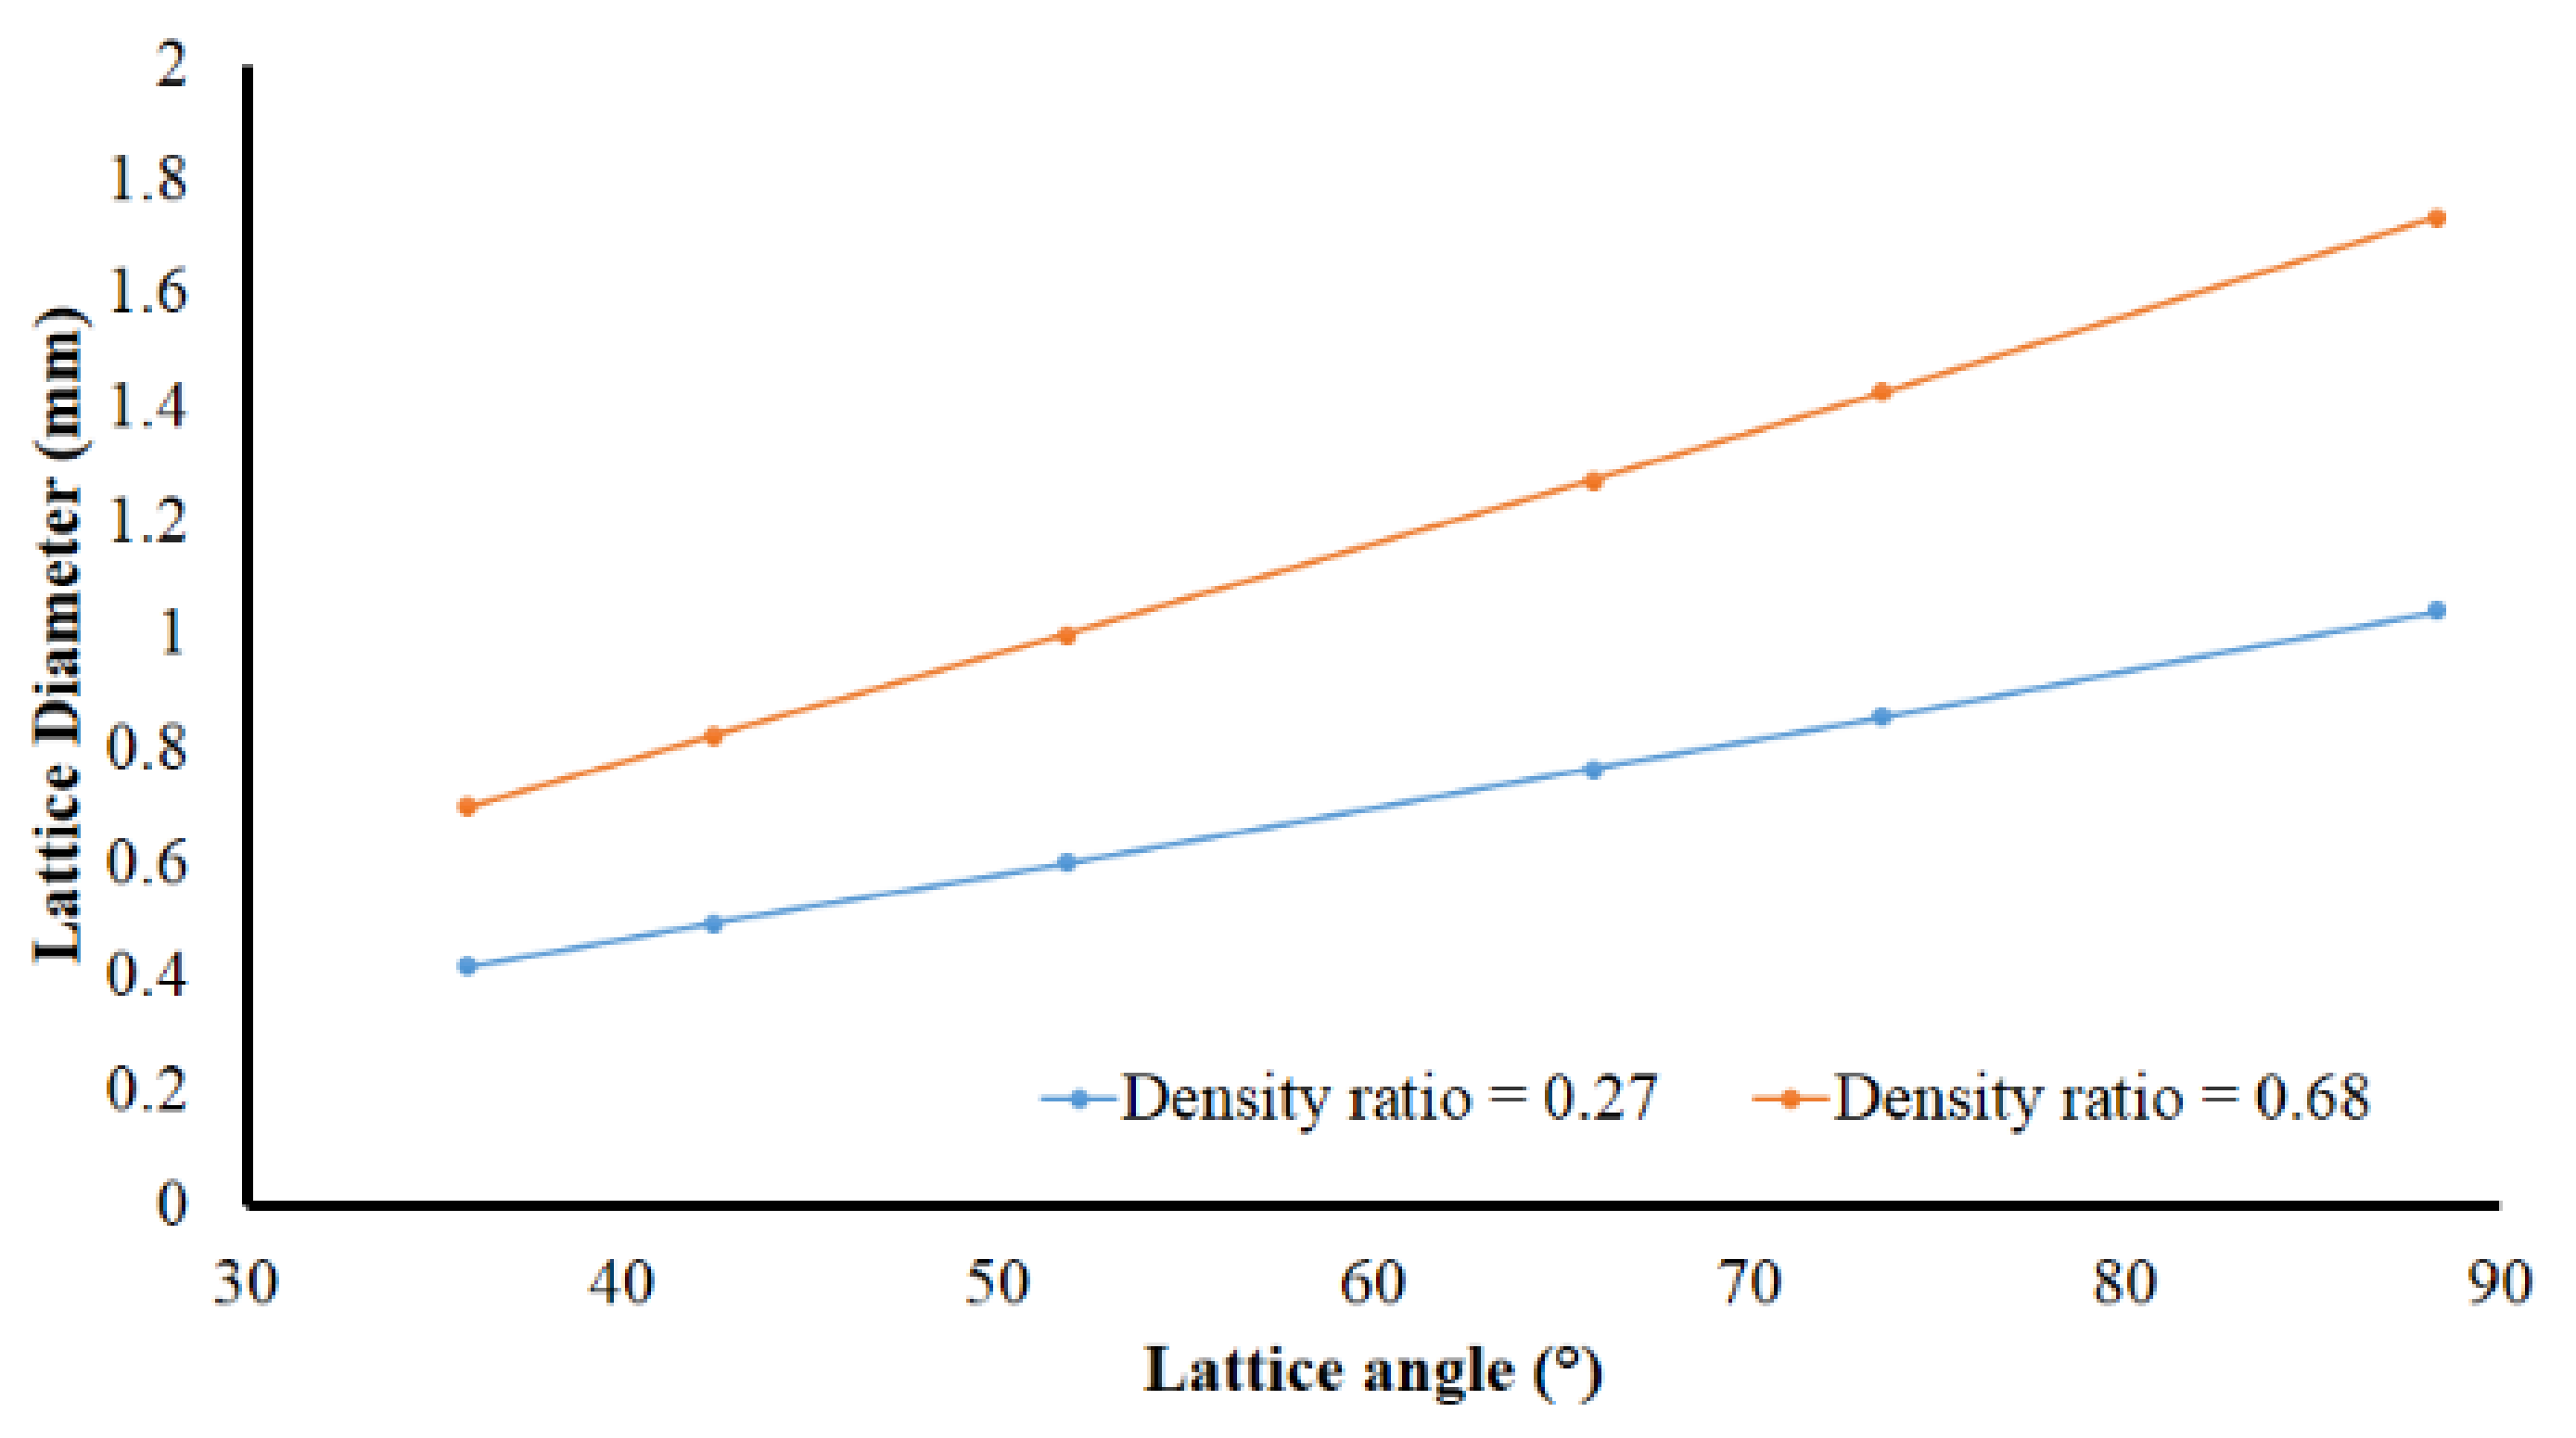
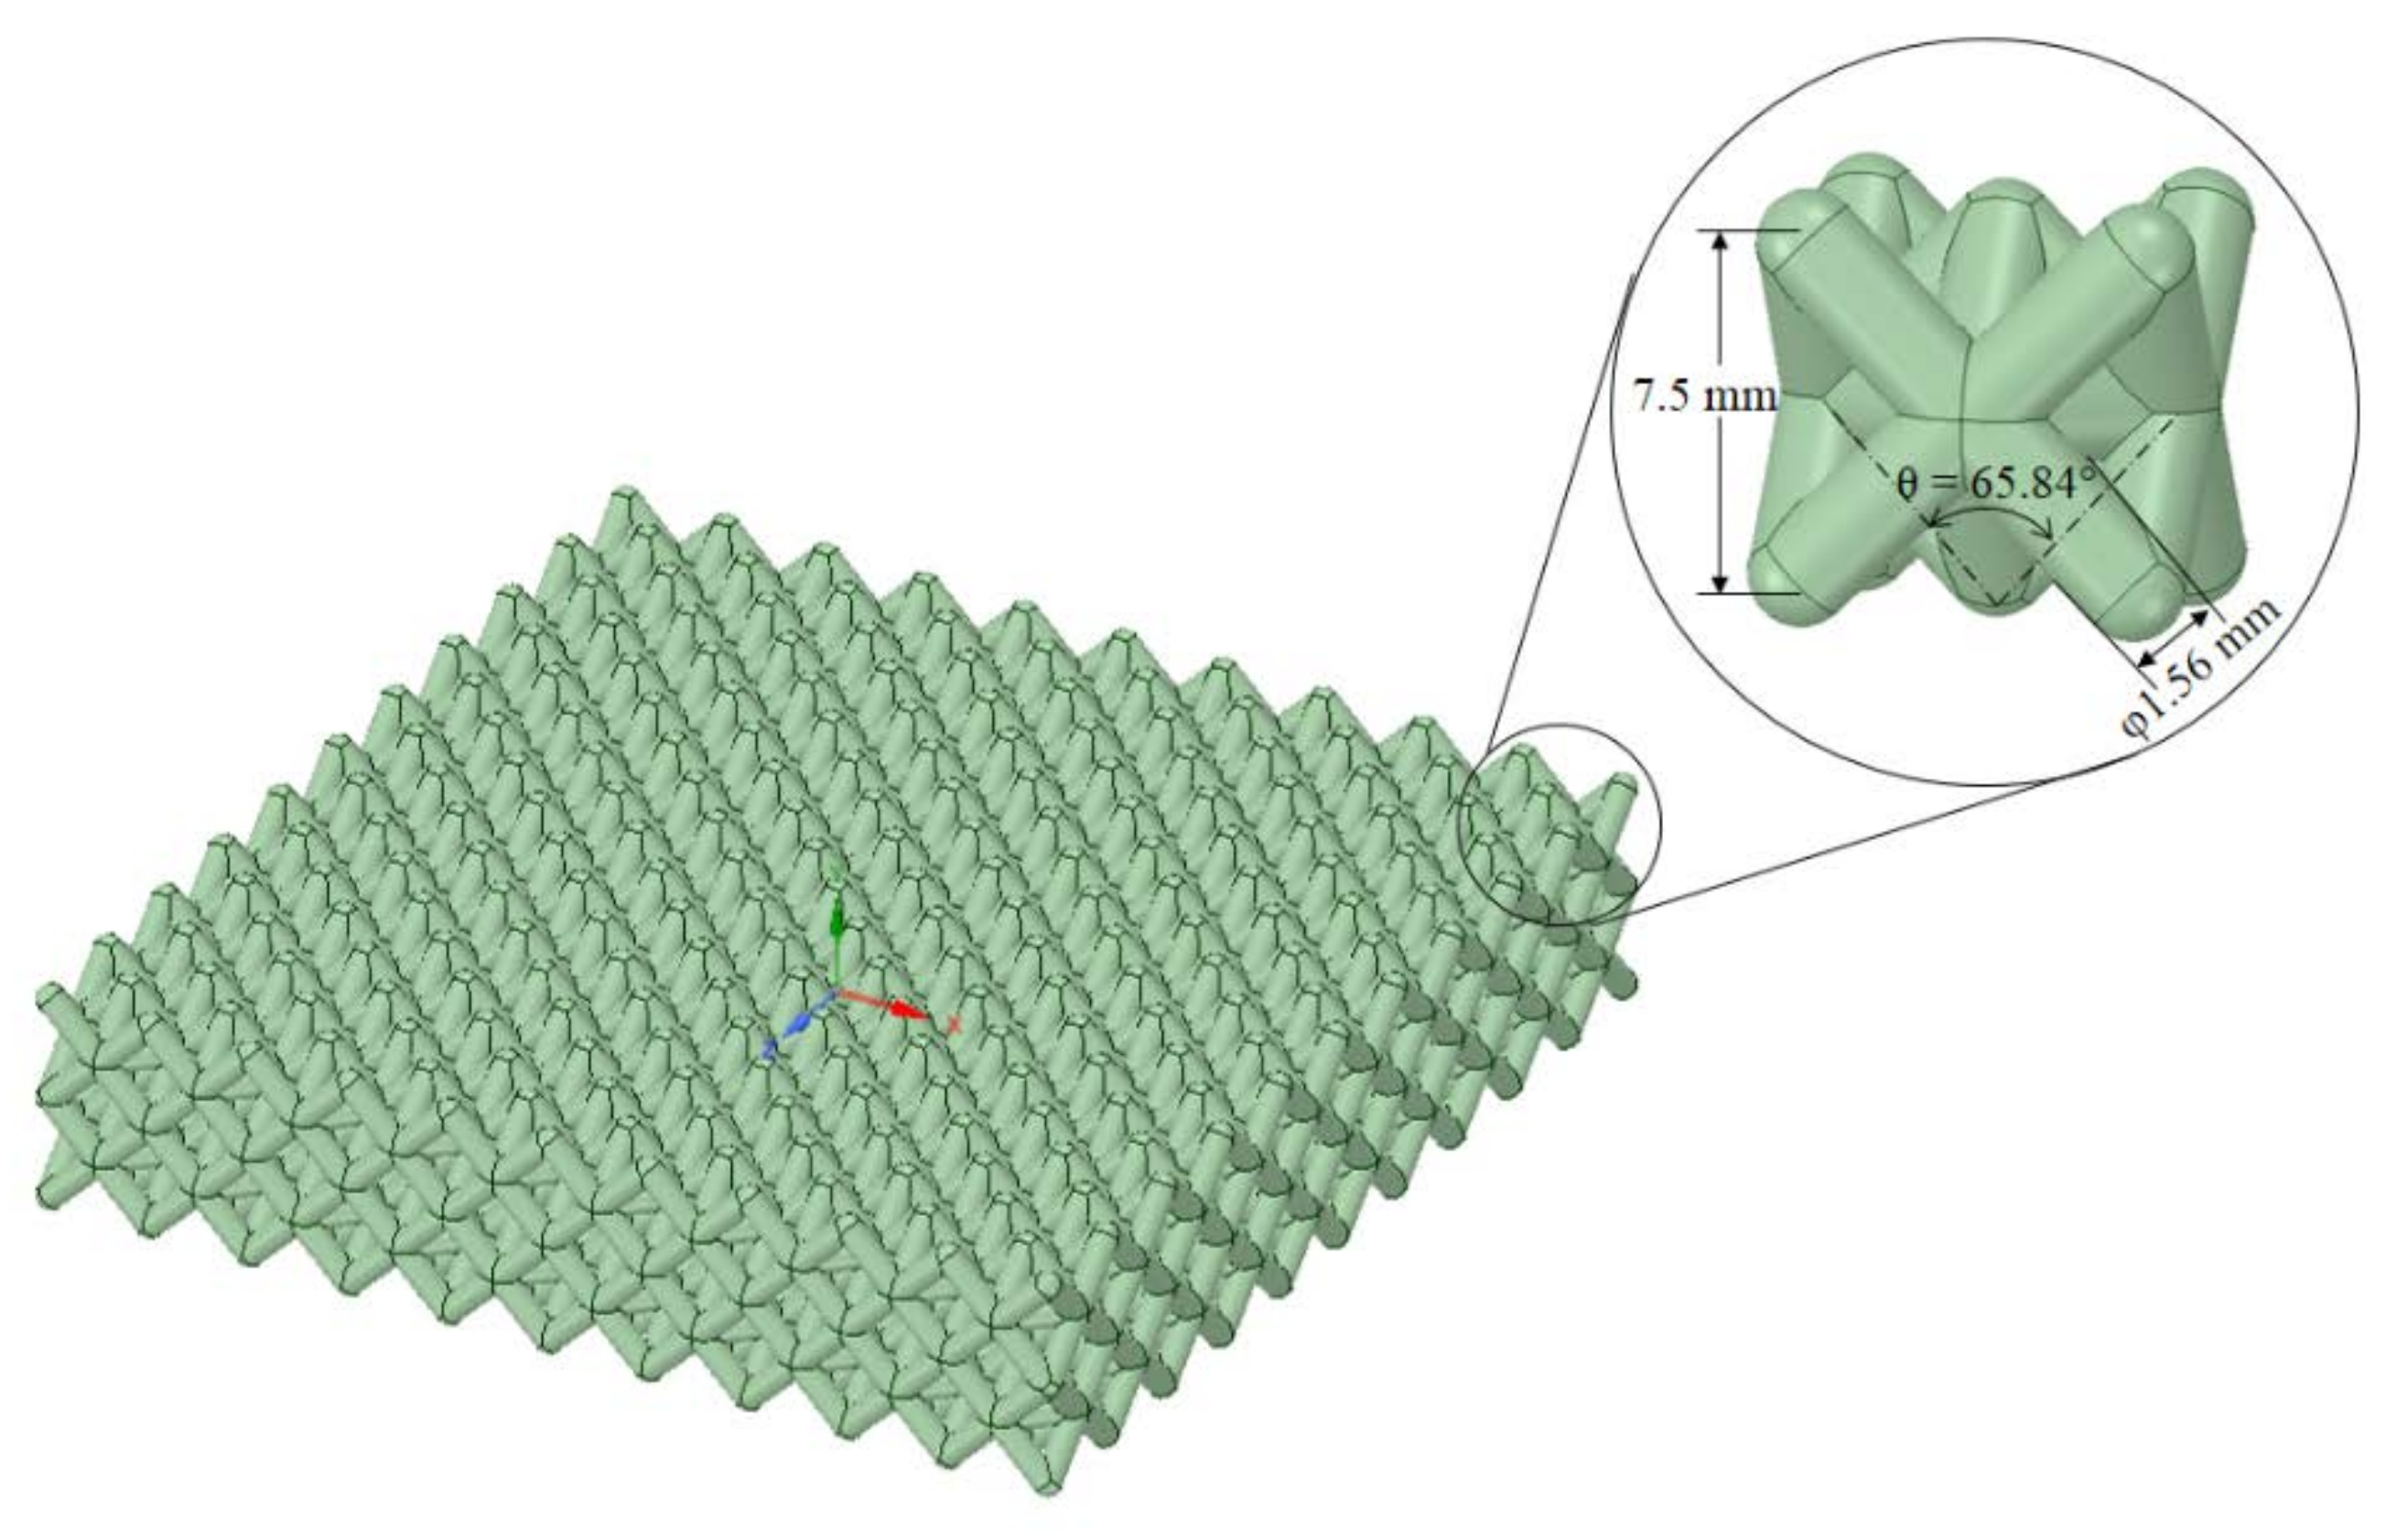
2.2. Lattice Design
2.3. Modeling Process
2.3.1. Loading and Boundary Conditions
2.3.2. Material Model
3. Lattice Optimization
3.1. Problem Description
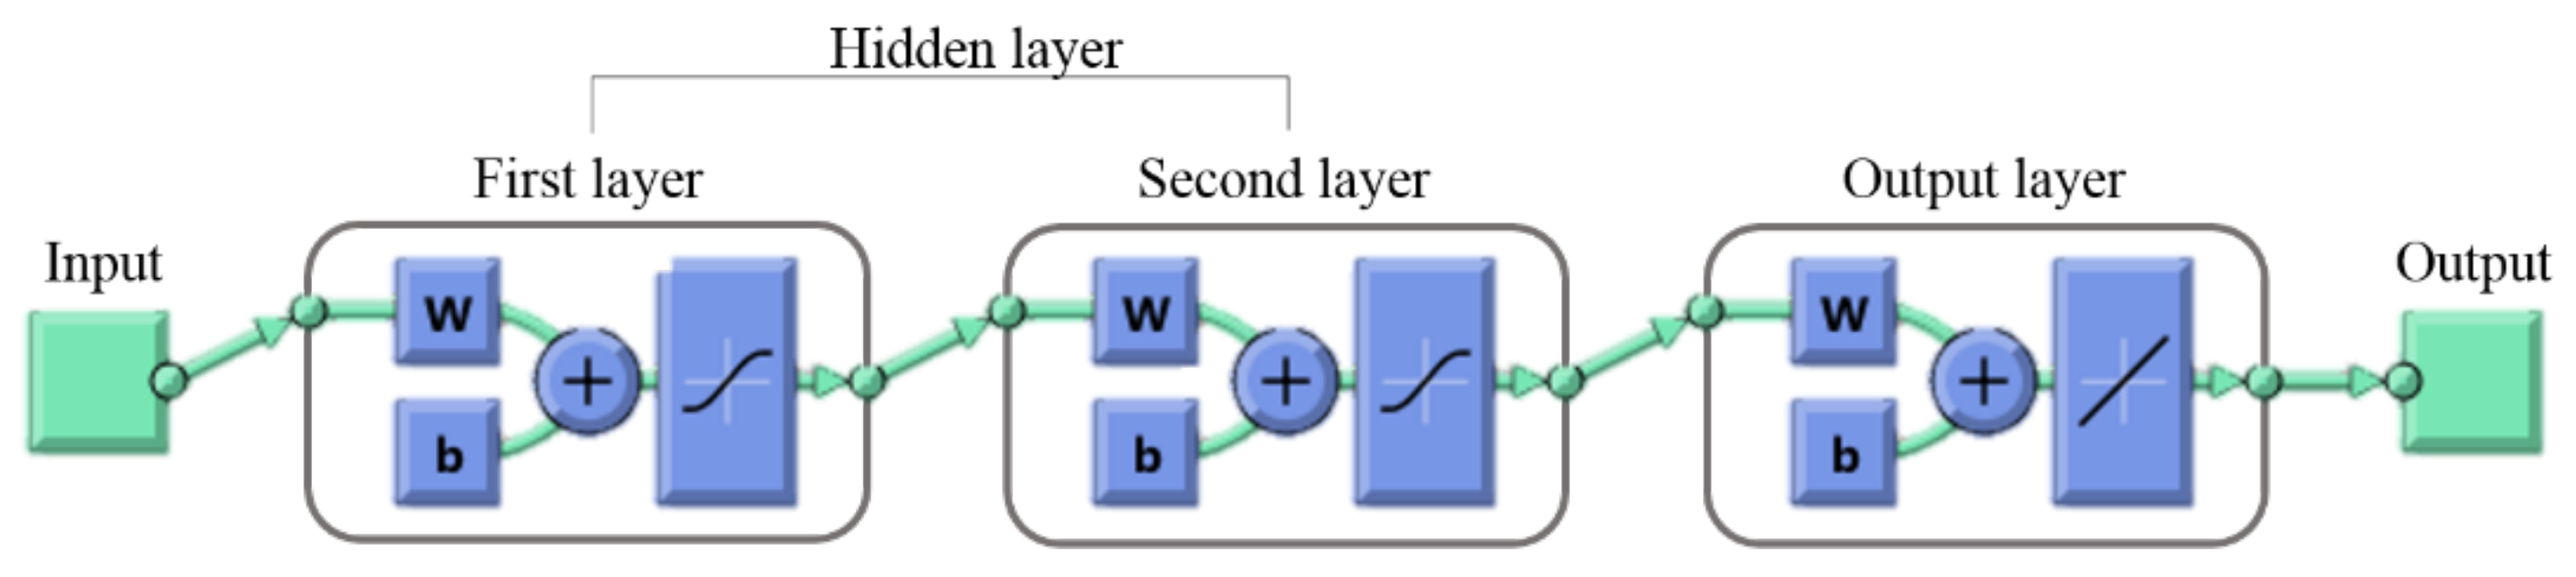
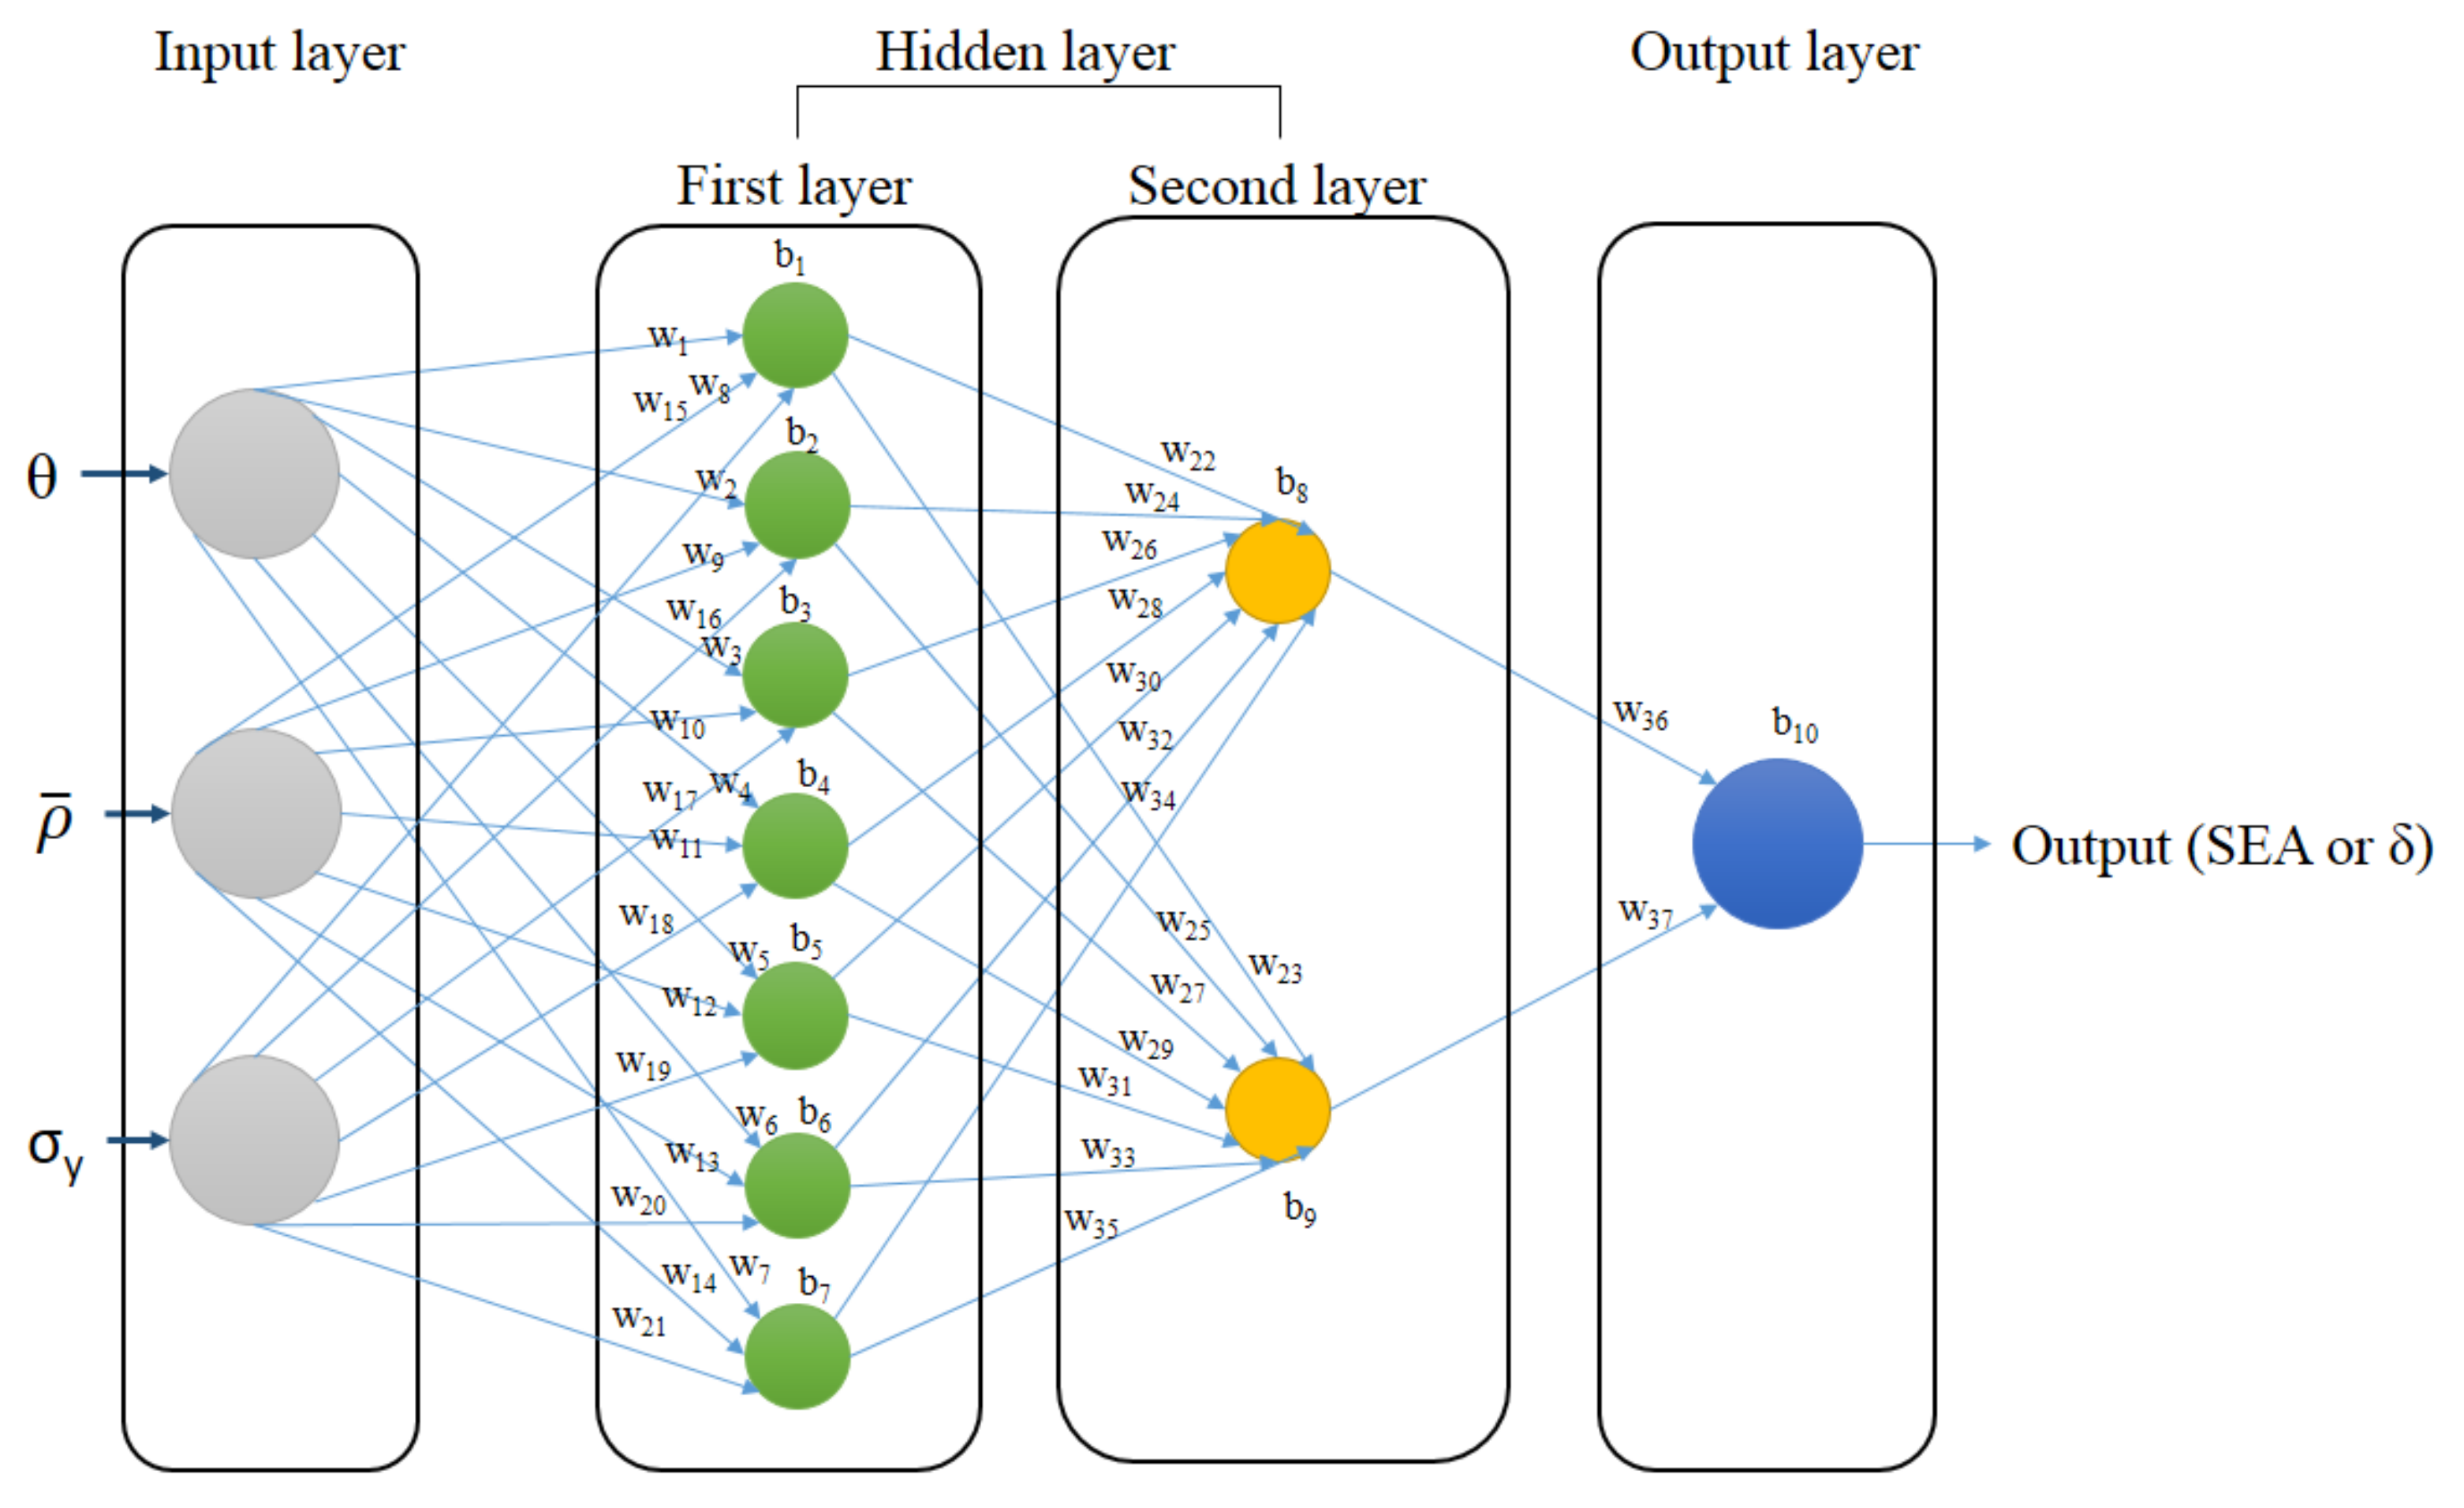
3.2. Artificial Neural Network
3.3. Multi-Objective Optimization
- WSEA = 0.4 and Wδ = 0.6
- WSEA = 0.3 and Wδ = 0.7
- WSEA = 0.2 and Wδ = 0.8
- WSEA = 0.1 and Wδ = 0.9
4. Results and Discussions
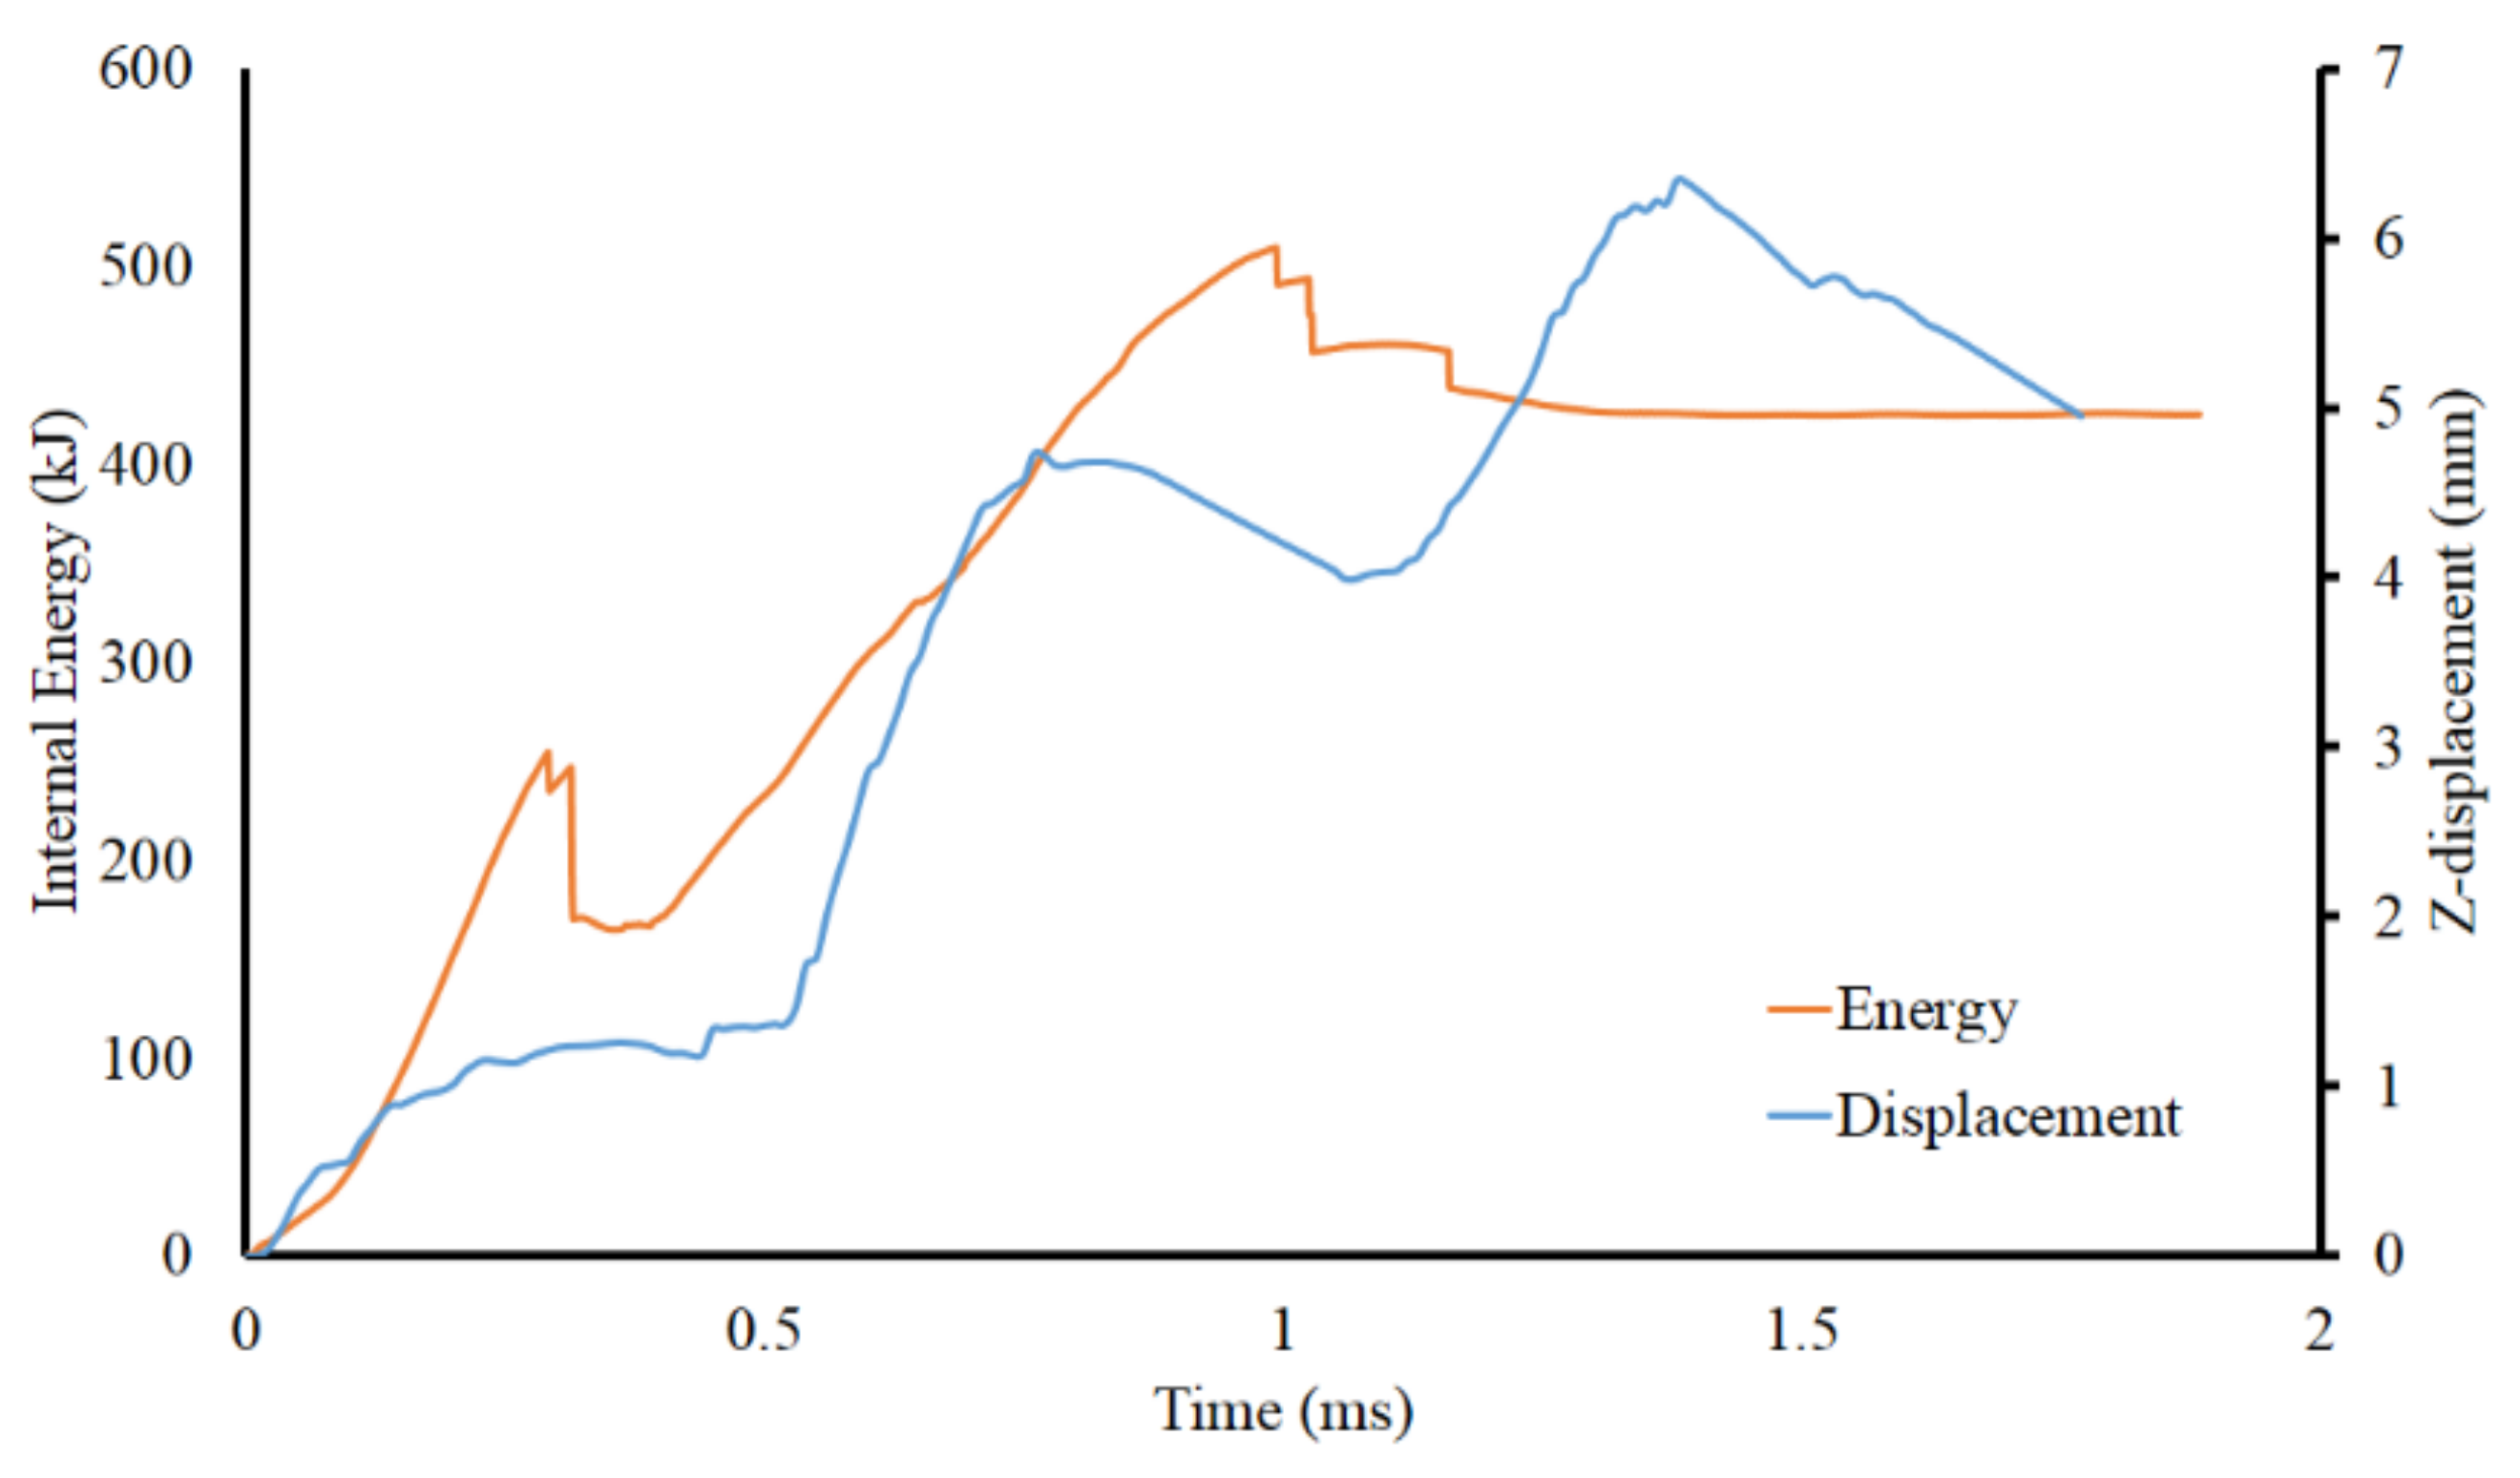
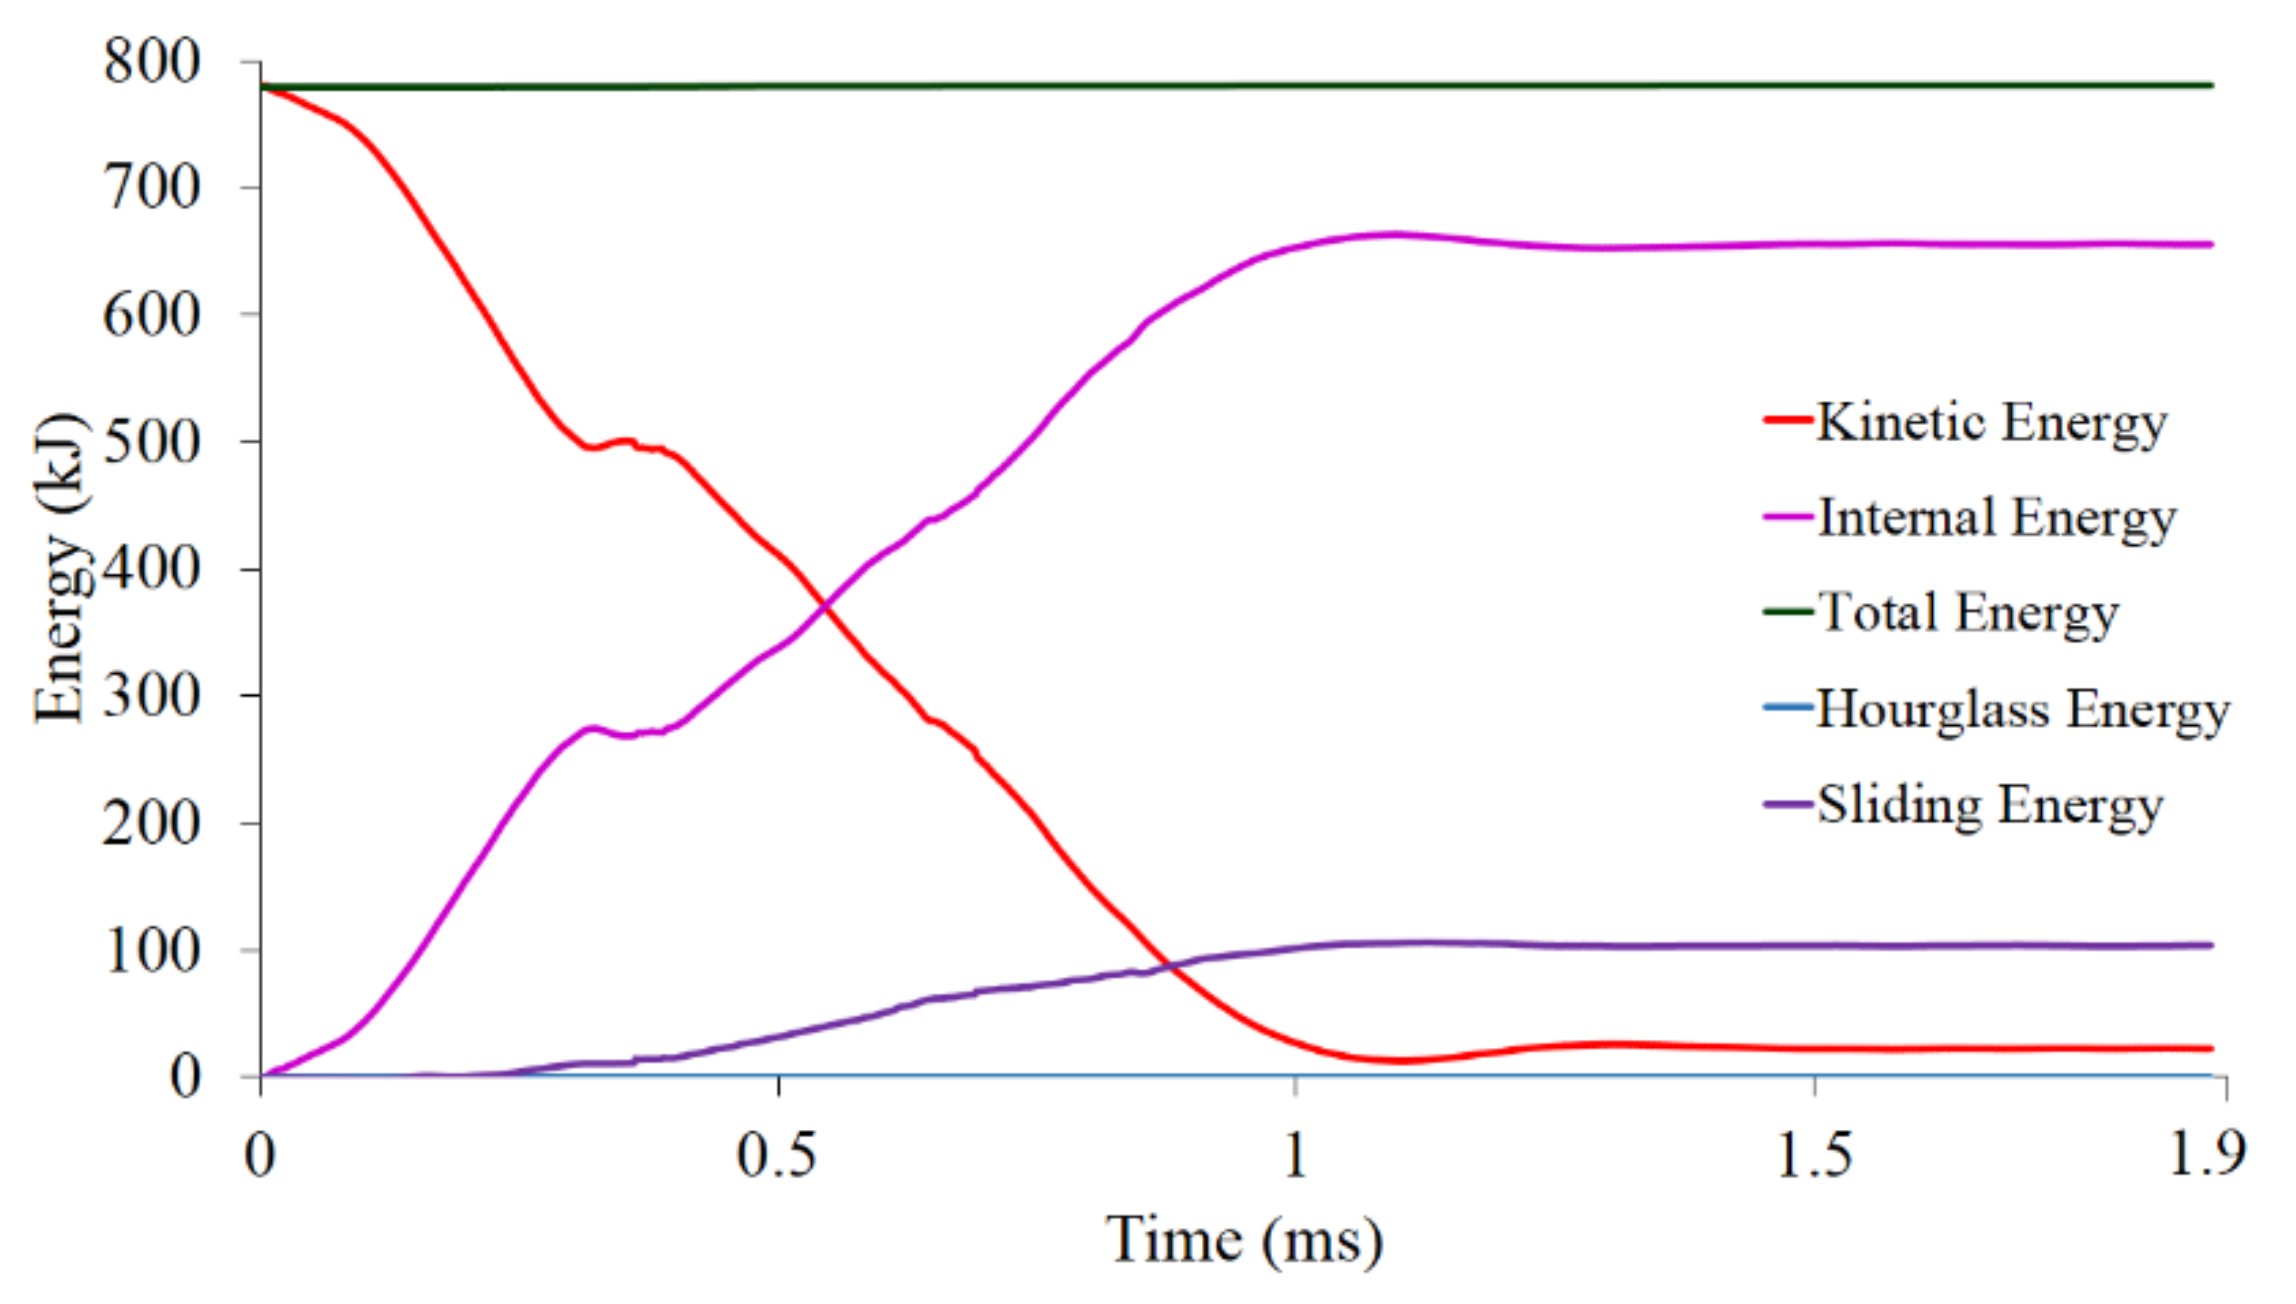
4.1. Numerical Model Analysis
4.2. Model Validation
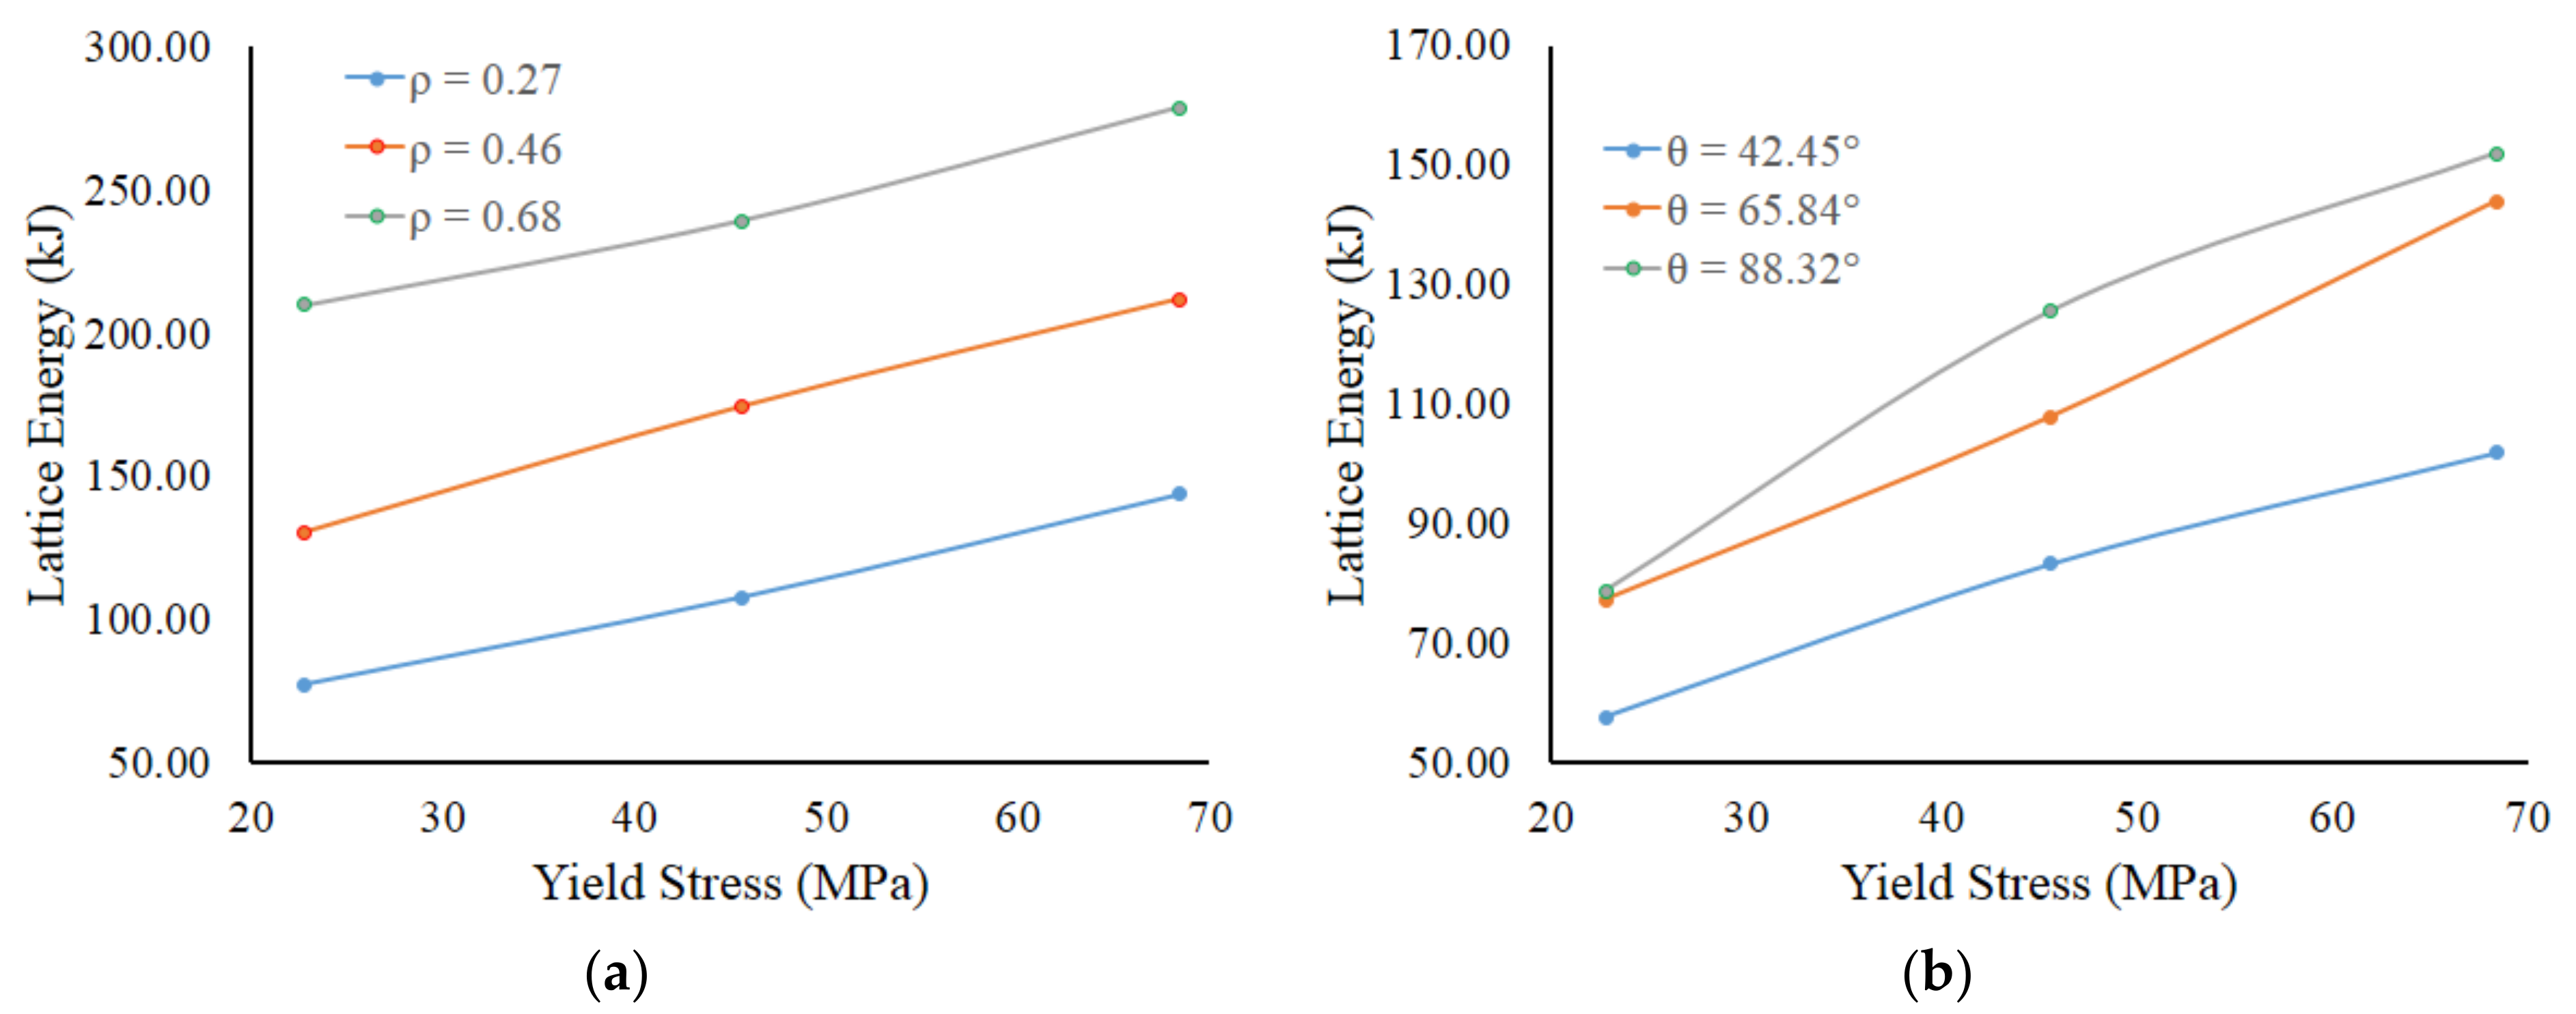
4.3. Simulation Results
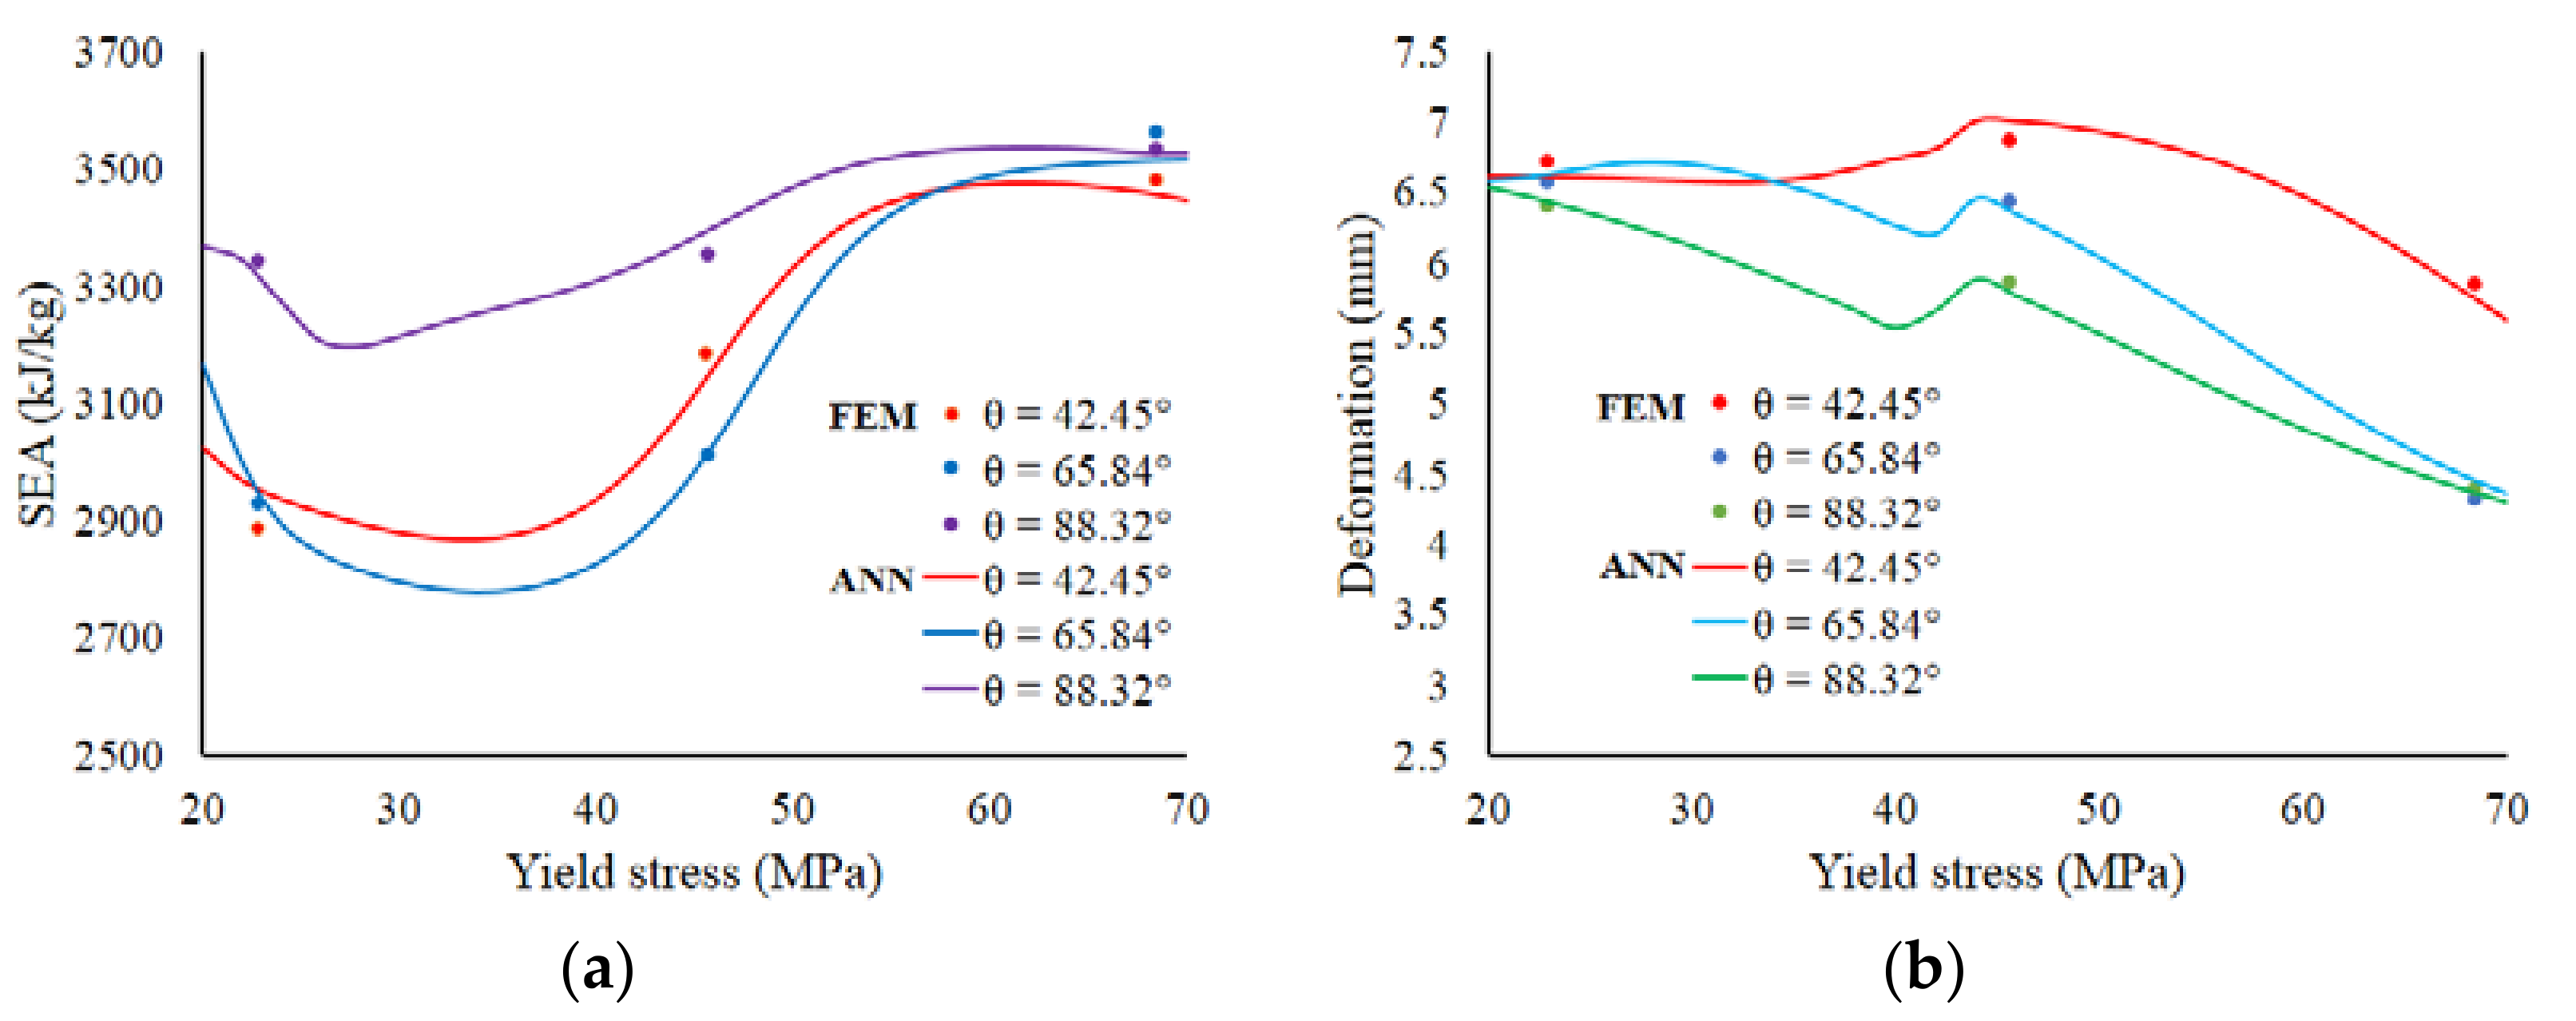
4.4. Predictive Modeling Using ANN-GA
4.5. Crushing Behavior
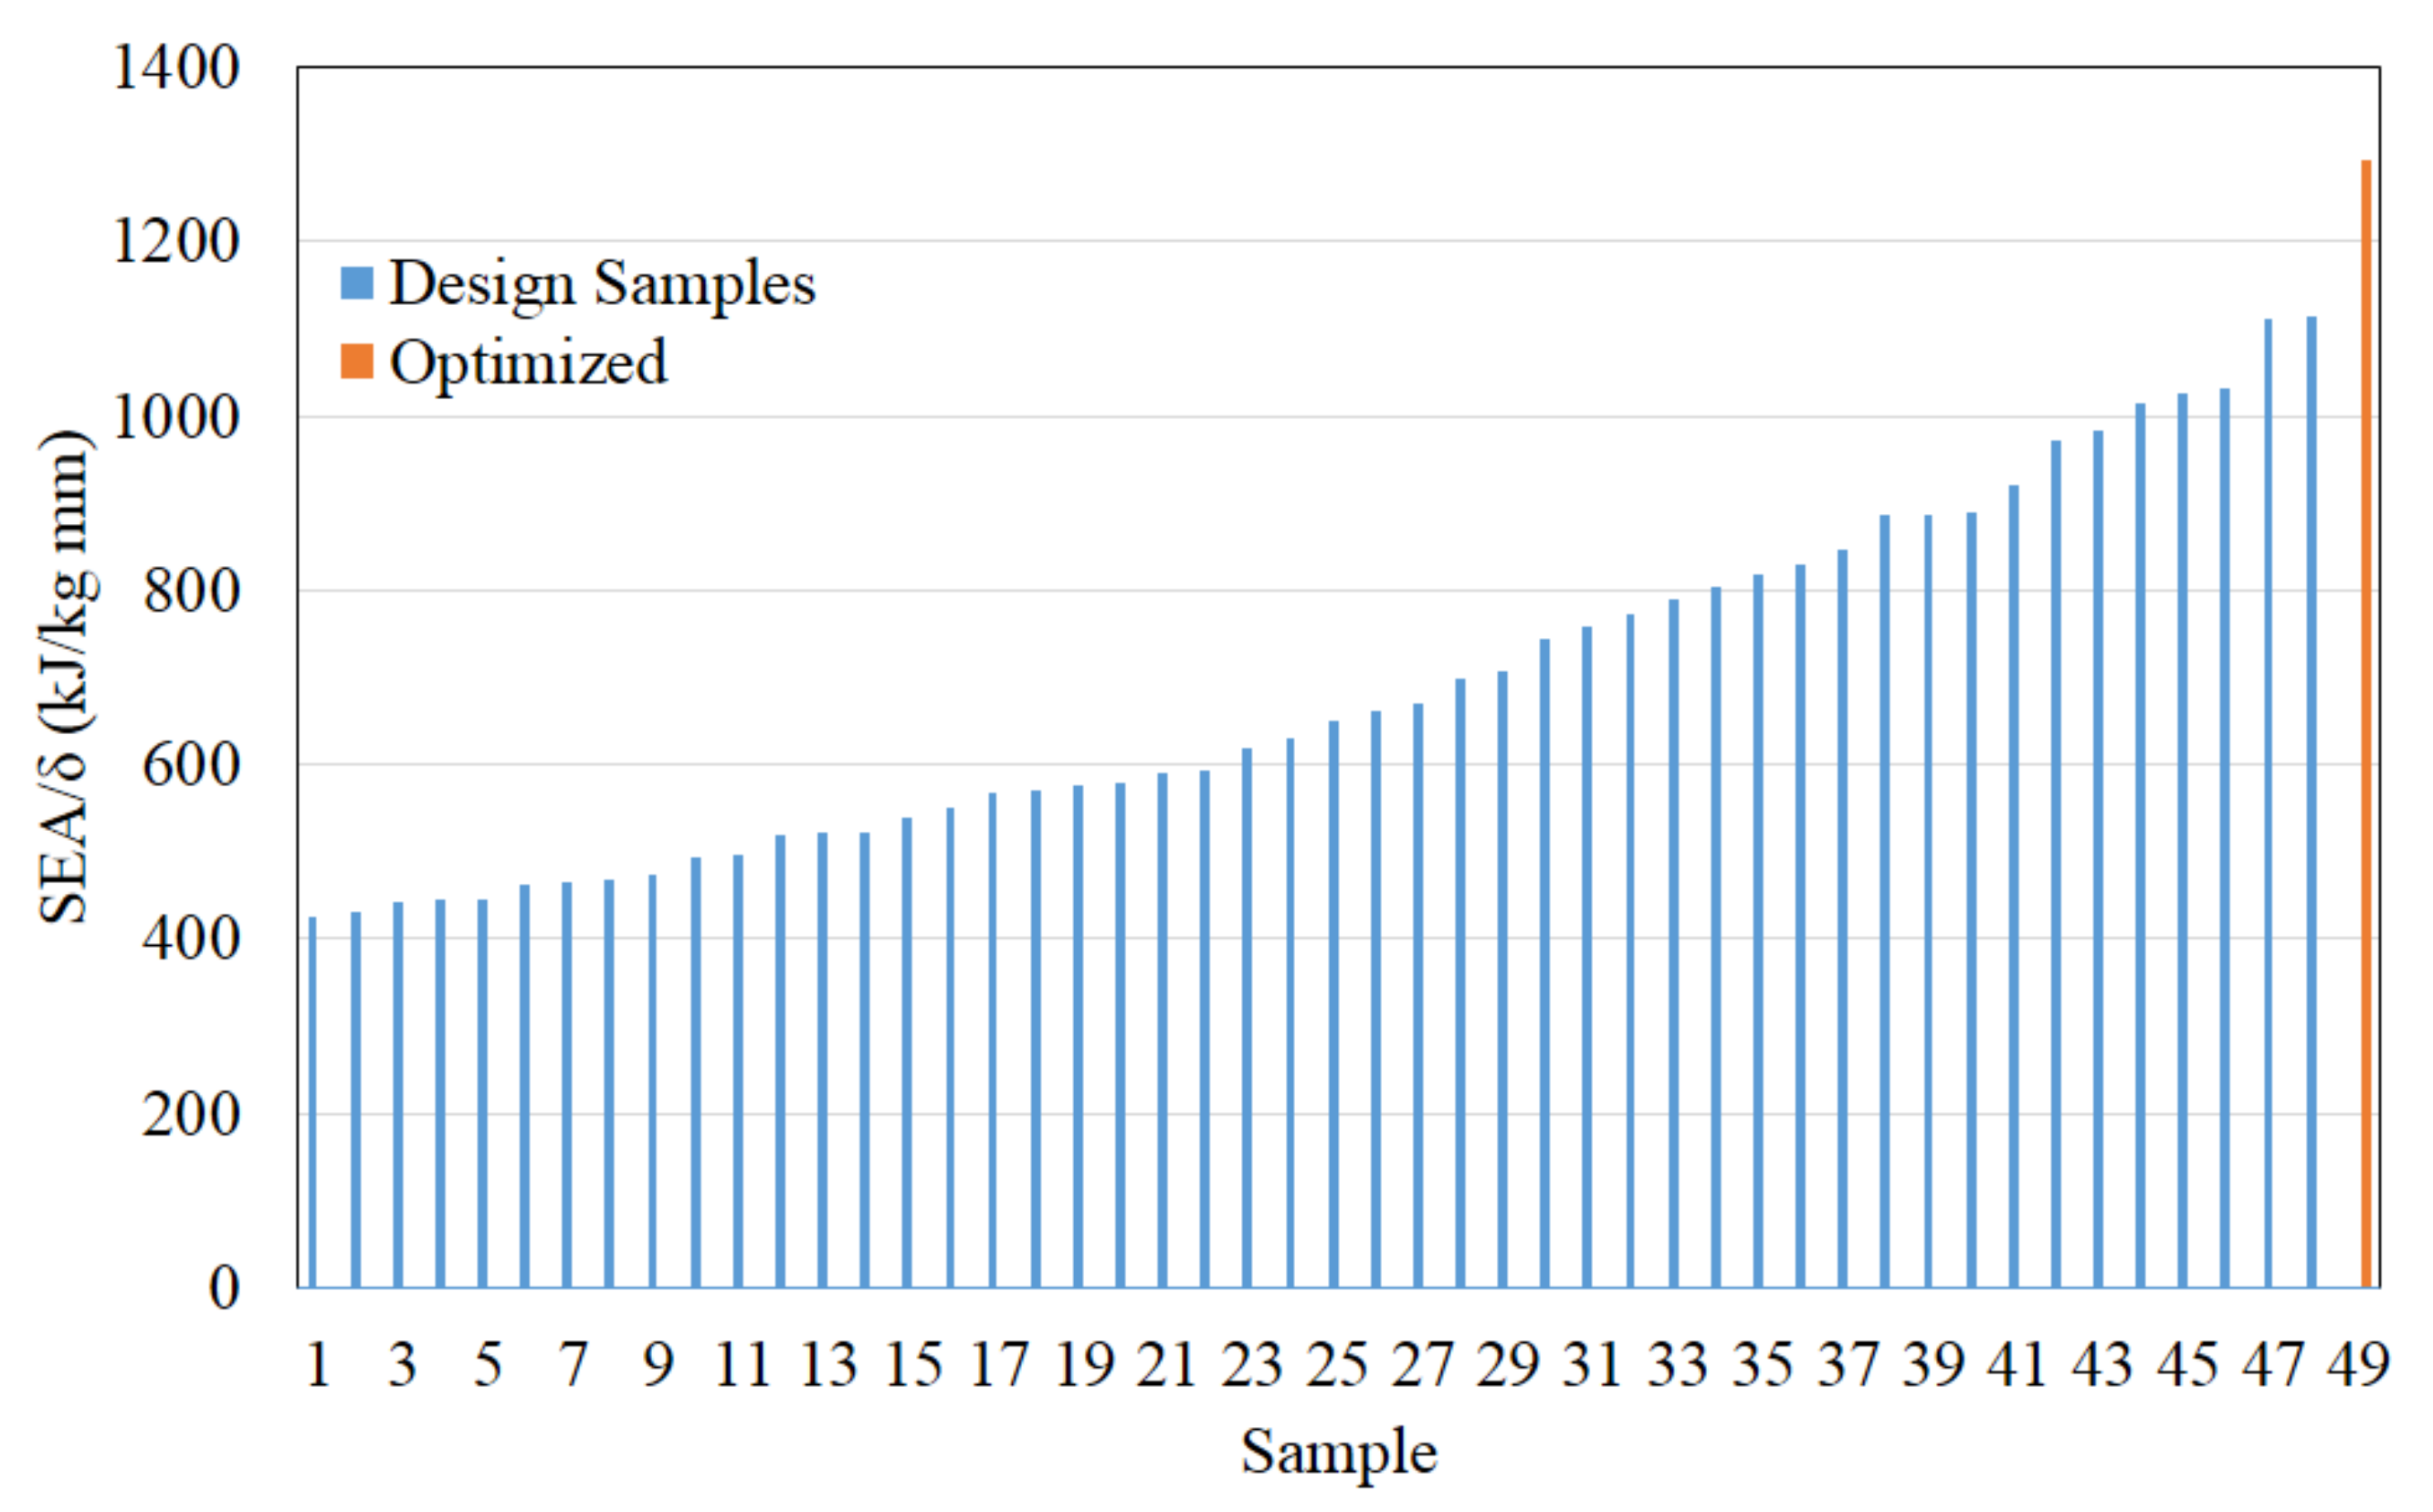
4.6. Optimum Point
5. Conclusions
Author Contributions
Funding
Institutional Review Board Statement
Informed Consent Statement
Data Availability Statement
Conflicts of Interest
Nomenclature
| ANN | artificial neural network |
| EV | electric vehicle |
| GA | genetic algorithm |
| MLP | multilayer perceptron network |
| NMSE | normalized mean square error |
| NSGA-II | non-dominated sorting genetic algorithm II |
| RESS | reserved energy storage system |
| SEA | specific energy absorption |
| TOPSIS | technique for order of preference by similarity to ideal solution |
| b | bias of artificial neural network |
| c | coefficient of CAD cubic correction |
| corrective error of designed and CAD geometry | |
| k | coefficient of total strut length of a unit cell |
| m | number of output node |
| N | number of total samples |
| n | number of input node |
| R | cross-section strut radius |
| t | height of a unit cell |
| w | weight of artificial neural network |
| WSEA | weight of SEA in TOPSIS evaluation |
| Wδ | weight of δ in TOPSI evaluation |
| δ | battery-shortening |
| relative density of a unit cell | |
| σy | yield strength |
| θ | angle of twisted lattice structure |
References
- Carrington, D. Brutal News: Global Carbon Emissions Jump to All-Time High in 2018. The Guardian, 5 December 2018. [Google Scholar]
- Jensen, C. Tesla Says Car Fire Started in Battery. New York Times, 2 October 2013. [Google Scholar]
- Rawlinson, P.D. Vehicle Battery Pack Ballistic Shield. U.S. Patent 8,286,743,, 16 October 2012. [Google Scholar]
- Prince, M. Meet the Up-Armored, Titanium-Shielded Tesla Model S. Road and Track, 28 March 2014. [Google Scholar]
- Musk, E. Tesla Adds Titanium Underbody Shield and Aluminum Deflector Plates to Model S. Tesla, 28 March 2014. [Google Scholar]
- Thompson, A. A Tesla Burned to a Crisp on a Vermont Lake. We Walked Out There and Found It. Popular Mechanics, 27 February 2019. [Google Scholar]
- Xia, Y.; Wierzbicki, T.; Sahraei, E.; Zhang, X. Damage of Cells and Battery Packs Due to Ground Impact. J. Power Sources 2014, 267, 78–97. [Google Scholar] [CrossRef]
- Zhu, J.; Zhang, X.; Sahraei, E.; Wierzbicki, T. Deformation and Failure Mechanisms of 18650 Battery Cells under Axial Compression. J. Power Sources 2016, 336, 332–340. [Google Scholar] [CrossRef]
- Sahraei, E.; Campbell, J.; Wierzbicki, T. Modeling and Short Circuit Detection of 18650 Li-Ion Cells under Mechanical Abuse Conditions. J. Power Sources 2012, 220, 360–372. [Google Scholar] [CrossRef]
- Zhu, J.; Zhang, X.; Wierzbicki, T.; Xia, Y.; Chen, G. Structural Designs for Electric Vehicle Battery Pack against Ground Impact. SAE Int. J. Engines 2018. [Google Scholar] [CrossRef]
- Halimah, P.N.; Santosa, S.P.; Jusuf, A.; Dirgantara, T. The Concept of Sandwich Panel Structures for Battery Protections in Electric Vehicles Subjected to Ground Impact. In Proceedings of the 2018 5th International Conference on Electric Vehicular Technology (ICEVT), Surakarta, Indonesia, 30–31 October 2018; pp. 142–146. [Google Scholar]
- Nirmala, T.; Jusuf, A.; Puji Santosa, S.; Sambegoro, P.L. Design Study of Battery System Protection Structure Based on Hybrid Material Fiber Metal Laminate (FML). In Proceedings of the 2019 6th International Conference on Electric Vehicular Technology (ICEVT), Bali, Indonesia, 18–21 November 2019; pp. 163–169. [Google Scholar]
- Irawan, D.; Santosa, S.P.; Jusuf, A.; Sambegoro, P.L. Sandwich Panel Composite Based Light-Weight Structure Design for Reserved Energy Storage System (RESS) Protection. In Proceedings of the 2019 6th International Conference on Electric Vehicular Technology (ICEVT), Bali, Indonesia, 18–21 November 2019; pp. 124–134. [Google Scholar]
- Yin, S.; Chen, H.; Wu, Y.; Li, Y.; Xu, J. Introducing Composite Lattice Core Sandwich Structure as an Alternative Proposal for Engine Hood. Compos. Struct. 2018, 201, 131–140. [Google Scholar] [CrossRef]
- Nagesha, B.K.; Dhinakaran, V.; Varsha Shree, M.; Manoj Kumar, K.P.; Chalawadi, D.; Sathish, T. Review on Characterization and Impacts of the Lattice Structure in Additive Manufacturing. Mater. Today Proc. 2020, 21, 916–919. [Google Scholar] [CrossRef]
- Ashby, M. Designing Architectured Materials. Scr. Mater. 2013, 68, 4–7. [Google Scholar] [CrossRef]
- Nasrullah, A.I.H.; Santosa, S.P.; Dirgantara, T. Design and Optimization of Crashworthy Components Based on Lattice Structure Configuration. Structures 2020, 26, 969–981. [Google Scholar] [CrossRef]
- Pirmohammad, S.; Esmaeili Marzdashti, S. Crashworthiness Optimization of Combined Straight-Tapered Tubes Using Genetic Algorithm and Neural Networks. Thin-Walled Struct. 2018, 127, 318–332. [Google Scholar] [CrossRef]
- Maximum Posted Speed Limits by State 2020. Available online: https://www.iihs.org/topics/speed/speed-limit-laws (accessed on 6 December 2021).
- Loveday, E. Tesla Reveals Details on Last Year’s Fiery Model S Wreck in Mexico. Insideevs, 14 May 2014. [Google Scholar]
- National Transportation Safety Board. Single-Vehicle Run-Off-Road Crash and Fire Fort Lauderdale, Florida, 8 May 2018; Single-Vehicle Run-Off-Road Crash and Postcrash Fire; National Transportation Safety Board: Washington, DC, USA, 2018.
- Habib, F.N.; Iovenitti, P.; Masood, S.H.; Nikzad, M. Fabrication of Polymeric Lattice Structures for Optimum Energy Absorption Using Multi Jet Fusion Technology. Mater. Des. 2018, 155, 86–98. [Google Scholar] [CrossRef]
- Gowda, C.C.; Mayya, S.G. Comparison of Back Propagation Neural Network and Genetic Algorithm Neural Network for Stream Flow Prediction. J. Comput. Environ. Sci. 2014, 2014, 290127. [Google Scholar] [CrossRef] [Green Version]
- Stathakis, D. How Many Hidden Layers and Nodes? Int. J. Remote Sens. 2009, 30, 2133–2147. [Google Scholar] [CrossRef]


| Component | Location | Type of Boundary Condition |
|---|---|---|
| Floor panel | Edge | No translation (111000) |
| Sandwich panel | Edge | No translation (111000) |
| Impactor | All geometry | Only z-axis translation (110111) |
| Lattice | Edge | No x- and y-axis translation (110000) |
| Component | Material | Properties |
|---|---|---|
| Floor panel, sandwich panel | Aluminum alloy (AA-2024-T351) | ρ = 2.78 g/cm3 σy = 324 MPa δbreak = 20% E = 73.1 GPa 𝜈 = 0.33 |
| Shell casing | Steel | ρ = 7.8 g/cm3 σy = 450 MPa E = 200 GPa 𝜈 = 0.3 |
| Module housing | Polypropylene | ρ = 0.905 g/cm3 σy = 25 MPa E = 1.2 GPa 𝜈 = 0.42 |
| Impactor | Rigid | ρ = 30 g/cm3 |
| Jellyroll | Crushable foam | ρ = 2.721 g/cm3 E = 0.5 GPa |
| Lattice | HPPA12 | ρ = 0.919 g/cm3 σy = 22.8 MPa E = 1.34 GPa 𝜈 = 0.33 |
| Tuning Parameter | Value |
|---|---|
| Population size | 100 |
| Maximum number of generations | 10,000 |
| Probability of cross over | 0.8 |
| Probability of mutation | 0.01 |
| Fitness limit | e−5 |
| Initial population range | [−1;1] |
| Θ (°) | σy = 22.8 MPa | σy = 45.6 MPa | σy = 68.4 MPa | ||||
|---|---|---|---|---|---|---|---|
| SEA (kJ/kg) | δ (mm) | SEA (kJ/kg) | δ (mm) | SEA (kJ/kg) | δ (mm) | ||
| 35.87 | 0.27 | 2853 | 6.41 | ||||
| 35.87 | 0.36 | 3192 | 6.86 | ||||
| 35.87 | 0.46 | 2938 | 6.92 | ||||
| 35.87 | 0.57 | 3121 | 6.30 | ||||
| 35.87 | 0.68 | 3419 | 4.60 | ||||
| 42.45 | 0.27 | 2890 | 6.73 | 3187 | 6.88 | 3484 | 5.86 |
| 42.45 | 0.36 | 3514 | 6.11 | ||||
| 42.45 | 0.46 | 3426 | 6.60 | 2972 | 4.81 | 3463 | 3.91 |
| 42.45 | 0.57 | 3296 | 5.08 | ||||
| 42.45 | 0.68 | 3035 | 4.53 | 3202 | 3.12 | 3620 | 4.42 |
| 51.80 | 0.27 | 3148 | 6.65 | ||||
| 51.80 | 0.36 | 3466 | 7.01 | ||||
| 51.80 | 0.46 | 3301 | 6.13 | ||||
| 51.80 | 0.57 | 3472 | 4.97 | ||||
| 51.80 | 0.68 | 3000 | 3.54 | ||||
| 65.84 | 0.27 | 2934 | 6.58 | 3018 | 6.45 | 2565 | 4.34 |
| 65.84 | 0.36 | 3437 | 6.58 | ||||
| 65.84 | 0.46 | 3480 | 6.14 | 3398 | 3.46 | 3399 | 3.69 |
| 65.84 | 0.57 | 3507 | 4.97 | ||||
| 65.84 | 0.68 | 3386 | 3.48 | 3260 | 3.67 | 3349 | 4.42 |
| 73.52 | 0.27 | 2936 | 6.63 | ||||
| 73.52 | 0.36 | 3470 | 6.32 | ||||
| 73.52 | 0.46 | 3490 | 5.55 | ||||
| 73.52 | 0.57 | 3490 | 4.52 | ||||
| 73.52 | 0.68 | 3426 | 3.08 | ||||
| 88.32 | 0.27 | 3348 | 6.42 | 3359 | 5.88 | 3538 | 4.41 |
| 88.32 | 0.36 | 3477 | 6.02 | ||||
| 88.32 | 0.46 | 3551 | 5.37 | 3501 | 3.45 | 4155 | 3.73 |
| 88.32 | 0.57 | 3298 | 4.18 | ||||
| 88.32 | 0.68 | 3691 | 3.58 | 3113 | 3.75 | 3598 | 4.06 |
| θ (°) | SEA (kJ/kg) | δ (mm) | ||||
|---|---|---|---|---|---|---|
| 0.9 | 0.1 | 65.84 | 0.79 | 40.52 | 3642.80 | 2.73 |
| 0.8 | 0.2 | 65.84 | 0.79 | 40.52 | 3642.80 | 2.73 |
| 0.7 | 0.3 | 65.84 | 0.79 | 40.52 | 3642.80 | 2.73 |
| 0.6 | 0.4 | 65.84 | 0.79 | 40.52 | 3642.80 | 2.73 |
| θ (°) | SEA (kJ/kg) | δ (mm) | |||
|---|---|---|---|---|---|
| ANN-GA | 65.84 | 0.79 | 40.52 | 3642.80 | 2.73 |
| FEA | 65.84 | 0.79 | 40.52 | 3712.41 | 2.87 |
| Error (%) | 1.87 | 4.87 |
Publisher’s Note: MDPI stays neutral with regard to jurisdictional claims in published maps and institutional affiliations. |
© 2021 by the authors. Licensee MDPI, Basel, Switzerland. This article is an open access article distributed under the terms and conditions of the Creative Commons Attribution (CC BY) license (https://creativecommons.org/licenses/by/4.0/).
Share and Cite
Nasrullah, A.I.H.; Puji Santosa, S.; Widagdo, D.; Arifurrahman, F. Structural Lattice Topology and Material Optimization for Battery Protection in Electric Vehicles Subjected to Ground Impact Using Artificial Neural Networks and Genetic Algorithms. Materials 2021, 14, 7618. https://doi.org/10.3390/ma14247618
Nasrullah AIH, Puji Santosa S, Widagdo D, Arifurrahman F. Structural Lattice Topology and Material Optimization for Battery Protection in Electric Vehicles Subjected to Ground Impact Using Artificial Neural Networks and Genetic Algorithms. Materials. 2021; 14(24):7618. https://doi.org/10.3390/ma14247618
Chicago/Turabian StyleNasrullah, Alvian Iqbal Hanif, Sigit Puji Santosa, Djarot Widagdo, and Faizal Arifurrahman. 2021. "Structural Lattice Topology and Material Optimization for Battery Protection in Electric Vehicles Subjected to Ground Impact Using Artificial Neural Networks and Genetic Algorithms" Materials 14, no. 24: 7618. https://doi.org/10.3390/ma14247618