Article

Porous SiC and SiC/Cf Ceramic Microspheres Derived from Polyhydromethylsiloxane by Carbothermal Reduction

by
Urszula Mizerska
1,*,
Witold Fortuniak
1,
Julian Chojnowski
1,
Slawomir Rubinsztajn
1,
Joanna Zakrzewska
1,
Irena Bak-Sypien
1 and
Anna Nyczyk-Malinowska
2
1
Center of Molecular and Macromolecular Studies, Polish Academy of Sciences, ul. Sienkiewicza 112, 90-363 Lodz, Poland
2
Faculty of Materials Science and Ceramics, AGH-University of Science and Technology, Al. Mickiewicza 30, 30-059 Krakow, Poland
*
Author to whom correspondence should be addressed.
Materials 2022, 15(1), 81; https://doi.org/10.3390/ma15010081
Submission received: 21 October 2021 / Revised: 3 December 2021 / Accepted: 20 December 2021 / Published: 23 December 2021

Abstract

:
A simple and inexpensive method for the preparation of porous SiC microspheres is presented. Polysiloxane microspheres derived from polyhydromethylsiloxane (PHMS) cross-linked with divinylbenzene (DVB) were ceramized under conditions leading to the removal of oxygen from the material. The content of free carbon (Cf) in highly crystalline silicon carbide (SiC) particles can be controlled by using various proportions of DVB in the synthesis of the pre-ceramic material. The chemical structure of the ceramic microspheres was studied by elemental analysis for carbon and oxygen, 29Si MAS NMR, 13C MAS NMR, SEM/EDS, XRD and Raman spectroscopies, and their morphology by SEM, nitrogen adsorption and mercury intrusion porosimetries. The gaseous products of the thermal reduction processes formed during ceramization created a porous structure of the microspheres. In the SiC/Cf microspheres, meso/micro pores were formed, while in carbon-free SiC, microspheres macroporosity dominated.

1. Introduction

Silicon carbide (SiC) has outstanding mechanical properties and chemical stability at high temperatures [1,2,3,4] as well as remarkable electronic and optical properties [5,6]. For this reason, SiC ceramics have found practical applications in very harsh conditions [1,2]. Recently, porous SiC or SiC composite microspheres have gained increasing interest as new promising materials in many fields. Spherical particles confined in dimensions within the micrometer range exhibit superior properties to their bulk counterparts. They provide good flowability, high packing density and easy access to particle surfaces [7,8,9,10]. In addition, hierarchical porosity gives the materials a high surface area and facile infiltration of liquids to their pores [7]. Porous SiC-based microspheres could be used in many fields, such as: catalysis [11,12], hot gas filtration [13], thermal insulation [10], sensors [14], absorbers [15,16], molten metal filtering [17], membranes [18,19], and tissue engineering [20]. The interest has recently been focused on SiC composites as potential semiconductor materials for absorption of electromagnetic waves [21], anodes of lithium-ion batteries [22] and supercapacitors [23].
Polymer-derived SiC ceramics and their composites are obtained from various precursors, such as polycarbosilanes [7,24,25], polysilazanes [8,9,10,26], polysiloxanes and silicone resins [27,28,29,30,31,32]. Polysiloxanes are commercially accessible and less expensive than other SiC precursors. The method used to produce silicon carbide ceramics and their composites from polysiloxane precursors is based on the carbothermal reduction of silicon oxycarbide (SiCO) formed in the first stage of the polysiloxane ceramization [27,32,33]. As SiO, CO and CO2 gas products are generated in this process a porous structure of the ceramic material is formed [25,34]. A porous structure can also be produced by adding a dispersed sacrificial phase [7,31,33]. Carbothermal reduction requires a high temperature at which preservation of the spherical shape of particles may be a problem. A few years ago, we developed the synthesis of polysiloxane microspheres from polyhydromethylsiloxane (PHMS), which proved to be good precursors for the fabrication of SiCO ceramic microspheres [35,36]. Now we found that it is possible to produce spherical SiC particles by heating the modified PHMS derived microspheres for a long time in argon at 1600 °C until oxygen is removed from this material by carbothermal reduction. Thus, porous ceramic SiC microspheres containing a controlled free carbon content can be obtained from precursor polysiloxane microspheres in reasonable yield in one step. A significant mesoporosity and/or macroporosity, as well as high SiC crystallinity, may be developed in these spherical particles.

2. Materials and Methods

2.1. Materials

Polyhydromethylsiloxane (PHMS) of molar mass about 3000 product of ABCR(Karlsruhe Germany), 1,3-divinyl-1,1,3,3-tetramethyldisiloxane (DVTMDS) (ABCR, Karlsruhe Germany, 97%), poly(vinyl alcohol) molar mass Mn = 7.2 × 10⁴ (Avantor Performance Materials S.A., Gliwice, Poland) were purchased from producers and used without additional purification. Divinylbenzene (DVB) was purchased from Merck Life Science (Darmstadt, Germany) with a declared purity 80.1% is a mixture of 56/24 meta and para isomers and 18.8% of ethylvinylbenzene, Karstedt complex offered by Momentive Performance Materials (Leverkusen, Germany) 20 w% Pt.

2.2. Analytical Methods

29Si MAS NMR spectra were recorded using a DSX 400 Bruker spectrometer (Bruker, Billerica, MA, USA). Spectra were acquired in HPDec mode with a 4 μs pulse at 90° and with a 100 s delay between pulses.
13C MAS NMR, spectra were recorded using a DSX 400 Bruker spectrometer(Bruker, Billerica, MA, USA). Spectra were acquired in HPDec mode with a 5 μs pulse at 90° and with a 100 s delay between pulses.
Elemental analyzes of the preceramic siloxane microspheres for carbon and hydrogen content were performed using CHNS analyzer EuroVector model 3018 Elementar Analysensysteme (GmbH, Langenselbold, Germany).
Elemental analyzes of ceramic microspheres for the determination of free carbon, Cf, were carried out in Łukasiewicz Research Network—Institute for Ferrous Metallurgy in Gliwice, Poland. Cf was calculated from Ctotal which was determined by the burning in oxygen of the studied sample mixed with PbCrO4 and the formed CO2 was analyzed in the Kulomat 702/SO/CS apparatus (Ströhlein, Germany).
Determination of the oxygen content in the ceramic microspheres was carried out using a gas analyzer model TCHEN-600 made by LECO Co.(LECO, St. Joseph, MI, USA) in Łukasiewicz Research Network—Institute for Ferrous Metallurgy in Gliwice, Poland.
Scanning Electron Microscope images were taken with a Jeol JSH 5500 LV microscope (JEOL Ltd., Tokyo, Japan) in a high vacuum mode, at the accelerated voltage of 10 kV. Samples were coated with a fine gold layer (about 20 nm thick), using sputter coater JEOL JFC 1200 (JEOL Ltd., Tokyo, Japan).
SEM–EDS spectra were recorded with the JEOL JSM-6010LA (JEOL Ltd., Tokyo, Japan) scanning electron microscope operating at accelerating voltage of 15 kV, equipped with an energy-dispersive X-ray detector. The surfaces of the analyzed samples were sputtered with a fine gold layer (20 nm thick) before analysis.
XRD diffractograms were obtained using a Panalytical X’Pert MPD PRO instrument (Malvern Panalytical, Egham, England) equipped with a roentgen lamp with copper anode, X’Celerator detector and Johansson monochromator. Measurements were carried out in the Bragg–Brentano geometry over a 2θ range from 5° to 75° with a 0.008° step and a step time of 106 s.
Raman spectra were recorded using a Raman HORIBA LabRAM HR micro spectrometer (HORIBA Laboratory, Kyoto, Japan) using an excitation beam at λexc = 488.0 nm.
TGA for analysis of free carbon content was performed by heating sample in air from 25 °C to 80 °C with rate of 5 °C/min and hold at 800 °C for 3 h using analyzer TGA 5500 (TA Instruments, New Castle, PA, USA).
Mercury Injection Capillary Pressure (MICP) measurements were performed in specialized porosimetric laboratory at AGH University of Science and Technology in Cracow, Faculty of Geology, Geophysics and Ecology. An AutoPore IV 9500 mercury porosimeter from Micromeritics (Micromeritics Instrument Corporation, Norcross, GA, USA) was used. The test procedure was developed based on a standard test protocol ASTM-D4404-1 (the American Society for Testing and Materials, Pensylwania, USA, 2010), and the instruction manual for the AutoPore IV measuring apparatus (AutoPore IV 9520 Operator’s Manual V1.09 2008).
The Micrometrics ASAP 2020 Plus gas sorption analyzer(Micromeritics Instrument Corporation, Norcross, GA, USA) was used to study the surface and pore size distribution of the prepared materials. The samples were degassed at 573 K until the pressure stabilized at 5 µmHg/min. Then, measurements of N2 adsorption–desorption isotherms were performed at the temperature of 77.159 K. The area and pore size distribution were calculated with the MicroActive software (for Windows). BET multi-point analysis (Brunauer–Emmett–Teller) was used to calculate the total area. DFT (Density Functional Theory) and BJH (Barret–Joyner–Halenda) models were used to determine the pore size distribution.

2.3. Preparation of Precursor Polysiloxane Microspheres

The fabrication of precursor polysiloxane microspheres is described elsewhere [37]. Description of the typical experiment as well as characterization of preceramic microspheres are also presented in supplementary materials, Table S1, Figures S1 and S2. Conditions of emulsification were the same for all samples PA-1 to PA-6 and PB-1 (speed 7000 rpm, time 90 s) with the exception of sample A-7 (speed 15000 rpm time 300 s). The size distribution of the pre-ceramic siloxane microspheres is shown in supplementary materials in Figure S2.

2.4. Ceramization of Microspheres

Pyrolysis of polysiloxane microspheres at 1600 °C was performed in a flowing argon atmosphere at a flow rate of 100 L/h. An aluminum oxide vessel (DEGUSSIT®AL23) was loaded with a known amount of preceramic microspheres and was placed in a high-temperature tube furnace (Nabertherm RHTH 120/300/18, Nabertherm GmbH Germany). Heating rate was 5 °C/min. The samples were maintained for 5 h at the target temperature. Then, heating was switched off, and the sample was allowed to cool to room temperature in the flowing argon atmosphere. After cooling, the samples were weighed and analyzed.
Oxidation of microspheres (sample A-7) to remove free carbon were performed in a Nabertherm furnace at the flow of air with heating from 20 °C to 800 °C with heating rate of 5 °C/min and hold at isotherm at 800 °C for 3 h.

3. Results

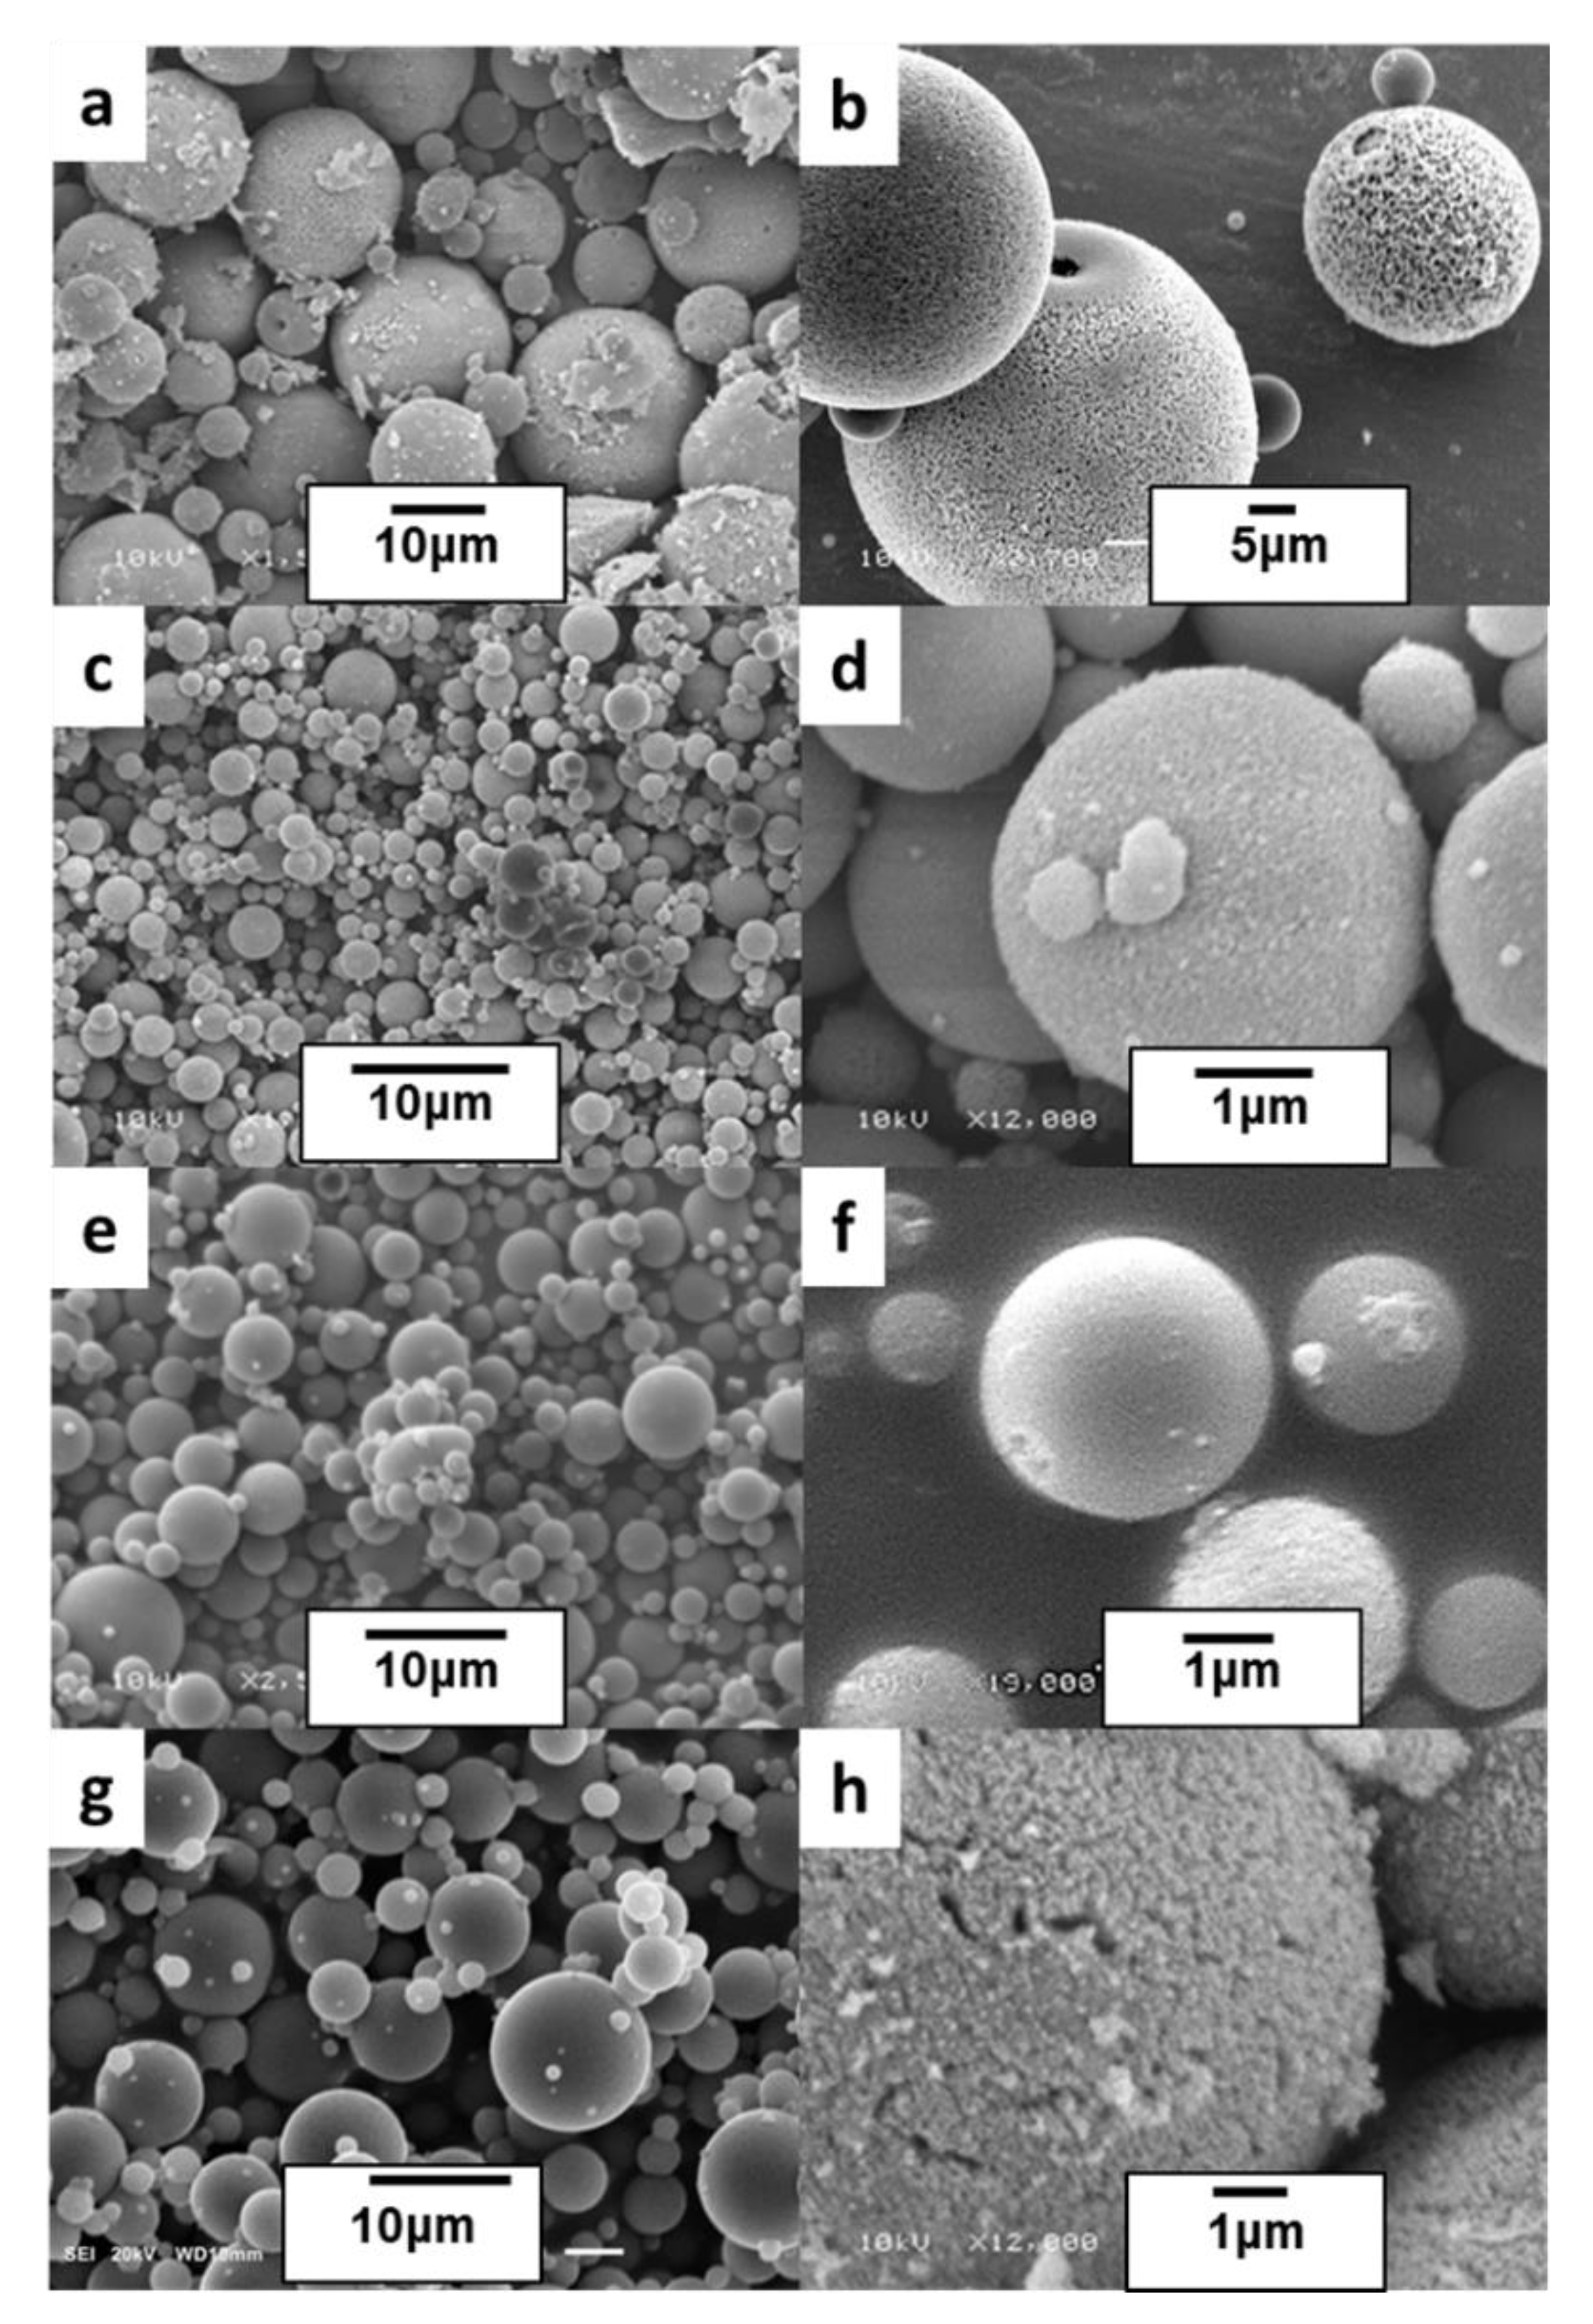
3.1. Precursor Polysiloxane Microspheres

It is well known that polysiloxanes can be thermally transformed into SiC ceramics. The process is complex and requires heating above 1200 °C [38]. Ceramization of the siloxane polymer in an inert atmosphere above 900 °C first produces SiCO material which contains nanodomains of free carbon, Cf. Further heating above 1200 °C results in the segregations of SiO2 and SiC phases, Equation (1), which is accompanied by carbothermal reduction of SiO2 by the free carbon, Equation (2). If the quantity of free carbon is high enough, both processes can convert SiCO to SiC and produce gaseous products that remove oxygen from the material [38,39]. The excess of Cf remains in the ceramics.
SiCnOm(s) ⟶ SiO2(s) + SiC(s) + Cf(s)
SiO2(s) + Cf(s) ⟶ SiC(s) + SiO(g) + CO(g) + CO2(g)
Our goal was to find a suitable precursor polysiloxane microspheres and the right conditions of the ceramization process to obtain oxygen-free SiC material with a controlled Cf content, with relatively high ceramization yield and maintaining the spherical shape of the ceramic particles. The other aim was to explore the possibility of pores formation in SiC ceramics by controlling the formation of gaseous products in the carbothermal reduction process. Our previous studies showed that microspheres produced by aqueous emulsion processing of PHMS, retain their shape well in ceramization at high temperatures [35]. However, due to the relatively small amount of carbon in the polysiloxane, it is difficult to remove oxygen from the produced ceramics while providing a good SiC yield. The method to achieve this goal by other researchers was the introduction of various forms of carbon, such as charcoal [40], anthracite or graphite [27], carbon black or phenol resin [31,33], to the precursor. In our research, additional carbon was introduced to this material through the use of a large amount of a cross-linking agent, which was divinyl benzene (DVB). As demonstrated by Kleebe et al., PHMS cross-linked with DVB and heated to 1000–1450 °C gives SiOC material containing a large amount of aromatic free carbon [41,42]. We previously found that SiOC microspheres obtained from modified PHMS/DVB systems were distinguished by a high content of Cf [43].
Series of precursor polysiloxane microspheres were prepared using various proportions of DVB cross-linker (s.i. Figures S1 and S2). They were obtained by aqueous emulsion processing according to the method described elsewhere [35] in which the polysiloxane with partly grafted cross-linker dissolved in a water-miscible solvent is mechanically emulsified with water containing a surfactant. The synthesis of this precursor series and the detailed analysis of the chemical structure of the formed microspheres was published separately [37]. The 13C and 29Si MAS NMR analysis made it possible to evaluate their chemical composition. The characteristics of the fabricated microspheres are shown in supporting information (s.i. Table S1). This analysis showed that the chemical structure of these microspheres is largely influenced by the content of the cross-linking agent. A characteristic feature of these microspheres is a large number of reactive side groups on the polysiloxane chains, which are native SiH groups and SiOH groups formed during the synthesis of the microspheres. In addition, there are two types of bonds connecting the polymer chains, SiOSi bonds due to condensation of reactive groups of the polymer and Si-CH2CH2- bridges due to hydrosilylation of DVB (s.i. Table S1). As the proportion of cross-linking agents increase, the number of SiOH groups and SiOSi bonds decreases, while the number of bridges formed by hydrosilylation increases significantly, Table 1. When the weight/weight ratio (w/w) of DVB to PHMS approaches 0.48, the content of SiOH groups, and thus SiOSi cross-linking, drops significantly. Under these conditions, the polymer is cross-linked mainly by DVB bridges. The influence of the w/w ratio of DVB to SiH on the structure of cross-linked microspheres is demonstrated in Figure 1, which compares the 29Si MAS NMR spectra of the microspheres obtained at low and high DVB content. This phenomenon leads to an increase in the carbon content in the preceramic microspheres from about 30 w% to 53 w% carbon as the DVB / PHMS weight ratio increases from 0.17 to 0.96, Table 1, Figure 2. In contrast, DVTMDS cross-linked microspheres, which do not have aromatic groups, contain less carbon. They are rich in hydroxyl groups and SiOSi bridges Table 1, sample PB-1.
These changes in the chemical structure affect the elemental composition of the precursor polysiloxane microspheres (Table 1) and strongly affect their behavior during the ceramization process, which will be discussed in the next section.

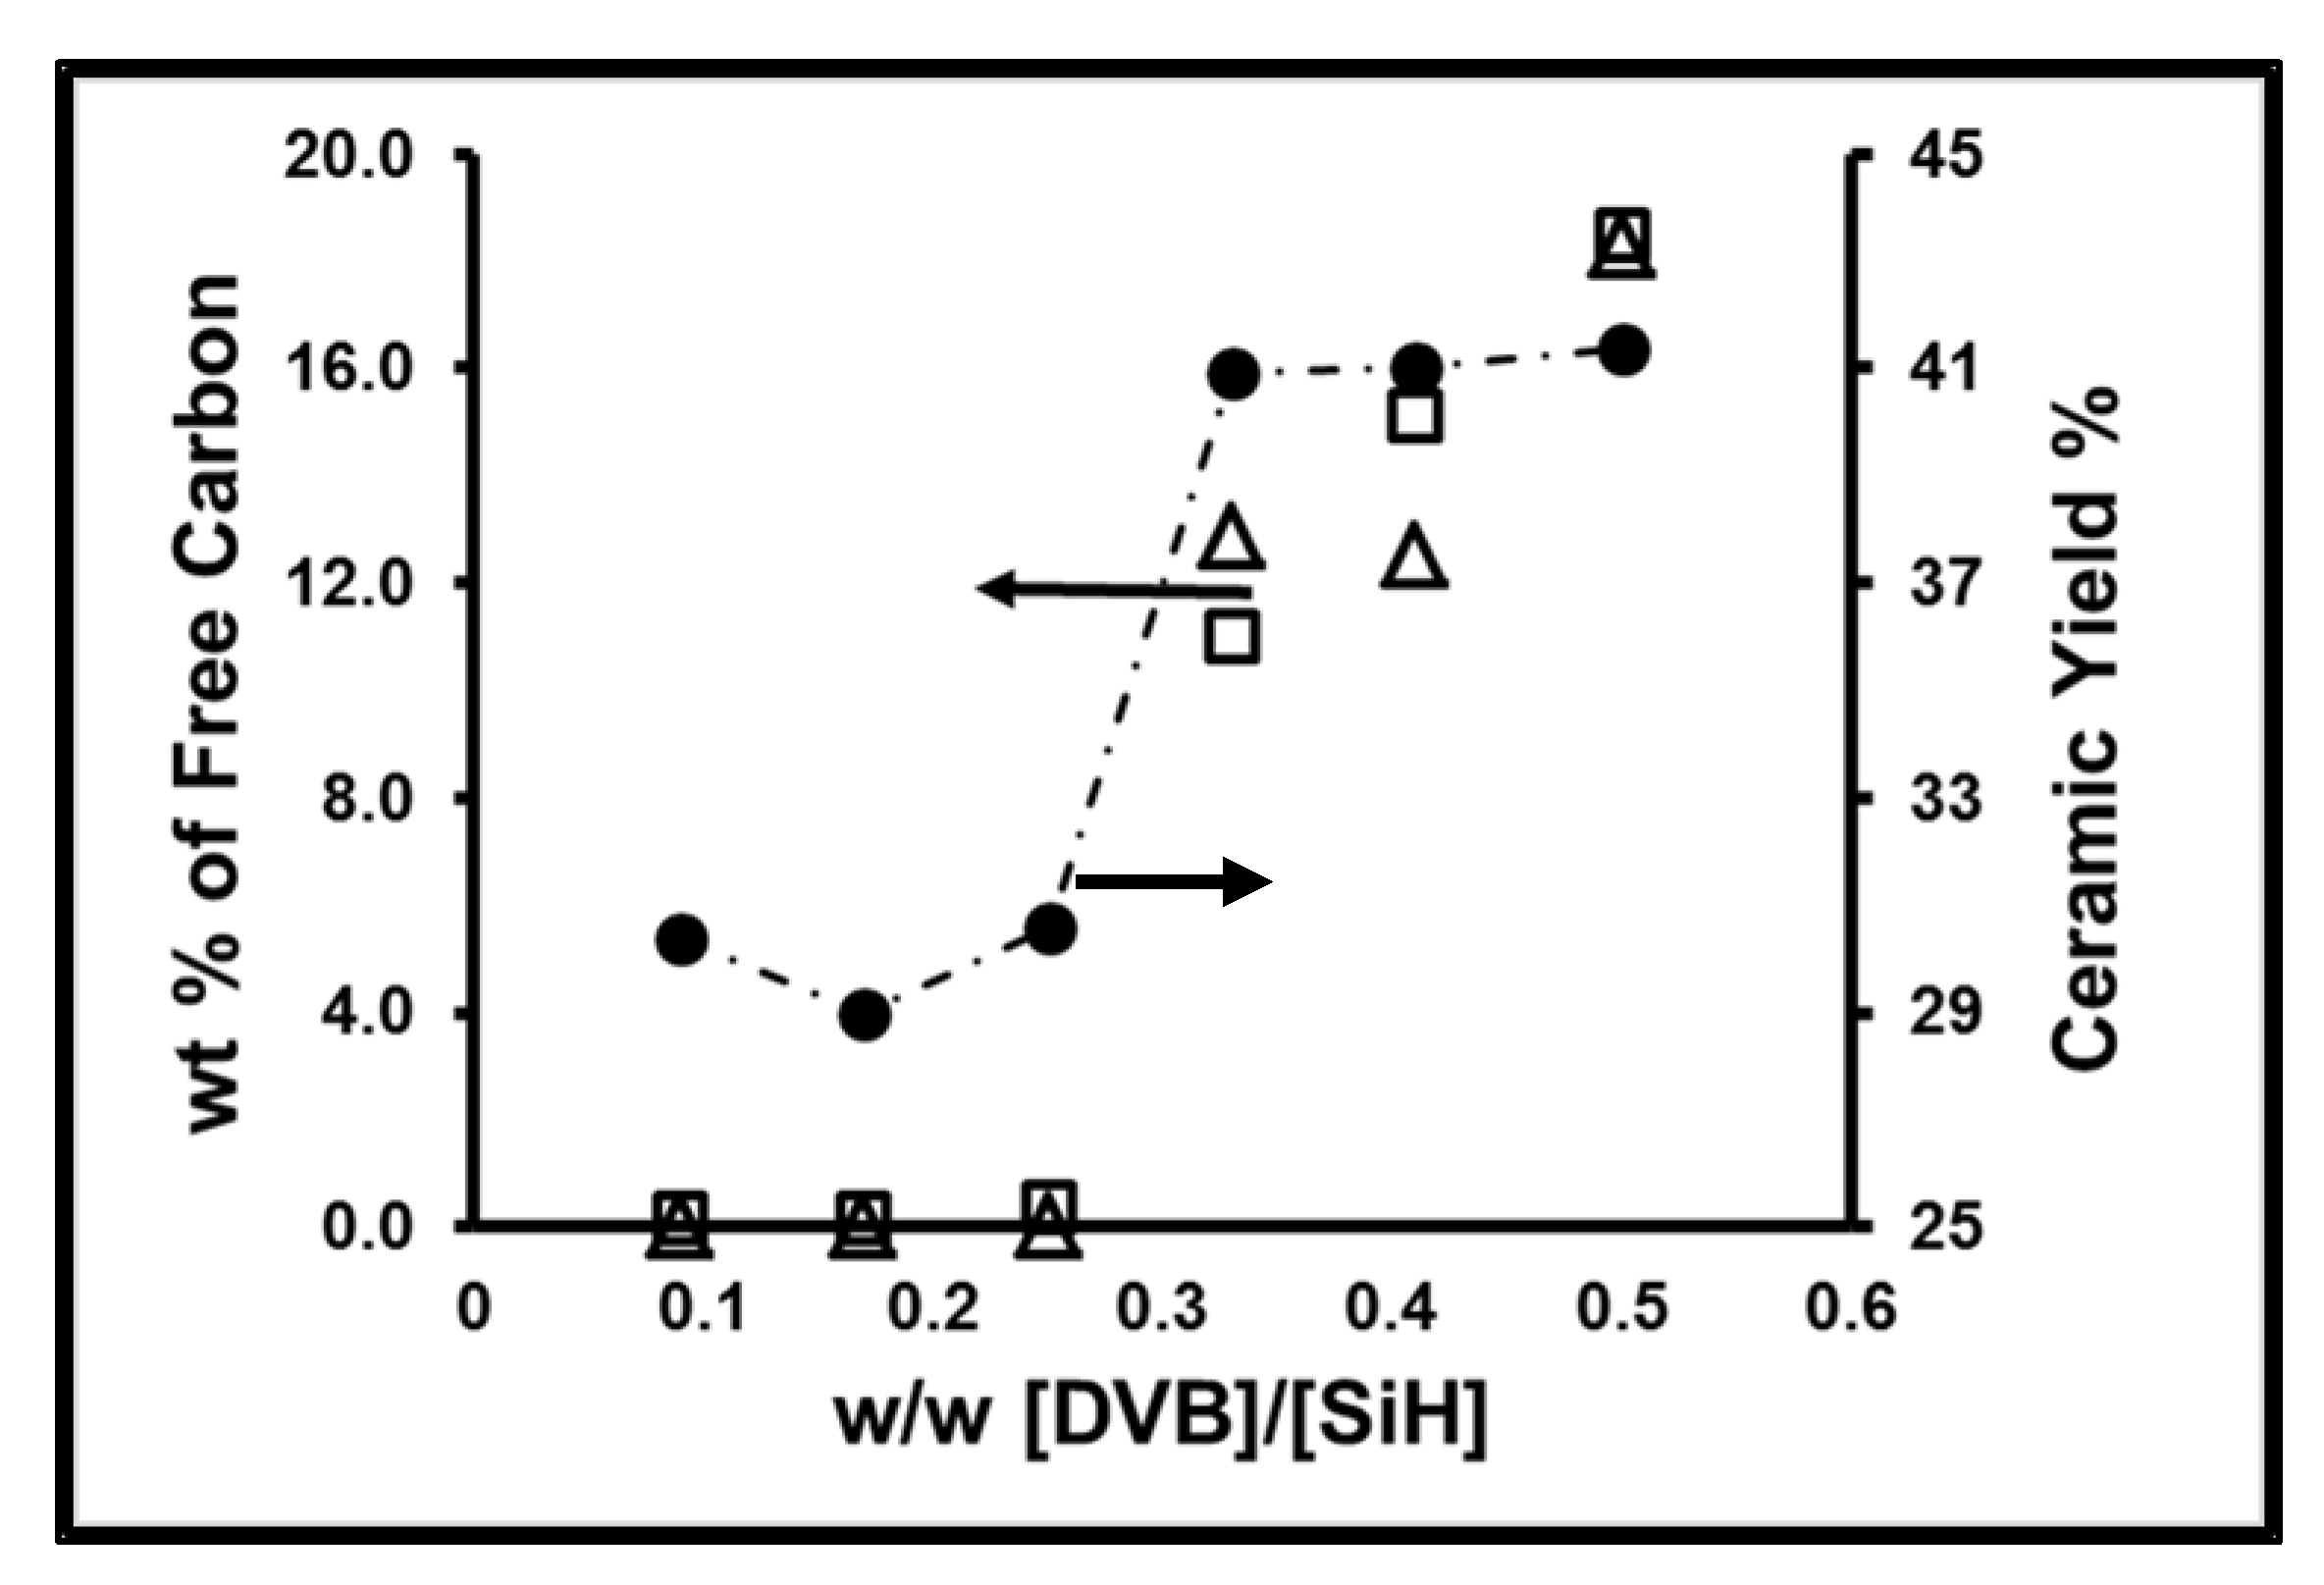
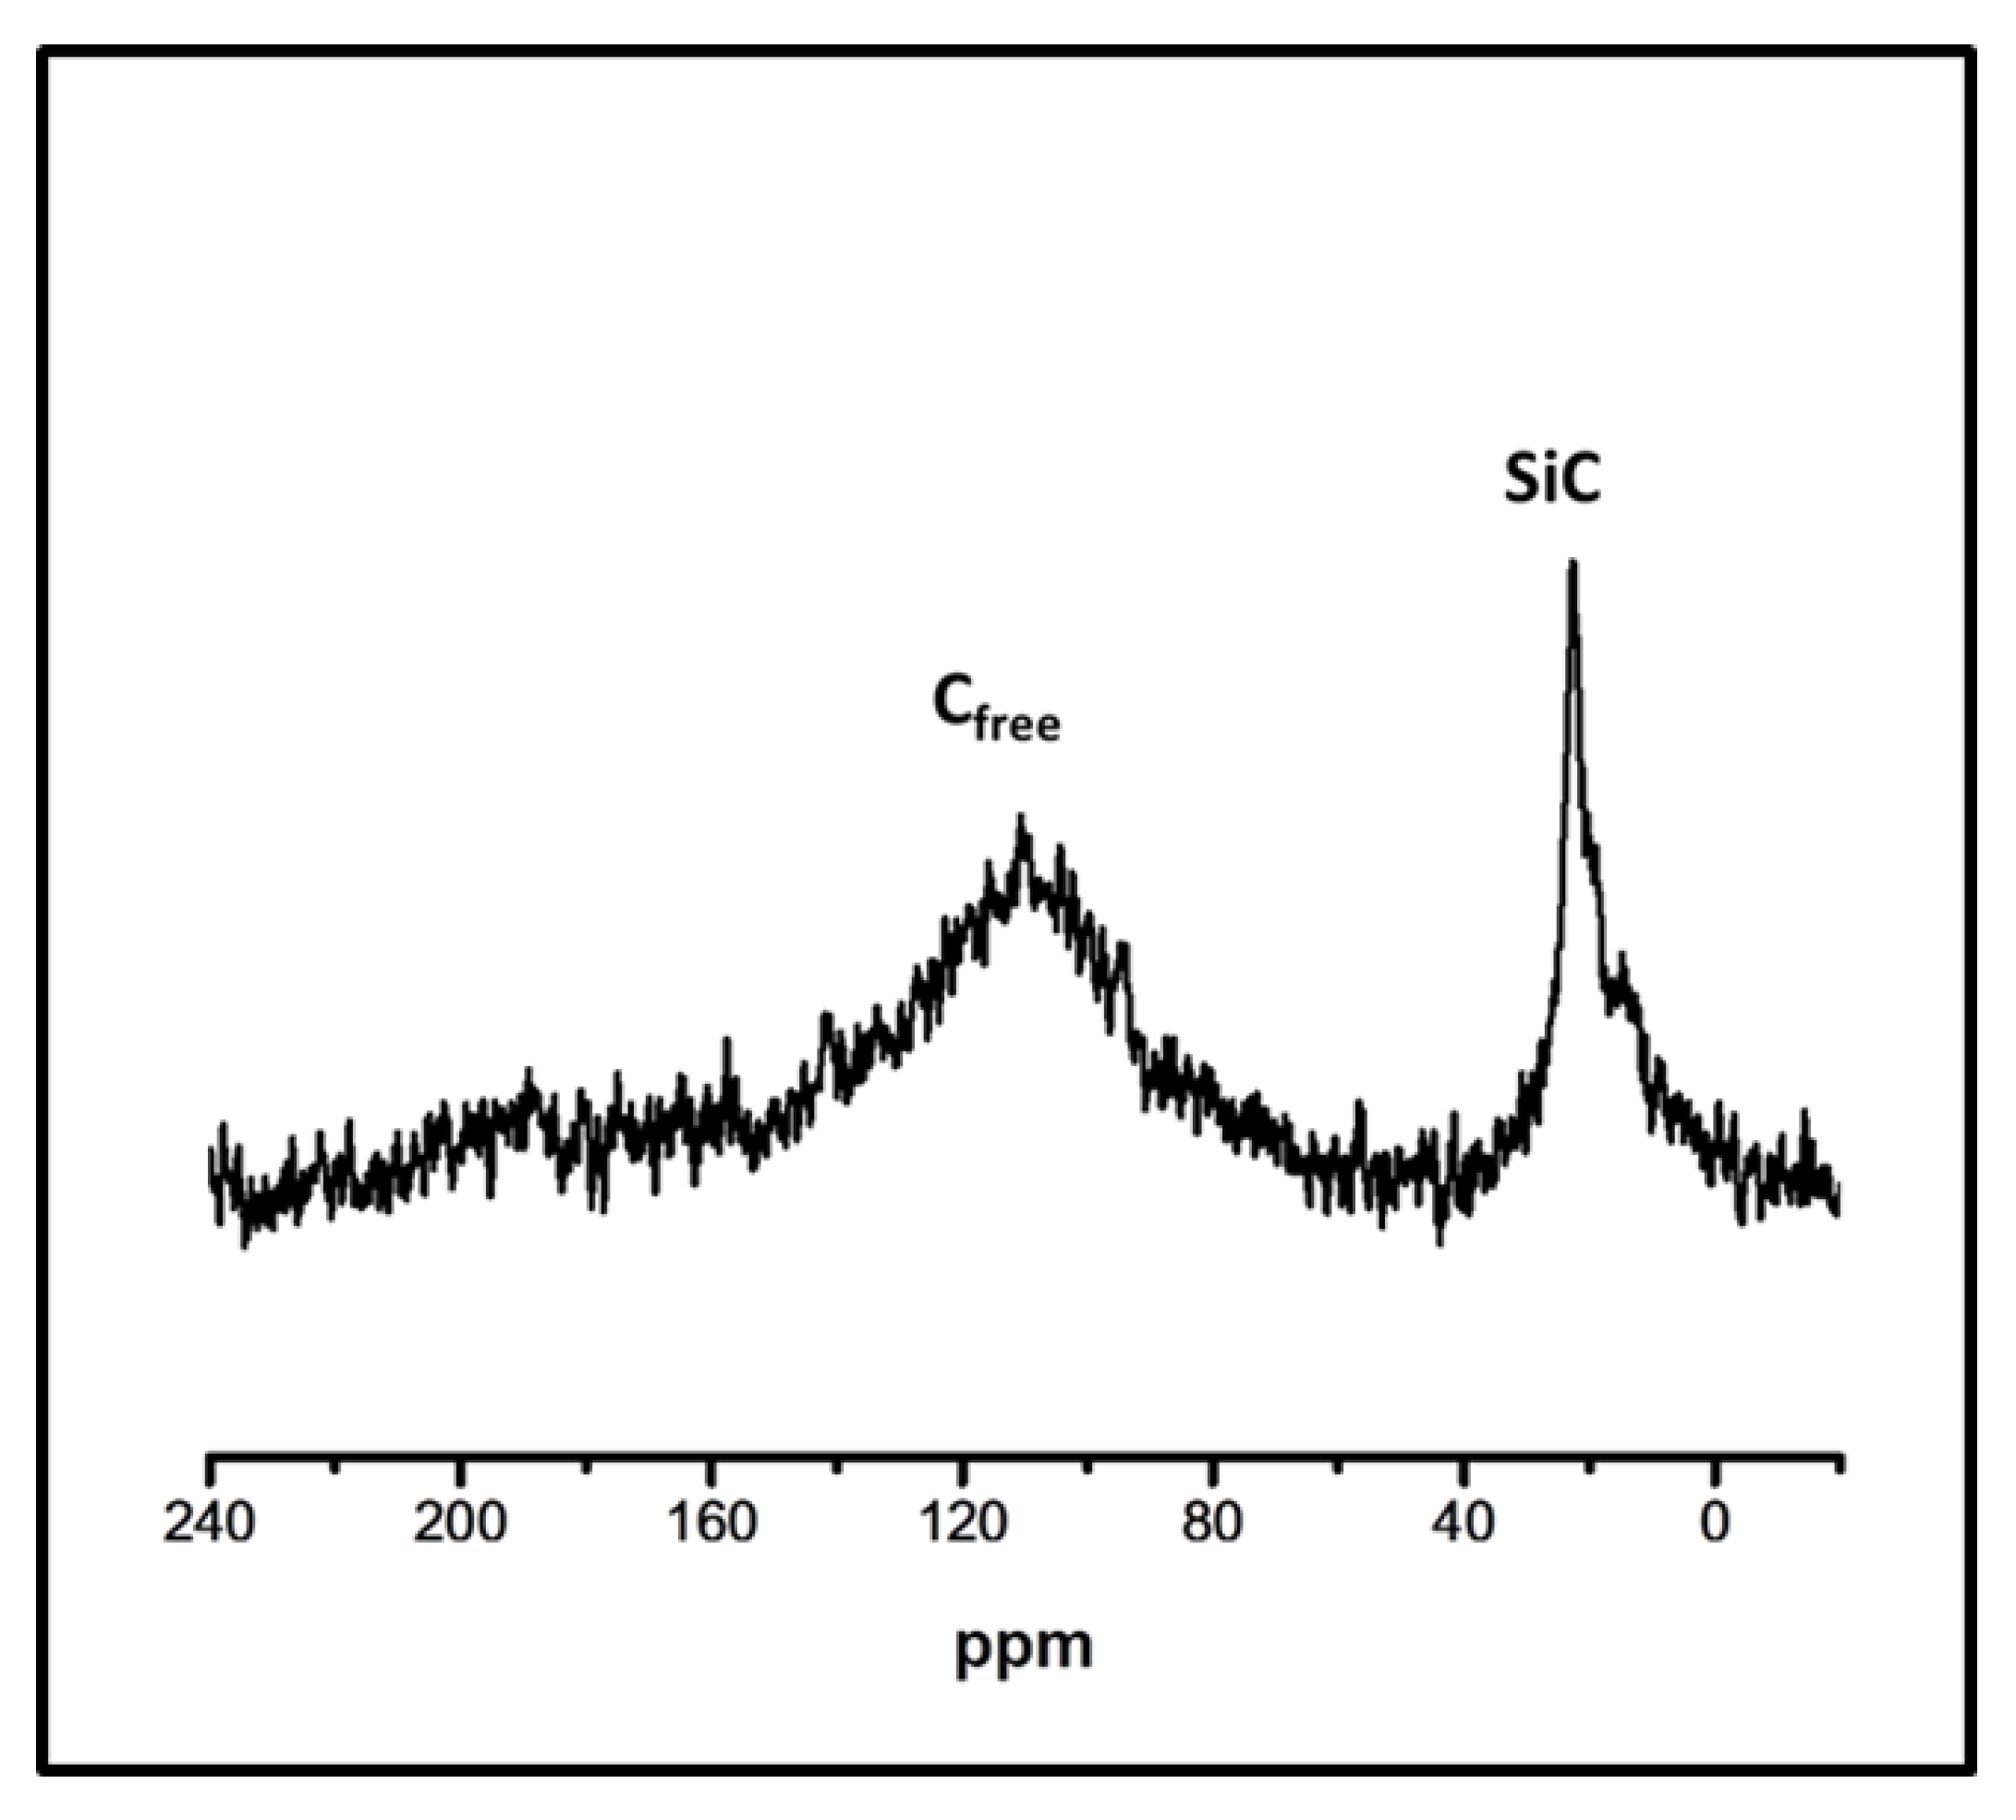
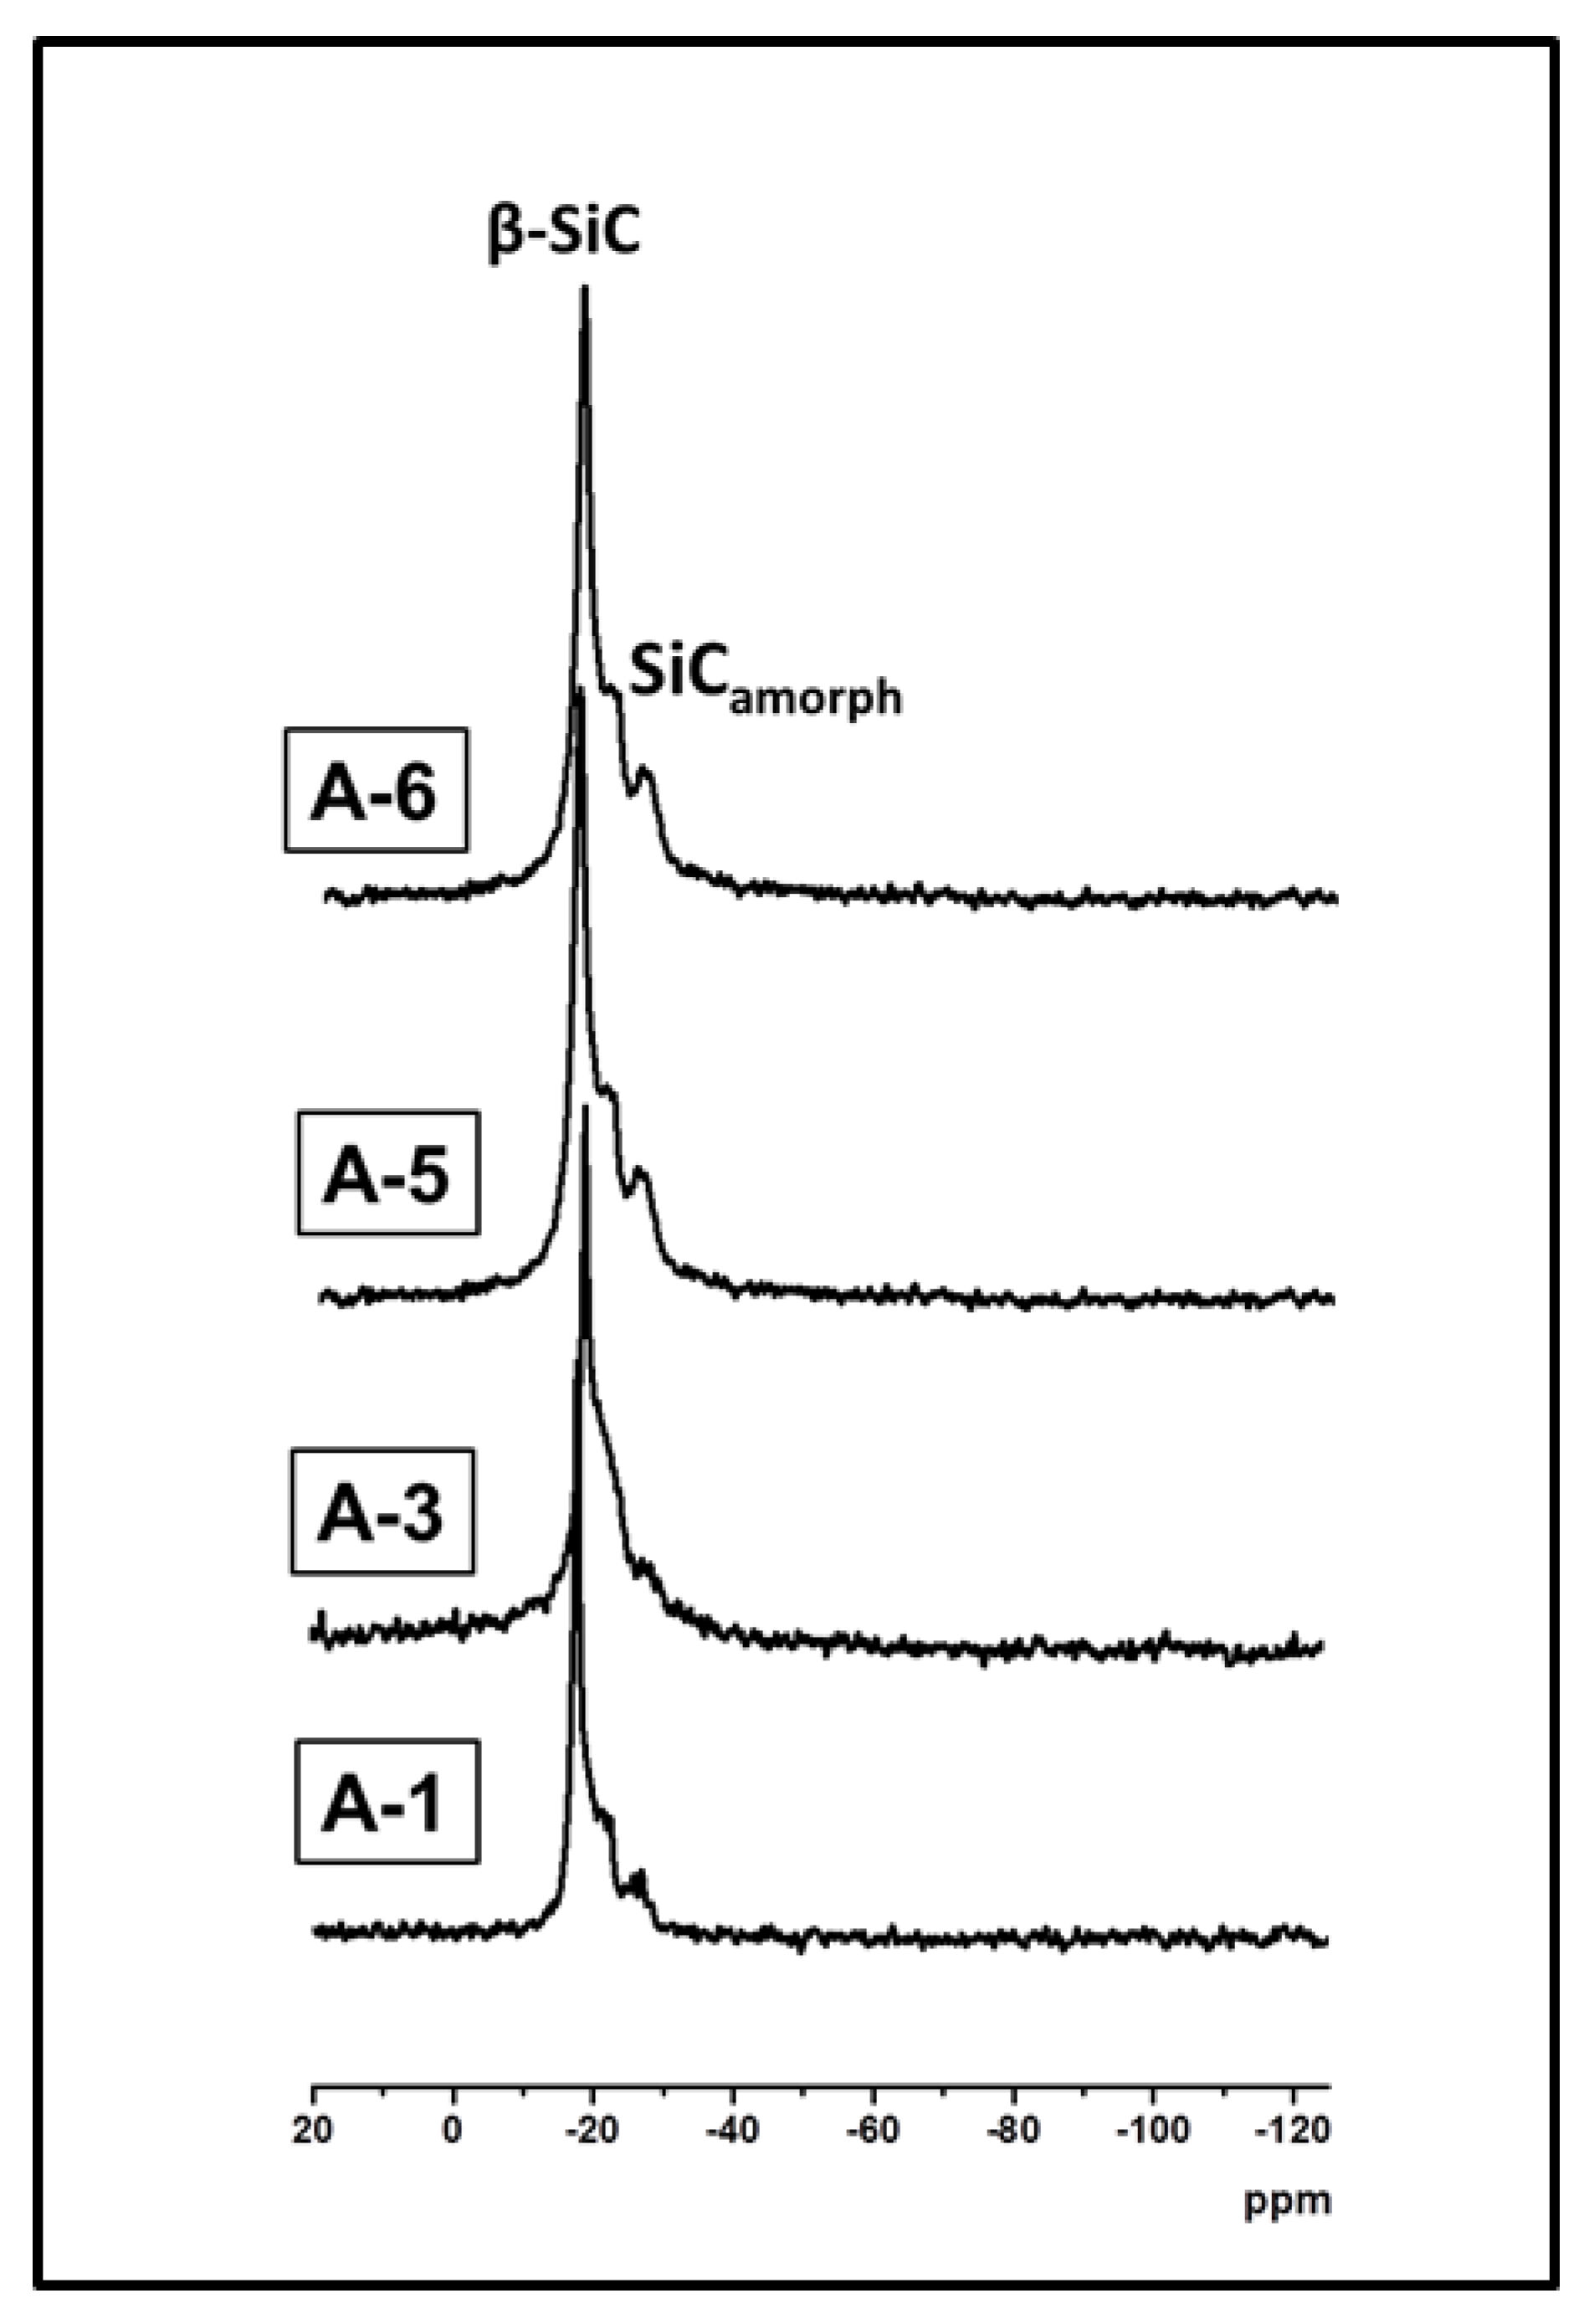
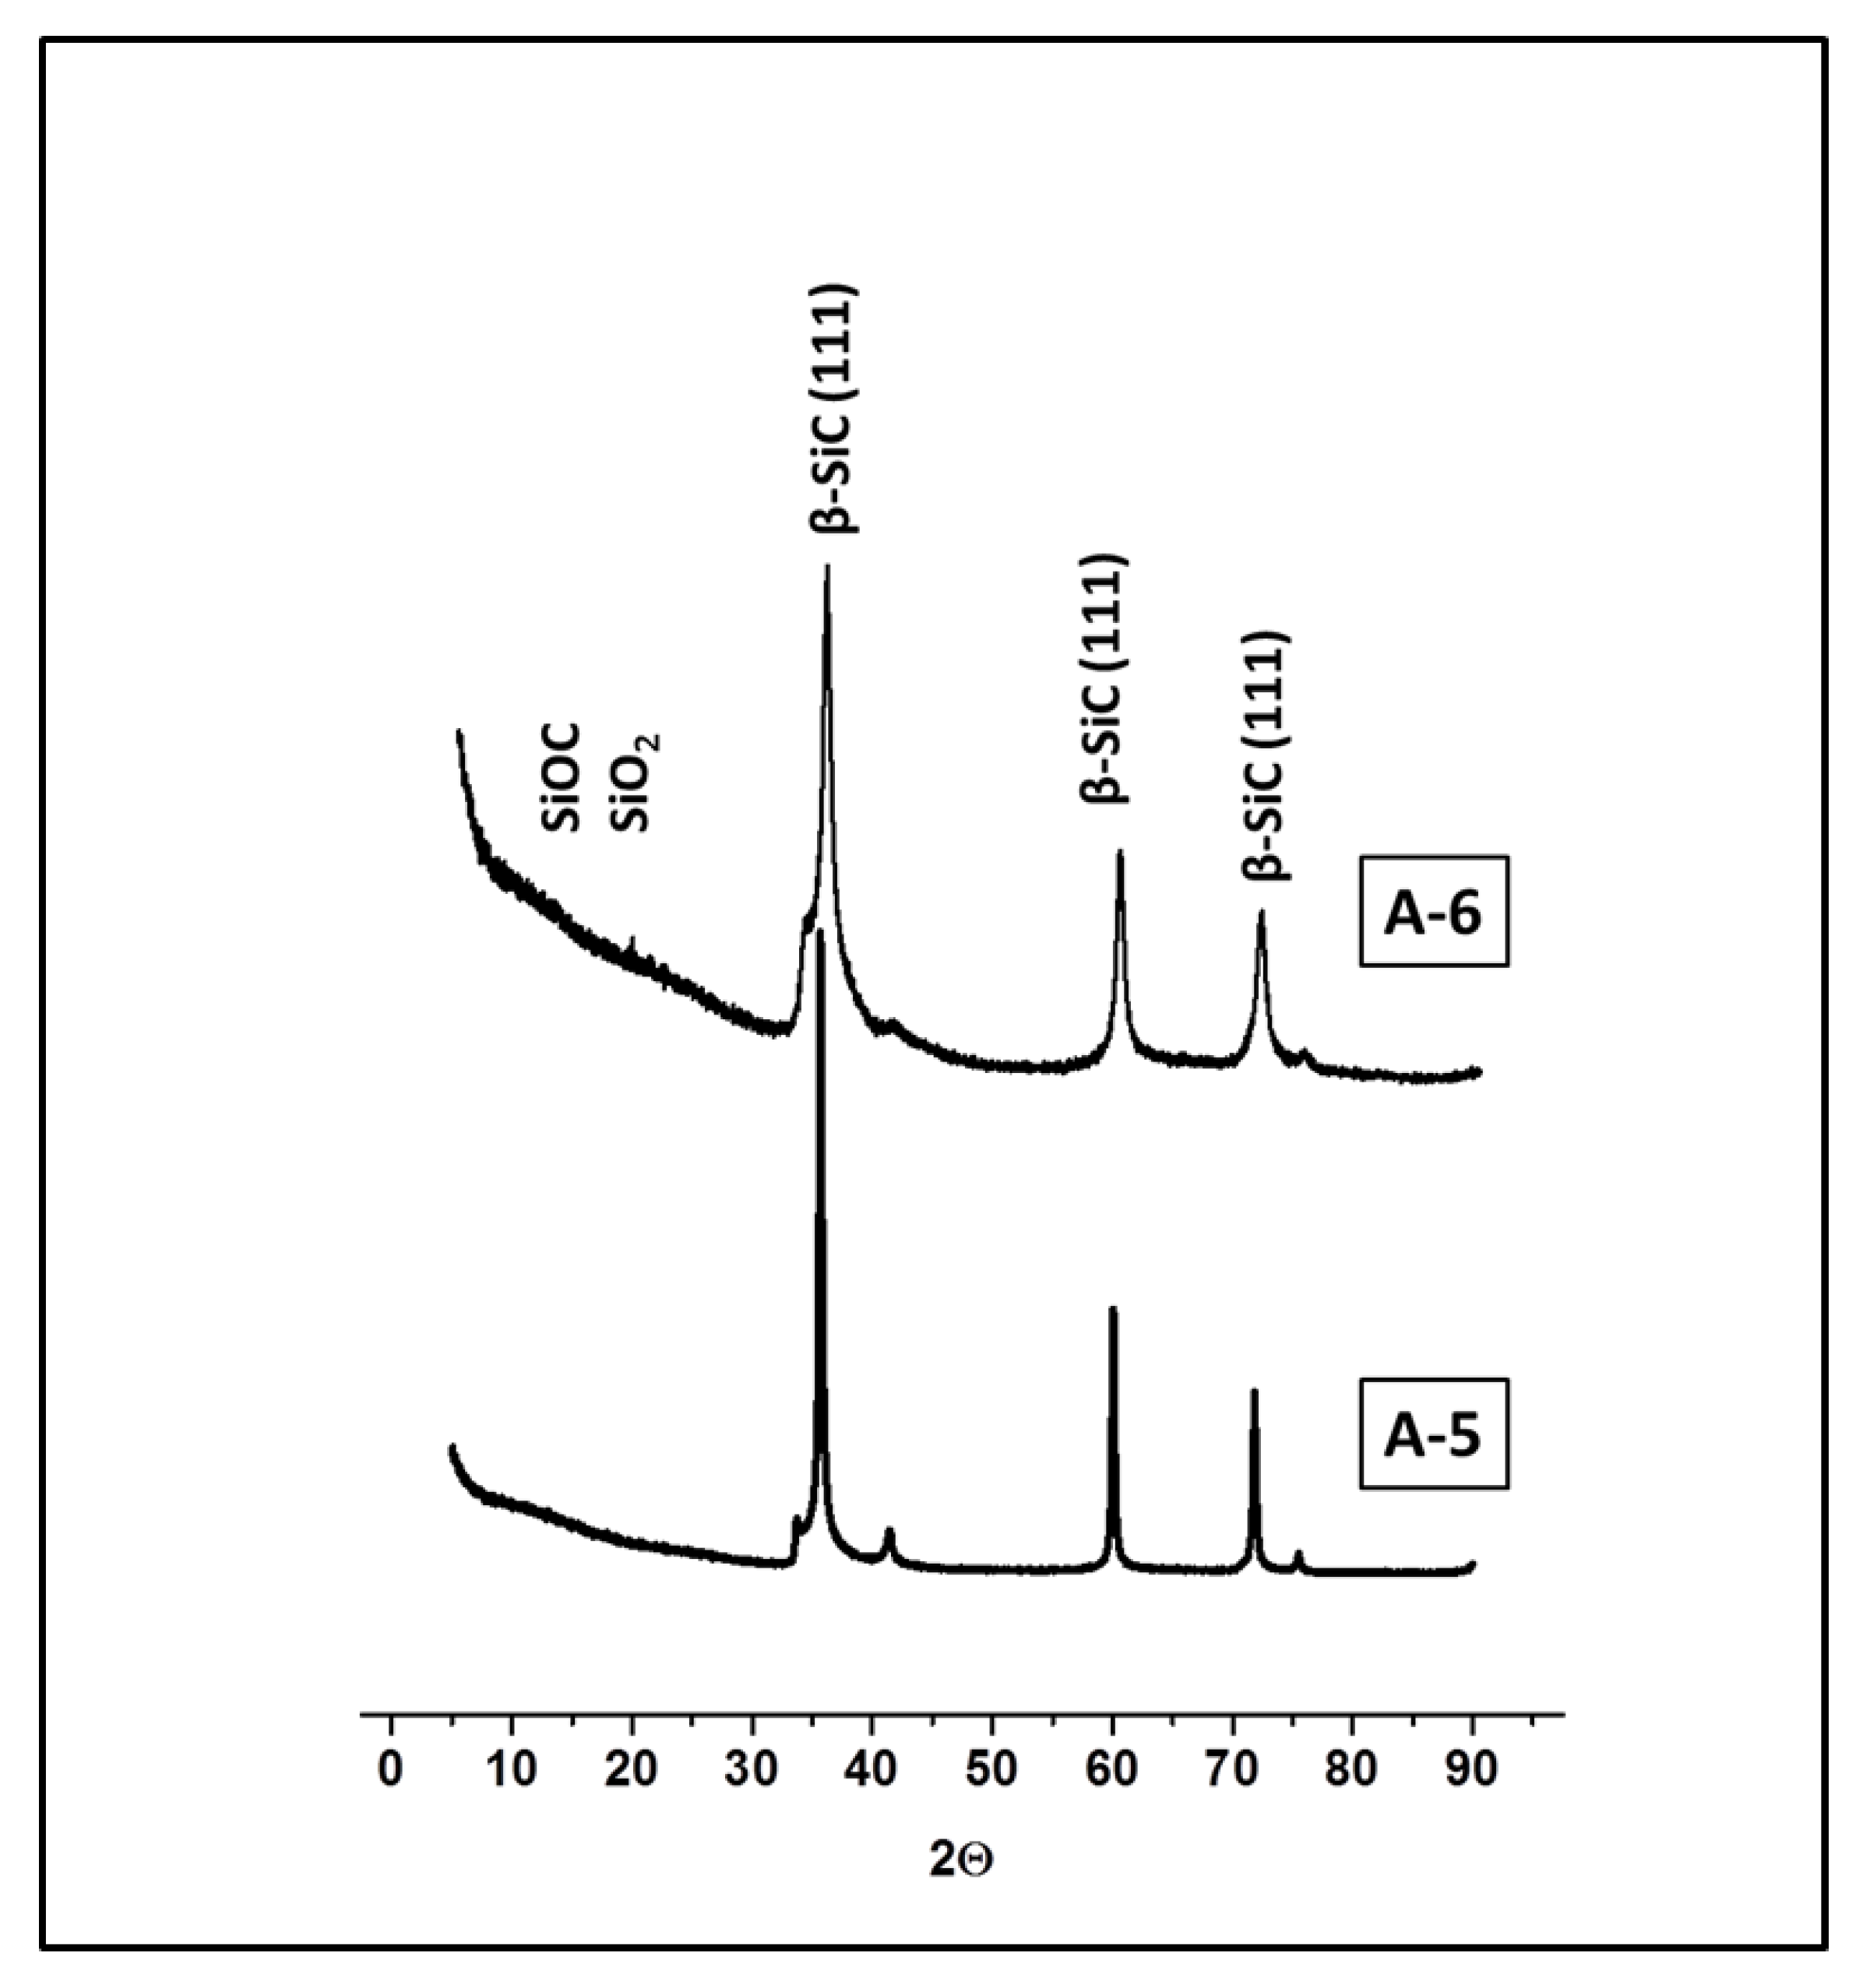
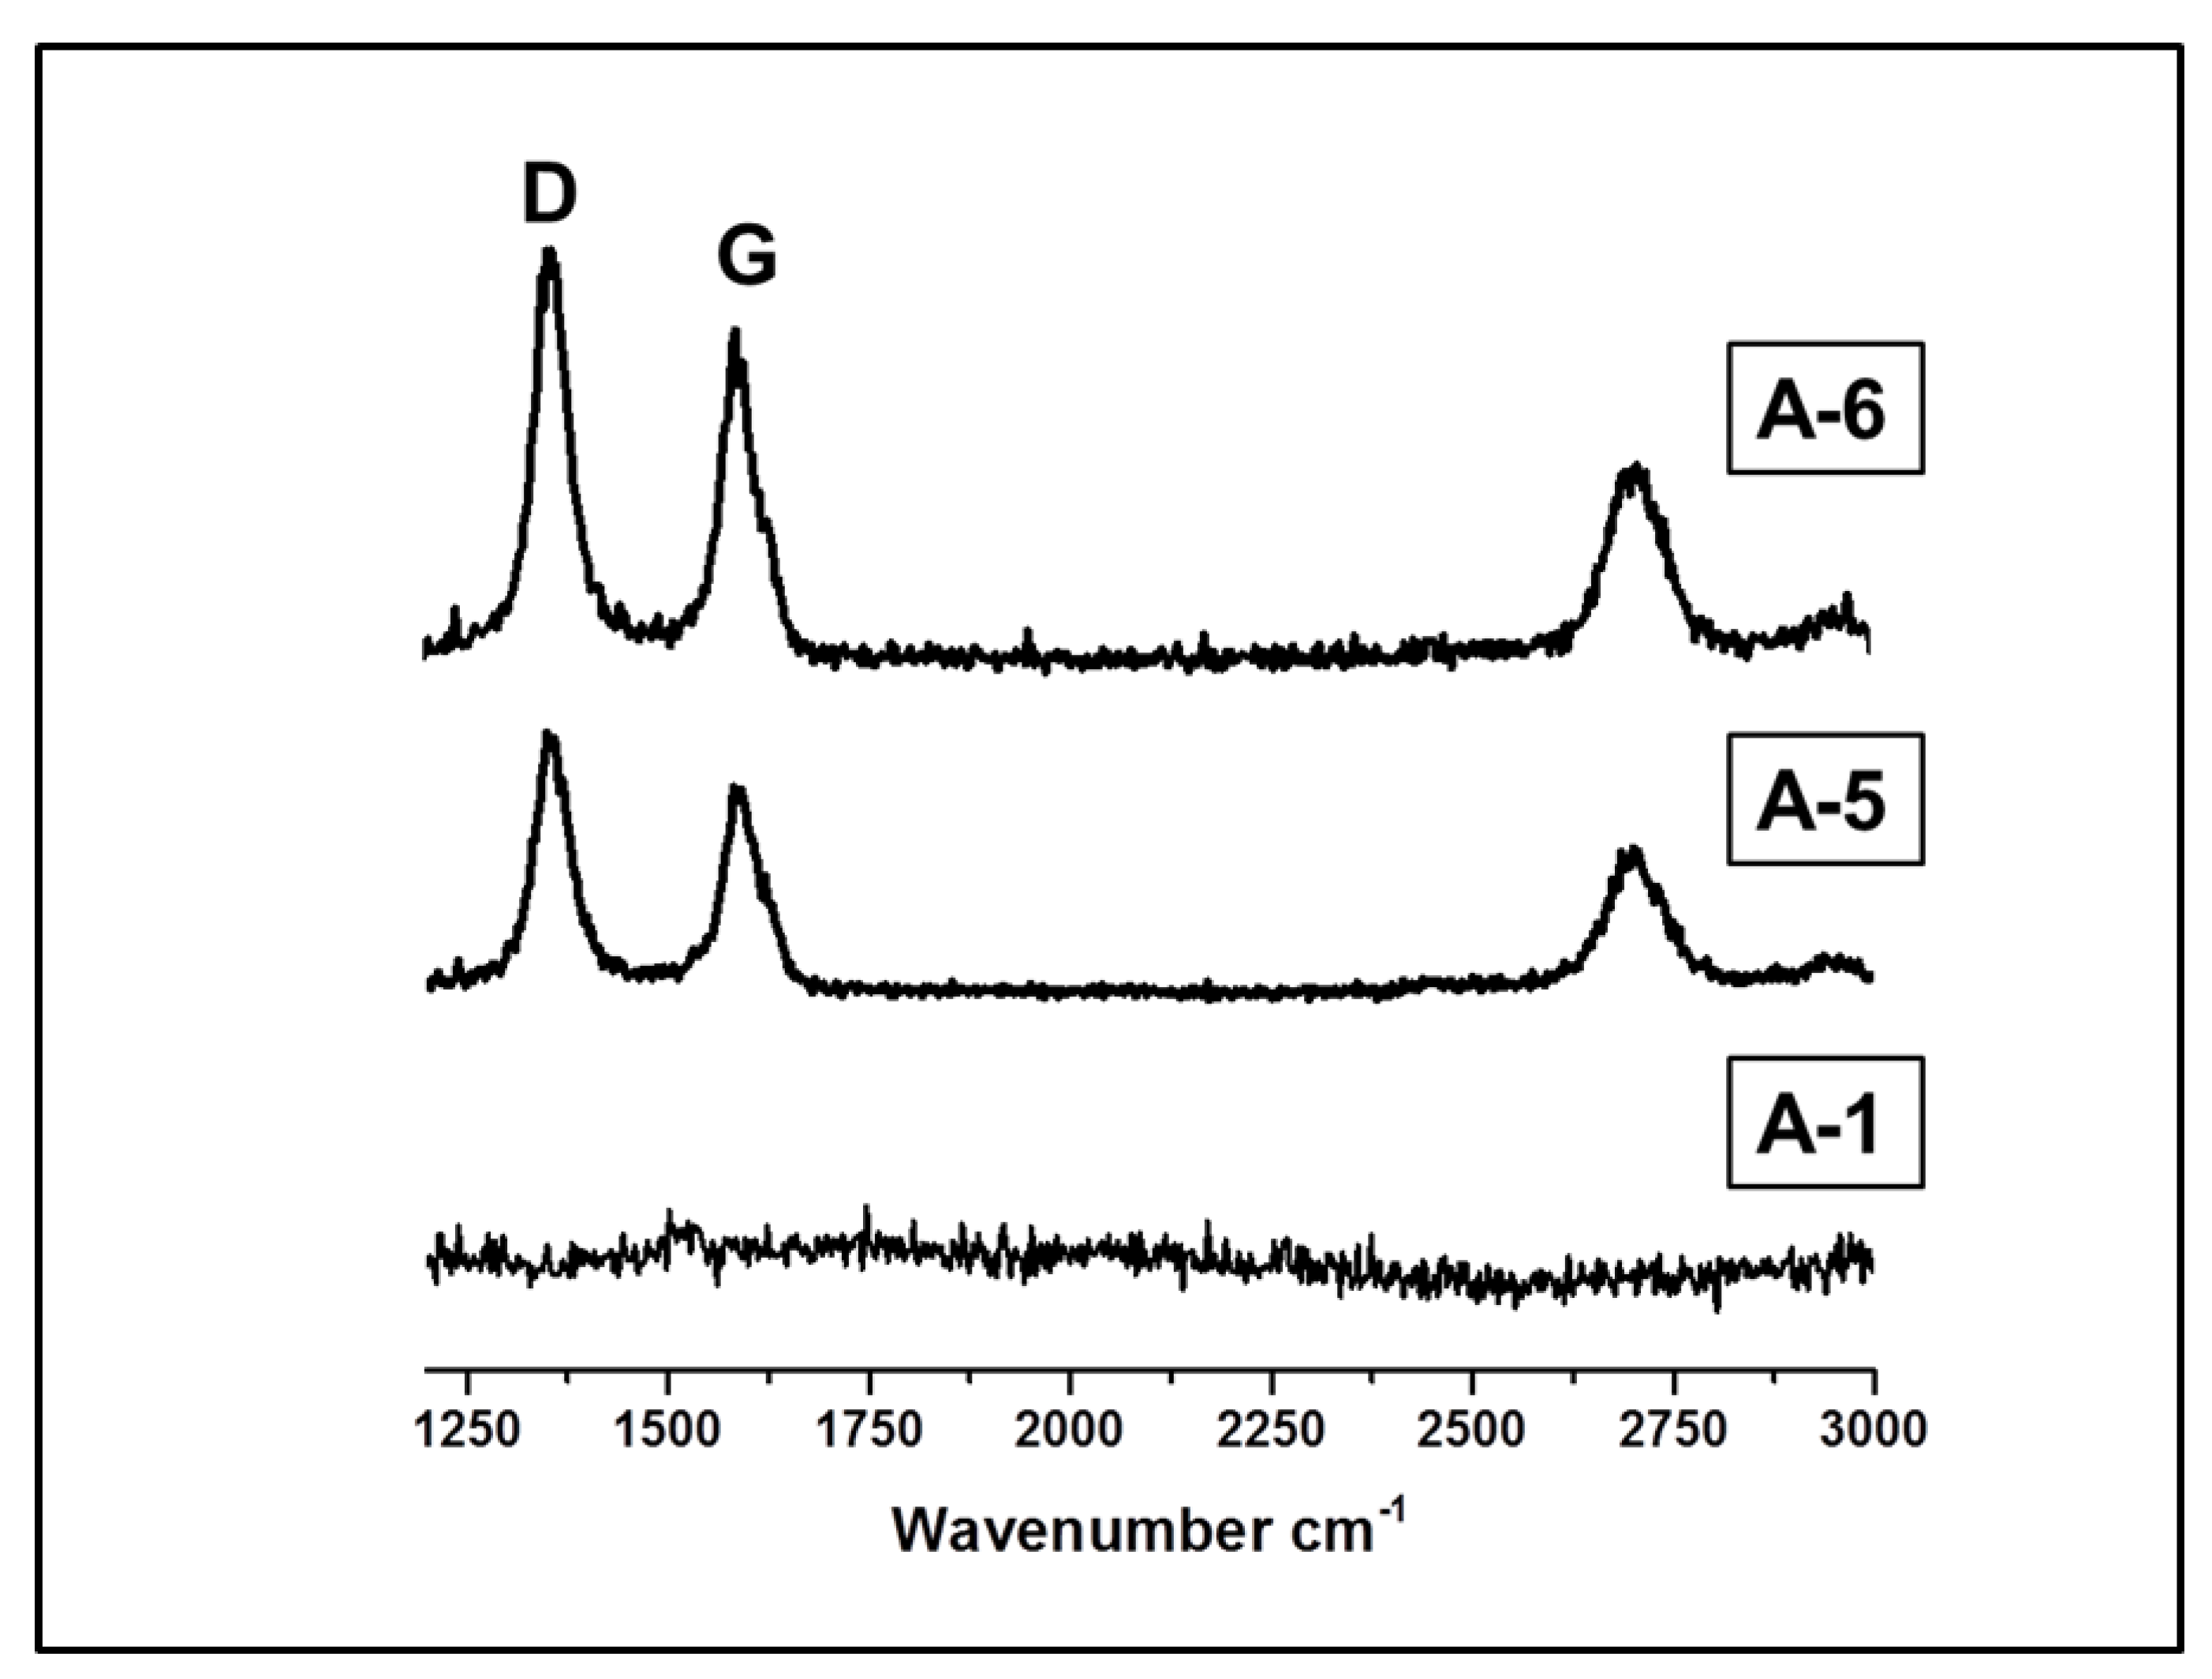
3.2. Ceramic SiC and SiC/Cf Microspheres

The precursor polysiloxane microspheres were subjected to ceramization in the atmosphere of argon at 1600 °C for 5 h. Micrographs of representative ceramic microspheres are displayed in Figure 3. The particles preserved spherical shape although their surfaces indicated the formation of macropores. The presence of macropores was confirmed by SEM, see Figure 3b,d,h. The ceramic yield for DVB cross-linked microspheres ranged from about 30 to 46.3%, while for the DVTMDS microspheres the yield was much lower, due to the small content of carbon, Table 2. A sharp increase in the yield of ceramics was observed when the weight ratio of DVB to PHMS was above 0.48, Figure 4. This increase in ceramic yield was accompanied by a change in color of the microspheres from beige-green to black, Table 2. The beige-green color is consistent with the presence of SiC [6], while the black color may indicate the presence of free carbon. These observations are consistent with the changes in the composition of the preceramic microspheres discussed earlier. Oxygen-rich siloxane particles are converted to amorphous SiCnOm ceramics with various content of carbon when heated above 900 °C. Subsequent heating of SiCnOm material to 1600 °C causes separation of SiO2, SiC and Cf phases, Equation (1), followed by a carbothermal reduction of SiO2 by the free carbon, Equation (2). However, when the amount of free carbon is low, it is completely consumed before all SiO2 is converted to SiC. Under these conditions, SiO2 reacts with SiC to form volatile SiO and CO according to Equation (3) [3,44,45]. The removal of oxygen from microspheres in the form of SiO significantly reduces the final ceramic yield. A particularly low yield is observed for the carbon-poor microspheres obtained from PHMS/DVTMDS, Table 3, sample B-1. The large amounts of gases released during the pyrolysis of these microspheres generate their high porosity, as described in paragraph 3.4 and crevices on their surfaces seen in Figure 3h.
2 SiO2(s) + SiC(s) ⟶ 3 SiO(g) + CO(g)
Obviously, the carbon-rich siloxane particles, which are formed when the w/w ratio of DVB to PHMS was above 0.48, are converted to SiC mainly by carbothermal reduction, Equation (2), leading to a higher yield of ceramic. These microspheres also contain residual free carbon.
The content of Cf in the SiC microspheres was determined by combustion at 800 °C in air by a thermogravimetric analyzer, TGA. The recorded maximum weight loss was taken as the content of free carbon, Table 2. The total carbon (Ctotal) content was determined by combustion of ceramic microspheres in oxygen in a tube furnace at 1200–1300 °C using the coulometric detection method, Table 2. The Cf content was calculated from the mass balance assuming that the sample contains only SiC, SiO2 and Cf, Table 2. Additionally, the elemental composition of the ceramic microspheres was confirmed by Scanning Electron Microscopy/Energy Dispersive X-ray Spectroscopy, SEM/EDS, (s.i. Table S2 and Figure S3). The obtained results are consistent with the TGA analysis and show that only ceramic microspheres were obtained from the aromatic carbon-rich siloxane particles, which are formed when the w/w ratio of DVB to PHMS was above 0.48, contain a significant amount of the free carbon, Figure 4. The aromatic carbon is also visible in the 13C NMR HPDec/MAS spectra, Figure 5. The spectra show a broad signal of sp2 carbon-centered at about 110 ppm belonging mostly to Cf and a sharp signal at 20 ppm of sp3 carbon originating mainly from SiC. The sp2 signal is enhanced by the NOE effect [46] thus the results have only qualitative meaning.
It is worth mentioning that polysiloxane microspheres obtained in our standard method [36] using 1,3-divinyltetramethyldisiloxane as crosslinker (Sample B-1) was subjected to the ceramization under the same conditions as other samples. The analysis showed that the ceramic SiC microspheres obtained in this way did not contain any Cf and the yield of the ceramization was very low, Table 2. These microspheres retained spherical shape and exhibited a high macroporosity, as it is discussed below.
The 29Si MAS NMR spectra of the ceramic microspheres shown in Figure 6 confirm the presence of SiC. The signal corresponding to SiO2 at −108 ppm was not detected. Signals of other oxygen-containing silicon tetrahedra were not detected either. These suggest that residual oxygen in the ceramic microspheres should be below 2 w%, which was confirmed by elemental analysis, Table 2. The only silicon species visible in these spectra are those originating from silicon carbide. It exists mainly in the crystalline form of β-SiC, which is confirmed by the presence of a sharp signal at −19 ppm. Broader signals ranging from −23 to −27 ppm can be attributed to the amorphous form of silicon carbide and other crystalline SiC polytypes.
Further information about the structure of the silicon carbide phase is provided by X-ray diffraction studies. The diffractograms for all samples are similar to each other and indicate the high crystallinity of the silicon carbide phase which appears as a β-SiC crystal structure. Results for representative samples are shown in Figure 7. The main diffraction peak, which is observed at 2θ equal 35.60°, is attributed to the cubic β-SiC (111) phase. Other diffraction peaks that appear at 2θ: 41.4° (200), 60° (220), 71.8° (311) and 75.5° (222) also originate from the 3C β-SiC phase. There are no peaks characteristic for hexagonal α-SiC phases at 43.3° and 45.3° [38,47]. The absence of a broad halo at 2θ between 15–30°, characteristic of the amorphous SiOC and SiO2 phases, also confirms that the residual oxygen content must be low.
Raman spectroscopy study provides information on the structure of the Cf phase. Representative spectra for microspheres with high amounts of DVB are displayed in Figure 8 and some results are summarized in Table 3. The spectra of microspheres cross-linked with smaller amounts of DVB (A-2 and A-3) are similar to A-1, they have no free carbon in their structures. The Raman spectra show a series of bands, the most prominent of which are disorder-induced band D about 1360 cm−1, a graphite-like band G around 1590 cm−1 and a D-overtone peak close to 2950 cm−1 which is also induced by disorder [48,49]. Two other bands are superimposed on the G band. The resolution of these overlapping bands using Gaussian–Lorenzian approach (Figure S4 in Supporting Info) allows the evaluation of ID/IG of the integrated D and G bands intensity ratio (Table 3) used to quantify the graphite network defects, which is a measure of the disorder in the Cf phase. The ratio is larger than 1, indicating a high degree of disorder in the Cf phase which forms graphitic-like domains. The average in-plane linear size of these domains (La) was calculated using the Tunistra–Koenig (TK) approach [50]. The obtained La values were within the range in which the validity of the TK approach was previously verified [51].

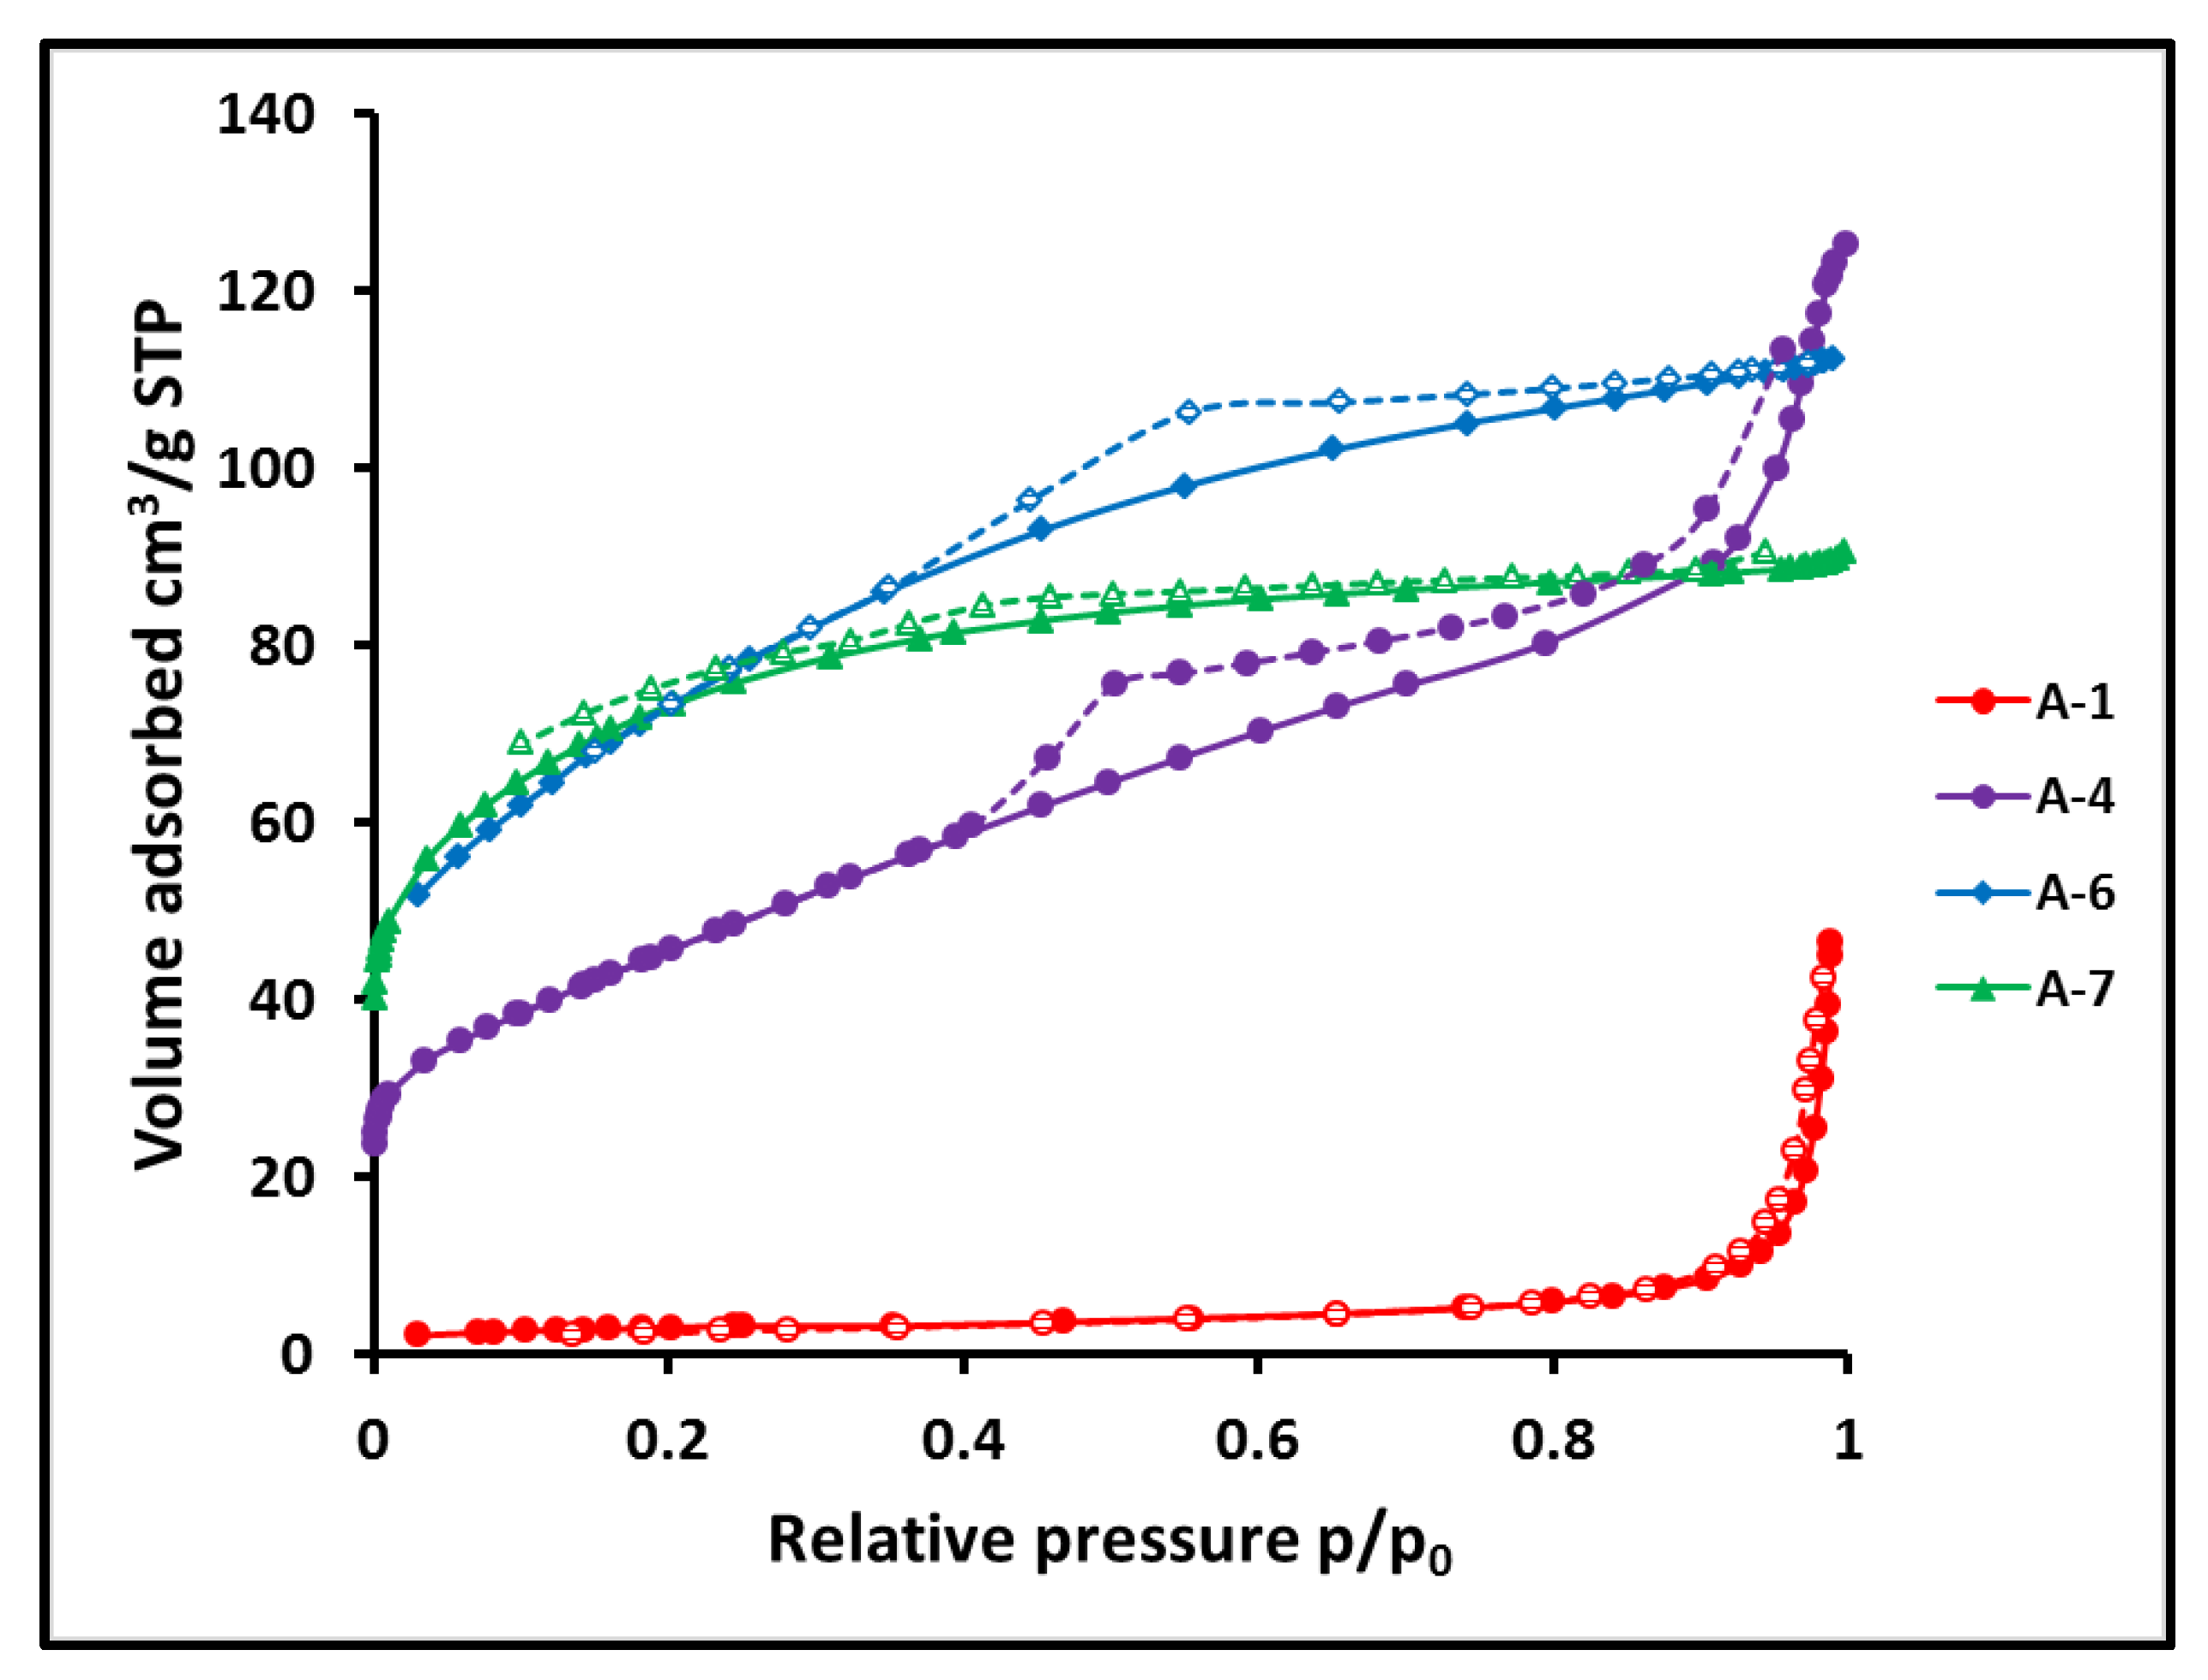
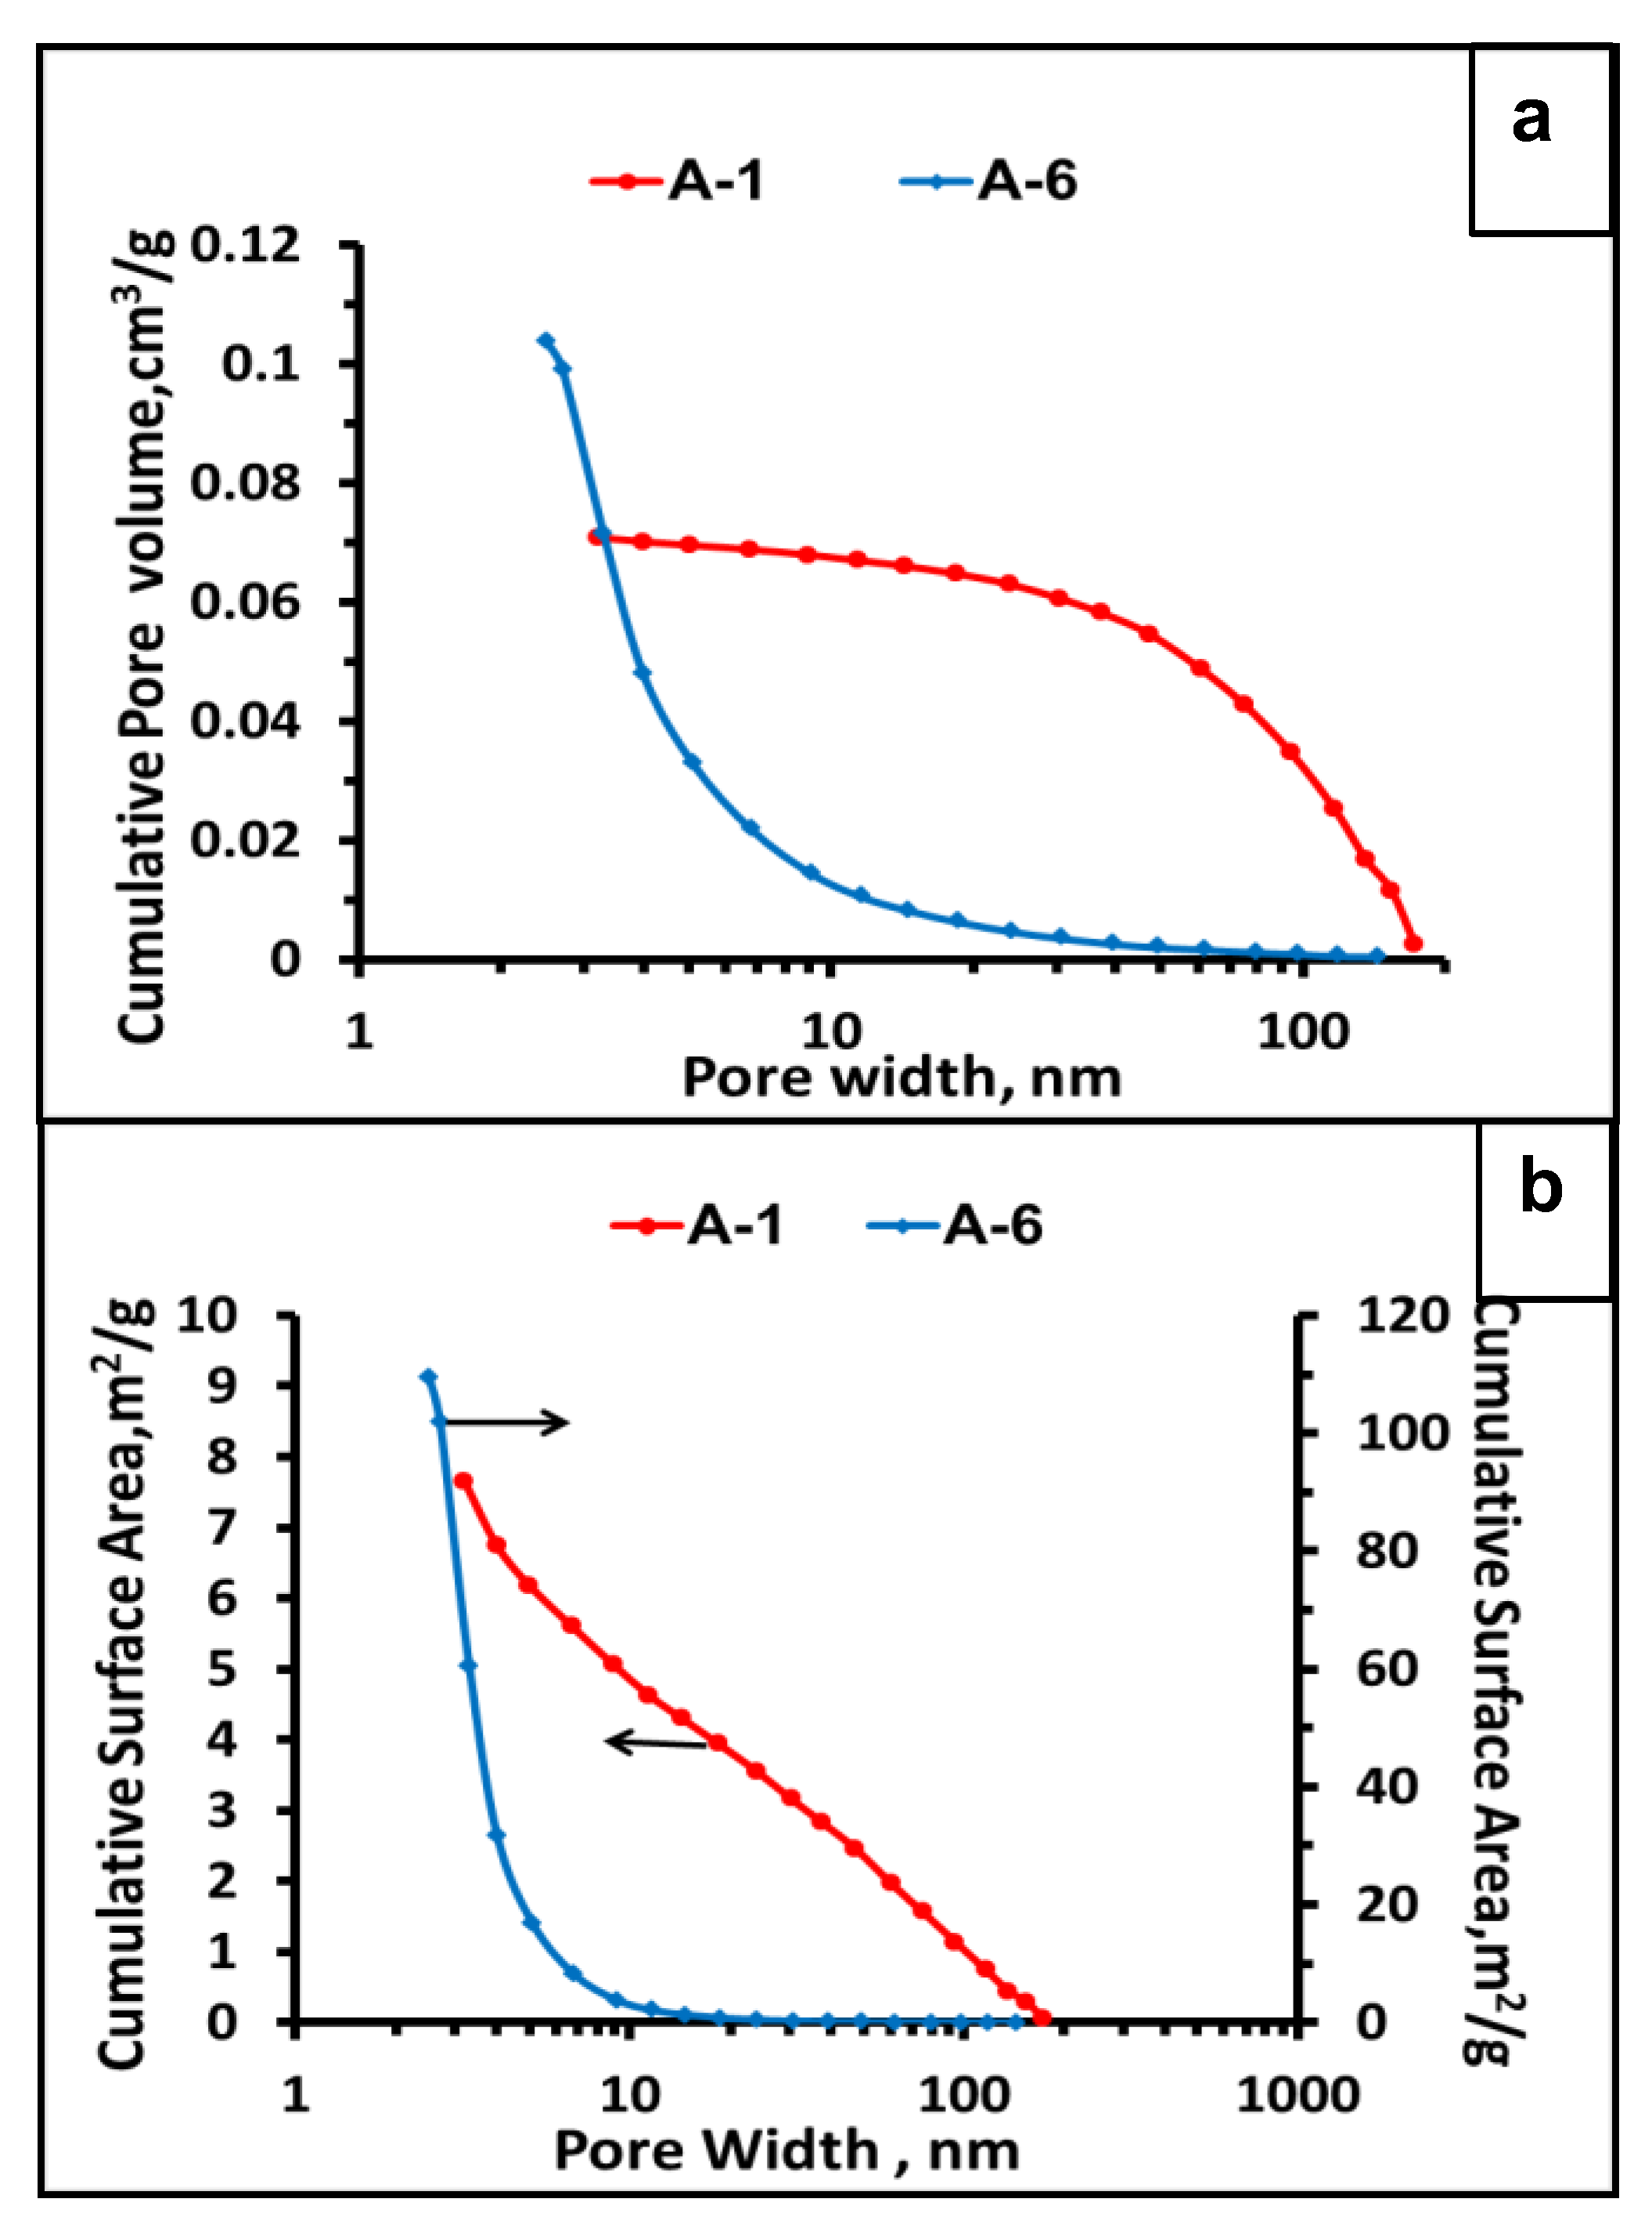
3.3. Porosity by N2 Adsorption

The microspheres had a hierarchical micro/meso/macroporous structure which was characterized by N2 gas porosimetry and mercury intrusion porosimetry. Nitrogen adsorption informs about meso and micropores, while mercury intrusion gives knowledge about macropores. The results obtained in the nitrogen adsorption studies are summarized in Table 4.
The proportions of the cross-linking agent used in the synthesis of the precursor particles have a great influence on the type of porosity of the SiC microspheres. Ceramic particles made of precursors obtained with a very high DVB content (A-6 and A-7), thus with a large content of Cf, are distinguished by a high specific surface area, SSA, which were 263 m2/g and 347 m2/g for samples A-6 and A-7, respectively. Average pore sizes were small, 2.62 nm in A-6 and 2.15 nm in A-7. The isotherms, shown in blue and green in Figure 9 for samples A-7 and A-6, respectively, have a concave shape facing the pressure coordinate, showing high nitrogen uptake at relatively low pressure. This indicates the high adsorption potential of these microspheres, which is characteristic of microspheres with narrow pores. This behavior is often observed in microporous materials [52,53]. A significant content of micropores is manifested in a large adsorbed volume at almost zero relative pressure. From the pore distribution shown in Figure 10a,b, it can be concluded that besides micropores these are mesopores with a width of 2 to 5 nm which mainly contribute to the porosity of sample A-6. The isotherm hysteresis of this sample shown in Figure 9 reflects this mesoporosity. Only a very small fraction of the pore volume is occupied by macropores.
Microspheres that were produced using a smaller amount of DVB, sample A-4, give different isotherms similar to those of type IV, according to the IUPAC classification [52] typical for mesoporous materials, Figure 9. In contrast to the microspheres with the highest Cf content, isotherms are convex with respect to the pressure coordinate in the range of 0.5 to 1 relative pressure. High nitrogen uptake occurs over a larger relative pressure range, see Figure 9. A characteristic feature of these isotherms is the hysteresis loop associated with the occurrence of pore condensation. The presence of the micropore fraction is manifested in the very steep shape of the initial part of the isotherm. The inflection points appear at the same beginning, about 0.015 P/P0, so they are only weakly marked. The microspheres without free carbon, samples A-11–A-3 and B-1, are represented by isotherms characteristic of a macroporous material with nitrogen uptake at a high relative pressure of 0.9–1. These isotherms are similar to each other so only this one of sample A-1 is displayed in Figure 9. The differences in the porosity of the microspheres are manifested in comparison to the distributions of their pore width. Plots of the cumulative pore volume as a function of pore width and as a function of pore surface area for microspheres containing low (A-1) and high (A-6) content of Cf are shown in Figure 10a,b. The corresponding plots for other samples are presented in supporting information (Figure S5). The micro and mesopores account for only about 25% of the pore volume of sample A-1 but constitute more than 95% of sample A-6 as deduced from Figure 10a.
Data in Table 4 reveal the variation in the BET area and in pore width. Samples A-1–A-3, which are free of Cf, show similar small BET surface area and similarly large pore width. Instead, there is high variability and a clear trend in the values of these parameters within Cf containing microspheres (samples A-4–A-7). The pore area increases with growing Cf content, while the pore width becomes smaller. Additional experiments were performed to closer explain this behavior. The sample A-7, the one with the highest content of Cf, was subjected to heating in the air atmosphere for 3 h at 800 °C. Elemental analysis confirmed full removal of Cf. N2 adsorption porosimetry disclosed isotherm characteristics for mesoporous material. This sample contained mostly mesopores and very few micropores. Its SSA value decreased from 347 to 121 m2/g. This result clearly indicated that the generation of micropores is associated with the formation of the Cf phase. The air-heated sample was subsequently treated with concentrated HF solution. The specific surface area was slightly smaller, but the volume and width of the pores were significantly increased, see Table 4. During the heating of the microspheres in air, a quantity of SiO2 was formed which was confirmed by 29Si NMR MAS spectroscopy (Figure S6) showing a broad peak at −110 ppm. Most likely the oxidation took place on the wall of pores where the SiO2 layer was formed. This layer was removed by HF treatment.

3.4. Porosity by Mercury Intrusion

The results of the mercury intrusion studies are summarized in Table 5 and differential intrusion as a function of pressure and pore size for selected microsphere samples are displayed in Figure 11.
Uptake of mercury into interparticle voids occurs in the pressure range of 0–200 psi for most microspheres samples. As demonstrated in Figure 11, the intrusion into this volume is distinctly separated from the penetration into the pores of the microspheres, which allows for determining the characteristics of the pores. The results of mercury intrusion are not comparable with the results of N2 adsorption because micropores and a substantial volume of small mesopores are not penetrated by mercury. On the other hand, larger macropores escape the measurement of N2 adsorption. Instead, mercury intrusion gives full information about macroporosity. The open macropores occupy a large volume of the microspheres obtained with a small amount of DVB cross-linker, thus not containing Cf. Sample A-1 shows an average pore width of 83 nm with an average SSA of 24.1 m2/g. The open porosity of the sample, calculated from the pore intrusion and skeletal density, is about 50%, however, the true value must be greater as a significant volume of open micro and mesopores are not intruded. The skeletal density of this sample is 2.03 g/cm3 compared to 3.21 g/cm3 for pure SiC, which reveals a large volume of non intruded pores, a substantial part of them may be open. Sample A-3 obtained using a moderate amount of DVB shows a large number of open macropores in the relatively narrow pore width range of 50–120 nm. In contrast, the microspheres A-5 obtained with a large amount of DVB used in the synthesis of the SiC precursor show very little mercury intrusion and almost no macroporosity. The intrusion to microspheres A-6 and A-7 was too small to be measured with reliable precision. Although the N2 sorption measurement of these microspheres gave a very high BET surface area but the average diameter of pores was very small. Their probable bottle-type shape may additionally hinder the mercury intrusion.

4. Conclusions

We demonstrated that porous SiC and SiC/Cf ceramic microspheres can be obtained by a simple and inexpensive method from PHMS cross-linked with DVB polysiloxane microspheres. The polysiloxane microspheres were converted to the ceramic material by pyrolysis under conditions where thermal reduction removes oxygen from the ceramics. The weight ratio of DVB to PHMS used in the synthesis of preceramic particles controls the final composition of the ceramic microspheres. Ceramization of the siloxane microspheres obtained at a DVB/PHMS weight about a ratio higher than 0.5 leads to SiC material containing free sp2 carbon SiC/Cf. SiC microspheres without Cf are obtained at the DVB/PHMS weight ratio of less than 0.5, but at the expense of ceramic yields. In this case, some oxygen remains after all Cf has been used up in the carbothermal reduction process. This oxygen is mainly removed as gaseous SiO formed by the reaction of SiO2 with SiC, which reduces the yield of ceramics. The thermal reduction process causes the formation of porosity in the ceramic microspheres, the nature of which depends on the content of the cross-linking agent in the preceramic particles. The SiC/Cf micro/mesoporous material is produced from siloxane particles obtained at a higher DVB/PHMS weight ratio. On the other hand, hierarchical macro/mesoporosity is generated in SiC microspheres obtained from siloxane microspheres obtained with a lower DVB content. The ceramic SiC phase mostly has a β-SiC crystalline structure, while the free carbon phase is in the form of a disordered graphitic structure.

Supplementary Materials

The following are available online at https://www.mdpi.com/article/10.3390/ma15010081/s1, Figure S1: Micrographs of preceramic siloxane microspheres obtained at different DVB/SiH weight ratio: (a) PA-1, (b) PA-3, (c) PB-1, (d) PA-6, Figure S2. Distribution of sizes of preceramic siloxane microspheres: (a)—PA-1, (b)—PA-3, (c)—PB-1, (d)—PA-6, Figure S3. Example of SEM/EDS spectrum of ceramic microspheres: sample A-6, Figure S4. Example of Raman spectrum of the SiC/Cf ceramic microspheres—sample A-5 DVB/HMPS w/w = 0.80, the resolution of the overlapping bands was made using Gaussian–Lorentzial approach, Figure S5. Cumulative plots of the distribution of pore width: (a) by pore volume, (b) by pore surface, Figure S6. 29Si MAS NMR spectrum of ceramic microspheres A-7 after heating in air at 800 °C for 3 h, Table S1: Spectroscopic characterization of the preceramic microspheres obtained by homogenization at 7500 rpm for 90 s, Table S2. Elemental composition of the ceramic microspheres determined by SEM/EDS.

Author Contributions

Conceptualization, J.C., S.R. and U.M.; methodology, J.C. and U.M.; synthesis, U.M. and W.F.; acquisition of data, J.Z., W.F., A.N.-M. and I.B.-S.; analysis, W.F., J.Z., A.N.-M. and I.B.-S.; interpretation of data, J.C., S.R. and U.M.; writing—original draft preparation, J.C. and S.R.; writing—review and editing, U.M.; supervision, S.R.; project administration, U.M.; funding acquisition, U.M.; All authors have read and agreed to the published version of the manuscript.

Funding

The financial support from NCN grant 2019/03/X/ST5/00182 is highly appreciated. N2 adsorption–desorption experiments were performed on the apparatus ASAP 2020 Plus (Micrometrics) purchased under the Regional Operational Program for the Lodz region, RPLD.01.01.00-10-0008/18.

Institutional Review Board Statement

Not applicable.

Informed Consent Statement

Not applicable.

Acknowledgments

The authors would like to thank Michał Kubecki and the team of the Analytical Chemistry research group from the Institute for Ferrous Metallurgy in Gliwice, Łukasiewicz Research Network, Poland for determining the content of carbon and oxygen in samples of ceramized microspheres. The authors are also grateful to Grzegorz Machowski from the Faculty of Geology, Geophysics and Ecology, AGH University of Science and Technology in Cracow for his help in the interpretation of the results of the mercury intrusion porosimetric determinations.

Conflicts of Interest

The authors declare no conflict of interest.

References

  1. Naslain, R.R. SiC matrix composites: Tough ceramics for thermostructural applications in different fields. In Engineered Ceramics: Current Status and Future Prospects, Part II Advanced Ceramics and Matrix Composites; Ohji, T., Singh, M., Eds.; American Ceramic Society and John Wiley & Sons, Inc.: Hoboken, NJ, USA, 2016; pp. 142–159. [Google Scholar] [CrossRef]
  2. Kimoto, T.; Cooper, J.A. Fundamentals of Silicon Carbide Technology: Growth, Characterization, Devices, and Applications; John Wiley & Sons: Singapore, 2014; pp. 1–37. [Google Scholar]
  3. Khodaei, M.; Yaghobizadeh, O.; Alhosseini, S.H.N.; Esmaeeli, S.; Mousavi, S.R. The effect of oxide, carbide, nitride and boride additives on properties of pressureless sintered SiC: A review. J. Eur. Ceram. Soc. 2019, 39, 2215–2231. [Google Scholar] [CrossRef]
  4. Ionescu, E.; Bernard, S.; Lucas, R.; Kroll, P.; Ushakov, S.; Navrotsky, A.; Riedel, R. Polymer-Derived Ultra-High Temperature Ceramics (UHTCs) and Related Materials. Adv. Eng. Mater. 2019, 21, 1900269. [Google Scholar] [CrossRef] [Green Version]
  5. Murayama, N.; Hirao, K.; Sando, M.; Tsuchiya, T.; Yamaguch, H. High-temperature electro-ceramics and their application to SiC power modules. Ceram. Int. 2018, 44, 3523–3530. [Google Scholar] [CrossRef]
  6. Abderrazak, H.; Hmida, E.S.B.H. Silicon carbide: Synthesis and properties. In Properties and Applications of Silicon Carbide; InTECH: Rijeka, Croatia, 2011; pp. 361–388. [Google Scholar]
  7. Naglieri, V.; Colombo, P. Ceramic microspheres with controlled porosity by emulsion-ice templating. J. Eur. Ceram. Soc. 2017, 37, 2559–2568. [Google Scholar] [CrossRef]
  8. Sun, D.; Chen, F.; Gao, Y.; Wang, Y. Synthesis of cross-linked polymer microspheres and pyrolysis conversion to polymer-derived ceramics. Int. J. Appl. Ceram. Technol. 2017, 14, 992–998. [Google Scholar] [CrossRef]
  9. Zhang, X.; Chen, L.; Luo, C.; Kong, J. Polymer-derived ceramic microspheres with controlled morphology via novel phase separation-assisted pyrolysis. J. Am. Ceram. Soc. 2016, 99, 1485–1493. [Google Scholar] [CrossRef]
  10. Kang, W.; Liu, H.; Li, J.; Hu, S.; Zhou, C. Fabrication of size-controlled SiC/Si3N4 ceramic microspheres with enhanced extinction property. Ceram. Int. 2015, 41, 10775–10781. [Google Scholar] [CrossRef]
  11. Feng, Y.; Yu, Z.; Schuch, J.; Tao, S.; Wiehl, L.; Fasel, C.; Jaegermann, W.; Riedel, R. Nowotny phase Mo3+2xSi3C0.6 dispersed in a porous SiC/C matrix: A novel catalyst for hydrogen evolution reaction. J. Am. Ceram. Soc. 2019, 103, 508–519. [Google Scholar] [CrossRef] [Green Version]
  12. Keller, N.; Pham-Huu, C.; Roy, S.; Ledoux, M.J.; Estournes, C.; Guille, J. Influence of the preparation conditions on the synthesis of high surface area SiC for use as a heterogeneous catalyst support. J. Mater. Sci. 1999, 34, 3189–3202. [Google Scholar] [CrossRef]
  13. Krasnyi, B.L.; Ikonnikov, K.I.; Vartanyan, M.A.; Rodimov, O.I. Preparation of Porous Permeable Ceramic Based on Silicon Carbide for Hot Flue Gas Filtration. Refract. Ind. Ceram. 2019, 60, 355–361. [Google Scholar] [CrossRef]
  14. Ghavami, R.; Salimi, A.; Navaee, A. SiC nanoparticles-modified glassy carbon electrodes for simultaneous determination of purine and pyrimidine DNA bases. Biosens. Bioelectron. 2011, 26, 3864–3869. [Google Scholar] [CrossRef]
  15. Cuiyan, L.; Zhao, X.; Haibo, O.; Liyuan, C.; Jianfeng, H.; Yijun, L. Preparation, Adsorption Properties and Microwave-Assisted Regeneration of Porous C/SiC Ceramics with a Hierarchical Structure. Appl. Compos. Mater. 2020, 27, 131–148. [Google Scholar] [CrossRef]
  16. Shcherban, N.D.; Filonenko, S.M.; Yaremov, P.S.; Sergiienko, S.i.A.; Ilyin, V.G.; Murzin, D.Y. Carbothermal synthesis of porous silicon carbide using mesoporous silicas. J. Mat. Sci. 2017, 52, 3917–3926. [Google Scholar] [CrossRef]
  17. Pastila, P.H.; Helanti, V.; Nikkila, A.P.; Mantyla, T.A. Effect of Crystallization on Creep of Clay Bonded SiC filters. Ceram. Eng. Sci. Proc. 1998, 19, 37–44. [Google Scholar] [CrossRef]
  18. Fukushima, M.; Zhou, Y.; Yoshizawa, Y.I. Fabrication and microstructural characterization of porous SiC membrane supports with Al2O3–Y2O3 additives. J. Membr. Sci. 2009, 339, 78–84. [Google Scholar] [CrossRef]
  19. Wang, Y.; Xiao, P.; Zhou, W.; Luo, H.; Li, Z.; Chen, W.; Li, Y. Microstructures, dielectric response and microwave absorption properties of polycarbosilane derived SiC powders. Ceram. Int. 2018, 44, 3606–3613. [Google Scholar] [CrossRef]
  20. Mahmoodi, M.; Ghazanfari, L. Fundamentals of biomedical applications of biomorphic SiC. In Silicon Carbide Synthesis and Properties; InTECH: Rijeka, Croatia, 2011; pp. 297–343. [Google Scholar]
  21. Zhang, Q.; Gou, Y.; Wang, J.; Wang, H.; Jian, K.; Wang, Y. Preparation and characterization of polymer-derived Zr/Si/C multiphase ceramics and microspheres with electromagnetic wave absorbing capabilities. J. Eur. Ceram. Soc. 2017, 37, 1909–1916. [Google Scholar] [CrossRef]
  22. Liu, X.; Zhu, X.; Pan, D. Solutions for the problems of silicon–carbon anode materials for lithium-ion batteries. R. Soc. Open Sci. 2018, 5, 172370. [Google Scholar] [CrossRef] [Green Version]
  23. Kim, M.; Kim, J. Redox deposition of birnessite-type manganese oxide on silicon carbide microspheres for use as supercapacitor electrodes. ACS Appl. Mater. Int. 2014, 6, 9036–9045. [Google Scholar] [CrossRef]
  24. Ma, J.; Li, G.; Chu, Z.; Li, X.; Li, Y.; Hu, T. Microstructure and growth mechanism of multi-layer graphene standing on polycrystalline SiC microspheres. Carbon 2014, 69, 634–637. [Google Scholar] [CrossRef]
  25. Gouze, B.; Cervantes-Diaz, K.B.; Nardin, T.; Diat, O.; Cambedouzou, J. Highly crystalline silicon carbide of controlled mesoporosity. Mat. Chem. Phys. 2020, 250, 123208. [Google Scholar] [CrossRef]
  26. Liu, H.; Zhang, H.; Li, J.; Kang, W.; Chu, P. A novel SiCN@ TiO2 core–shell ceramic microspheres derived from a polymeric precursor. Ceram. Int. 2016, 42, 7135–7140. [Google Scholar] [CrossRef]
  27. Sokolowski, K.; Zambrzycki, M.; Fraczek-Szczypta, A.; Blazewicz, S. Ceramic coating formation during carbothermic reaction of polysiloxanes with carbon and graphite materials. Mat. Chem. Phys. 2019, 238, 121908. [Google Scholar] [CrossRef]
  28. Duan, L.; Ma, Q.; Chen, Z. Fabrication and CO2 capture performance of silicon carbide derived carbons from polysiloxane. Microporous Mesoporous Mater. 2015, 203, C24–C31. [Google Scholar] [CrossRef]
  29. Kim, J.H.E.Y.W.; Park, C.B.; Wang, C. Effect of forming methods on porosity and compressive strength of polysiloxane-derived porous silicon carbide ceramics. J. Ceram. Soc. Jpn. 2012, 120, 199–203. [Google Scholar] [CrossRef] [Green Version]
  30. Eom, J.H.; Kim, Y.W. Effect of additives on mechanical properties of macroporous silicon carbide ceramics. Met. Mater. Int. 2010, 16, 399–405. [Google Scholar] [CrossRef]
  31. Jang, D.H.; Kim, Y.W.; Song, I.H.; Kim, H.D.; Park, C.B. Processing of highly porous, open-cell, microcellular silicon carbide ceramics by expansion method using expandable microspheres. J. Ceram. Soc. Jpn. 2006, 114, 549–553. [Google Scholar] [CrossRef] [Green Version]
  32. Du, B.; Hong, C.; Wang, A.; Zhou, S.; Qu, Q.; Zhou, S.; Zhang, X. Preparation and structural evolution of SiOC preceramic aerogel during high-temperature treatment. Ceram. Int. 2018, 44, 563–570. [Google Scholar] [CrossRef]
  33. Kim, Y.W.; Eom, J.H.; Wang, C.; Park, C.B. Processing of porous silicon carbide ceramics from carbon-filled polysiloxane by extrusion and carbothermal reduction. J. Am. Ceram. Soc. 2008, 91, 1361–1364. [Google Scholar] [CrossRef]
  34. Jin, G.Q.; Guo, X.Y. Synthesis and characterization of mesoporous silicon carbide. Microporous Mesoporous Mater. 2003, 60, 207–212. [Google Scholar] [CrossRef]
  35. Fortuniak, W.; Pospiech, P.; Mizerska, U.; Chojnowski, J.; Slomkowski, S.; Nyczyk-Malinowska, A.; Lach, R.; Hasik, M. SiCO ceramic microspheres produced by emulsion processing and pyrolysis of polysiloxanes of various structures. Ceram. Int. 2016, 42, 11654–11665. [Google Scholar] [CrossRef]
  36. Chojnowski, J.; Slomkowski, S.; Fortuniak, W.; Mizerska, U.; Pospiech, P. Hydrophilic polysiloxane microspheres and ceramic SiOC microspheres derived from them. J. Inorg. Organomet. Polym. Mater. 2020, 30, 56–68. [Google Scholar] [CrossRef] [Green Version]
  37. Mizerska, U.; Fortuniak, W.; Rubinsztajn, S.; Chojnowski, J. Impact of cross-linkers on the structure and hydrophilic-hydrophobic properties of polyhydromethylsiloxane derived microspheres. Polym. Adv. Technol. 2021, 32, 3967–3974. [Google Scholar] [CrossRef]
  38. Burns, G.T.; Taylor, R.B.; Xu, Y.; Zangvil, A.; Zank, G.A. High-temperature chemistry of the conversion of siloxanes to silicon carbide. Chem. Mater. 1992, 4, 1313–1323. [Google Scholar] [CrossRef]
  39. Mazo, M.A.; Tamayo, A.; Rubio, F.; Soriano, D.; Rubio, J. Effect of processing on the structural characteristics of sintered silicon oxycarbide materials. J. Non-Cryst. Solids 2014, 391, 23–31. [Google Scholar] [CrossRef]
  40. Godoy, N.V.; Pereira, J.L.; Duarte, E.H.; Tarley, C.R.T.; Segatelli, M.G. Influence of activated charcoal on the structural and morphological characteristics of ceramic based on silicon oxycarbide (SiOC): A promising approach to obtain a new electrochemical sensing platform. Mat. Chem. Phys. 2016, 175, 33–45. [Google Scholar] [CrossRef]
  41. Kleebe, H.J.; Blum, Y.D. SiOC ceramic with high excess free carbon. J. Eur. Ceram. Soc. 2008, 28, 1037–1042. [Google Scholar] [CrossRef]
  42. Kleebe, H.J.; Gregori, G.; Babonneau, F.; Blum, Y.D.; Queen, D.B.M.; Masse, S. Evolution of C-rich SiOC ceramics. Int. J. Mater. Res. 2006, 97, 699–709. [Google Scholar] [CrossRef]
  43. Szymanski, W.; Lipa, S.; Fortuniak, W.; Chojnowski, J.; Pospiech, P.; Mizerska, U.; Slomkowski, S.; Nyczyk-Malinowska, A.; Hasik, M. Silicon oxycarbide (SiOC) ceramic microspheres–Structure and mechanical properties by nanoindentation studies. Ceram. Int. 2019, 45, 11946–11954. [Google Scholar] [CrossRef]
  44. Harder, D.; Jacobson, B.; Myers, N. Oxidation transitions for SiC Part II. Passive-to-active transitions. J. Am. Ceram. Soc. 2013, 96, 606–612. [Google Scholar] [CrossRef]
  45. Jacobson, N.S.; Lee, K.N.; Fox, D.S. Reactions of silicon carbide and silicon (IV) oxide at elevated temperatures. J. Am. Ceram. Soc. 1992, 5, 1603–1611. [Google Scholar] [CrossRef]
  46. Seger, M.R.; Maciel, G.E. Quantitative 13C NMR Analysis of Sequence Distributions in Poly(ethylene-co-1-hexene). Anal. Chem. 2004, 76, 5734–5747. [Google Scholar] [CrossRef]
  47. Ortiz, A.L.; Sanchez-Bajo, F.; Cumbrera, F.L.; Guiberteau, F. X-ray powder diffraction analysis of a silicon carbide-based ceramic. Mat. Lett. 2001, 49, 137–145. [Google Scholar] [CrossRef]
  48. Pimenta, M.A.; Dresselhaus, G.; Dresselhaus, M.S.; Cançado, L.G.; Jorio, A.; Saito, R. Studying disorder in graphite-based systems by Raman spectroscopy. Phys. Chem. Chem. Phys. 2007, 9, 1276–1290. [Google Scholar] [CrossRef]
  49. Lucchese, M.M.; Stavale, F.; Ferreira, E.H.M.; Vilani, C.; Moutinho, M.V.O.; Capaz, R.B.; Achete, C.A.; Jorio, A. Quantifying ion-induced defects and Raman relaxation length in graphene. Carbon 2010, 48, 1592–1597. [Google Scholar] [CrossRef]
  50. Tunistra, F.; Koenig, J.L. Raman spectrum of graphite. J. Phys. Chem. 1970, 53, 1126–1130. [Google Scholar] [CrossRef] [Green Version]
  51. Ferrari, A.C. Raman spectroscopy of graphene and graphite: Disorder, electron–phonon coupling, doping and nonadiabatic effects. Solid State Commun. 2007, 143, 47–57. [Google Scholar] [CrossRef]
  52. IUPAC Physical Chemistry Division, Commision on Colloid and Surface Chemistry, Recommendation for the characterization of porous solids—Technical report. Pure Appl. Chem. 1994, 66, 1739–1758. [CrossRef] [Green Version]
  53. Lowell, M.; Shields, S.; Thomas, J.E.; Thommes, M.A. Characterization of Porous Solids and Powders: Surface Area, Pore Size and Density; The Kluwer Technology Series; Scarlett, B., Ed.; Springer Science & Business Media: Dordrecht, The Netherlands, 2004; Volume 16, pp. 11–14. [Google Scholar] [CrossRef]
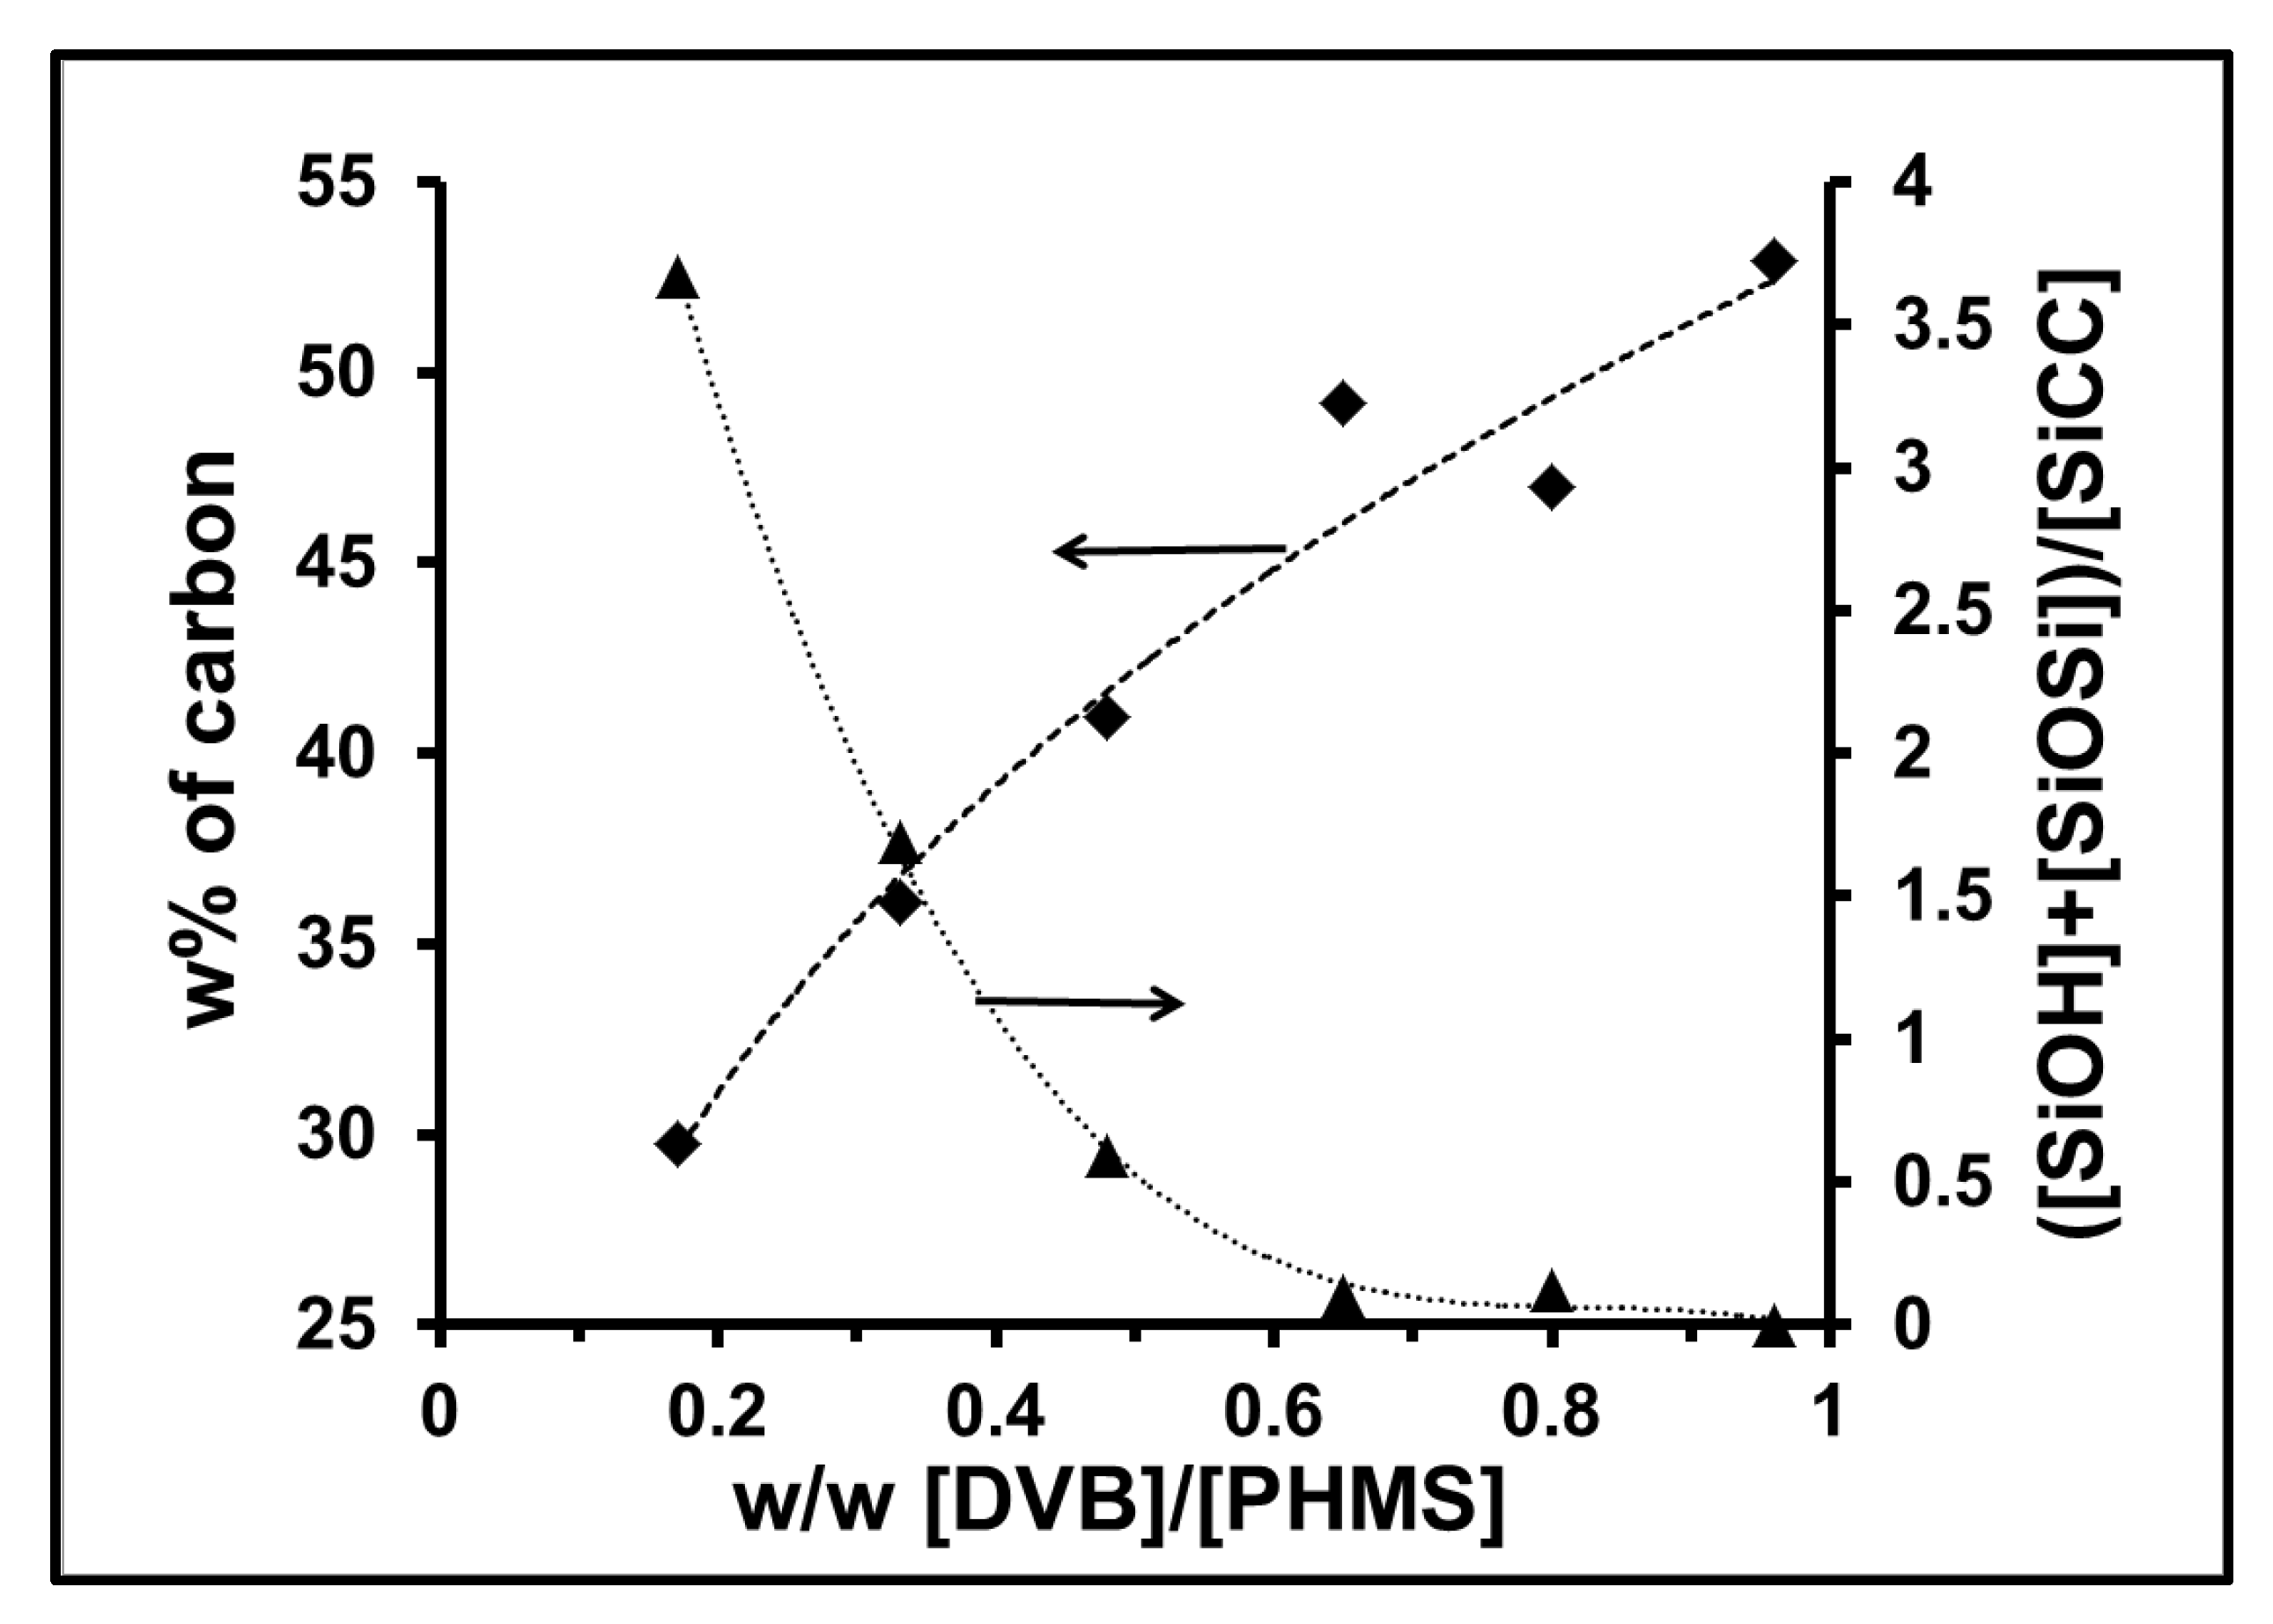
Figure 1. 29Si MAS NMR spectra of the precursor polysiloxane microspheres obtained at different DVB/PHMS w/w ratio: A-1 = 0.17, A-6 = 0.97; X = CH2CH2.
Materials 15 00081 g001
Figure 2. Effect of DVB proportion on the ratio of ([SiOH] + [SiOSi])/[SiCC]—▲ and the carbon content in the precursor siloxane microspheres—♦.
Materials 15 00081 g002
Figure 3. SEM images of SiC and SiC/Cf microspheres representative for different DVB/PHMS w/w ratio: (a,b) (A-1) = 0.17, (c,d) (A-3) = 0.48, (e,f) (A-6) = 0.97, (g,h) (B-1) DVTMDS/PHMS = 0.22.
Materials 15 00081 g003
Figure 4. Effect of DVB proportion on free carbon content from (∆) elemental analysis and (□) TGA weight loss and (●) ceramic yield of ceramic microspheres.
Materials 15 00081 g004
Figure 5. 13C MAS NMR spectra of ceramic SiC/Cf microspheres obtained by ceramization of polysiloxane microspheres at 1600 °C for 5 h under argon; DVB/PHMS w/w ratio 0.97 (A-6).
Materials 15 00081 g005
Figure 6. 29Si MAS NMR spectra of SiC and SiC/C microspheres obtained at different DVB/PHMS w/w ratio: A-1 = 0.17, A-3 = 0.48, A-5 = 0.80, A-6 = 0.97.
Materials 15 00081 g006
Figure 7. X-ray diffraction traces for SiC/Cf microspheres obtained by cross-linking with DVB.
Materials 15 00081 g007
Figure 8. Raman spectra for SiC/Cf microspheres. DVB/PHMS w/w ratio: A-1 = 0.17, A-5 = 0.80, A-6 = 0.97.
Materials 15 00081 g008
Figure 9. Isotherms of N2 adsorption of representative ceramic microspheres, DVB/PHMS w/w ratio: A-1 = 0.17, A-4 = 0.65, A-6, A-7 = 0.97.
Materials 15 00081 g009
Figure 10. Cumulative plots of the distribution of pore width for samples A-1 and A-6: (a) by pore volume, (b) by pore surface.
Materials 15 00081 g010
Figure 11. Mercury intrusion plots: (a)—Incremental intrusion vs. pore size, (b)—Log differential intrusion vs. pressure.
Materials 15 00081 g011
Table 1. Carbon and hydrogen content and the ratio of ([SiOH] + [SiOSi])/[SiCC] in the precursor polysiloxane microspheres.
SampleCrosslinkerCrosslinker/PHMS w/wAv. C w%Av.H
w%
([SiOH] + [SiOSi])/[SiCC]
PA-1DVB0.1729.86.033.67
PA-2DVB0.3336.16.771.69
PA-3DVB0.4842.497.110.59
PA-4DVB0.6549.127.340.1
PA-5DVB0.8046.989.830.12
PA-6DVB0.9653.010.10
PA-7DVB0.9655.69.440
PB-1DVTMDS0.2222.676.425.29
PA 1-7 and PB-1denote preceramic samples corresponding to samples of ceramic materials A 1–7 and B-1.
Table 2. Characteristics of ceramic SiC and SiC/Cf microspheres.
Ceramized SampleColorCeramic Yield
w%
Average Diameter μmWeight Loss % TGA *w%
Ctotal **
w%
O **
Calculated w% Cf
A-1Beige/Green30.47.10.18281.120
A-2Beige/Green29.03.50.1728.21.540
A-3Beige/Green30.610.40.3427.320
A-4Black40.911.111381.8511.4
A-5Black41.09.515.137.91.611.2
A-6Black41.42.118.5421.4517.1
A-7Black46.31.223.546.61.5024.9
B-1Beige/Green8.54.50.3830.21.060.2
* —ceramic microspheres were heated in air from 25 °C to 800 °C with rate of 5 °C/min and held at 800 °C for 3 h. ** —total carbon and oxygen content was determined in Institute for Ferrous Metallurgy, Gliwice, Poland.
Table 3. Results of Raman studies of SiC/Cf microspheres.
SampleD Position
(FWHM)
cm−1
G Position
(FWHM)
cm−1
I(D)/I(G)La(nm)
(ʎ = 488)
A-41356
(55)
1590
(46)
1.552.8
A-51356
(46)
1588
(40)
1.183.4
A-61356
(52)
1589
(43)
1.473.0
A-71350
(53)
1593
(57)
2.042.2
Table 4. Porosity results from nitrogen adsorption measurement.
SampleNitrogen Gas Adsorption
BET
Surface Area
m2/g
BJH
Pore Volume
cm3/g
BET
Av. Pore Width
nm
BJH
Av.Pore Width
nm
A-110.480.07221.428.2
A-211.240.05828.232.0
A-312.60.05214.6420.8
A-4164.90.1754.705.21
A-5204.60.1954.164.59
A-6263. 50.1452.633.1
A-7 *)347.20.0912.152.9
A-7-1 **)120.70.2188.4110.94
A-7-2 ***)103.00.34715.8115.63
B-153.010.28120.3021.47
Samples A-1–A-6 were obtained from DVB/PHMS using homogenization conditions: time 90 s, velocity 7000 rpm. *) Sample A-7 was obtained using the same DVB/PHMS ratio as in the synthesis of sample A-1–A-6, but at other homogenization conditions (time 180 s and velocity 15000 rpm). **) Sample A-7-1–A-7 was heated in air at 800 °C for 3 h. ***) Sample A-7-2–A-7-1 was subjected to the treatment with HF. Sample B-1 was obtained from DVTMDS/PHMS at the same conditions as samples A-1–A-6.
Table 5. Characteristic of the microsphere’s porosity by mercury intrusion.
SampleTotal
Intrusion
(Pore
Intrusion)
cm3/g
Surface Area
m2/g
Av Pore
Width
nm
Powder
Density
g/cm3
Skeletal Density
g/cm3
Porosity
%
A-11.53
(0.50)
24.1830.4952.0350.5
A-30.829
(0.39)
19.5780.7151.7632.0
A-50.764
(0.090)
25.613.60.7251.6312.8
B-11.33
(0.495)
43.2460.5602.2052.4
Publisher’s Note: MDPI stays neutral with regard to jurisdictional claims in published maps and institutional affiliations.

