
Optimizing Evanescent Efficiency of Chalcogenide Tapered Fiber

 , ,
, , 

Abstract
:1. Introduction
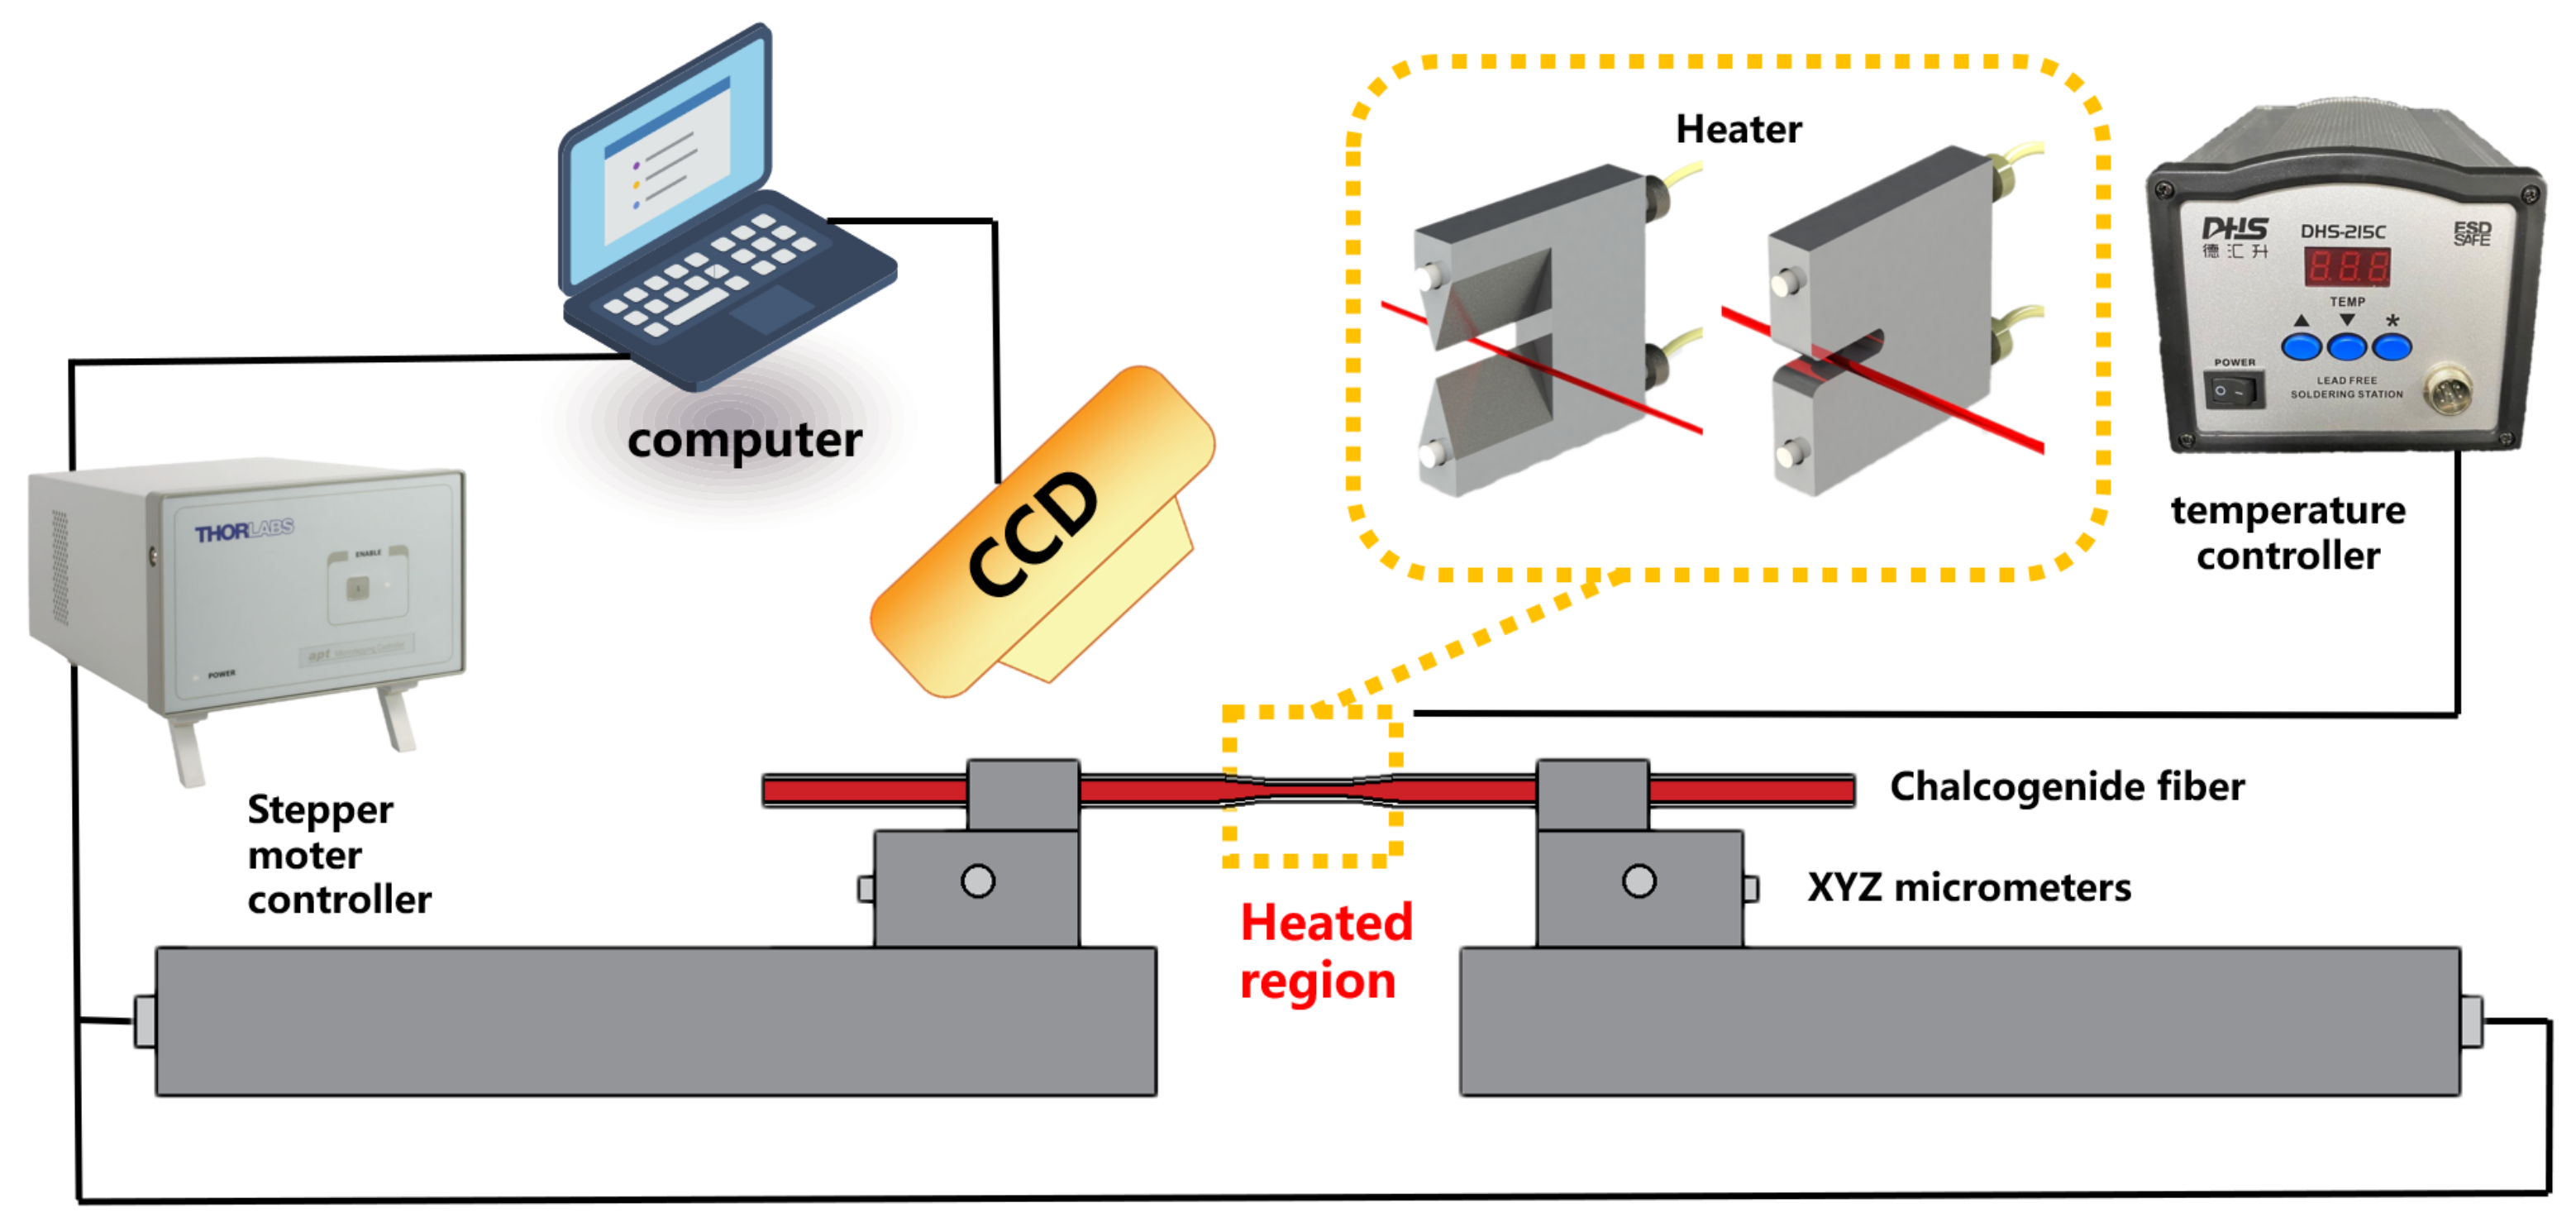
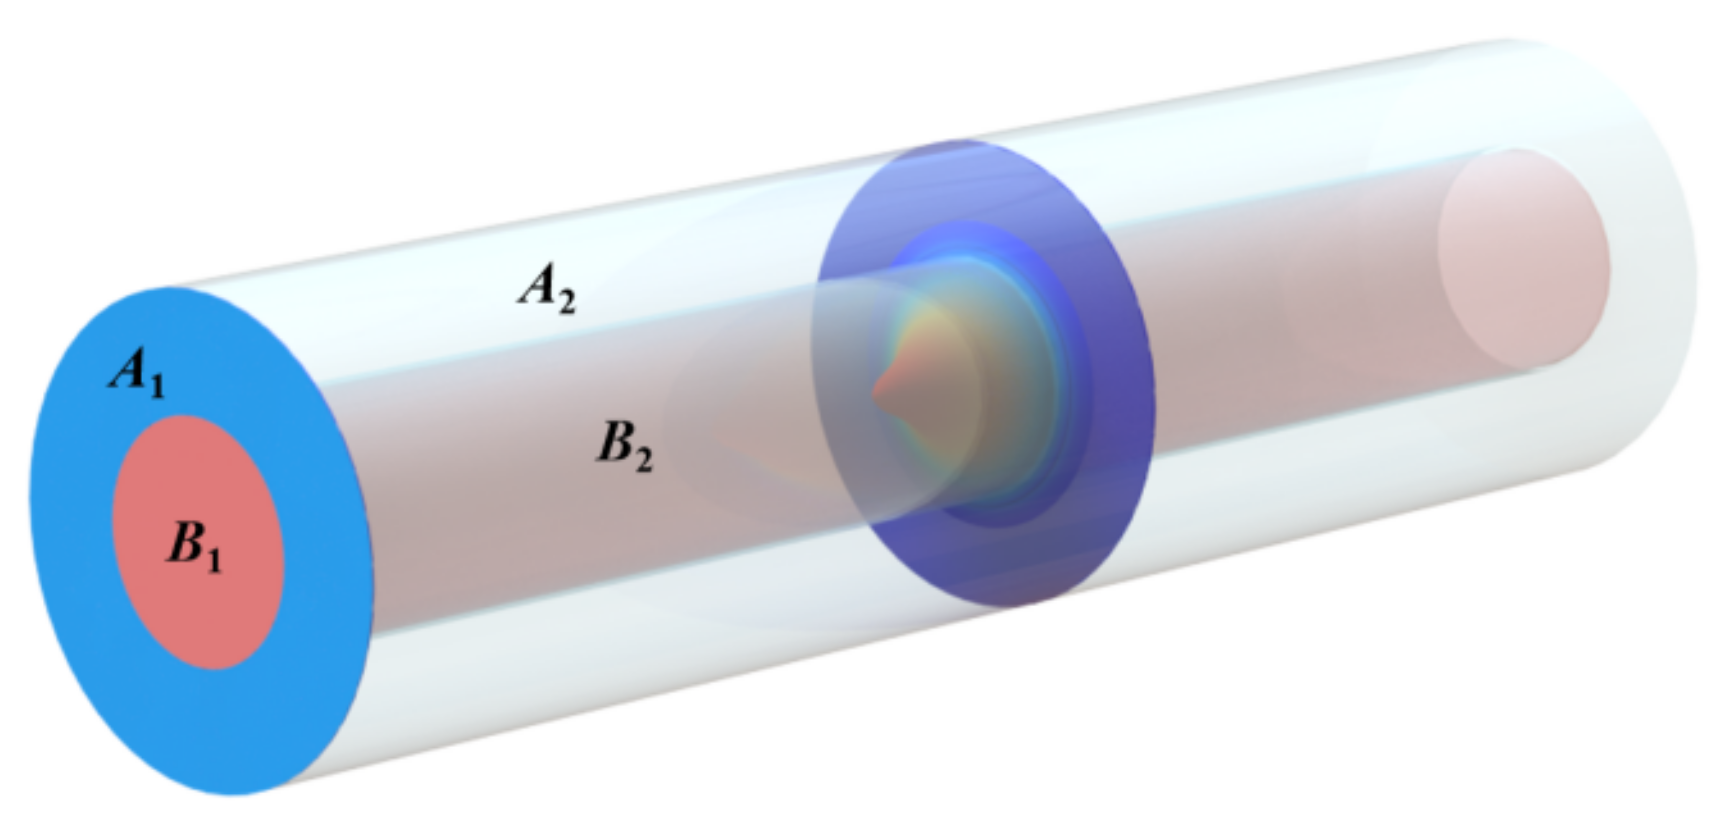
2. Basic Model
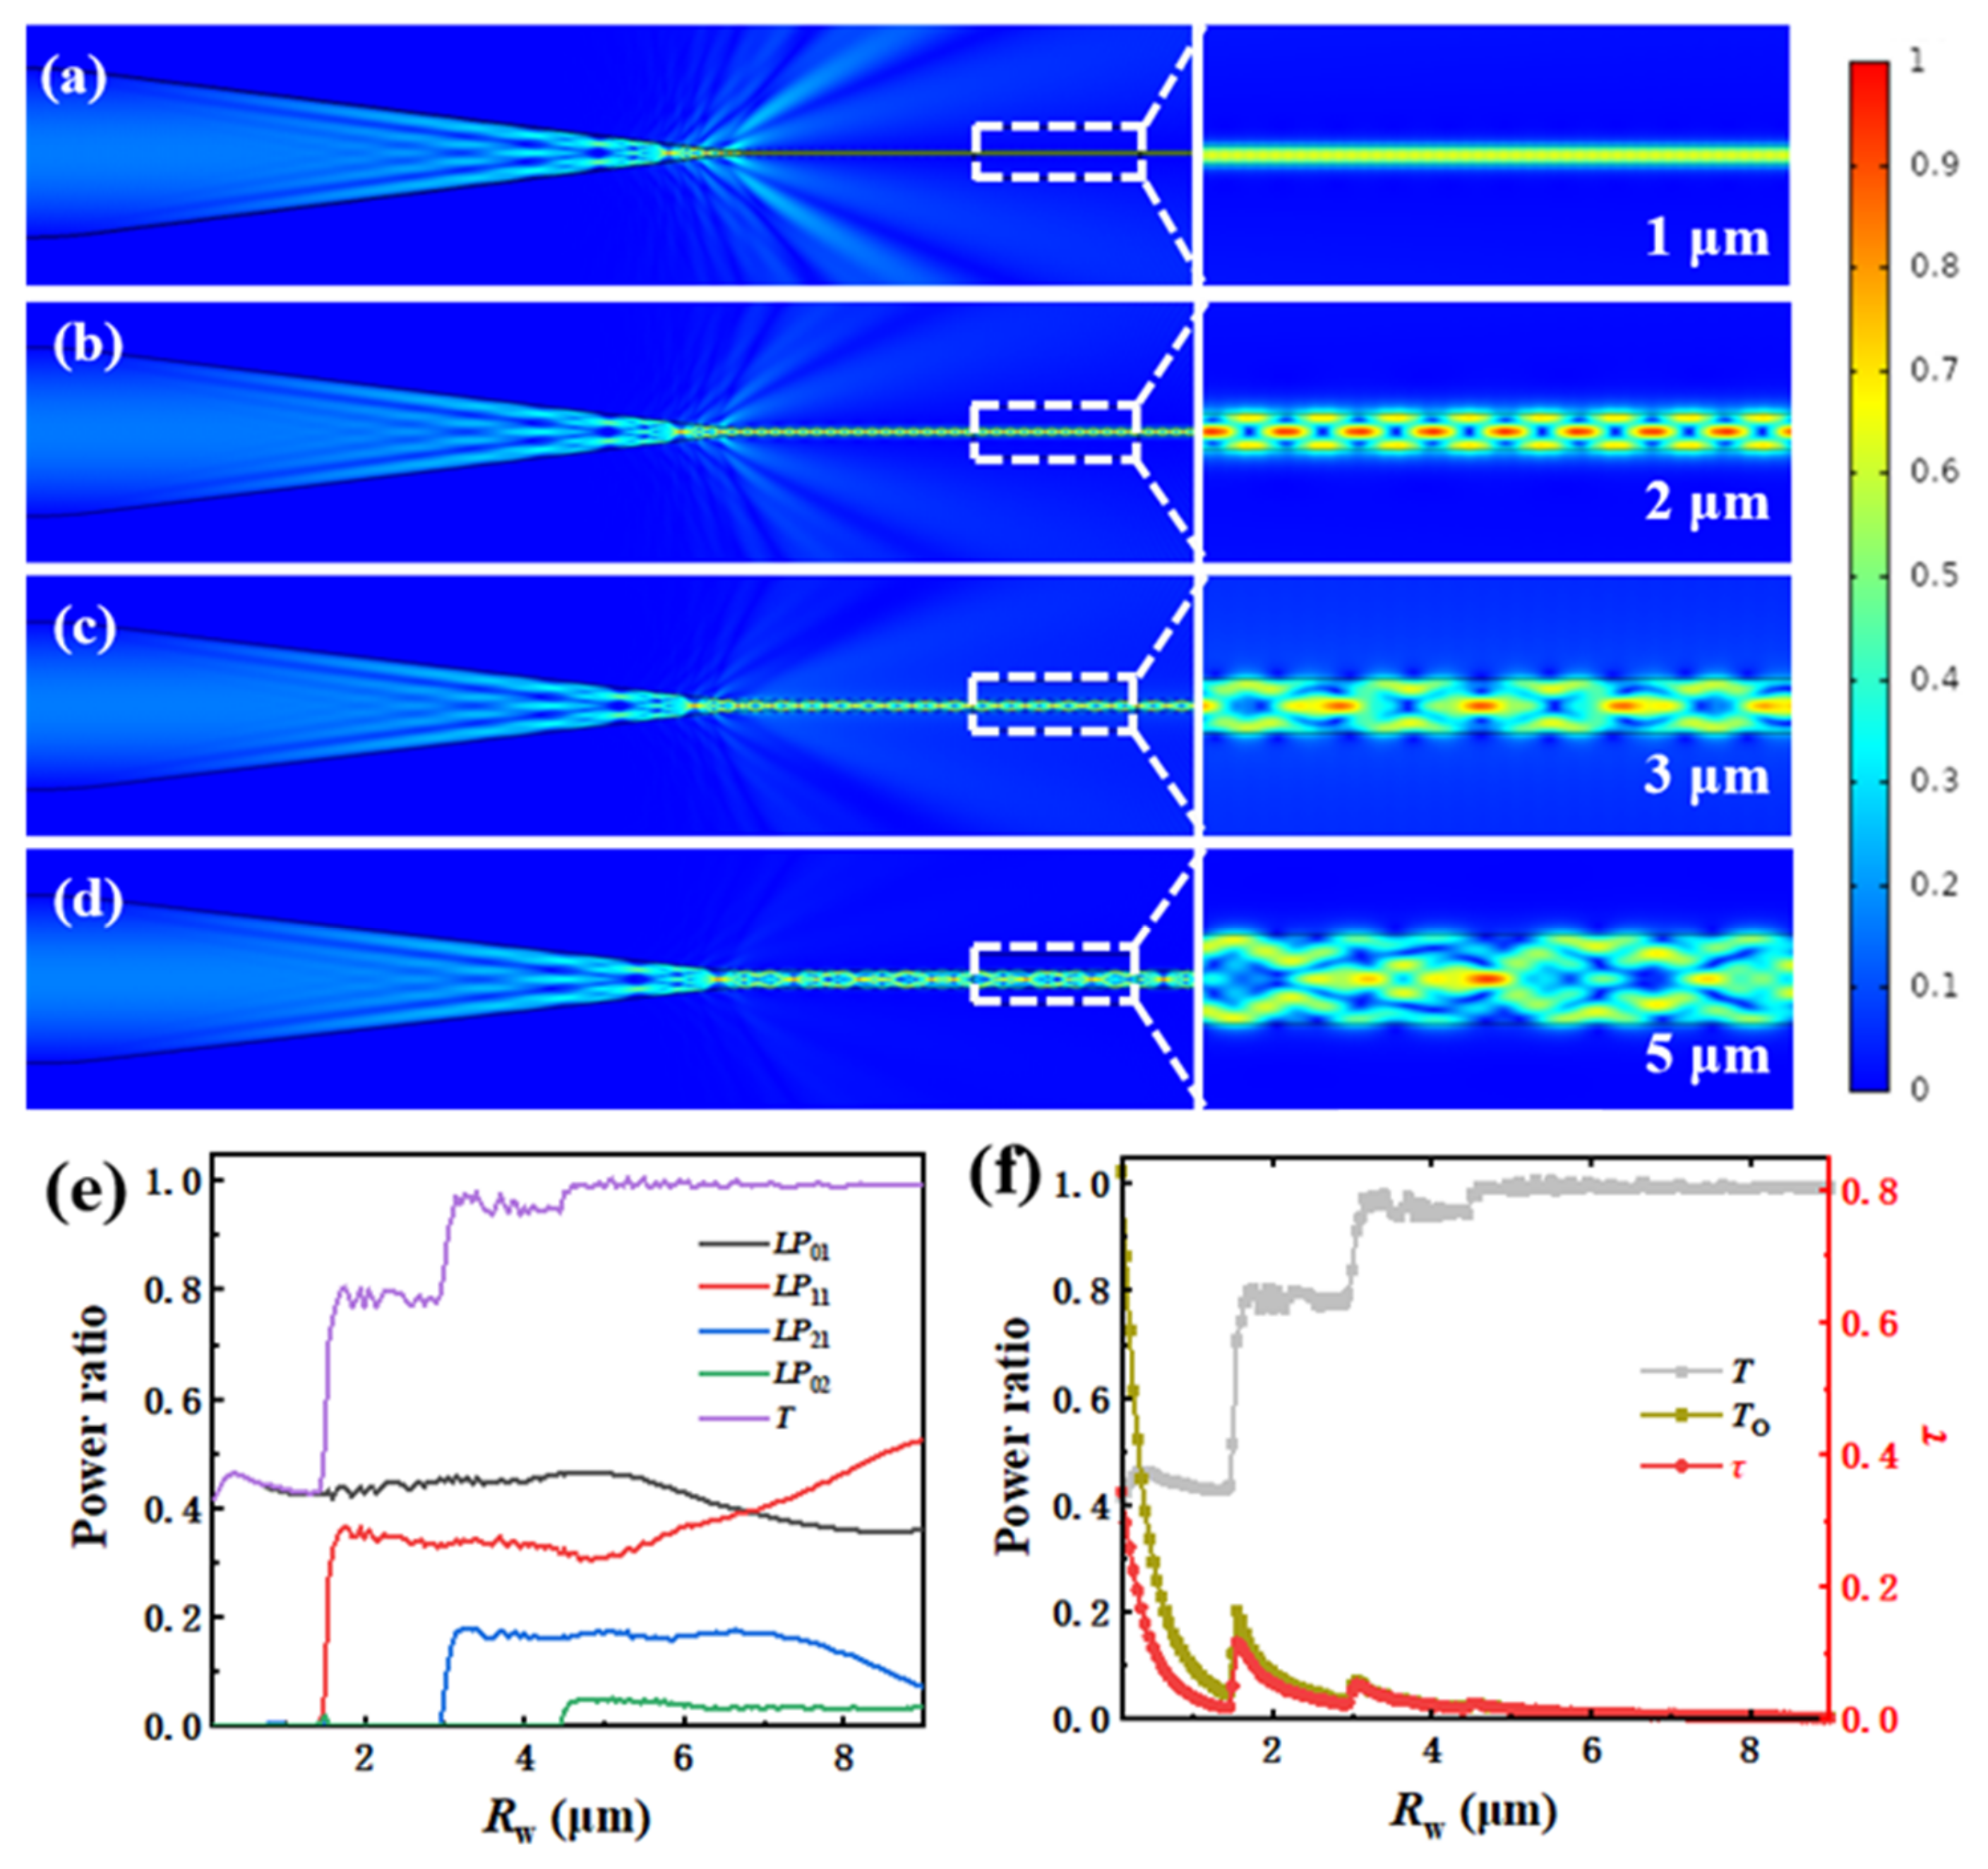
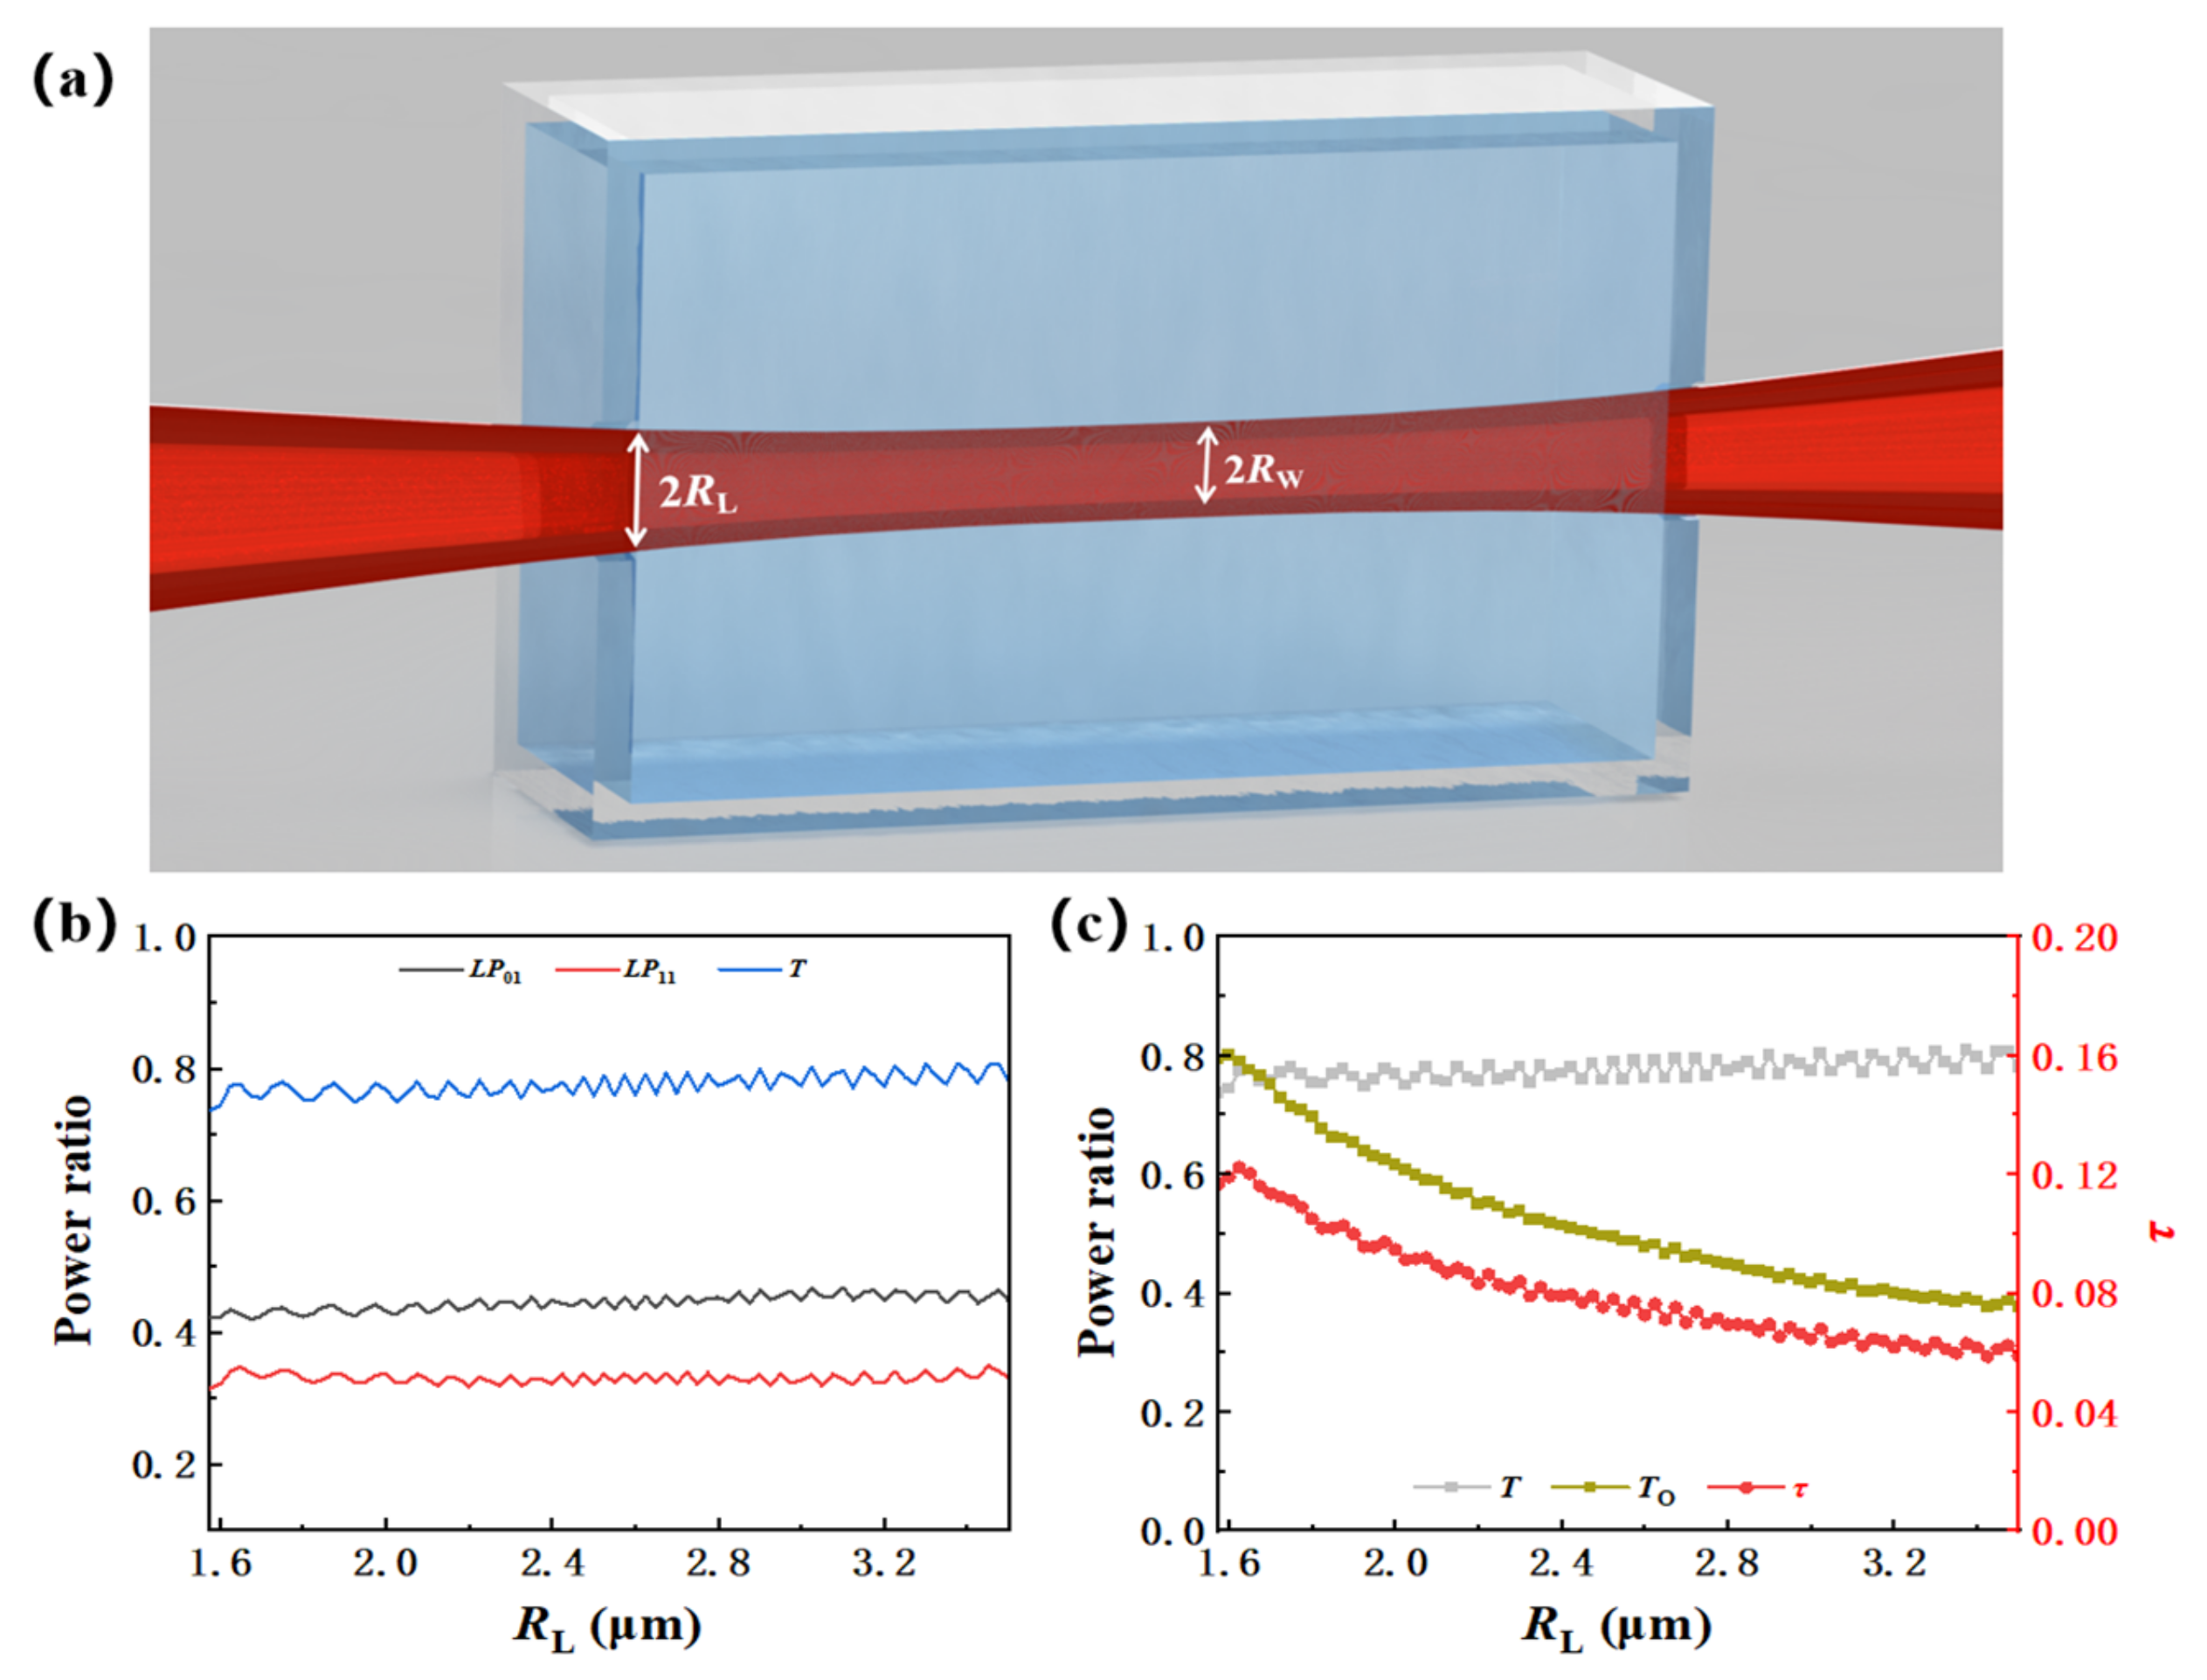
3. Effect of Waist Radius
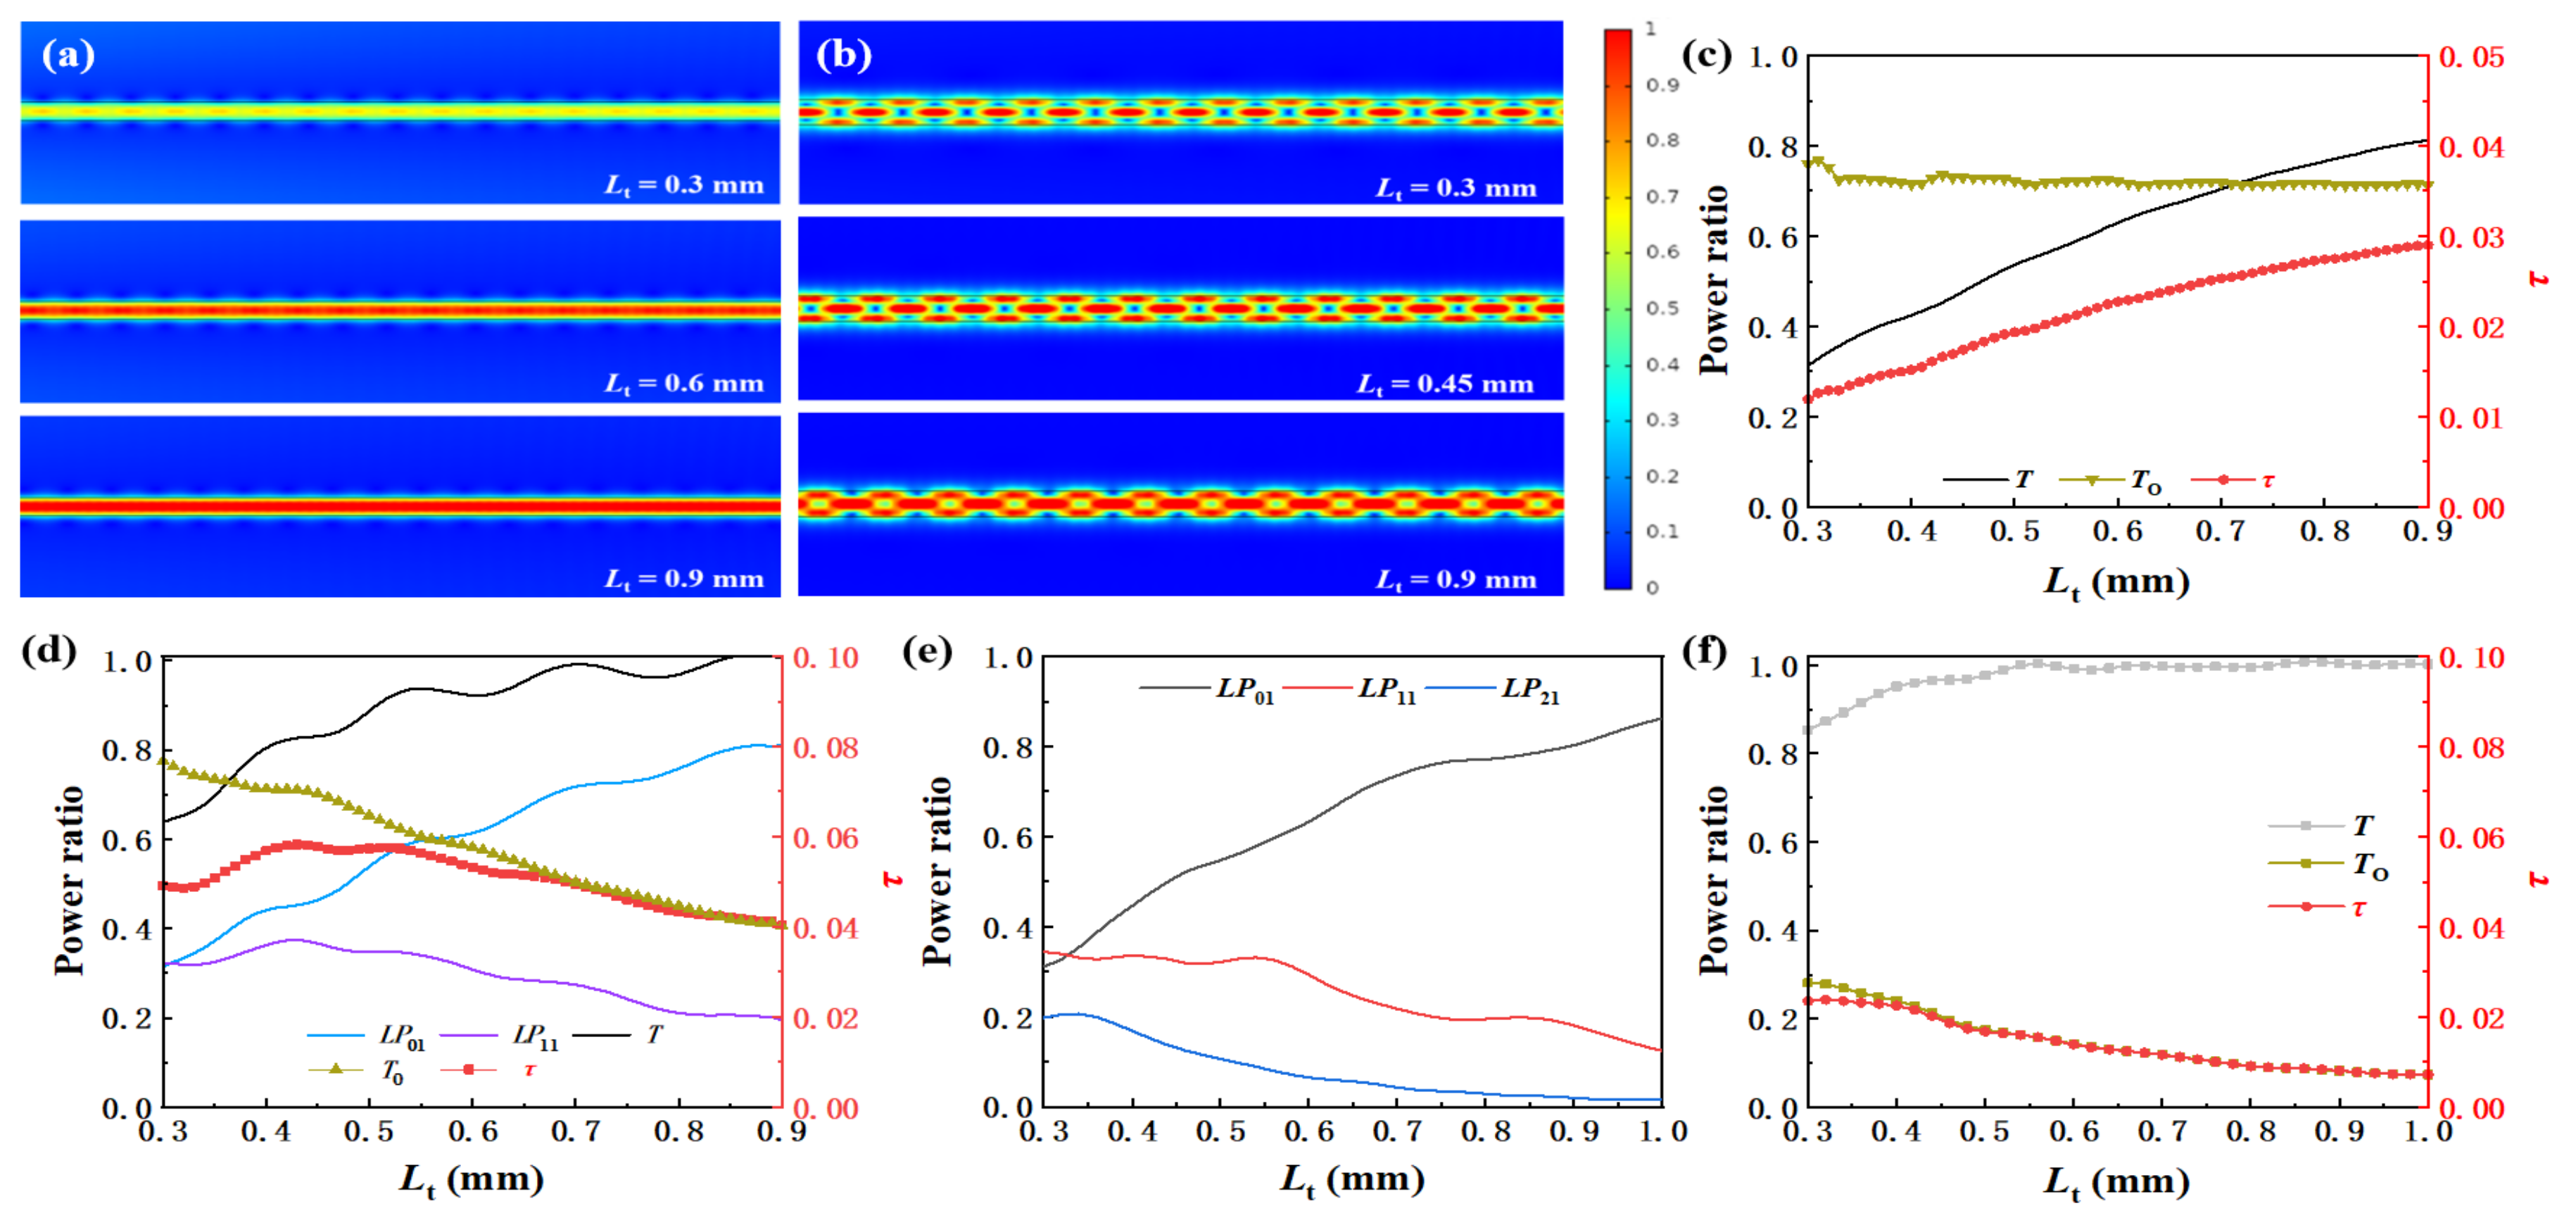
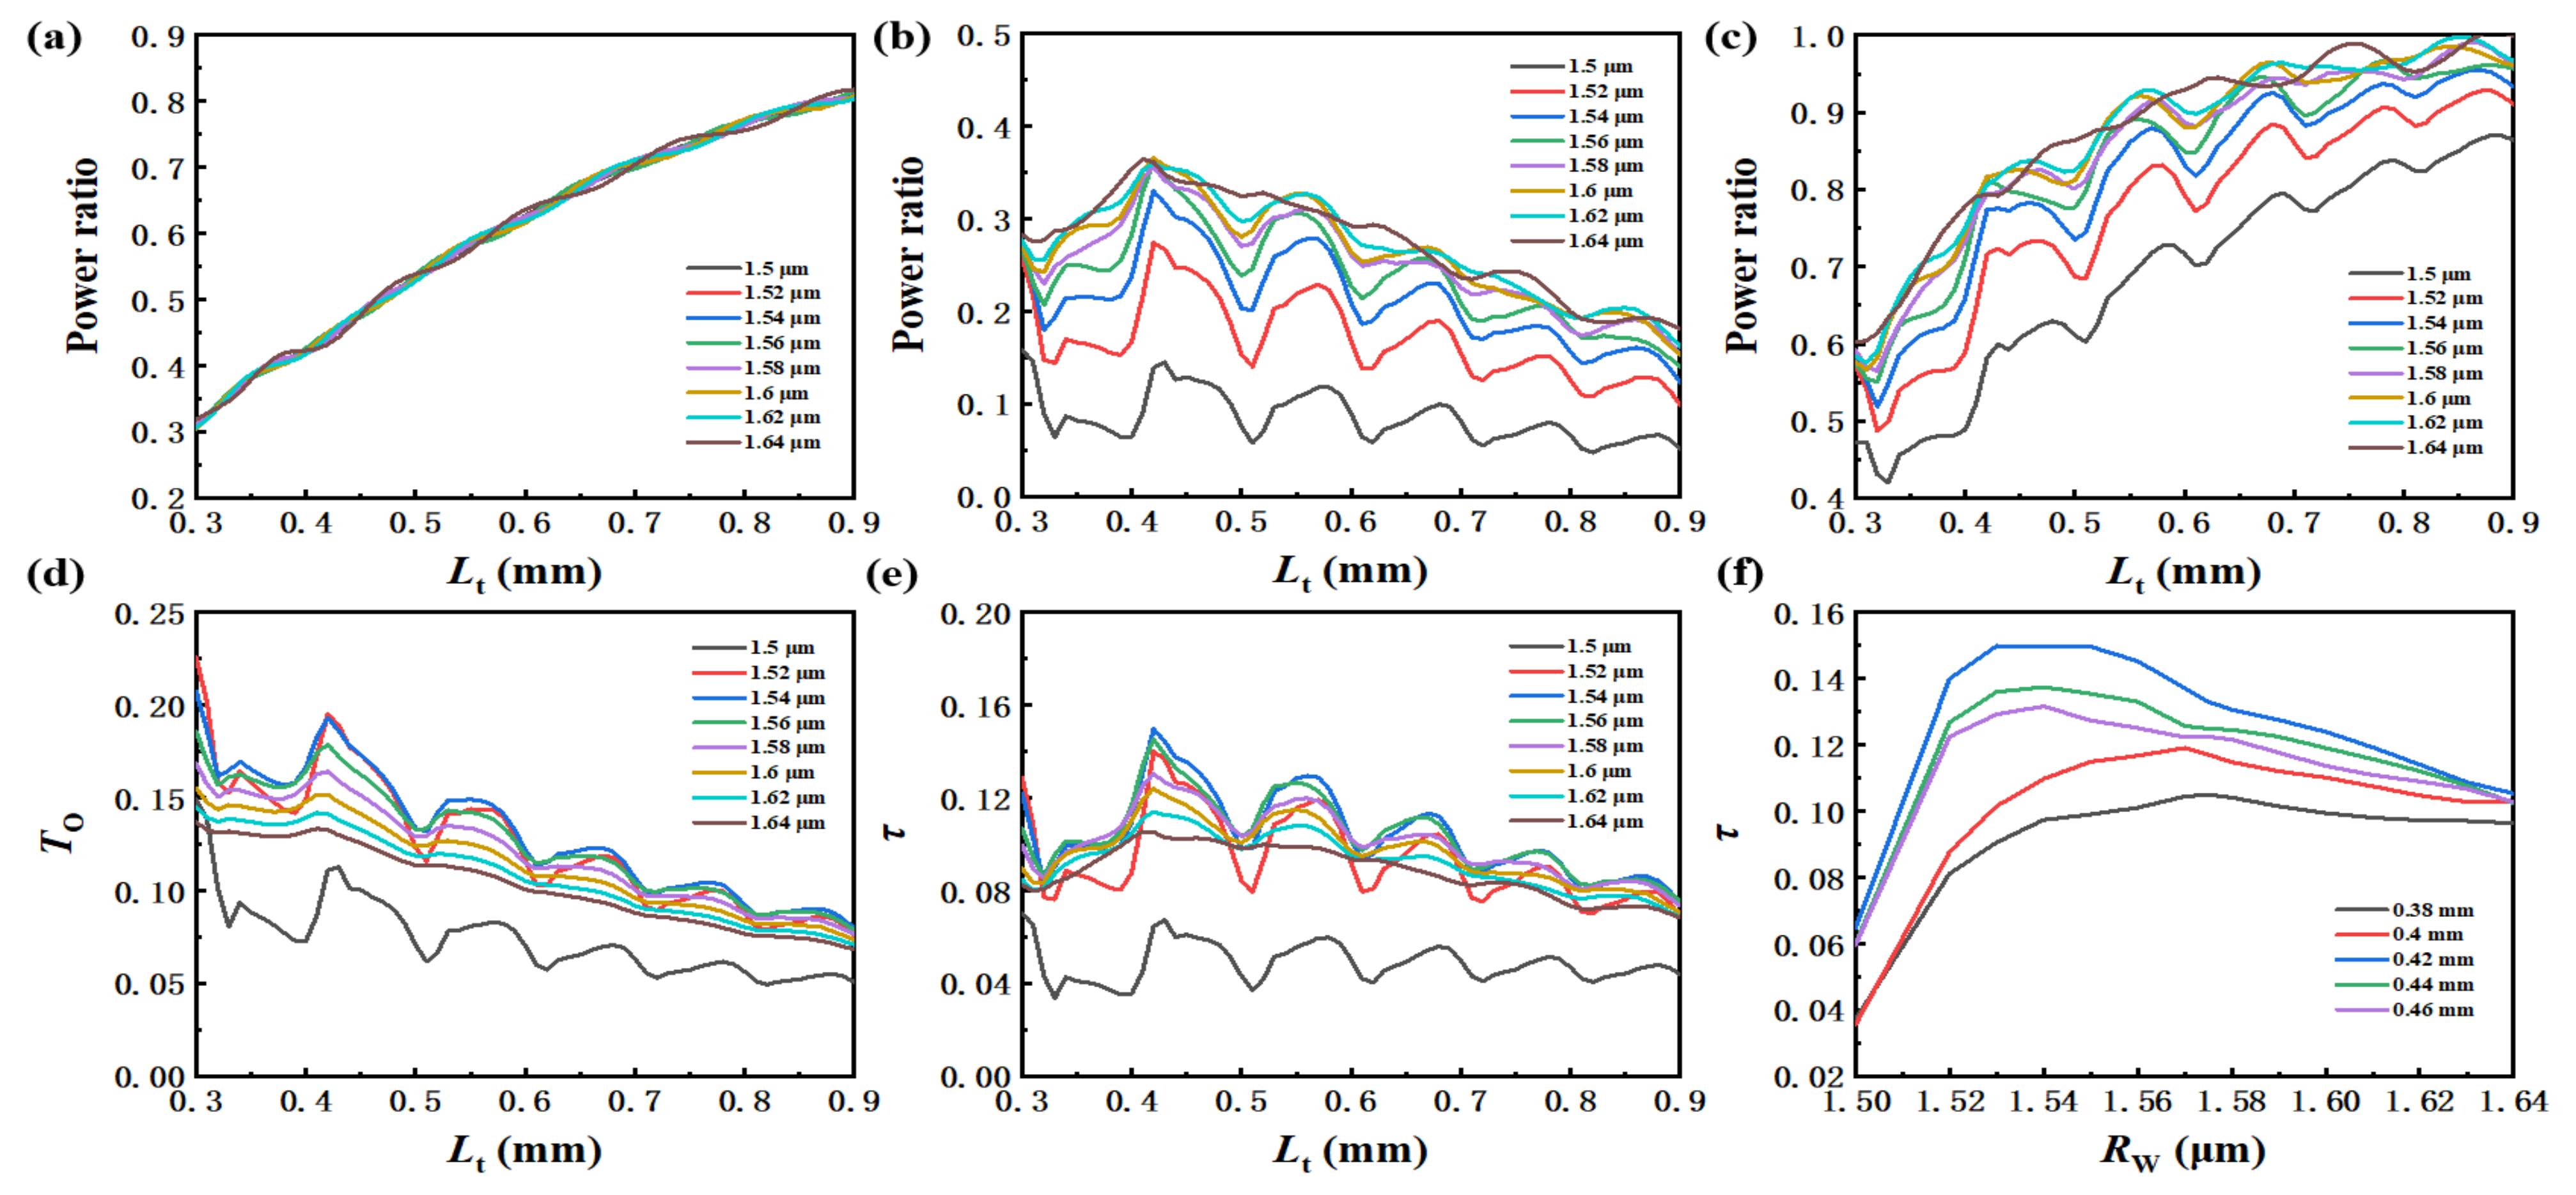
4. Effect of the Length of Taper
5. Optimization of Multimode Tapered Fiber
6. Analysis of Micro Deformation in Waist
7. Conclusions
Supplementary Materials
Author Contributions
Funding
Institutional Review Board Statement
Informed Consent Statement
Data Availability Statement
Conflicts of Interest
References
- Wu, Z.; Xu, Y.; Qi, D.; Nie, Q.; Zhang, X. Progress in preparation and applications of Te-As-Se chalcogenide glasses and fibers. Infrared Phys. Technol. 2019, 102, 102981–102991. [Google Scholar] [CrossRef]
- Bensaid, S.; Kachenoura, A.; Costet, N.; Bensalah, K.; Tariel, H.; Senhadji, L. Noninvasive detection of bladder cancer using mid-infrared spectra classification. Expert Syst. Appl. 2017, 89, 333–342. [Google Scholar] [CrossRef] [Green Version]
- Starecki, F.; Braud, A.; Doualan, J.-L.; Ari, J.; Boussard-Plédel, C.; Michel, K.; Nazabal, V.; Camy, P. All-optical carbon dioxide remote sensing using rare earth doped chalcogenide fibers. Opt. Laser. Eng. 2019, 122, 328–334. [Google Scholar] [CrossRef]
- Yang, C.; Wang, X.; Su, J.; Dai, S. Spectroscopy analysis of mixed organic liquid detection with Ge20Se60Te20 glass-tapered fiber. J. Non Cryst. Solids 2018, 500, 377–381. [Google Scholar] [CrossRef]
- Wang, X.; Su, J.; Wang, Y.; Yang, C.; Dai, S.; Zhang, P. High-sensitivity sensing in bare Ge-Sb-Se chalcogenide tapered fiber with optimal structure parameters. J. Non Cryst. Solids 2021, 559, 120686–120691. [Google Scholar] [CrossRef]
- Su, J.; Dai, S.; Gan, N. Optimized Ge-As-Se-Te chalcogenide glass fiber sensor with polydopamine-coated tapered zone for the highly sensitive detection of p-xylene in waters. Opt. Express 2020, 28, 184–193. [Google Scholar] [CrossRef] [PubMed]
- Wang, M.; Yang, F.; Dai, S.; Cao, Z.; Su, J.; Ding, S.; Zhang, P. Effect of the Geometries of Ge-Sb-Se Chalcogenide Glass Tapered Fiber on the Sensitivity of Evanescent Wave Sensors. J. Lightwave Technol. 2021, 39, 4828–4836. [Google Scholar] [CrossRef]
- Wang, L.; Ma, W.; Zhang, P.; Zhu, L.; Yang, D.; Wang, X.; Dai, S. Mid-Infrared Gas Detection Using a Chalcogenide Suspended-Core Fiber. J. Lightwave Technol. 2019, 37, 5193–5198. [Google Scholar] [CrossRef]
- Yang, D.; Zhang, P.; Zeng, J.; Wang, X.; Song, B.; Dai, S. SRI-Immune Highly Sensitive Temperature Sensor of Long-Period Fiber Gratings in Ge–Sb–Se Chalcogenide Fibers. J. Lightwave Technol. 2017, 35, 3974–3979. [Google Scholar] [CrossRef]
- Xie, Y.; Cai, D.; Pan, J.; Zhou, N.; Gao, Y.; Jin, Y.; Jiang, X.; Qiu, J.; Wang, P.; Guo, X.; et al. Batch Fabrication of High-Quality Infrared Chalcogenide Microsphere Resonators. Small 2021, 17, 2100140–2100146. [Google Scholar] [CrossRef]
- Xie, Y.; Cai, D.; Wu, H.; Pan, J.; Zhou, N.; Xin, C.; Yu, S.; Wang, P.; Jiang, X.; Qiu, J.; et al. Mid-infrared chalcogenide microfiber knot resonators. Photon. Res. 2020, 8, 616–621. [Google Scholar] [CrossRef]
- Jiang, X.; Jha, A. Engineering of a Ge–Te–Se glass fibre evanescent wave spectroscopic (FEWS) mid-IR chemical sensor for the analysis of food and pharmaceutical products. Sens. Actuators B Chem. 2015, 206, 159–169. [Google Scholar] [CrossRef]
- Romanova, E.A.; Korsakova, S.V.; Rozhnev, A.G.; Velmuzhov, A.P.; Kotereva, T.V.; Sukhanov, M.V.; Shiryaev, V.S. Chalcogenide fiber loop probe for the mid-IR spectroscopy of oil products. Opt. Express 2020, 28, 5267–5272. [Google Scholar] [CrossRef] [PubMed]
- Zhang, K.; Alamgir, I.; Rochette, M. Midinfrared Compatible Tunable Bandpass Filter Based on Multimode Interference in Chalcogenide Fiber. J. Lightwave Technol. 2020, 38, 857–863. [Google Scholar] [CrossRef]
- Markos, C.; Bang, O. Nonlinear Label-Free Biosensing With High Sensitivity Using As2S3 Chalcogenide Tapered Fiber. J. Lightwave Technol. 2015, 33, 2892–2898. [Google Scholar] [CrossRef]
- Bednarska, K.; Sobotka, P.; Woliński, T.R.; Zakręcka, O.; Pomianek, W.; Nocoń, A.; Lesiak, P. Hybrid Fiber Optic Sensor Systems in Structural Health Monitoring in Aircraft Structures. Materials 2020, 13, 2249. [Google Scholar] [CrossRef] [PubMed]
- Marro Bellot, C.; Sangermano, M.; Olivero, M.; Salvo, M. Optical Fiber Sensors for the Detection of Hydrochloric Acid and Sea Water in Epoxy and Glass Fiber-Reinforced Polymer Composites. Materials 2019, 12, 379. [Google Scholar] [CrossRef] [PubMed] [Green Version]
- Ermatov, T.; Skibina, J.S.; Tuchin, V.V.; Gorin, D.A. Functionalized Microstructured Optical Fibers: Materials, Methods, Applications. Materials 2020, 13, 921. [Google Scholar] [CrossRef] [Green Version]
- Yu, H.; Gao, W.; Jiang, X.; Guo, H.; Jiang, S.; Zheng, Y. On-line Writing of Fiber Bragg Grating Array on a Two-mode Optical Fiber for Sensing Applications. Materials 2019, 12, 1263. [Google Scholar] [CrossRef] [PubMed] [Green Version]
- Sheng, J.; Peng, Q.; Sun, W.; Wang, Y.; Yang, K.; Feng, Z.; Wang, J.; Wu, G.; Wang, J.; Jiao, K.; et al. Influence of extrusion on the properties of chalcogenide glasses and fibers. Opt. Commun. 2022, 513, 128091. [Google Scholar] [CrossRef]
- Shiryaev, V.S.; Sukhanov, M.V.; Velmuzhov, A.P.; Karaksina, E.V.; Kotereva, T.V.; Snopatin, G.E.; Denker, B.I.; Galagan, B.I.; Sverchkov, S.E.; Koltashev, V.V.; et al. Core-clad terbium doped chalcogenide glass fiber with laser action at 5.38 μm. J. Non-Cryst. Solids 2021, 567, 120939. [Google Scholar] [CrossRef]
- Esfahani Monfared, Y. Overview of Recent Advances in the Design of Plasmonic Fiber-Optic Biosensors. Biosensors 2020, 10, 77. [Google Scholar] [CrossRef] [PubMed]
- Cennamo, N.; Arcadio, F.; Zeni, L.; Catalano, E.; Del Prete, D.; Buonanno, G.; Minardo, A. The Role of Tapered Light-Diffusing Fibers in Plasmonic Sensor Configurations. Sensors 2021, 21, 6333. [Google Scholar] [CrossRef]
- Carvalho, W.O.F.; Mejía-Salazar, J.R. Surface Plasmon Resonances in Sierpinski-Like Photonic Crystal Fibers: Polarization Filters and Sensing Applications. Molecules 2020, 25, 4654. [Google Scholar] [CrossRef] [PubMed]
- Tong, L. Micro/Nanofibre Optical Sensors: Challenges and Prospects. Sensors 2018, 18, 903. [Google Scholar] [CrossRef] [PubMed] [Green Version]
- Zhong, N.; Xin, X.; Liu, H.; Yu, X.; Chang, H.; Tang, B.; Zhong, D.; Zhao, M.; Zhang, H.; Zhao, J. Plastic optical fiber sensor for temperature-independent high-sensitivity detection of humidity. Appl. Opt. 2020, 59, 5708–5713. [Google Scholar] [CrossRef]
- Xin, X.; Zhong, N.; Liao, Q.; Cen, Y.; Wu, R.; Wang, Z. High-sensitivity four-layer polymer fiber-optic evanescent wave sensor. Biosens. Bioelectron. 2017, 91, 623–628. [Google Scholar] [CrossRef]
- Zhang, L.; Tang, Y.; Tong, L. Micro-/Nanofiber Optics: Merging Photonics and Material Science on Nanoscale for Advanced Sensing Technology. iScience 2020, 23, 100810–100832. [Google Scholar] [CrossRef] [Green Version]
- Ravets, S.; Hoffman, J.E.; Kordell, P.R.; Wong-Campos, J.D.; Rolston, S.L.; Orozco, L.A. Intermodal energy transfer in a tapered optical fiber: Optimizing transmission. J. Opt. Soc. Am. A 2013, 30, 2361–2371. [Google Scholar] [CrossRef]
- Brambilla, G. Optical fibre nanowires and microwires: A review. J. Opt. 2010, 12, 043001–043019. [Google Scholar] [CrossRef]
- Tong, L.; Lou, J.; Mazur, E. Single-mode guiding properties of subwavelength-diameter silica and silicon wire waveguides. Opt. Express 2004, 12, 1025–1035. [Google Scholar] [CrossRef] [PubMed]


| Rw (μm) | Mode Evolution | T (%) | To (%) | τ (%) |
|---|---|---|---|---|
| 1 | single mode → multimode → single mode | 42.91 | 7.85 | 3.87 |
| 2 | single mode → multimode → multimode | 76.62 | 7.09 | 5.43 |
| 3 | single mode → multimode → multimode | 83.78 | 5.01 | 4.20 |
| 5 | single mode → multimode → multimode | 98.72 | 1.67 | 1.65 |
Publisher’s Note: MDPI stays neutral with regard to jurisdictional claims in published maps and institutional affiliations. |
© 2022 by the authors. Licensee MDPI, Basel, Switzerland. This article is an open access article distributed under the terms and conditions of the Creative Commons Attribution (CC BY) license (https://creativecommons.org/licenses/by/4.0/).
Share and Cite
Zhao, X.; Yao, N.; Zhang, X.; Zhang, L.; Tao, G.; Li, Z.; Liu, Q.; Zhao, X.; Xu, Y. Optimizing Evanescent Efficiency of Chalcogenide Tapered Fiber. Materials 2022, 15, 3834. https://doi.org/10.3390/ma15113834
Zhao X, Yao N, Zhang X, Zhang L, Tao G, Li Z, Liu Q, Zhao X, Xu Y. Optimizing Evanescent Efficiency of Chalcogenide Tapered Fiber. Materials. 2022; 15(11):3834. https://doi.org/10.3390/ma15113834
Chicago/Turabian StyleZhao, Xudong, Ni Yao, Xianghua Zhang, Lei Zhang, Guangming Tao, Zijian Li, Quan Liu, Xiujian Zhao, and Yinsheng Xu. 2022. "Optimizing Evanescent Efficiency of Chalcogenide Tapered Fiber" Materials 15, no. 11: 3834. https://doi.org/10.3390/ma15113834
APA StyleZhao, X., Yao, N., Zhang, X., Zhang, L., Tao, G., Li, Z., Liu, Q., Zhao, X., & Xu, Y. (2022). Optimizing Evanescent Efficiency of Chalcogenide Tapered Fiber. Materials, 15(11), 3834. https://doi.org/10.3390/ma15113834