Abstract
Based on lithium aluminosilicate glass, the composition of glass was optimized by replacing SiO2 with B2O3, and the influence of glass composition on structure and performance was studied. With the increase in B2O3 concentrations from 0 to 6.5 mol%, Al2O3 always existed in the form of four-coordinated [AlO4] in the network structure, and B2O3 mainly entered the network in the form of four-coordinated [BO4]. The content of Si-O-Si linkages (Q4(0Al)) was always dominant. The incorporation of boron oxide improved the overall degree of polymerization and connectivity of the lithium aluminosilicate glass network structure. An increase in the degree of network polymerization led to a decrease in the thermal expansion coefficient of the glass and an increase in Vickers hardness and density. The durability of the glass in hydrofluoric acid and NaOH and KOH solutions was enhanced overall.
1. Introduction
B2O3 has been incorporated into various glass systems to obtain the required chemical and physical properties [1]. Boron-containing silicate glass is a commonly used material in industrial applications and has been widely used in applications in industrial technology fields including pharmaceutical containers, sealing glass, optics, flat-panel displays, electronic packaging and low-expansion glass [2,3,4,5]. The ability of the modifiers and network formers in the glass components to compete for oxygen affects the coordination of boron, that is, the glass component plays an important role in the coordination of boron. Therefore, the structure of boro-aluminosilicate glass is more complicated [6]. In pure boron oxide glass, boron is three-coordinated. With the addition of alkali metal oxides, alkali metal ions compensate for the charge of the [BO4]- unit, and four-coordinated boron begins to appear [7]. Borate or borosilicate glass exhibits nonlinear composition–property relationships, which is a phenomenon known as the “boron anomaly” [8,9,10]. The relationship between the composition, performance and structure of traditional borosilicate glass has been extensively and systematically studied [11,12,13,14,15,16]. For instance, Yun and Bray [17] put forward a model for calculating fraction N4 of tetra-coordinated boron. According to the model, when the ratio of sodium oxide to boron oxide exceeds 0.5, there are enough sodium ions to compensate the negative charge of [BO4] units, and the number of [BO4] units in glass increases; on the contrary, the number of [BO3] units is greater. Jonathan F. Stebbins [18] quantified the number of non-bridging oxygens bonded to boron in sodium borate glass and barium borate glass, which have a major influence on glass properties, and enlightened the quantification of the number of non-bridging oxygens in borate networks in multicomponent glass. Du and Stebbins [19] improved the model established by “Dell, Bray and Xiao [20]”. The improved model can predict the non-bridging oxygen (NBO) content and N4 only based on the composition of the glass. The experimental data on aluminoborosilicate glass are highly consistent.
Compared with traditional borosilicate glass, for which a relatively well-established structural model has been established, the structure of lithium aluminosilicate glass containing various alkali metal and alkaline earth metal oxides is more complex. The high-field cations introduced by alkaline earth metal oxides affect the form of aluminum and boron atoms in the network structure, resulting in their variable roles in the network structure. Abd El-Moneim et al. [21] found that in ternary alkaline earth aluminoborate glass RO-Al2O3-B2O3, where R = Mg, Ca and Sr, the network connectivity of magnesium-doped aluminoborate glass was the strongest, and the effect of Ca on enhancing network connectivity was stronger than that of Sr. In alkali-free aluminoborosilicate glass, with the increase in alkaline earth metal oxides, aluminum always exists in the four-coordinated form. Boron is mainly three-coordinated; four-coordinated boron increases the elastic modulus and elasticity of the glass, and the density increases as it increases, while the acid resistance decreases [22].
The structure of glass has an important influence on its properties. Raman spectroscopy and nuclear magnetic resonance spectroscopy are two complementary methods for studying the glass structure. Manara et al. [23] summarized the vibration types of boron using Raman spectroscopy, and the borate vibrations were concentrated in the low-frequency region of <1000 cm−1. In the region of 800–1200 cm−1, there were silicon–oxygen tetrahedrons with different bridging-oxygen number (Qn, where n is the bridging oxygen number, with 0 ≤ n ≤ 4) stretching vibrations [24,25,26,27,28,29,30]. The vibration of part of the boron species in this region overlaps with the vibration of the silicon–oxygen tetrahedron [31,32,33,34,35,36,37]. Therefore, it is difficult to quantitatively analyze the boron species by Raman spectroscopy alone. NMR has been widely used in glass structures. 27Al MAS NMR provides information about the amount of four-coordinated aluminum and can identify the amount of AlIV incorporated in the network; the 29Si MAS NMR data also provide information about the glass network structure and the number of Si-O-Al linkages connected by bridging oxygen; the broad spectrum of 11B MAS NMR is used to determine the content of [BO4] and [BO3] groups, including symmetric and asymmetric triangular boron groups [38,39].
In this paper, a high-temperature melting method was used to prepare a lithium aluminum silicate (LAS) glass sample with a molar composition of 3.75Na2O-5.94MgO-10.06Al2O3-(71.64-x) SiO2-8.62Li2O-xB2O3. The effects of B2O3 on the network structure and density, molar volume, chemical stability, and mechanical properties of glass were studied and analyzed by means of nuclear magnetic resonance spectroscopy and Raman spectroscopy, and the relationship among glass composition, structure and performance was analyzed.
2. Materials and Methods
2.1. Glass Preparation and Characterization
The main raw materials of LAS glass prepared using the high-temperature melting method were: ultra-white silica sand (SiO2; 99.7%), sodium carbonate (Na2CO3; 99%), magnesium oxide (MgO; 99.5%), lithium carbonate (Li2CO3; 99%), aluminum hydroxide (Al(OH)3; 99.47%) and boric acid (H3BO3; 99.92%), using NaCl as clarifying agent. The molar composition of boron-doped LAS glass was: 3.75Na2O-5.94MgO-10.06Al2O3-(71.64-x)SiO2-8.62Li2O-xB2O3(x = 0,1.5,2.5,3.5,4.5,5.5,6.5). We put the weighed raw materials into a quartz crucible, which we heated in a high-temperature furnace at 1600 °C for 2 h; then, we took out the molten glass and poured it into a stainless-steel mold for casting; then, we put it in an annealing furnace at 600 °C for 2 h, followed by cooling down to room temperature within the furnace.
It was likely that a significant proportion of boron volatilized at high temperatures and caused deviations from nominal compositions. With this in mind, an additional 12% B2O3 was added to each sample to compensate for volatilization prior to melting. For example, 1.5 mol% B2O3 for 2# was equivalent to 1.72 wt% oxide, and we added an additional 1.72 × 12% g B2O3 per 100 g of oxide in a well-mixed batch. The practical proportion and volatility of B2O3 measured by chemical analysis are shown in Table 1. The test method was in accordance with the Chinese national standard method. From the quantitative analysis results of ICP and XRF, the volatiles of B2O3 in the samples were not exactly the same, but the actual concentration of B2O3 was close to the nominal value. As shown in Table 1, the deviation of boron content was not more than 5%. Deviations from nominal components were, therefore, ignored in the calculations to simplify the understanding process.

Table 1.
The quality contents of B2O3 in all samples (wt%). All data were only calculated for oxides.
2.2. Glass Testing and Characterization
Solid-state 29Si NMR spectra were obtained using a Bruker AVANCE III HD 400 MHz solid-state NMR spectrometer, which had an H/X dual resonance solid probe, a 4 mm ZrO2 rotor and a rotor speed of 14 kHz; the detection resonance frequency of the 29Si NMR spectrum is 79.49 MHz, and the magnetic field strength is 9.4 T, while scan times are generally 512 times an hour. 27Al NMR spectra were obtained using a Bruker AVANCE III HD 400 MHz solid-state NMR spectrometer, which also had an H/X dual-resonance solid-state probe, a 4 mm ZrO2 rotor, and a rotating speed of 14 kHz. The detection resonance frequency of 27Al is 104.26 MHz, and the number of scans is generally 4096 times an hour. 11B solid-state NMR spectra were acquired using a Bruker AVANCE NEO 400 WB solid-state superconducting NMR spectrometer (Fällanden, Switzerland), with samples loaded in 4 mm ZrO2 sample tubes with a Bruker 4 mm standard probe, using the single-pulse technique. The resonance frequency of the boron spectrum is 128.39 MHz. The deconvolution of the NMR spectra was performed with DM-fit software [40]. When only the central part of the spectrum was considered, the non-linear least squares method was used to iteratively determine the positions of different components and calculate the corresponding areas. The accuracy of the chemical shift value of the NMR spectrum was estimated to be 0.2 ppm, and the accuracy of the area quantification was estimated to be 3%. Raman excitation was applied using a solid-state 532 nm wavelength laser and an output power set to 40 milliwatts. The acquisition time for a given sample was usually between 20 and 60 s, and 6 scans were accumulated. In order to determine whether the glass samples were uniform, at least 4 spectra were collected for each sample. Subtract the background using a third-order polynomial function anchored in the unbanded region: ~200 cm−1, 850 cm−1, 1200 cm−1, and 1600 cm−1. Raman spectra were acquired at room temperature without correction for the temperature and frequency dependence of scattering intensity. At room temperature, a third-order polynomial function anchored in the non-band region was used to subtract the spectrum from the spectrum background from 200 to 1800 cm−1.
Vickers hardness was measured with a microhardness tester. The experimental loading time was 10 s, and the loading pressure was 1.96 N; each sample was tested 5–10 times to reduce experimental errors and improve the accuracy and reliability of the experiment. Archimedes’ buoyancy method was used to measure the density of the samples, and the molar volume was calculated according to Formulas (1) and (2) combined with the density. The dynamic method was used to measure the thermal expansion coefficient of the sample. The instrument used was an American Orton DIL2010STD thermal expansion instrument. The shaped and annealed glass samples were cut into strips with a length × width × height of 25.4 × 8 × 5 mm, the heating rate was 5 °C/min, and the heating temperature range was 25~500 °C.The shaped and annealed glass samples were cut into strip samples with a size of 25.4 × 8 × 5 mm, at a heating rate of 5 °C/min and a heating temperature range of 25~500 °C. The sample was cut into a size of 30 mm × 30 mm × 1 mm and optically polished for chemical stability testing. The glass slides were immersed in a 10 vol% hydrofluoric acid solution at room temperature for 30 min, and some glass plates were immersed in a solution of equal volumes of 1 mol/L NaOH and 1 mol/L KOH at 90 °C for 4 h. The chemical stability of glass is mainly expressed by the weight loss ratio (WLR) [22].
where ρg is the density of the glass sample; ρw is the density of water at room temperature, and the unit of density is g/cm3; M is the mass of the glass in air (g); and m is the equilibrium reading of glass in water (g).
where ρ is the glass density; xi is the mole fraction of oxide component I; and Mi is the molecular weight.
where m1 is the mass of ultrasonic cleaning before etching; m2 is the mass of ultrasonic cleaning after etching; and s is the surface area of glass sample.
3. Results
3.1. Structural Analysis
3.1.1. 27Al NMR Analysis
The 27Al NMR spectra of boron-doped lithium aluminum silicate glass are shown in Figure 1a. The 27Al MAS NMR peaks of the seven glass samples were all asymmetric composite peaks with a relatively broad distribution due to the quadrupole-broadening and localized-bonding environment related to compositional complexity, and the chemical shift in the resonance peak was ~42 ppm; the peak shapes were also roughly similar, indicating that the morphologies of the aluminum in the glass samples were relatively similar. With the increase in boron oxide content, the chemical shift in the peak shifted to high field, which may have been due to the fact that the oxygen in the Al–O bond carries low formal charge, and the amount of non-bridging oxygen in the Al–O network may be decreasing or the second element adjacent to it may change (BIII or Si is preferably to BIV and AlIV) [41]. In addition, the spectral peak widened asymmetrically toward the low-chemical-shift direction, which may have been related to the appearance of the high coordination of aluminum ions and the change in quadrupole-coupling parameters.
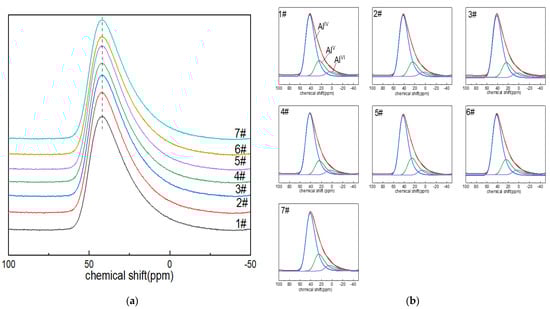
Figure 1.
(a) 27Al MAS NMR images of Li2O−Al2O3−SiO2 glass with different B2O3 contents; (b) fitting diagram of 27Al MAS NMR peaks of Li2O−Al2O3−SiO2 glass with different B2O3 contents.
In order to describe the coordination state of aluminum ions in the network structure and their respective contents, the reference and DM-fit software were used to fit and analyze the spectral peaks of the 27Al nuclear magnetic resonance of lithium aluminum silicate glass with the GIM model. GIM model fitting parameters included the following: the FWHM CS value was set to 14; the EM au value was set to −200; the d value was set to 5. The size of the computed spectra showed good rendering for 2048, but it was better with 8192, which was the preferred value. Step CSA, i.e., the step for sampling the isotropic CSA distribution in amorphous models, is typically 50, depending on the apodization factor. Step nuQ, i.e., the step for sampling the Gaussian distribution of quadrupolar interaction in amorphous or int2Q models, is typically 21, which can give decent results depending upon the final apodization factor. Sw mult, i.e., the sweep width multiplier, should be set to 4 in principle.
The chemical shift in the AlIV peak in the network structure is about 45.8 ppm [42]. The peak shifts of AlV and AlVI are around 38–28 ppm and (–5)–15 ppm [43]. The GIM model fitting and calculation results of 27Al NMR spectra are shown in Figure 1b and Table 1. In the alumina network of boron-doped LAS glass, aluminum was always four-coordinated. The content of AlV was only second to that of AlIV. It can be seen from Table 2 that with the increase in boron content, the contents of AlIV, AlV and AlVI in the aluminum–oxygen network changed little, and the spectral peak of AlIV gradually moved toward the direction of low chemical shift.
Table 2.
Calculation results of GIM model fitting of 27Al NMR spectra.
3.1.2. 11B NMR Analysis
Figure 2a shows the NMR spectra of glass 11B. When a relatively weak magnetic field of 9.39 T was used, the NMR spectra contained two parts of the signal that could be resolved, which was consistent with the three-coordinated and four-coordinated boron atoms in the glass structure. It appeared that the symmetrical and relatively narrow Gaussian line shape in the ~0 ppm region was attributed to the [BO4] tetrahedron (i.e., BIV), while the complex-shaped, low-intensity asymmetric broad signal with chemical shifts of NMR peaks close to ~10 ppm corresponded to [BO3] units (BIII). The chemical shifts of [BO3] and [BO4] associated with the two species changed little, so the properties of the entities did not appear to change significantly during the substitution. With the increase in boron oxide content, the absorption intensity of the boron-oxygen tetrahedral NMR spectral peak located at ~0 ppm increased gradually, that is, the content of BIV increased.
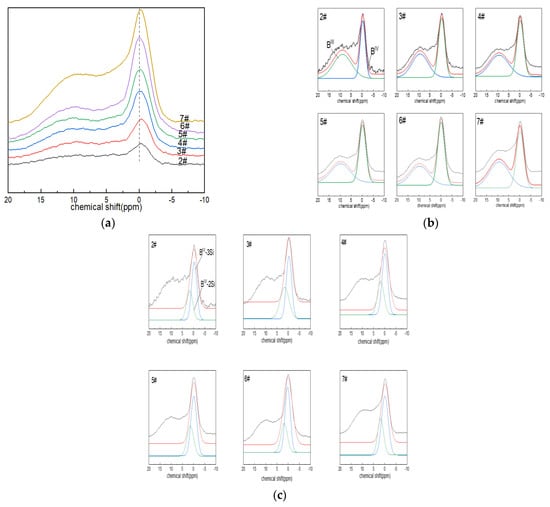
Figure 2.
(a) 11B MAS NMR images of Li2O−Al2O3−SiO2 glass with different B2O3 contents; (b,c) fitting diagram of 11B MAS NMR peaks of Li2O−Al2O3−SiO2 glass with different B2O3 contents.
The 11B NMR peaks were deconvolved with a Gaussian model to determine the components (BIII and BIV). The area percentages of BIV and BIII were calculated, along with their respective contents (N4 and N3; N4 + N3 = 1). The connectivity of the silicate and borate networks could also be reflected by 11B NMR, and the fitting results are shown in Figure 2c. The connection of four-coordinated boron atoms with silicon atoms included: BIV-2Si (one four-coordinated boron atom linked to two silicon atoms via bridging oxygen), ~2.5 ppm; and BIV-3Si (one four-coordinated boron atom connected with three silicon atoms via bridging oxygen), ~0.5 ppm [43].
From the fitting results in Figure 2b,c and Table 3, it can be seen that the network structure of glass was dominated by BIV. The bonding states of free oxygen and boron atoms provided by alkaline earth metals or alkali metal oxides were related to their molar ratio, that is, Ψ = (O-Al2O3)/B2O3 (where O is the molar number of free oxygen); when Ψ ≥ 1, boron mainly existed in tetra-coordination. In the boron-doped glass system, when all Ψ > 1, the network structure was dominated by BIV. With the increase in the boron oxide content, N4 increased, and the area percentage of the BIV-3Si spectral peak at ~0.5 ppm was always more than the BIV-2Si spectral-peak area percentage at ~2.5 ppm.
Table 3.
Calculation results of quadrupolar model fitting of 11B NMR spectra.
3.1.3. 29Si NMR Analysis
The peaks of the 29Si NMR spectra ranged from −90 to ~−130 ppm (Figure 3a), centered on a broad resonance of −110 ppm. With the increase in boron oxide content, the spectral peaks tended to shift to the low field of ~−150 ppm, which was related to the existence of aluminum or boron atoms in the silicon–oxygen tetrahedron and the non-bridging oxygen number in the silicon–oxygen tetrahedron. The chemical shift in the spectral peaks of glass sample No. 7# was the most obvious. The presence of boron or aluminum resulted in a shift in the chemical shifts, and the substitution of [SiO4] with AlIV or BIV increased the chemical shift values by approximately 5 ppm [44]. Similarly, the presence of non-bridging oxygen atoms within the silicon coordination polyhedron caused the peaks to shift toward the high fields due to the high formal charge carried by oxygen [41].
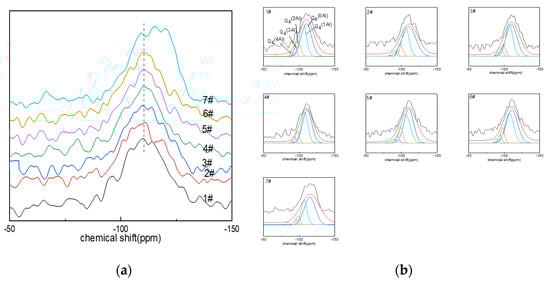
Figure 3.
(a) 29Si MAS NMR of Li2O−Al2O3−SiO2 glass with different B2O3 contents; (b) fitting diagram of 29Si MAS NMR peaks of Li2O−Al2O3−SiO2 glass with different B2O3 contents.
The deconvolution of the 29Si NMR spectra could quantify the quantity of Qnm(Al) in the network, where 0 ≤ m ≤ n ≤ 4, with n being the coordination number of silicon and m the aluminum atom connected with the silicon atom through the bridging-oxygen quantity. Qnm(Al) was used to describe the connectivity of the silicon–oxygen network and aluminum–oxygen network. The connection between silicon and four-coordinated aluminum included: Q4(0Al) connected with four silicon atoms (−102~−115 ppm); Q4(4Al) connected with four aluminum atoms (−82~−90 ppm); Q4(3Al) connected with three aluminum atoms (−85~−94 ppm); Q4(2Al) connected with two aluminum atoms (−92~−98 ppm); Q4(1Al) connected with an aluminum element (−96~−107 ppm) [45]. The Gaussian model fitting results of the 29Si NMR spectra of glass are shown in Figure 3b and Table 4.
Table 4.
Calculation results of Gaussian model fitting of 29Si NMR spectra.
From the fitting calculation results of the 29Si NMR spectra (Figure 3b), it can be seen that the main species in the glass network structure was Q4(0Al), followed by Q4(1Al); the area percentage of the two exceeded 60%, and Q4(3Al) and Q4(4Al) contents were low. Among them, the Q4(0Al) content of glass samples Nos. 1#~6# increased with the increase in boron oxide content, while the content of Q4(0Al) of glass sample No. 7# decreased compared with that of No. 6#. However, the area percentage of Q4(0Al) eventually dominated.
3.1.4. Raman Spectroscopy
Figure 4 shows the Raman spectra of lithium aluminosilicate glass. The relationships between the vibrations of the main functional groups in the spectra and the corresponding wave numbers are shown in Table 5. The dominant vibrations of the silicate network could be found in Si-O-Si within [SiO4] without non-bridging oxygen in the glass network structure in the lowest region between 200 cm−1 and 700 cm−1 corresponding to the T-O-T (where T is a Si atom) bending vibration. The bending vibrations and stretching vibrations of Qn between 850 cm−1 and 1200 cm−1 corresponding to stretching were observed in the lowest region (n is the number of bridging oxygens in the silicon–oxygen tetrahedron).
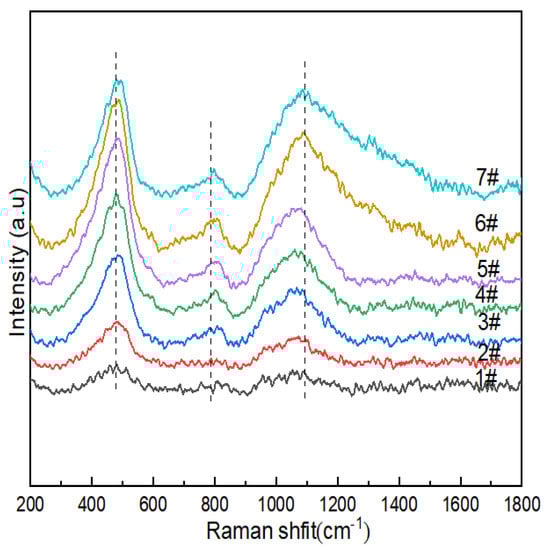
Figure 4.
Raman spectra of Li2O−Al2O3−SiO2 system glass with different B2O3 contents.
Table 5.
Raman vibration groups of glass.
The wave-number Raman spectra of the glass sample in the range of 200–1800 cm−1 are shown in Figure 4; there were characteristic peak intensity responses at 400–470 cm−1, 700–900 cm−1 and 900–1200cm−1. The vibrational peaks of 1#~7# were concentrated at ~480 cm−1, which indicated that more 5- and 4-membered rings formed in 2#, 3# and 4#. The peak at 470 cm−1 was attributed to the mixed tensile bending vibration mode of Si-O-Si, and with the increase in B2O3 (mol%), the peak intensities of 1#~6 # gradually increased, while the peak intensity of 7# decreased. Combined with 29Si NMR, it can be seen that the content of Q4(0Al) decreased, and the connectivity of the silicate sub-network of glass changed. The vibrational peak at ~760cm−1 was the stretching vibration of the Si-O-Al linkages between [AlO4] and [SiO4] formed after Al3+ in the composition entered the network. The peak observed at ~770 cm−1 was attributed to the tetrahedral coordination of boron in glass due to the higher vibrational intensity of glass with high boron and low Na2O contents (e.g., 6#), while the opposite was true for glass with high Na2O and low B2O3 contents, which indicated that the modifier (such as sodium ions) functioned as a charge compensator, changing the neutral [BO3] unit into [BO4]-, thereby improving the aggregated state of the glass structure. It may have been formed by the breathing vibration of [BO3] of the three-membered ring at ~803cm−1. Combined with 11B NMR, it can be seen that its effect was relatively weak. In the range of 900-1200cm−1, we observed the Si-O stretching vibration in the silicon–oxygen tetrahedron, while the band at 920cm−1 could be attributed to the [BO4]- containing structural unit, while the stretching vibration mode of the mixed Si-O-B linkages was also expected to function in this range [46]. In borosilicate glass, it is generally believed that for low-modified oxide additions (R < 0.5), triangular [BO3]0 converts to a [BO4]- tetrahedron, and many NMR results are still interpreted to support the existence of [BO4]- only being connected with the four silicate tetrahedra and not with the borate network. The boron content of the lithium–aluminosilicate glass system studied by the subject was low, and the band intensity related to borate was not as strong as the Si-O stretching vibration peak in the silicon–oxygen tetrahedron in the range of 900~1200 cm−1. With the increase in B2O3 (mol%), the peak intensity at 770 cm−1 gradually increased, which indicated that the content of [BO4] in glass increased, which was consistent with the calculation results of 11B NMR fitting. The band at 1080 cm−1 had a B-O stretching mode of tetrahedral borate units with a slight increase in peak intensity.
4. Discussion
4.1. Summary of the NMR and Raman Observations
The coordination state of aluminum ions in the glass network structure is related to the ratio of the alumina content in glass to the modifier oxide content, that is, Al2O3/M2O(MO) (where M is the modifier cation). When Al2O3:M2O(MO) < 1, a sufficient number of oxygen ions in the system convert aluminum ions into a tetrahedral coordination, and Al3+ acts as a network former [47]. In the boron-doped glass system, Al2O3:M2O(MO) < 1, and the number of oxygen ions was sufficient. Because Al3+ has a larger nuclear charge number than B3+, its ionic field is stronger, and the content of boron is smaller than that of aluminum, so it is more favorable for Al3+ to preferentially combine with free oxygen. Therefore, the incorporation of boron did not substantially affect the coordination of aluminum ions. The increase in the coordination of aluminum ions stemmed from the competition for short and strong oxygen bonds between modifier cations and aluminum atoms. Modifiers with smaller radii and higher charges have a stronger ability to compete for oxygen, which promotes the high coordination of aluminum ions [48].
When modifier oxide was added to glass to promote the formation of BIV, the oxygen ion (O2−) in the oxide destroyed the network connection, converted bridging oxygen (BO) to NBO, and changed the coordination of boron. The conversion relationship between BIV and BIII is shown below.
BIV⇄BIII +NBO
Modifier field strength, boron concentration, aluminum and total modifier content have important effects on the coordination of boron in a network structure [49]. At high temperatures, the reaction skews to the right. The effect of temperature on N4 depends on the NBO content, which, in turn, depends on the composition. Increasing the SiO2 content to a certain extent gives the possibility of reducing the BIV-O-BIV linkages by dilution, and if the borate units in the network are less diluted by SiO2, the number of BIV-O-BIV linkages increases [20]. Under the premise that the borate units in the network structure are less diluted by silica, network connections with relatively high formal charges, e.g., BIV-O-BIV and AlIV-O-BIV, may increase. These linkages represent a charge concentration that is (−0.5) more negative than that of linkages such as BIII-O-BIV (−0.25), BIII-O-BIII(0) and [4]Si-O-BIII(0); the charge value is also expected to be stabilized to a certain extent by higher-field-strength-modified cations, which can better compensate for BIV-O-BIV and the charge of AlIV-O-BIV [49]. In BIV-O-BIV and AlIV-O-BIV linkages, BOs with higher negative charge concentrations compete with modifier cations for charge compensation more than the NBOs in the BIII-O-BIV(−0.25) and BIII-O-BIII(0) linkages, which is more advantageous. Therefore, in glass with high modifier content, N4 is still high.
To test the interpretation of the 29Si NMR spectrum in terms of Qn(mAl) composition, the main assumptions regarding the location of non-bridging oxygen, which is assumed to only be present in the silicon environment, and the alignment of aluminum–oxygen–aluminum bonds according to Lowenstein’s rule are first emphasized, with missing or negligible ratio. Furthermore, the properties of the Qn(mAl) structural environment take into account the chemical shift ranges given by Engelhardt et al. [50] and are derived from extensive studies of crystalline mineral morphology [51].
The introduction of boron oxide resulted in a shift in the signal center of gravity towards the lower-chemical-shift direction and an increase in signal asymmetry with the emergence of separation towards the lower-chemical-shift direction. Therefore, this evolution of the 29Si NMR spectra may have reflected an increase in silicate network aggregation, especially due to the formation of Q4(0Al) species, or a decrease in Si-O-Al linkages, which was to be expected here. With the addition of boron, the connectivity of Al in the tetra-coordinated silicon environment evolved, and the increase in Qn(0Al) entities explained the shift in the spectrum to high fields. The content of Q4(1Al) in the network structure was only second to that of Q4(0Al), and the sum of the two exceeded 60%. The content of Qnm(Al) (2 ≤ m ≤ 4) showed a decreasing trend as a whole with the increase in boron oxide content. The area percentage of AlV was only second to that of AlIV, relatively speaking; the number of AlIV entering the network framework decreased, which was beneficial to the formation of Q4(0Al) [43]. The decrease in the content of Qnm(Al) (2 ≤ m ≤ 4) meant that the connectivity between the pure silicon–oxygen network and the aluminum–oxygen network was weakened.
Raman spectroscopy showed increased interconnectivity of the borate and silicate sub-networks in the glass network, which was due to the fact that silicates consist of smaller rings and more mixed sub-networks of Si-O-B linkages, and the mixed Si-O-B linkages represented the coexistence of Si-O-BIII linkages and Si-O-BIV linkages. From the perspective of the integrity of the Si-O-Si groups, B first enters the connecting bonds of the network in a layered [BO3] structure, which has a certain degree of negative impact on the integrity of the surrounding Si-O bonds. As a result, the bond fracture of the silica skeleton occurs, resulting in the destruction of the integrity of the silicon–oxygen–silicon group. From the uniformity of the structure distribution, when the layered conformation is inserted into the three-dimensional conformation and there is no obvious phase separation, the jamming phenomenon very easily occurs inside the network. This is also the reason why B2O3 can be introduced into some glass systems as a flux. Combined with the fitting results of NMR spectra, it could be inferred that the vibration peaks of [SiO4] with different bridging-oxygen numbers in the range of 800–1100 cm−1 were Qn, and Q1 mainly included Q4(1Al); Q2 mainly included Q4(2Al) and BIV-2Si; Q3 mainly included Q4(3Al) and BIV-3Si; and Q4 mainly included Q4(4Al).
4.2. Effect of Network Structure on Performance
4.2.1. Thermal Expansion Analysis
The coefficient of thermal expansion reflects the ability of the glass structure to resist deformation when heated and is one of the ways to characterize the properties of glass. The thermal expansion curve of Li2O-Al2O3-SiO2 series glass with different B2O3 contents is shown in Figure 5. The thermal expansion coefficients of the seven groups of samples were 6.90 × 10⁻⁶/K, 6.65 × 10⁻⁶/K, 6.50 × 10⁻⁶/K, 6.45 × 10⁻⁶/K, 6.34 × 10⁻⁶/K, 6.00 × 10⁻⁶/K and 5.93 × 10⁻⁶/K.
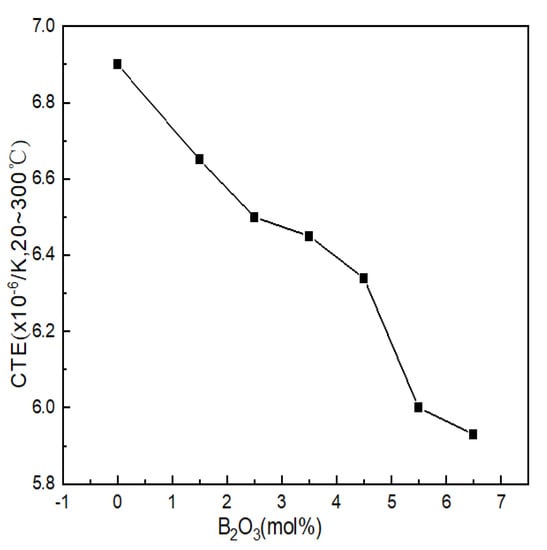
Figure 5.
Curve of thermal expansion coefficients of Li2O−Al2O3−SiO2 system glass with different B2O3 contents.
B2O3 was arranged in the glass structure in the form of BIII and only relied on weak van der Waals forces to connect between the layered structures; the binding force that the particle vibration needed to overcome became smaller, resulting in an increase in the thermal expansion coefficient. During the appearance of highly coordinated boron (BIV) in glass, the bonding force of the structural connection was greatly strengthened within a certain range (mainly compared with the van der Waals force), and the layered structure of the glass was repaired and accumulated into a spatial grid, which directly led to the reduction in the thermal vibration amplitude of the particles. The smaller the distance between the particles was, the smaller the thermal expansion coefficient of the glass was; the influence of structural unit BIV on the glass network structure was similar to that of the [AlO4] tetrahedron, and the broken network could also be reconnected. Therefore, BIV had a positive effect on the thermal expansion of the glass. It can be seen from Figure 5 that after adding B2O3, the thermal expansion coefficient showed obvious regularity. The thermal expansion coefficients of glass samples 1#~7# decreased with the increase in boron oxide content, which was related to the network structure.
Combined with the GIM fitting calculation results of 27Al NMR, it can be seen that when the contents of B2O3 (mol%) were 2.5 and 6.5, the contents of AlIV decreased when B2O3 (mol%) had values of 1.5 and 5.5, while the high-coordinated molecules entering the network were reduced. The amount of aluminum was relatively high, and the density of the network structure was relatively low. Therefore, when the content of B2O3(mol%) increased from 2.5 to 3.5 and from 5.5 to 6.5, the decreasing trend of the thermal expansion coefficient was relatively gentle.
4.2.2. Microhardness
Microhardness is the most commonly used index to characterize the mechanical properties of materials. It is affected by the degree of aggregation of the network structure. Figure 6 shows the Vickers hardness of Li2O-Al2O3-SiO2 series glass with different B2O3 contents.
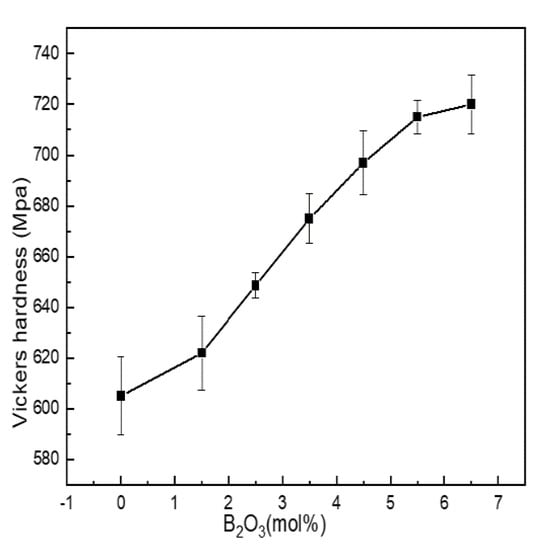
Figure 6.
Change curve of mechanical properties of Li2O−Al2O3−SiO2 series glass with different B2O3 contents.
Vickers hardness was between 605 and 720 MPa. When the content of B2O3 (mol%) increased from 0 to 5.5, boron and aluminum mainly existed in four-coordinated forms, acting as network formers. N4 and Q4(0Al) increased with the increase in boron content, and the network structure shrank, while the density and integrity of the structure were enhanced, and the ability to resist external force damage was enhanced.
When B2O3(mol%) = 6.5, the values of N4, Q4(0Al) and AlIV were all lower than when B2O3(mol%) = 5.5. The content of SiO2 in the glass exceeded 60 mol%, and the network modifiers containing N3, AlV and AlVI were not only connected with the silicon skeleton but also entered the glass cavity to improve the network density and the content of N4, while Q4(0Al) and AlIV always dominated. Therefore, the increased content of network modifier did not change the overall change trend of Vickers hardness but only slowed down its growth trend.
4.2.3. Physical Properties
Density is the most basic performance parameter of an object. The density of glass is sensitive to changes in structure, and structural changes are basically reflected in changes in density. The molar volume of glass depends on the packing density of atoms in the glass network structure and the density and integrity of the glass network, which reflect the porosity of the glass structure. Figure 7 shows the experimentally obtained density and molar volume results.
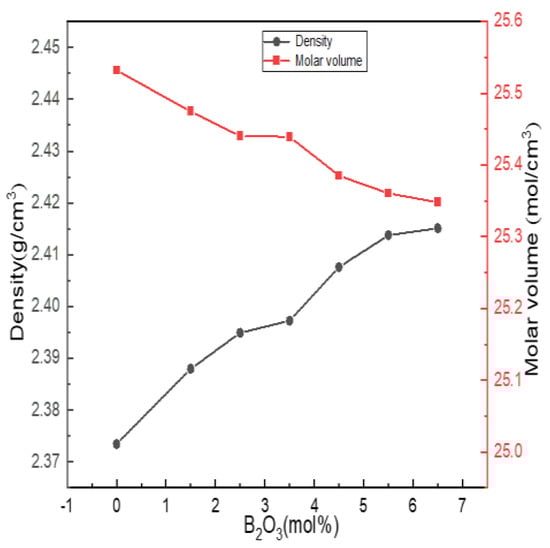
Figure 7.
Change curves of physical properties of Li2O−Al2O3−SiO2 series glass with different B2O3 contents.
It can be seen from Figure 7 that the density of the glass increased with the increase in the boron oxide content, and the molar volume gradually decreased with the increase in the boron oxide content. When the content of B2O3 (mol%) increased from 0 to 5.5, combined with the fitting calculation results of 27Al, 11B and 29Si NMR spectra, it can be seen that boron and aluminum atoms mainly existed in four-coordinated forms, acting as network formers; N4 and Q4(0Al) increased, and the network structure shrank, while the structure density and integrity were strengthened.
When B2O3 (mol%) = 6.5, compared with B2O3 (mol%) = 6.5, the values of N4, Q4(0Al) and AlIV in the network structure decreased. However, the density change trend did not change, which was related to the way in which [BO3] was connected with the silica skeleton. The SiO2 content of the entire glass system exceeded 60 mol%. [BO3] and [BO4] in the high silicon glass system were mainly connected with the silica skeleton, and some [BO3] may have entered the glass cavity, such as the AlV or AlVI of the network modifier, causing the network structure to shrink. Therefore, the increasing trend of density became flat.
4.2.4. Chemical Stability
The chemical stability of glass is affected by the composition, structure and other factors of glass. The erosion effect of acid on glass is to change, destroy or leach the network modifiers, such as alkaline earth metals or alkali metal oxides, in the glass structure; alkalis not only act on the network modifiers but also dissolve the silica skeleton of glass. Figure 8 shows the weight loss ratio of lithium aluminum silicate glass with different boron oxide content in strong acid and strong alkali solutions.
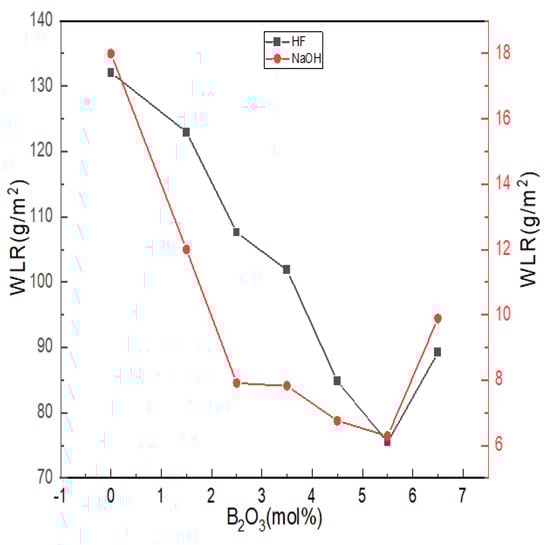
Figure 8.
Chemical stability curves of Li2O−Al2O3−SiO2 series glass with different B2O3 contents.
With the increase in boron oxide content, the weight loss ratio of glass in hydrofluoric acid and alkali solutions showed a trend that first decreased and then increased. The alkaline earth metal ions in the glass formed low-solubility silicates with the silicate ions generated after erosion and adhered to the glass surface to form a protective film, which can slow down further erosion, so the overall quality of glass lost in the alkaline solution was maintained at lower levels. The degree of damage of H+ and OH- to the damaged network structure was related to the number of non-bridging oxygens in the network structure. According to the NMR spectra and the Raman test results, with the increase in boron content, the aluminum ion was dominated by tetra-coordination, while the values of N4 and Q4(0Al) increased, and the number of bridging oxygens increased. The ternary network skeleton structures of [SiO4], [BO4] and [AlO4] tetrahedra were more compact, and the resistance of glass in hydrofluoric acid and alkali solutions increased. The reaction difficulty was increased, and the chemical stability was improved.
The acid resistance is not only affected by the structural integrity of a glass network but is also related to the cation species. Compared with Al3+, B3+ can enhance the acid resistance of glass within a certain range [22]. The corrosion of glass by HF mainly relies on the electrophilic corrosion of non-bridging oxygen by high concentrations of H+, which undergoes a substitution reaction with R2+ [52]. As more B3+ was introduced into bonding sites in the form of -Si-O-BIV, it was difficult for the electrophilic corrosion mechanism of HF in the form of ion exchange to occur in the glass, so the acid resistance of glass became better. Since the glass itself reacted with HF (Al2O3, SiO2, etc.), acid weight loss was generally at a high level.
When B2O3 (mol%) = 6.5, the weight loss rate of glass in hydrofluoric acid solution and alkali solution increased, and when B2O3 (mol%) = 5.5, the chemical stability of glass appeared to have an extreme value. When B2O3 (mol%) = 6.5, the contents of [AlO6] and [AlO5] in the glass were the highest. [AlO6] and [AlO5] generally cause the prominent Si-O bond to break around it. The unstable polar covalent bond requires more R2+ for charge neutralization and increases the sensitivity to acid or alkaline olutions due to its relatively relaxed structure that promotes the acceleration of ion transport.
5. Conclusions
In this paper, the effects of different contents of B2O3 (mol%) on the structure, thermal properties, chemical stability and mechanical properties of Li2O−Al2O3−SiO2 series glass were studied.
According to the fitting calculation results of the NMR spectra of 27Al, 11B and 29Si, it could be seen that the aluminum atoms in the network structure were dominated by four-coordinated AlIV and that the content of AlIV did not change with B2O3 (mol%); boron was mainly tetra-coordinated [BO4], and the N4 value increased with the increase in boron oxide content. The content of Q4(0Al) in the silicon spectrum dominated and increased with the increase in B2O3 (mol%); at B2O3 (mol%) = 6.5, Q4(0Al) decreased. The overall density of the glass network structure constructed by the borate network, the silicon–oxygen network and the aluminum–oxygen network increased with the increase in B2O3(mol%). Combined with the fitting results of the nuclear magnetic resonance spectra, it could be inferred that the types of [SiO4] vibration peaks in the range of 800–1100 cm−1 in the Raman spectra of different bridging-oxygen numbers were Qn, where Q1 mainly included Q4(1Al); Q2 mainly included Q4(2Al) and BIV-2Si; Q3 mainly included Q4(3Al) and BIV-3Si; and Q4 mainly included Q4(4Al).
The incorporation of boron oxide improved the degree of polymerization and connectivity of the glass network structure as a whole, and its corresponding mechanical properties and physical properties were also optimized. When B2O3 (mol%) = 5.5, the thermal expansion coefficient of glass was 6.00 × 10⁻⁶/K; the flexural strength and hardness were 180.665 Mpa and 715 Mpa, respectively; the density was 2.41g/cm3; and the acid resistance was improved by about 43%. On the whole, when B2O3 (mol%) = 5.5, the performance of glass was the best.
Author Contributions
S.H., Conceptualization, Investigation, Primary Analysis, Experimental Research, Writing (Original Draft), Project Administration and Execution. W.W. Assistance in Experiments. Y.M., Conceptualization, Validation, Writing (Review and Editing), Resources and Funding Acquisition. H.J. and H.Z., Conceptualization, Validation, Writing (Review and Editing), Resources, Funding Acquisition, Writing (Revision), Analysis and Demonstration. All authors have read and agreed to the published version of the manuscript.
Funding
This work was jointly supported by Natural Science Foundation of China (51761010) and the Key Research and Development Program of Hainan Province (ZDYF2020015).
Data Availability Statement
The datasets generated during and/or analyzed during the current study are available from the corresponding author upon reasonable request.
Acknowledgments
The author thanks Jiang Hong for his support and Hainan University and HNHT Special Glass Technology Co., Ltd., for providing infrastructure support.
Conflicts of Interest
The authors have no conflict of interest to declare that are relevant to the content of this article.
References
- Shan, Z.; Zhang, Y.; Liu, S.; Tao, H.; Yue, Y. Mixed-alkali effect on hardness and indentation-loading behavior of a borate glass system. J. Non-Cryst. Solids 2020, 548, 120314. [Google Scholar] [CrossRef]
- Schaut, R.A. The Effect of Boron Oxide on the Composition, Structure, and Adsorptivity of Glass Surfaces. Ph.D. Thesis, Pennsylvania State University, State College, PA, USA, 2008. [Google Scholar]
- Choi, S.H.; Na Ko, Y.; Kim, J.H.; Hong, Y.J.; Kang, Y.C. Characteristics of BaO–B2O3–SiO2 nano glass powders prepared by flame spray pyrolysis as the sintering agent of BaTiO3 ceramics. J. Alloy. Compd. 2011, 509, 7979–7984. [Google Scholar] [CrossRef]
- Sun, T.; Xiao, H.; Guo, W.; Hong, X. Effect of Al2O3 content on BaO–Al2O3–B2O3–SiO2 glass sealant for solid oxide fuel cell. Ceram. Int. 2010, 36, 821–826. [Google Scholar] [CrossRef]
- Derno, M.; Herms, G.; Steil, H. X-ray Study on the Boron Coordination in Sodium Borate Glasses at Higher Temperatures. Phys. Status Solidi (A) 1986, 93, K5–K8. [Google Scholar] [CrossRef]
- Lu, X.; Deng, L.; Huntley, C.; Ren, M.; Kuo, P.-H.; Thomas, T.; Chen, J.; Du, J. Mixed Network Former Effect on Structure, Physical Properties, and Bioactivity of 45S5 Bioactive Glasses: An Integrated Experimental and Molecular Dynamics Simulation Study. J. Phys. Chem. B 2018, 122, 2564–2577. [Google Scholar] [CrossRef]
- Lu, X.; Deng, L.; Du, J.; Vienna, J.D. Predicting boron coordination in multicomponent borate and borosilicate glasses using analytical models and machine learning. J. Non-Cryst. Solids 2020, 553, 120490. [Google Scholar] [CrossRef]
- Yiannopoulos, Y.D.; Chryssikos, G.D.; Kamitsos, E.I. Structure and properties of alkaline earth borate glasses. Phys. Chem. Glasses 2001, 42, 164–172. [Google Scholar]
- Wright, A.C.; Dalba, G.; Rocca, F.; Vedishcheva, N.M. Borate versus silicate glasses: Why are they so different? Phys. Chem. Glasses-Eur. J. Glass Sci. Technol. Part B 2010, 51, 233–265. [Google Scholar]
- Ghoneim, N.; Abbas, A. Thermal expansion of high lead borate glasses and the boric oxide anomaly. Thermochim. Acta 1993, 66, 91–103. [Google Scholar] [CrossRef]
- Roderick, J.; Holland, D.; Howes, A.; Scales, C. Density–structure relations in mixed-alkali borosilicate glasses by 29Si and 11B MAS–NMR. J. Non-Cryst. Solids 2001, 293–295, 746–751. [Google Scholar] [CrossRef]
- Bubnova, R.; Levin, A.A.; Stepanov, N.K.; Belger, A.; Meyer, D.C.; Polyakova, I.G.; Filatov, S.; Paufler, P. Crystal structure of K1-xCsxBSi2O6 (x = 0.12, 0.50) boroleucite solid solutions and thermal behaviour of KBSi2O6 and K0.5Cs0.5BSi2O6. Z. Für Krist.-Cryst. Mater. 2002, 217, 55–62. [Google Scholar] [CrossRef]
- Betzen, A.R.; Kudlacek, B.L.; Kapoor, S.; Berryman, J.R.; Lower, N.P.; Feller, H.A.; Affatigato, M.; Feller, S.A. Physical properties of barium borosilicate glasses related to atomic structure. Phys. Chem. Glasses 2003, 44, 207–211. [Google Scholar]
- Levitskii, I.A.; Gailevich, S.A.; Shimchik, I.S. The Effect of Bivalent Cations on the Physicochemical Properties and Structure of Borosilicate Glasses. Glas. Ceram. 2004, 61, 73–76. [Google Scholar] [CrossRef]
- Protasova, L.G.; Kosenko, V.G. Effect of Additives on the Structure and Physicochemical Properties of Sodium-Borosilicate Glasses. Glas. Ceram. 2003, 60, 164–165. [Google Scholar] [CrossRef]
- Bobkova, N.M. Thermal Expansion of Binary Borate Glasses and Their Structure. Glas. Phys. Chem. 2003, 29, 501–507. [Google Scholar] [CrossRef]
- Yun, Y.; Bray, P. Nuclear magnetic resonance studies of the glasses in the system Na2O-B2O3-SiO2. J. Non-Cryst. Solids 1978, 27, 363–380. [Google Scholar] [CrossRef]
- Stebbins, J.F.; Zhao, P.; Kroeker, S. Non-bridging oxygens in borate glasses: Characterization by 11B and 17O MAS and 3QMAS NMR. Solid State Nucl. Magn. Reson. 2000, 16, 9–19. [Google Scholar] [CrossRef]
- Du, L.-S.; Stebbins, J.F. Network connectivity in aluminoborosilicate glasses: A high-resolution 11B, 27Al and 17O NMR study. J. Non-Cryst. Solids 2005, 351, 3508–3520. [Google Scholar] [CrossRef]
- Dell, W.; Bray, P.; Xiao, S. 11B NMR studies and structural modeling of Na2O-B2O3-SiO2 glasses of high soda content. J. Non-Cryst. Solids 1983, 58, 1–16. [Google Scholar] [CrossRef]
- El-Moneim, A.A.; Youssof, I.; El-Latif, L.A. Structural role of RO and Al2O3 in borate glasses using an ultrasonic technique. Acta Mater. 2006, 54, 3811–3819. [Google Scholar] [CrossRef]
- Xie, J.; Tang, H.; Wang, J.; Wu, M.; Han, J.; Liu, C. Network connectivity and properties of non-alkali aluminoborosilicate glasses. J. Non-Cryst. Solids 2018, 481, 403–408. [Google Scholar] [CrossRef]
- Cormier, L.; de Sousa Meneses, D.; Neuville, D.R.; Echegut, P. In situ evolution of the structure of alkali borate glasses and melts by infrared reflectance and Raman spectroscopies. Phys. Chem. Glasses Eur. J. Glass Sci. Technol. B 2006, 47, 430–434. [Google Scholar]
- Mysen, B.O.; Virgo, D.; Seifert, F.A. The structure of silicate melts: Implications for chemical and physical properties of natural magma. Rev. Geophys. 1982, 20, 353–383. [Google Scholar] [CrossRef]
- Matson, D.W.; Sharma, S.K.; Philpotts, J.A. The structure of high-silica alkali-silicate glasses. A Raman spectroscopic investigation. J. Non-Cryst. Solids 1983, 58, 323–352. [Google Scholar] [CrossRef]
- Merzbacher, C.I.; White, W.B. The structure of alkaline earth aluminosilicate glasses as determined by vibrational spectroscopy. J. Non-Cryst. Solids 1991, 130, 18–34. [Google Scholar] [CrossRef]
- Neuville, D.R.; Cormier, L.; Massiot, D. Al environment in tectosilicate and peraluminous glasses: A 27Al MQ-MAS NMR, Raman, and XANES investigation. Geochim. Cosmochim. Acta 2004, 68, 5071–5079. [Google Scholar] [CrossRef]
- Malfait, W.; Zakaznova-Herzog, V.; Halter, W. Quantitative Raman spectroscopy: High-temperature speciation of potassium silicate melts. J. Non-Cryst. Solids 2007, 353, 4029–4042. [Google Scholar] [CrossRef]
- Morizet, Y.; Paris, M.; Gaillard, F.; Scaillet, B. Carbon dioxide in silica-undersaturated melt Part II: Effect of CO2 on quenched glass structure. Geochim. Cosmochim. Acta 2014, 144, 202–216. [Google Scholar] [CrossRef]
- Morizet, Y.; Vuilleumier, R.; Paris, M. A NMR and molecular dynamics study of CO2-bearing basaltic melts and glasses. Chem. Geol. 2015, 418, 89–103. [Google Scholar] [CrossRef] [Green Version]
- Manara, D.; Grandjean, A.; Neuville, D.R. In situ evolution of the structure of alkali borate glasses and melts by infrared reflectance and Raman spectroscopies. Am. Mineral. 2009, 94, 777–784. [Google Scholar] [CrossRef]
- Yadav, A.K.; Singh, P. A review of the structures of oxide glasses by Raman spectroscopy. RSC Adv. 2015, 5, 67583–67609. [Google Scholar] [CrossRef]
- Bunker, B.C.; Tallant, D.R.; Kirkpatrick, R.J.; Turner, G.L. Nuclear magnetic resonance and Raman investigation of sodium borosilicate glass structures. Phys. Chem. Glasses 1990, 31, 30–41. [Google Scholar]
- Wang, Z.; Cheng, L. Structural evolution of CeO2-doped alkali boroaluminosilicate glass and the correlation with physical properties based on a revised structural parameter analysis. RSC Adv. 2016, 6, 5456–5465. [Google Scholar] [CrossRef]
- Konijnendijk, W.; Stevels, J. The structure of borate glasses studied by Raman scattering. J. Non-Cryst. Solids 1975, 18, 307–331. [Google Scholar] [CrossRef]
- Meera, B.; Sood, A.; Chandrabhas, N.; Ramakrishna, J. Raman study of lead borate glasses. J. Non-Cryst. Solids 1990, 126, 224–230. [Google Scholar] [CrossRef]
- Yano, T.; Kunimine, N.; Shibata, S.; Yamane, M. Structural investigation of sodium borate glasses and melts by Raman spectroscopy. III. Relation between the rearrangement of super-structures and the properties of glass. J. Non-Cryst. Solids 2003, 321, 157–168. [Google Scholar] [CrossRef]
- Zhong, J.; Bray, P. Change in boron coordination in alkali borate glasses, and mixed alkali effects, as elucidated by NMR. J. Non-Cryst. Solids 1989, 111, 67–76. [Google Scholar] [CrossRef]
- Yun, Y.; Bray, P. B11 nuclear magnetic resonance studies of Li2O-B2O3 glasses of high Li2O content. J. Non-Cryst. Solids 1981, 44, 227–237. [Google Scholar] [CrossRef]
- Vidal, L.; Joussein, E.; Colas, M.; Cornette, J.; Sanz, J.; Sobrados, M.I.; Gelet, J.-L.; Absi, J.; Rossignol, S. Controlling the reactivity of silicate solutions: A FTIR, Raman and NMR study. Colloids Surf. A Physicochem. Eng. Asp. 2016, 503, 101–109. [Google Scholar] [CrossRef]
- Mabrouk, A.; Vaills, Y.; Pellerin, N.; Bachar, A. Structural study of lanthanum sodium aluminoborosilicate glasses by NMR spectroscopy. Mater. Chem. Phys. 2020, 254, 123492. [Google Scholar] [CrossRef]
- Kusumoto, H.; Hill, R.G.; Karpukhina, N.; Law, R.V. Magnesium substitution in calcium and strontium fluoro-phospho-aluminosilicate glasses by multinuclear 19F, 31P, 27Al, and 29Si MAS-NMR spectroscopy. J. Non-Cryst. Solids X 2019, 1, 100008. [Google Scholar] [CrossRef]
- Dupuy, C.; Gharzouni, A.; Sobrados, I.; Texier-Mandoki, N.; Bourbon, X.; Rossignol, S. 29Si, 27Al, 31P and 11B magic angle spinning nuclear magnetic resonance study of the structural evolutions induced by the use of phosphor- and boron–based additives in geopolymer mixtures. J. Non-Cryst. Solids 2019, 521, 119541. [Google Scholar] [CrossRef]
- Prasad, S.; Clark, T.M.; Sefzik, T.H.; Kwak, H.-T.; Gan, Z.; Grandinetti, P.J. Solid-state multinuclear magnetic resonance investigation of Pyrex®. J. Non-Cryst. Solids 2006, 352, 2834–2840. [Google Scholar] [CrossRef]
- Engelhardt, G.; Michel, D. High-Resolution Solid-State NMR of Silicates and Zeolites; John Wiley & Sons: New York, NY, USA, 1987. [Google Scholar]
- Prasad, K.; Suman, C.K.; Choudhary, R.N.P. Thermal history of a low alkali borosilicate glass probed by infrared and Raman spectroscopy. Eur. J. Glass Sci. Technol. Part A Glass Technol. 2006, 47, 133–137. [Google Scholar] [CrossRef]
- Osipov, A.A.; Eremyashev, V.E.; Mazur, A.S.; Tolstoi, P.M.; Osipova, L. Coordination state of aluminum and boron in barium aluminoborate glass. Glas. Phys. Chem. 2016, 42, 230–237. [Google Scholar] [CrossRef]
- Morin, E.I.; Stebbins, J.F. Separating the effects of composition and fictive temperature on Al and B coordination in Ca, La, Y aluminosilicate, aluminoborosilicate and aluminoborate glasses. J. Non-Cryst. Solids 2016, 432, 384–392. [Google Scholar] [CrossRef] [Green Version]
- Morin, E.I.; Wu, J.; Stebbins, J.F. Modifier cation (Ba, Ca, La, Y) field strength effects on aluminum and boron coordination in aluminoborosilicate glasses: The roles of fictive temperature and boron content. Appl. Phys. A 2014, 116, 479–490. [Google Scholar] [CrossRef]
- Engelhardt, G. 29Si MAS NMR of Zeolites: Semi-empirical interpretation of chemical shifts and their relation to structure parameters. Stud. Surf. Sci. Catal. 1989, 52, 151–162. [Google Scholar] [CrossRef]
- Lee, S.K.; Stebbins, J.F. Al–O–Al and Si–O–Si sites in framework aluminosilicate glasses with Si/Al=1: Quantification of framework disorder. J. Non-Cryst. Solids 2000, 270, 260–264. [Google Scholar] [CrossRef]
- Huang, Q.; Liu, J.; He, X.; Liu, T.; Lu, A. Analysis of structure evolution and performance in alkali-free glass substrates via XPS and infrared: Boron-aluminum anomaly. J. Non-Cryst. Solids 2020, 555, 120531. [Google Scholar] [CrossRef]
Publisher’s Note: MDPI stays neutral with regard to jurisdictional claims in published maps and institutional affiliations. |
© 2022 by the authors. Licensee MDPI, Basel, Switzerland. This article is an open access article distributed under the terms and conditions of the Creative Commons Attribution (CC BY) license (https://creativecommons.org/licenses/by/4.0/).