
Experimental and Numerical Investigation of Intact, Defective and Repaired Countersunk Composite Joints under Tensile Loading

Abstract
:1. Introduction
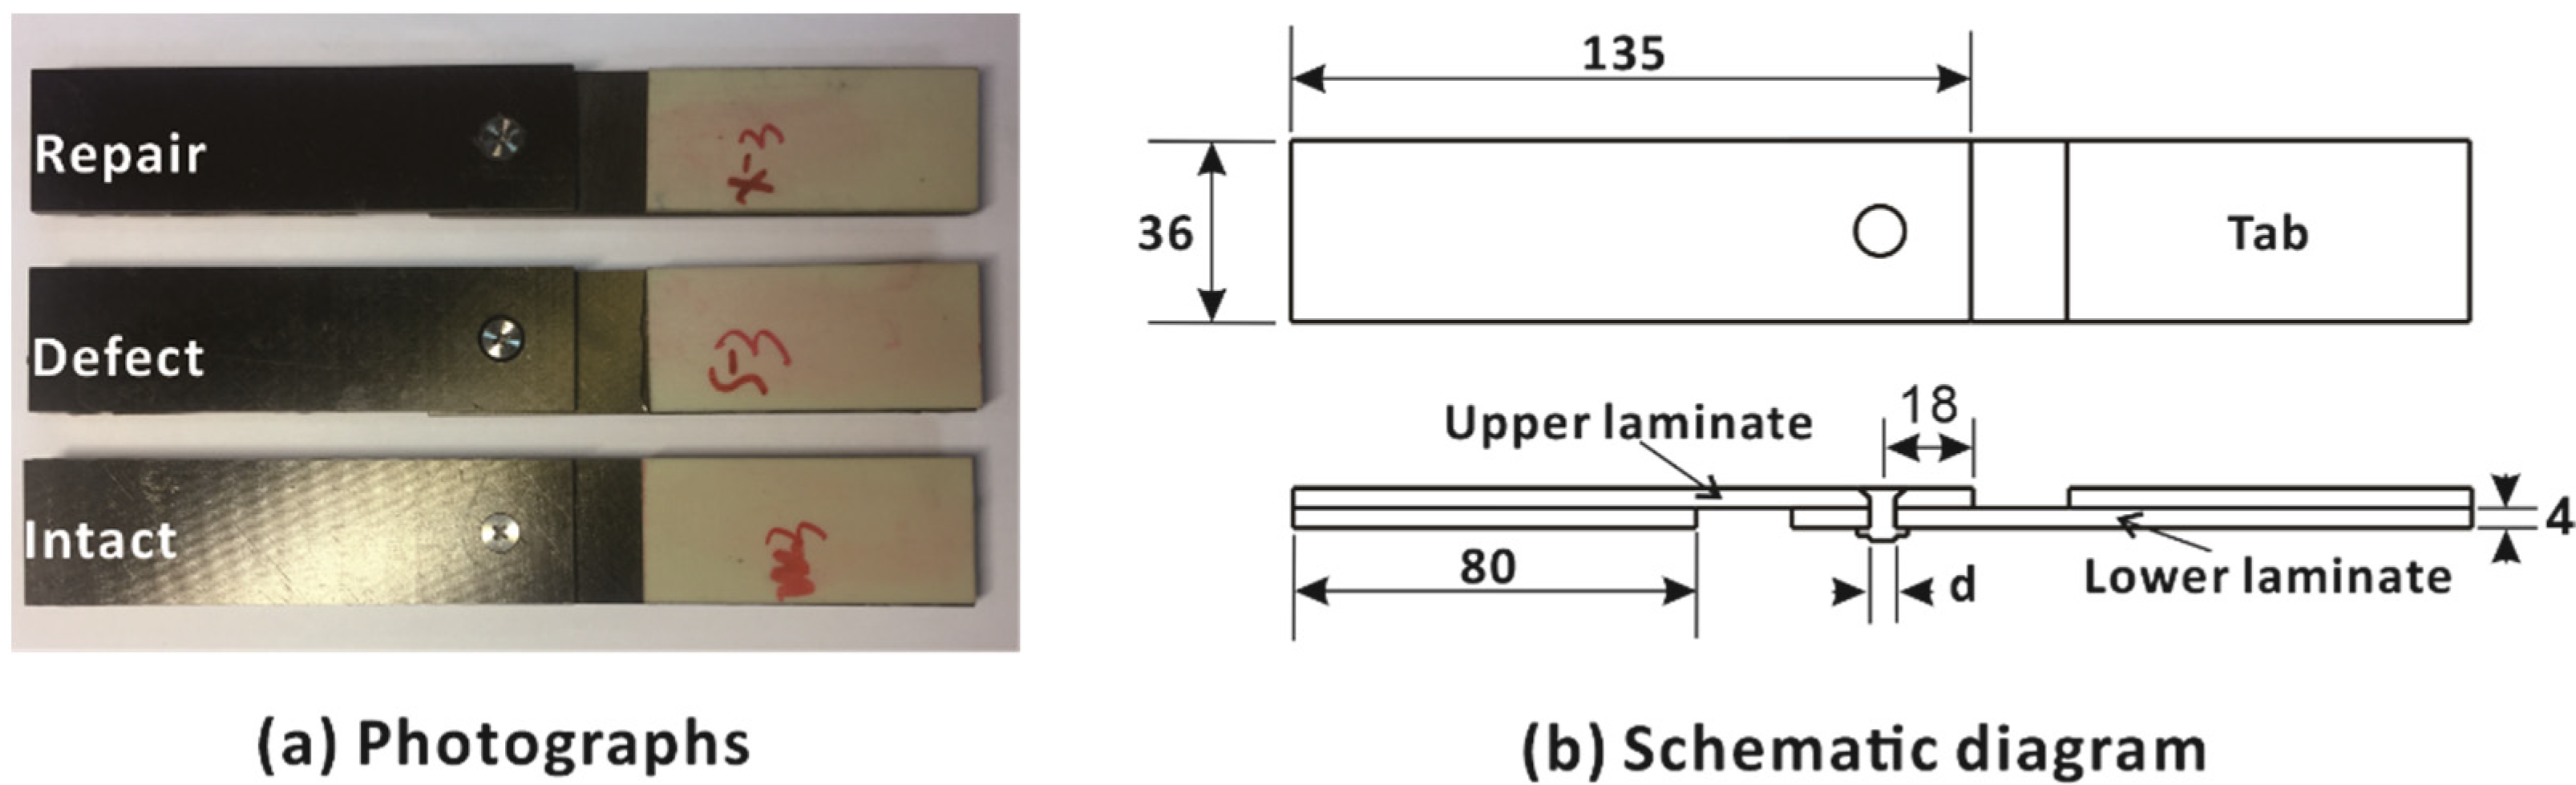
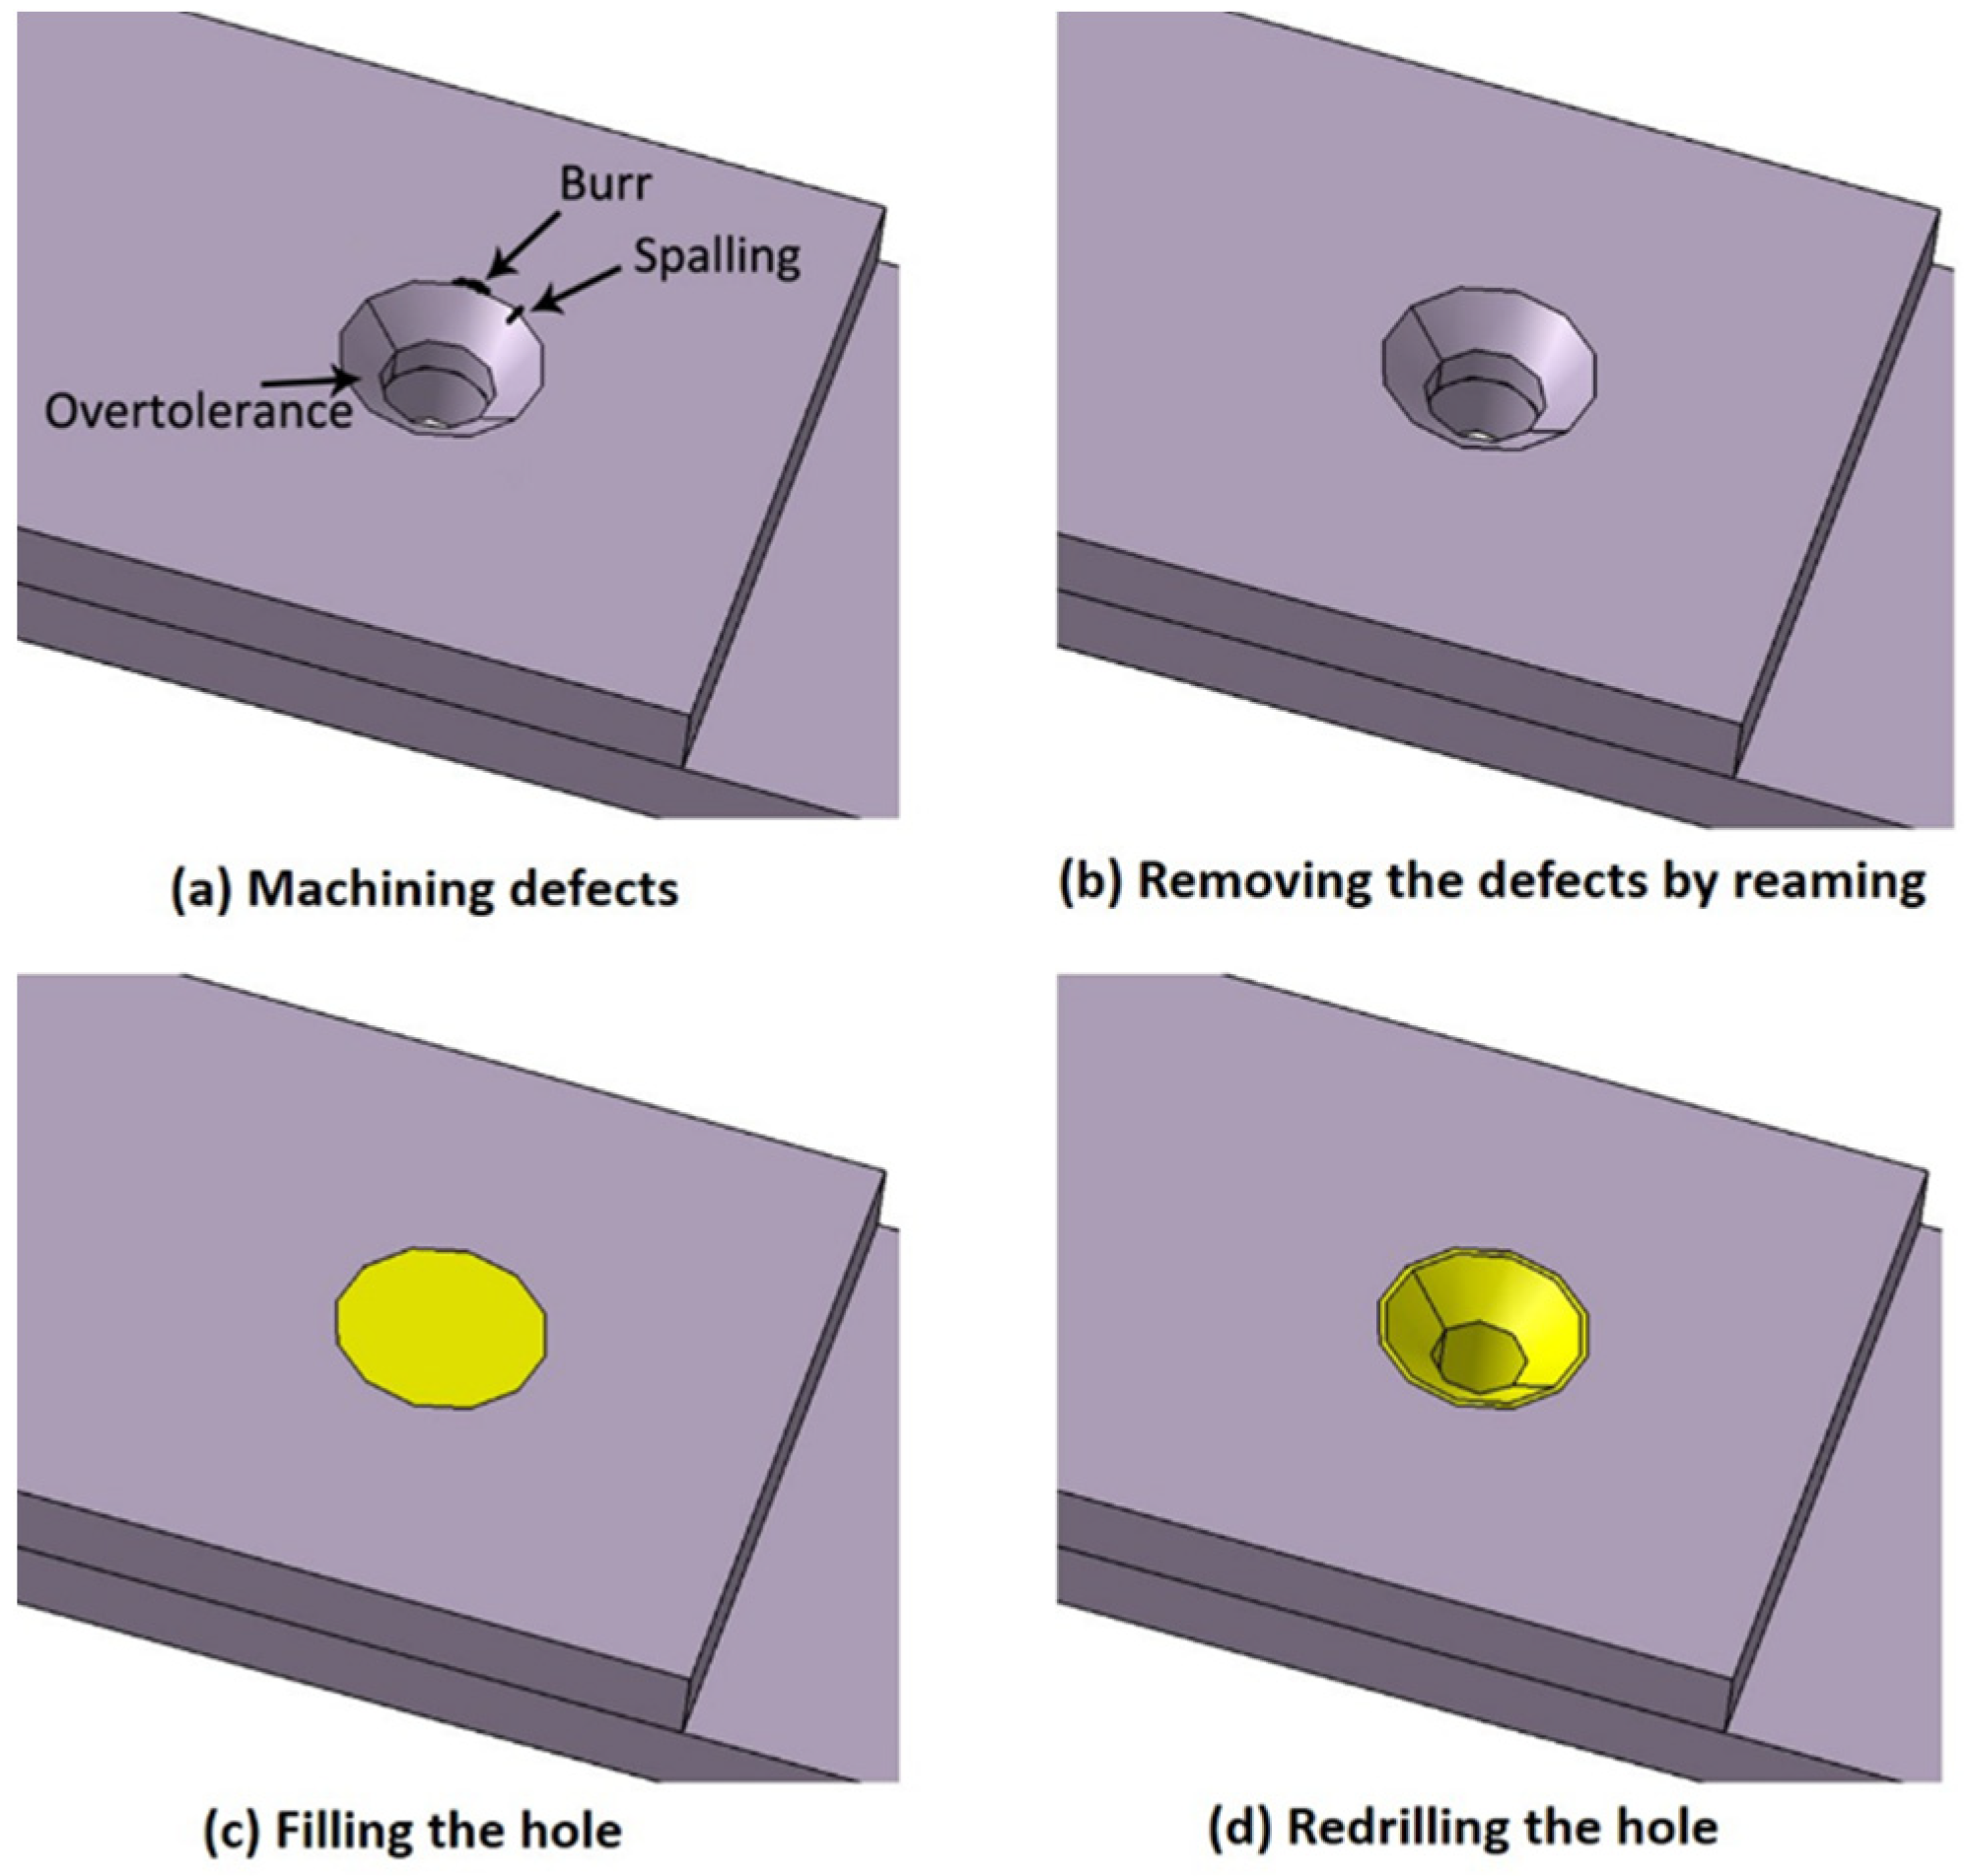
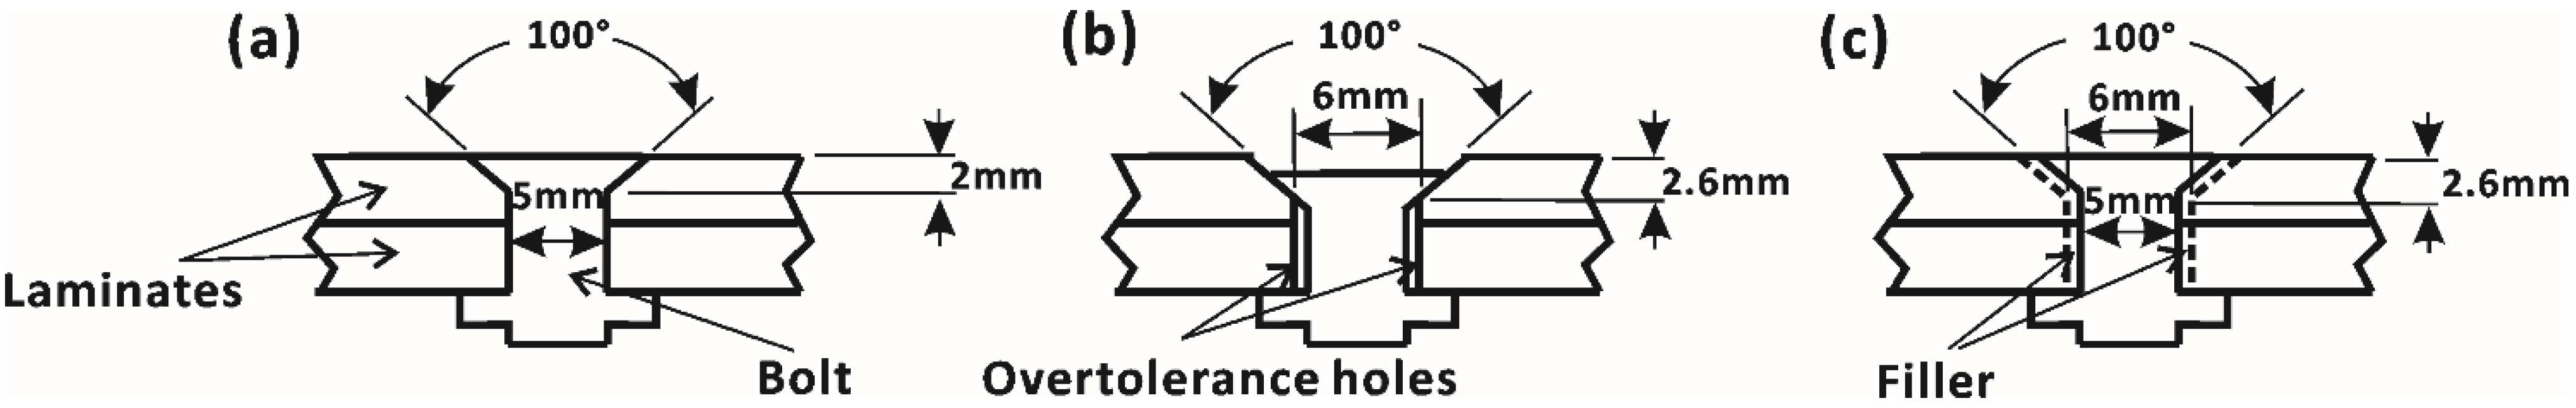
2. Materials and Methods
3. Experimental Results
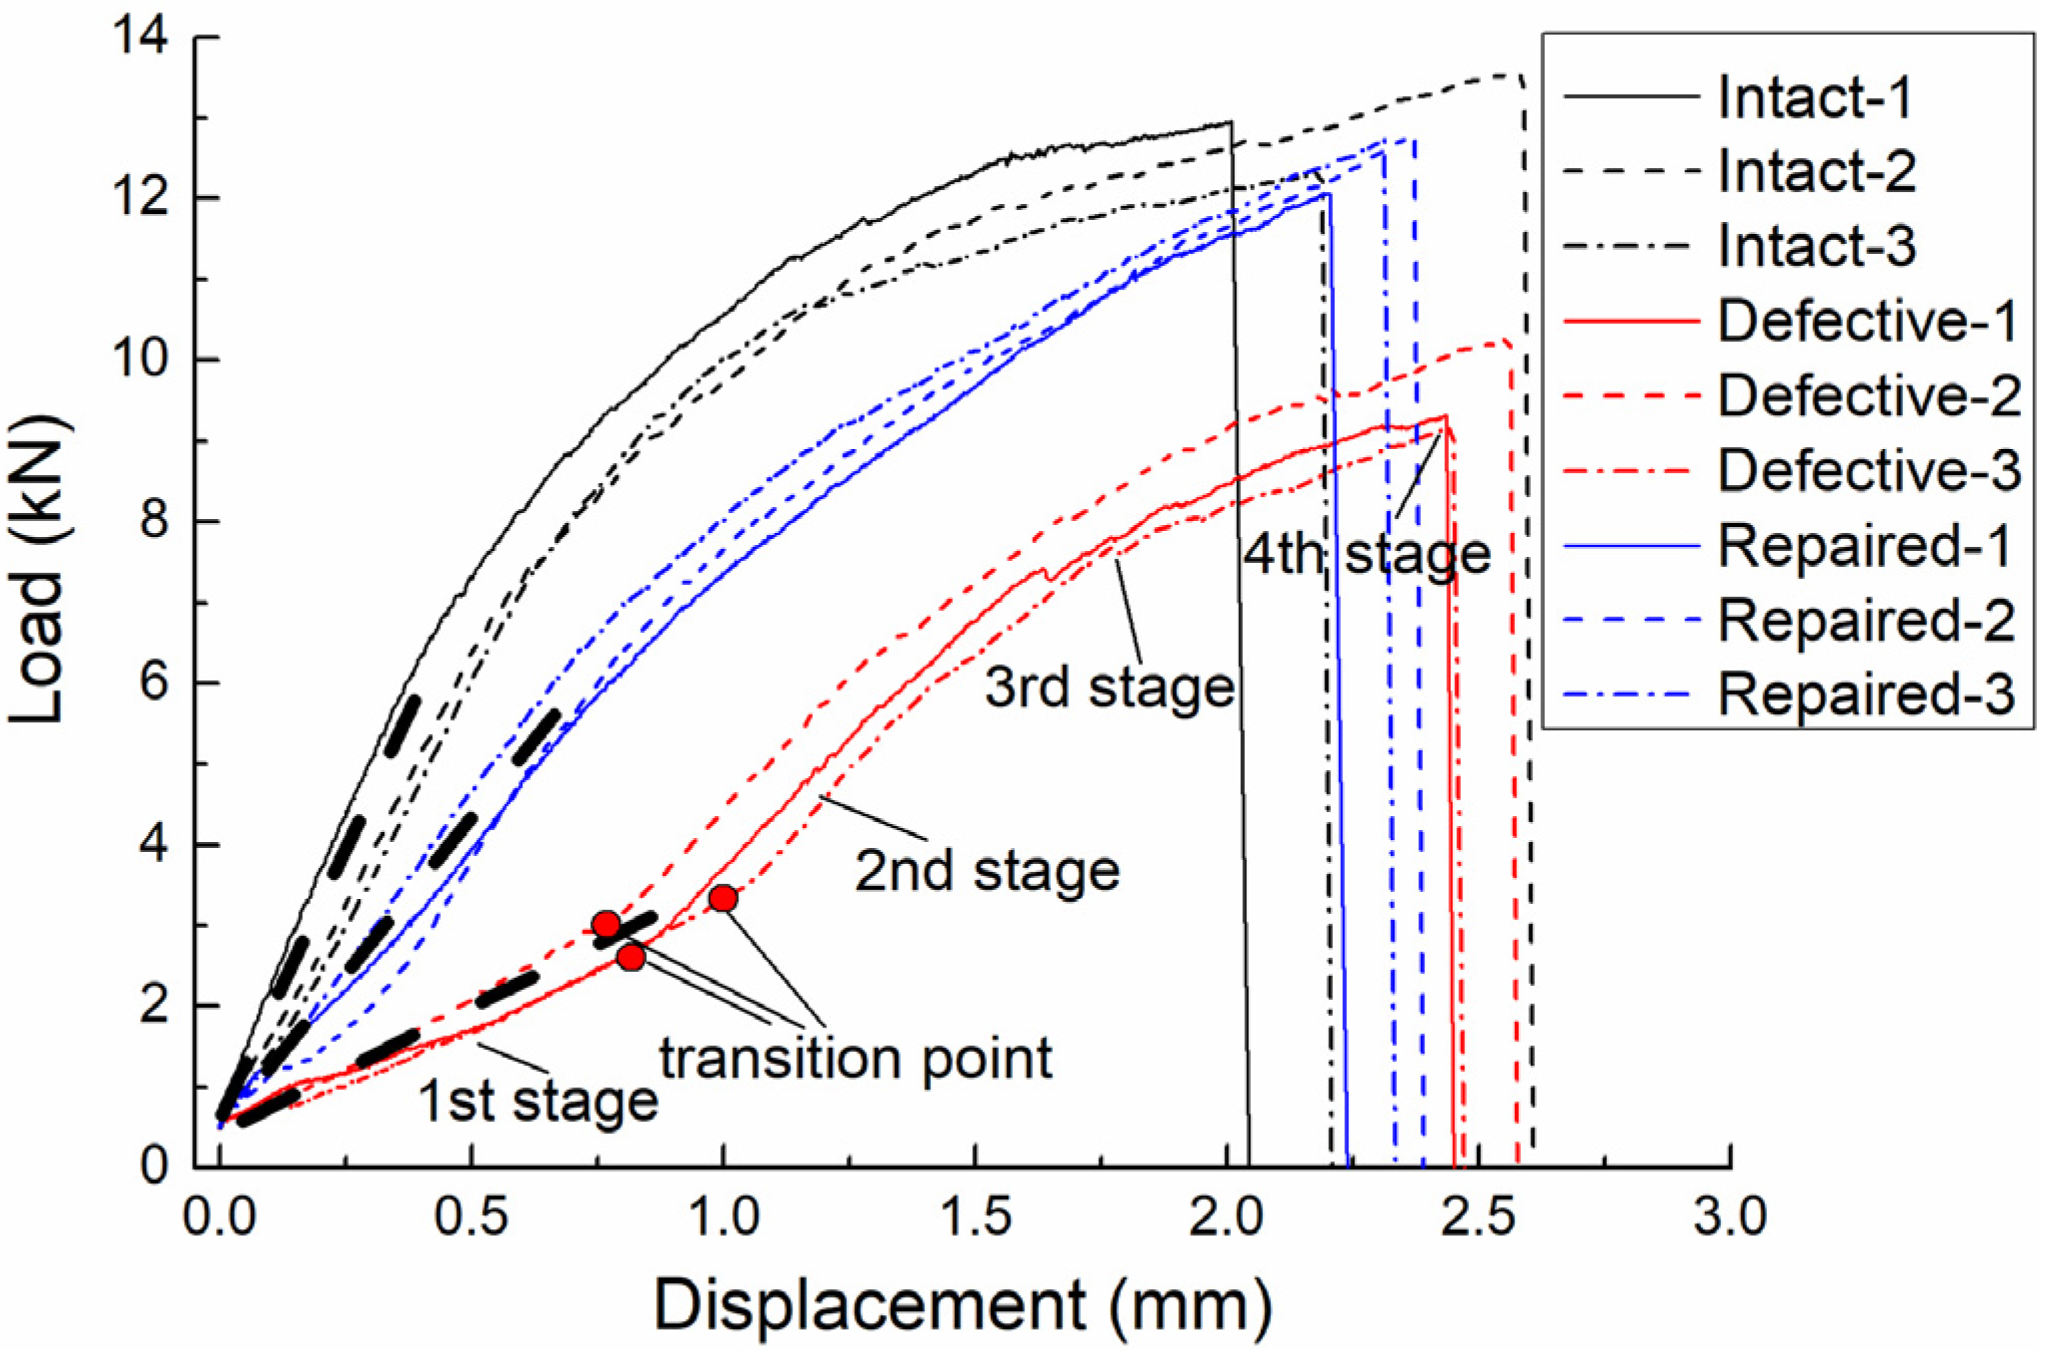
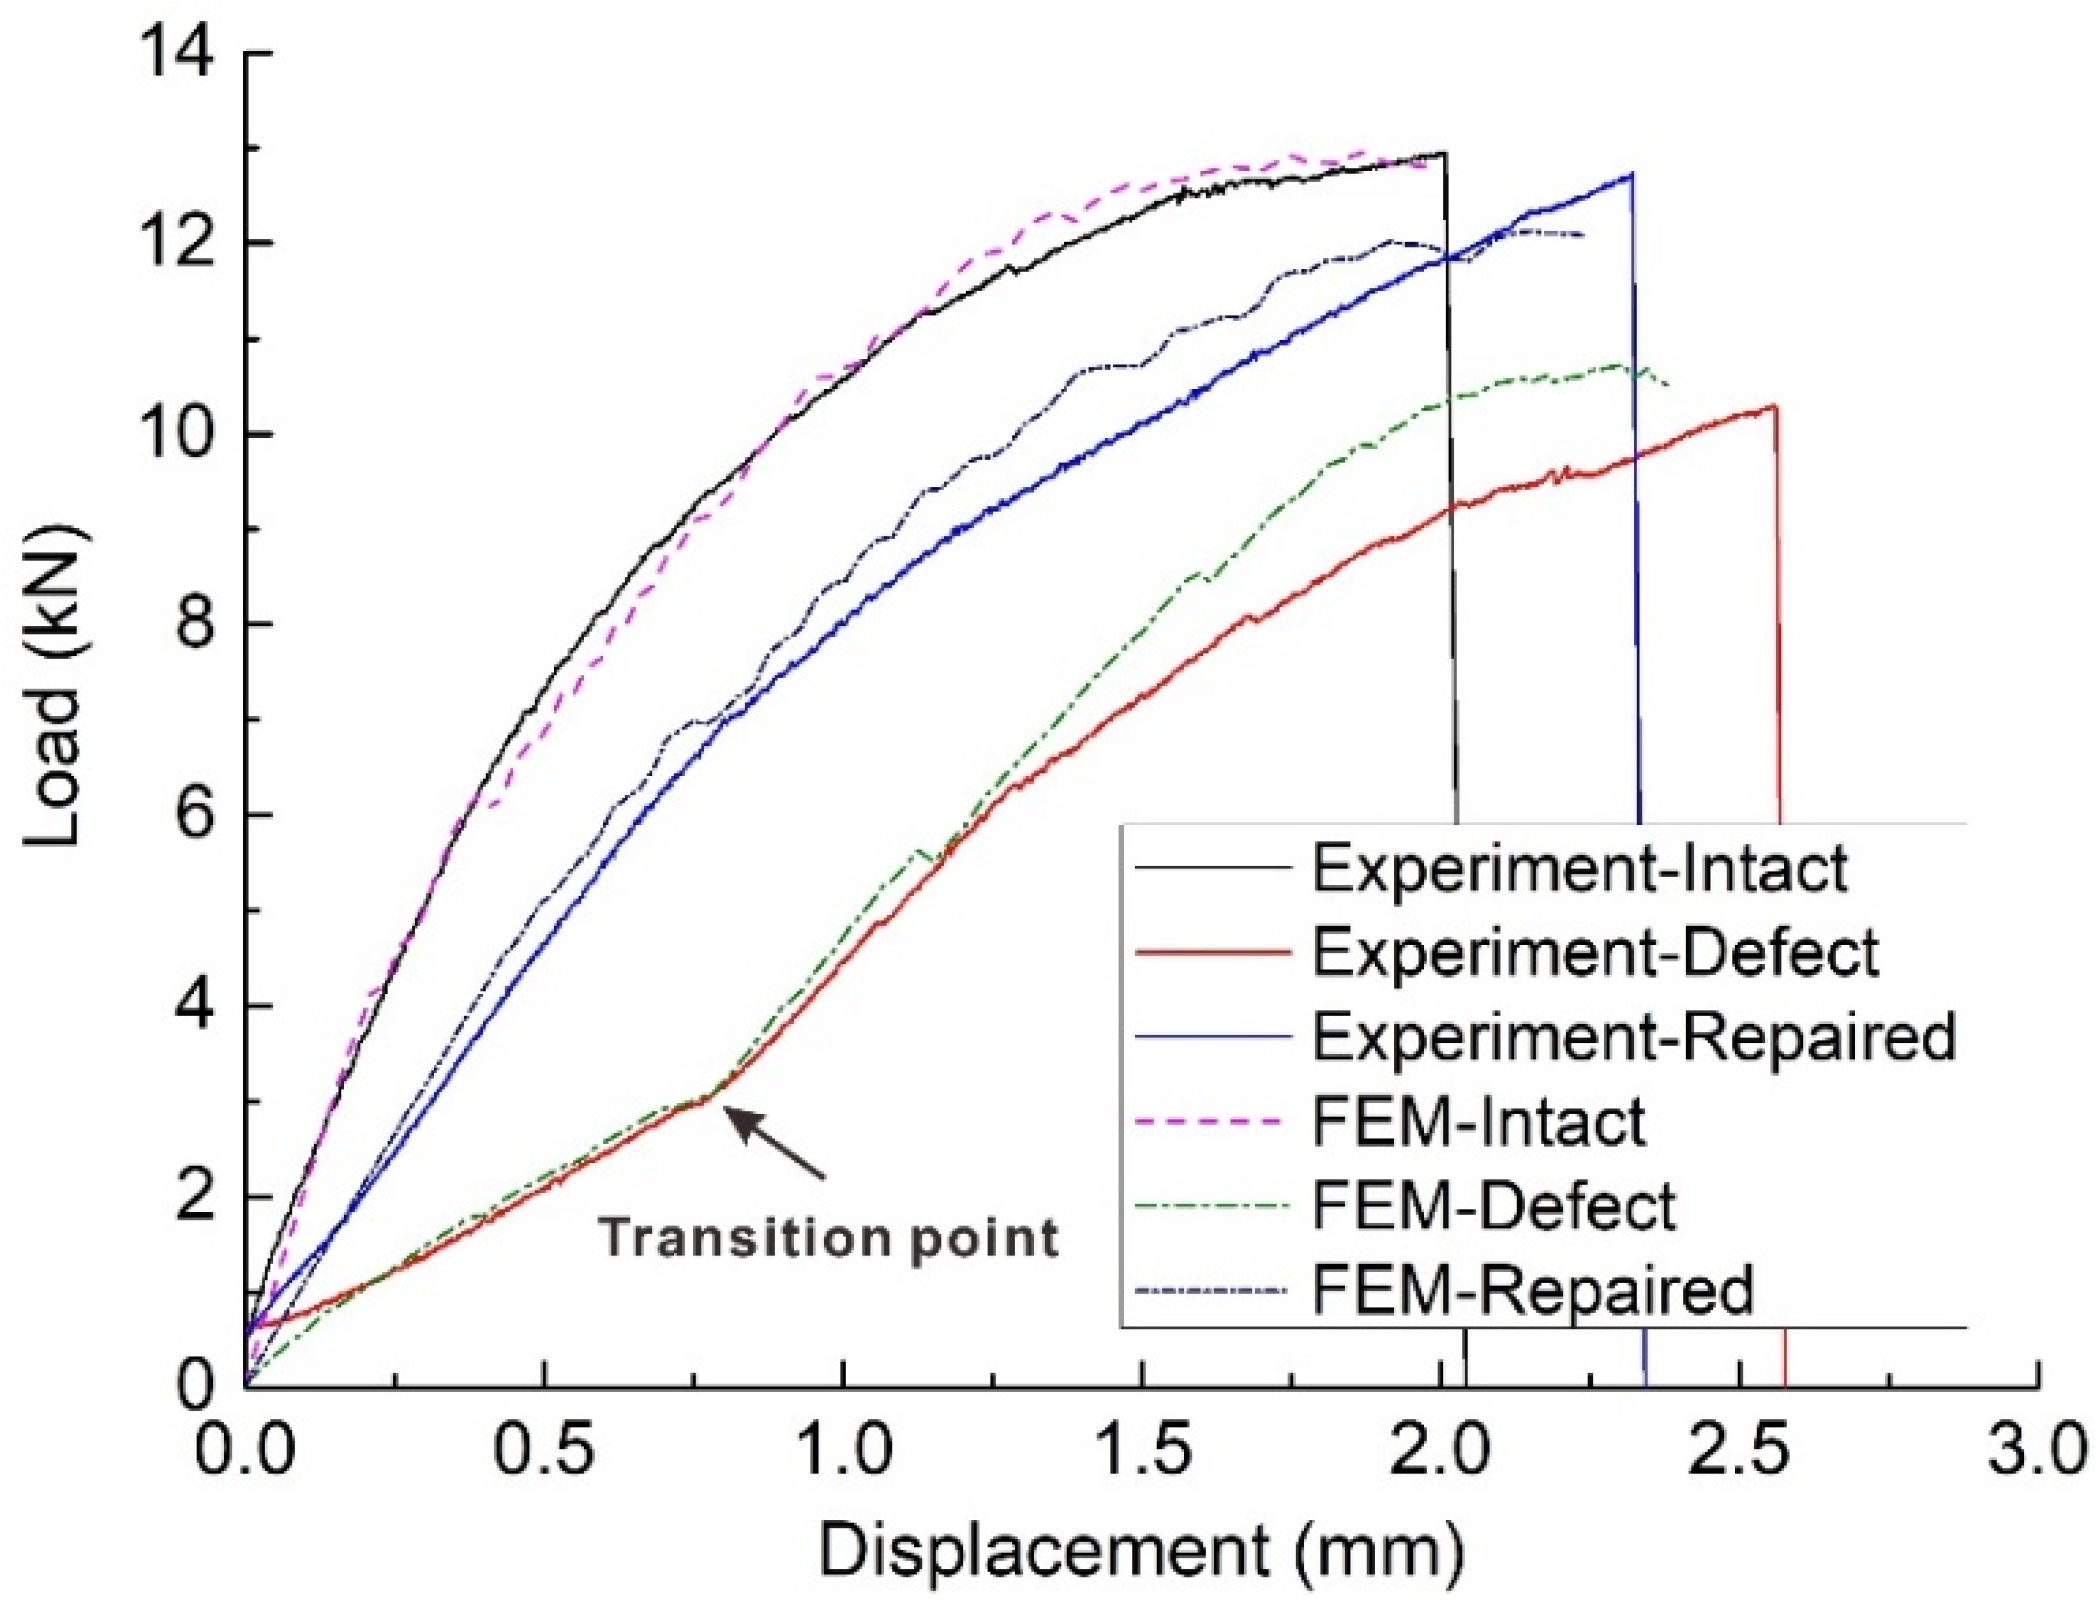
3.1. Load-Displacement Curve
3.2. Failure Load
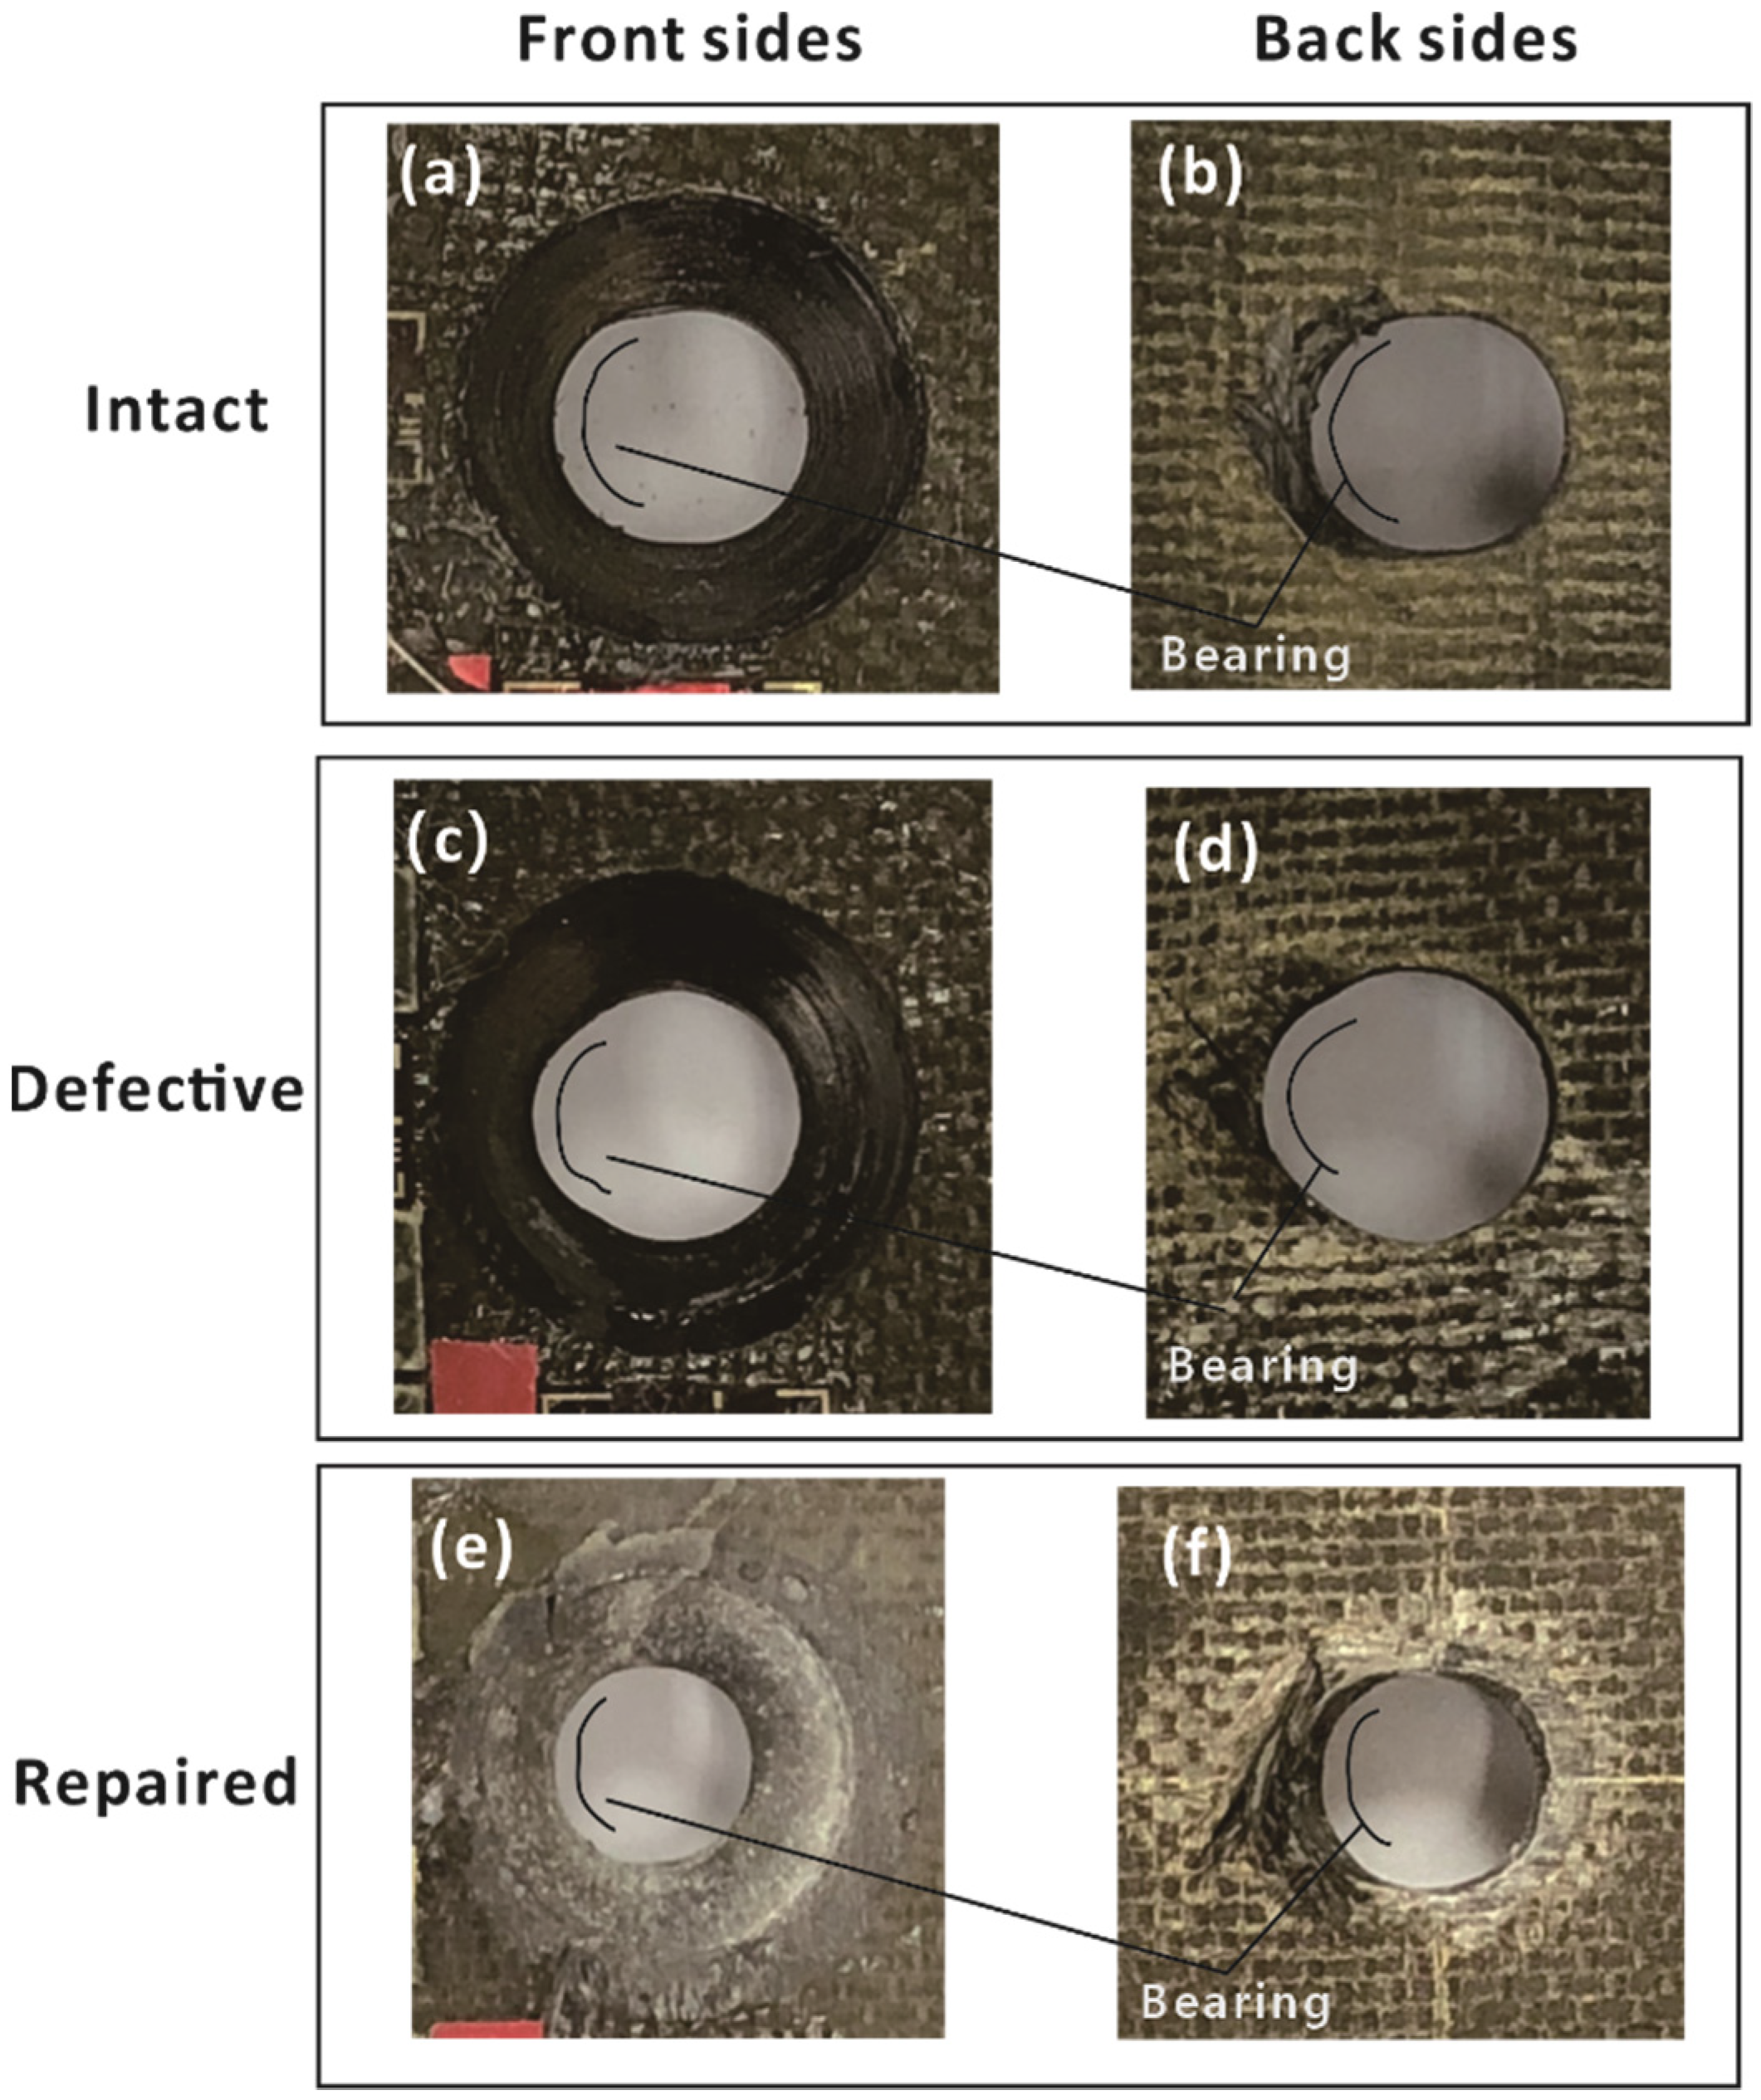
3.3. Failure Mode
4. Numerical Analysis
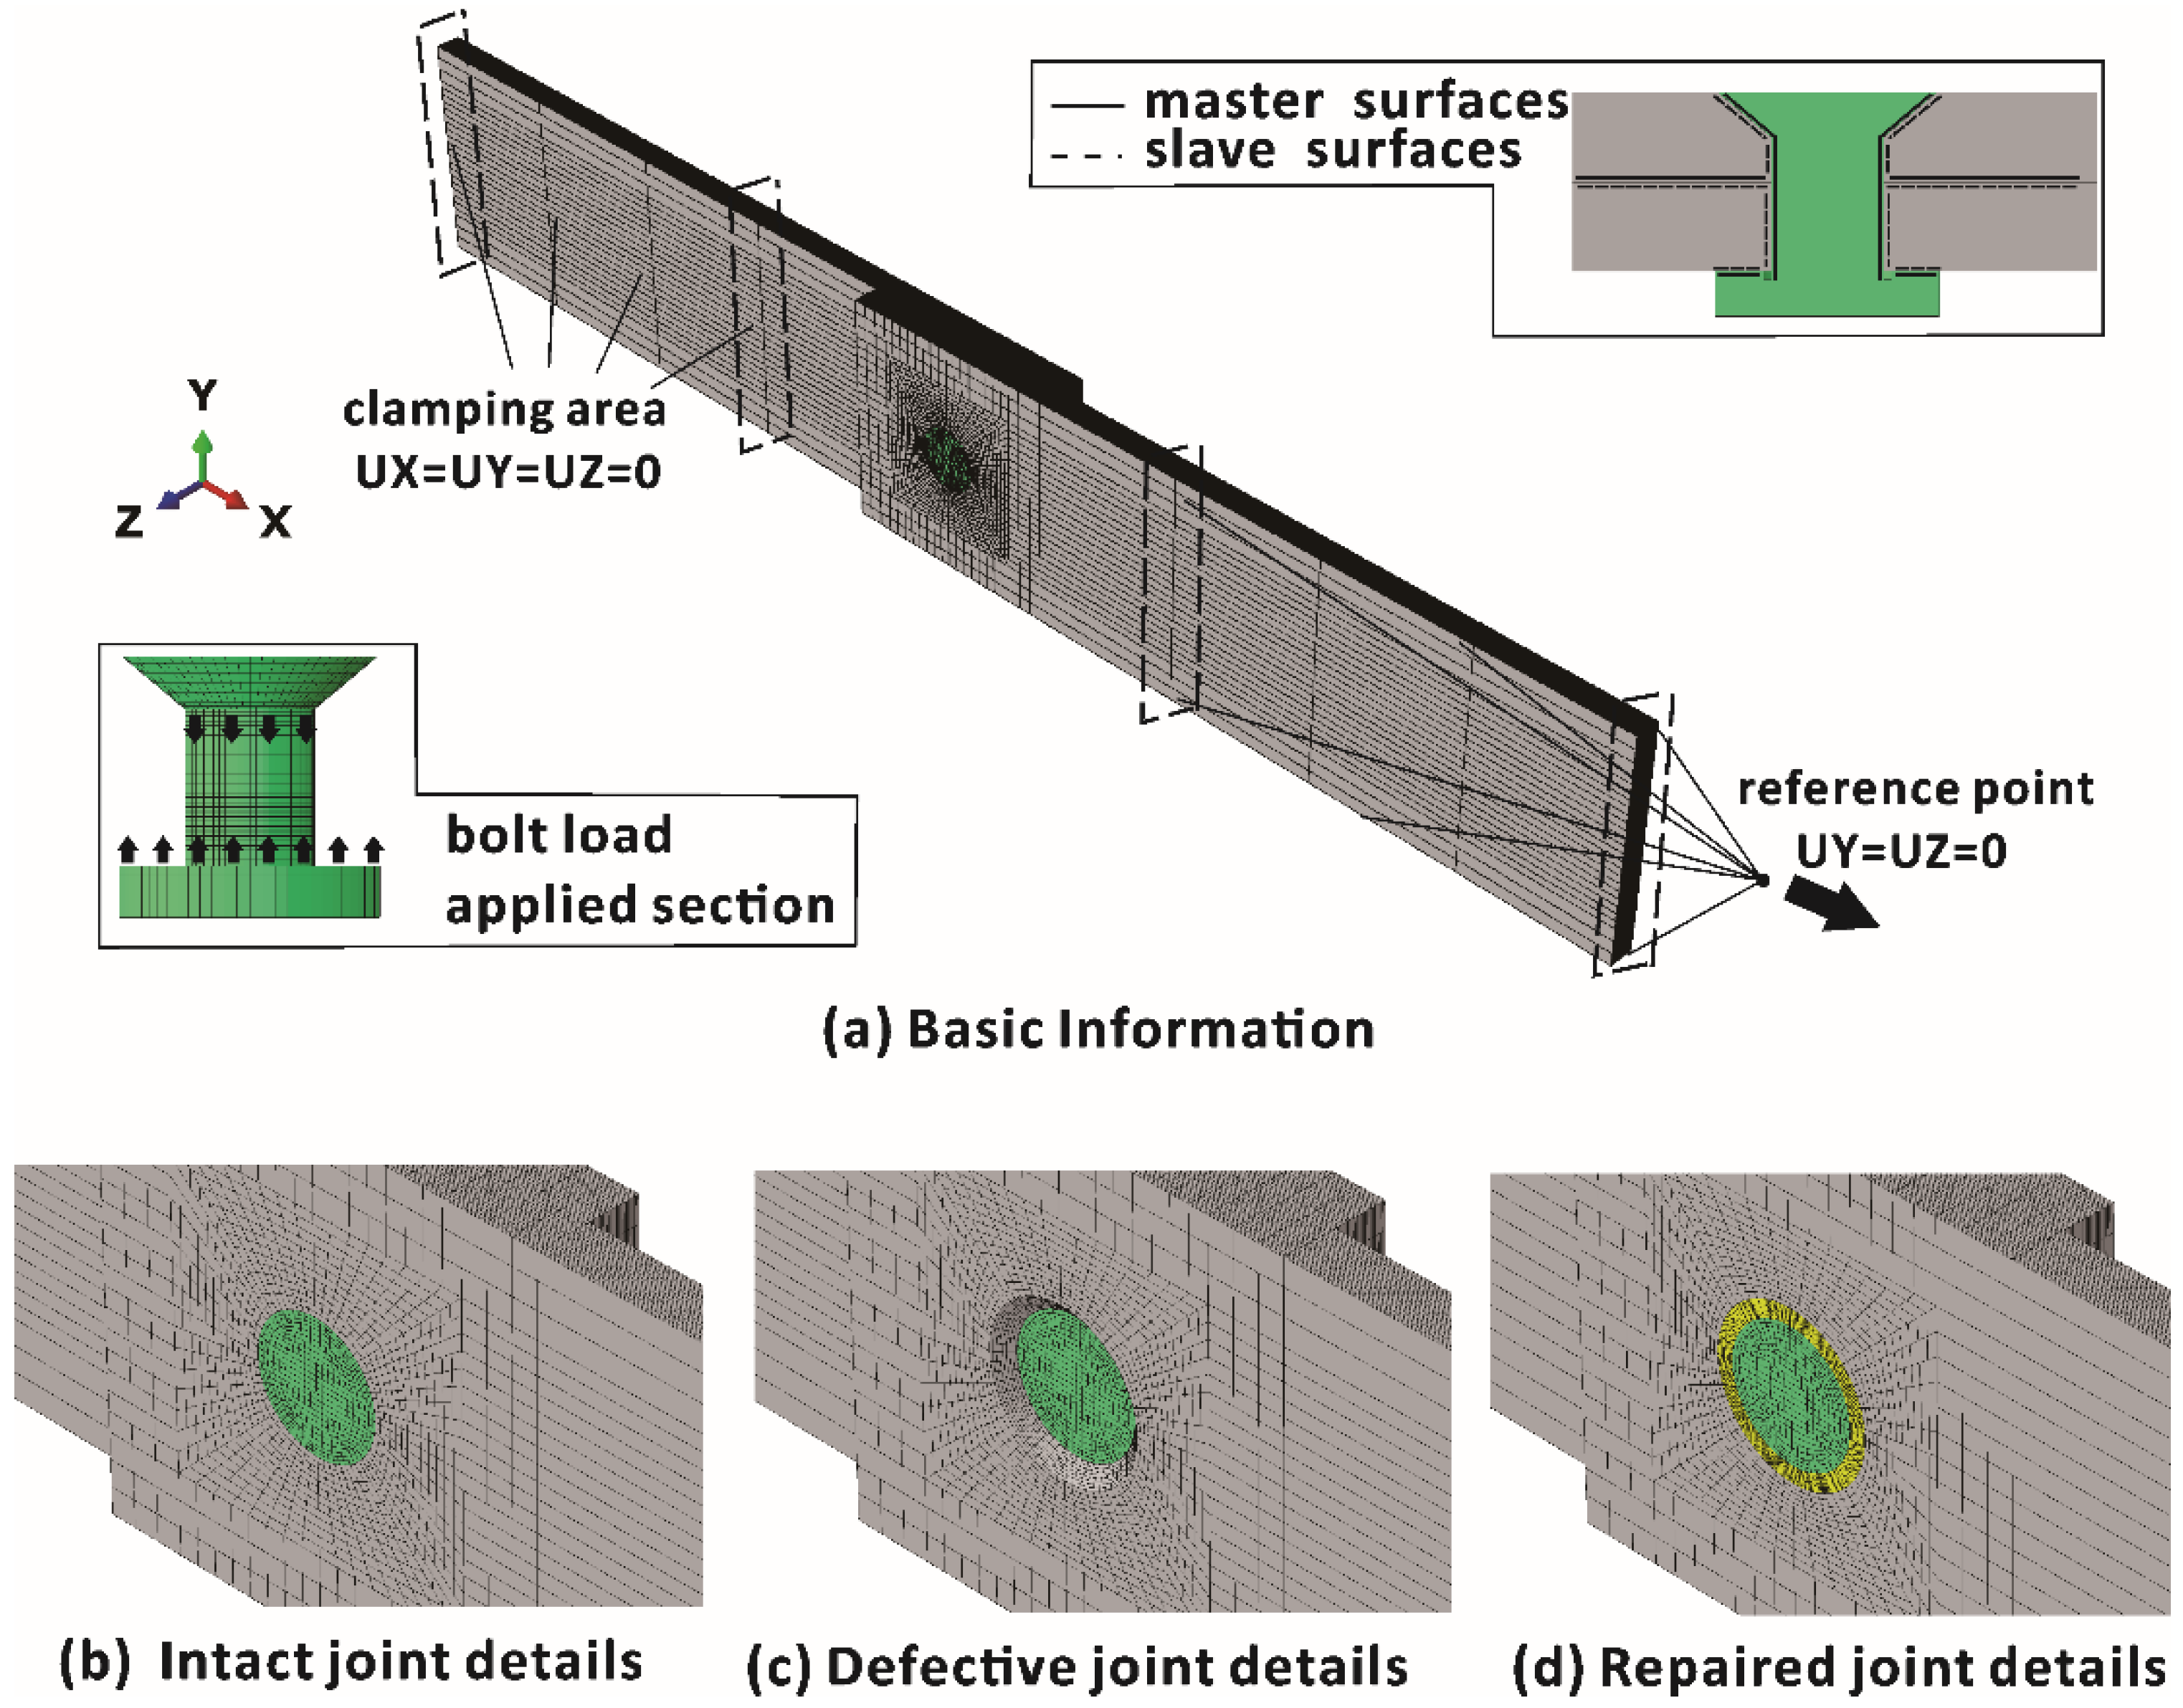
4.1. FE Modelling
4.2. Failure Criteria and Degradation Rules
5. Numerical Results and Discussions
5.1. Load–Displacement Curves
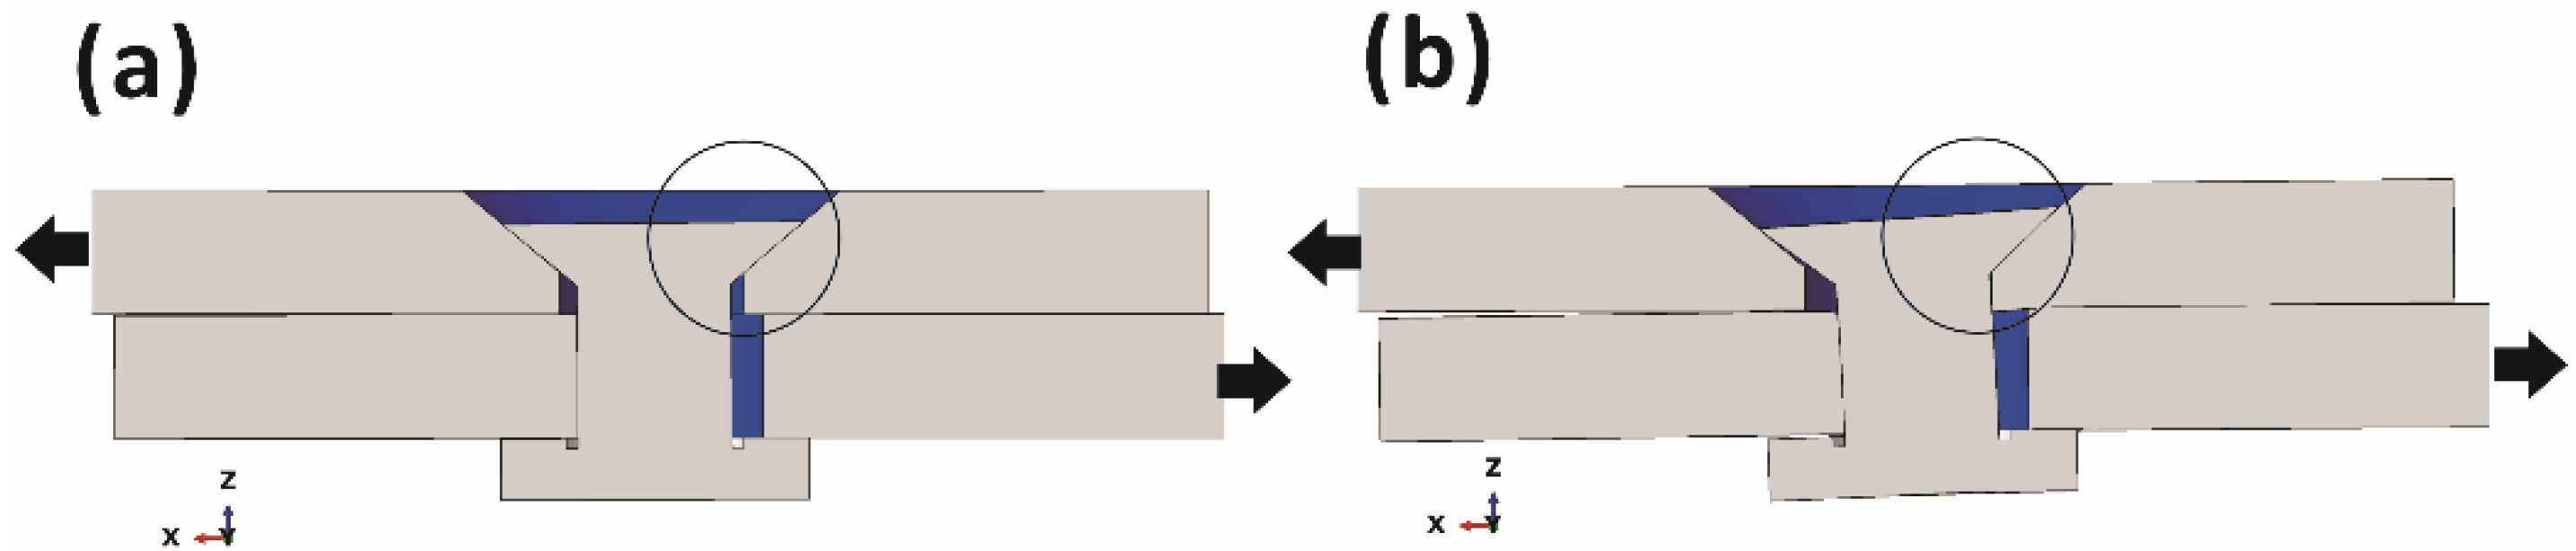
5.2. Contact Behavior and Local Deformation
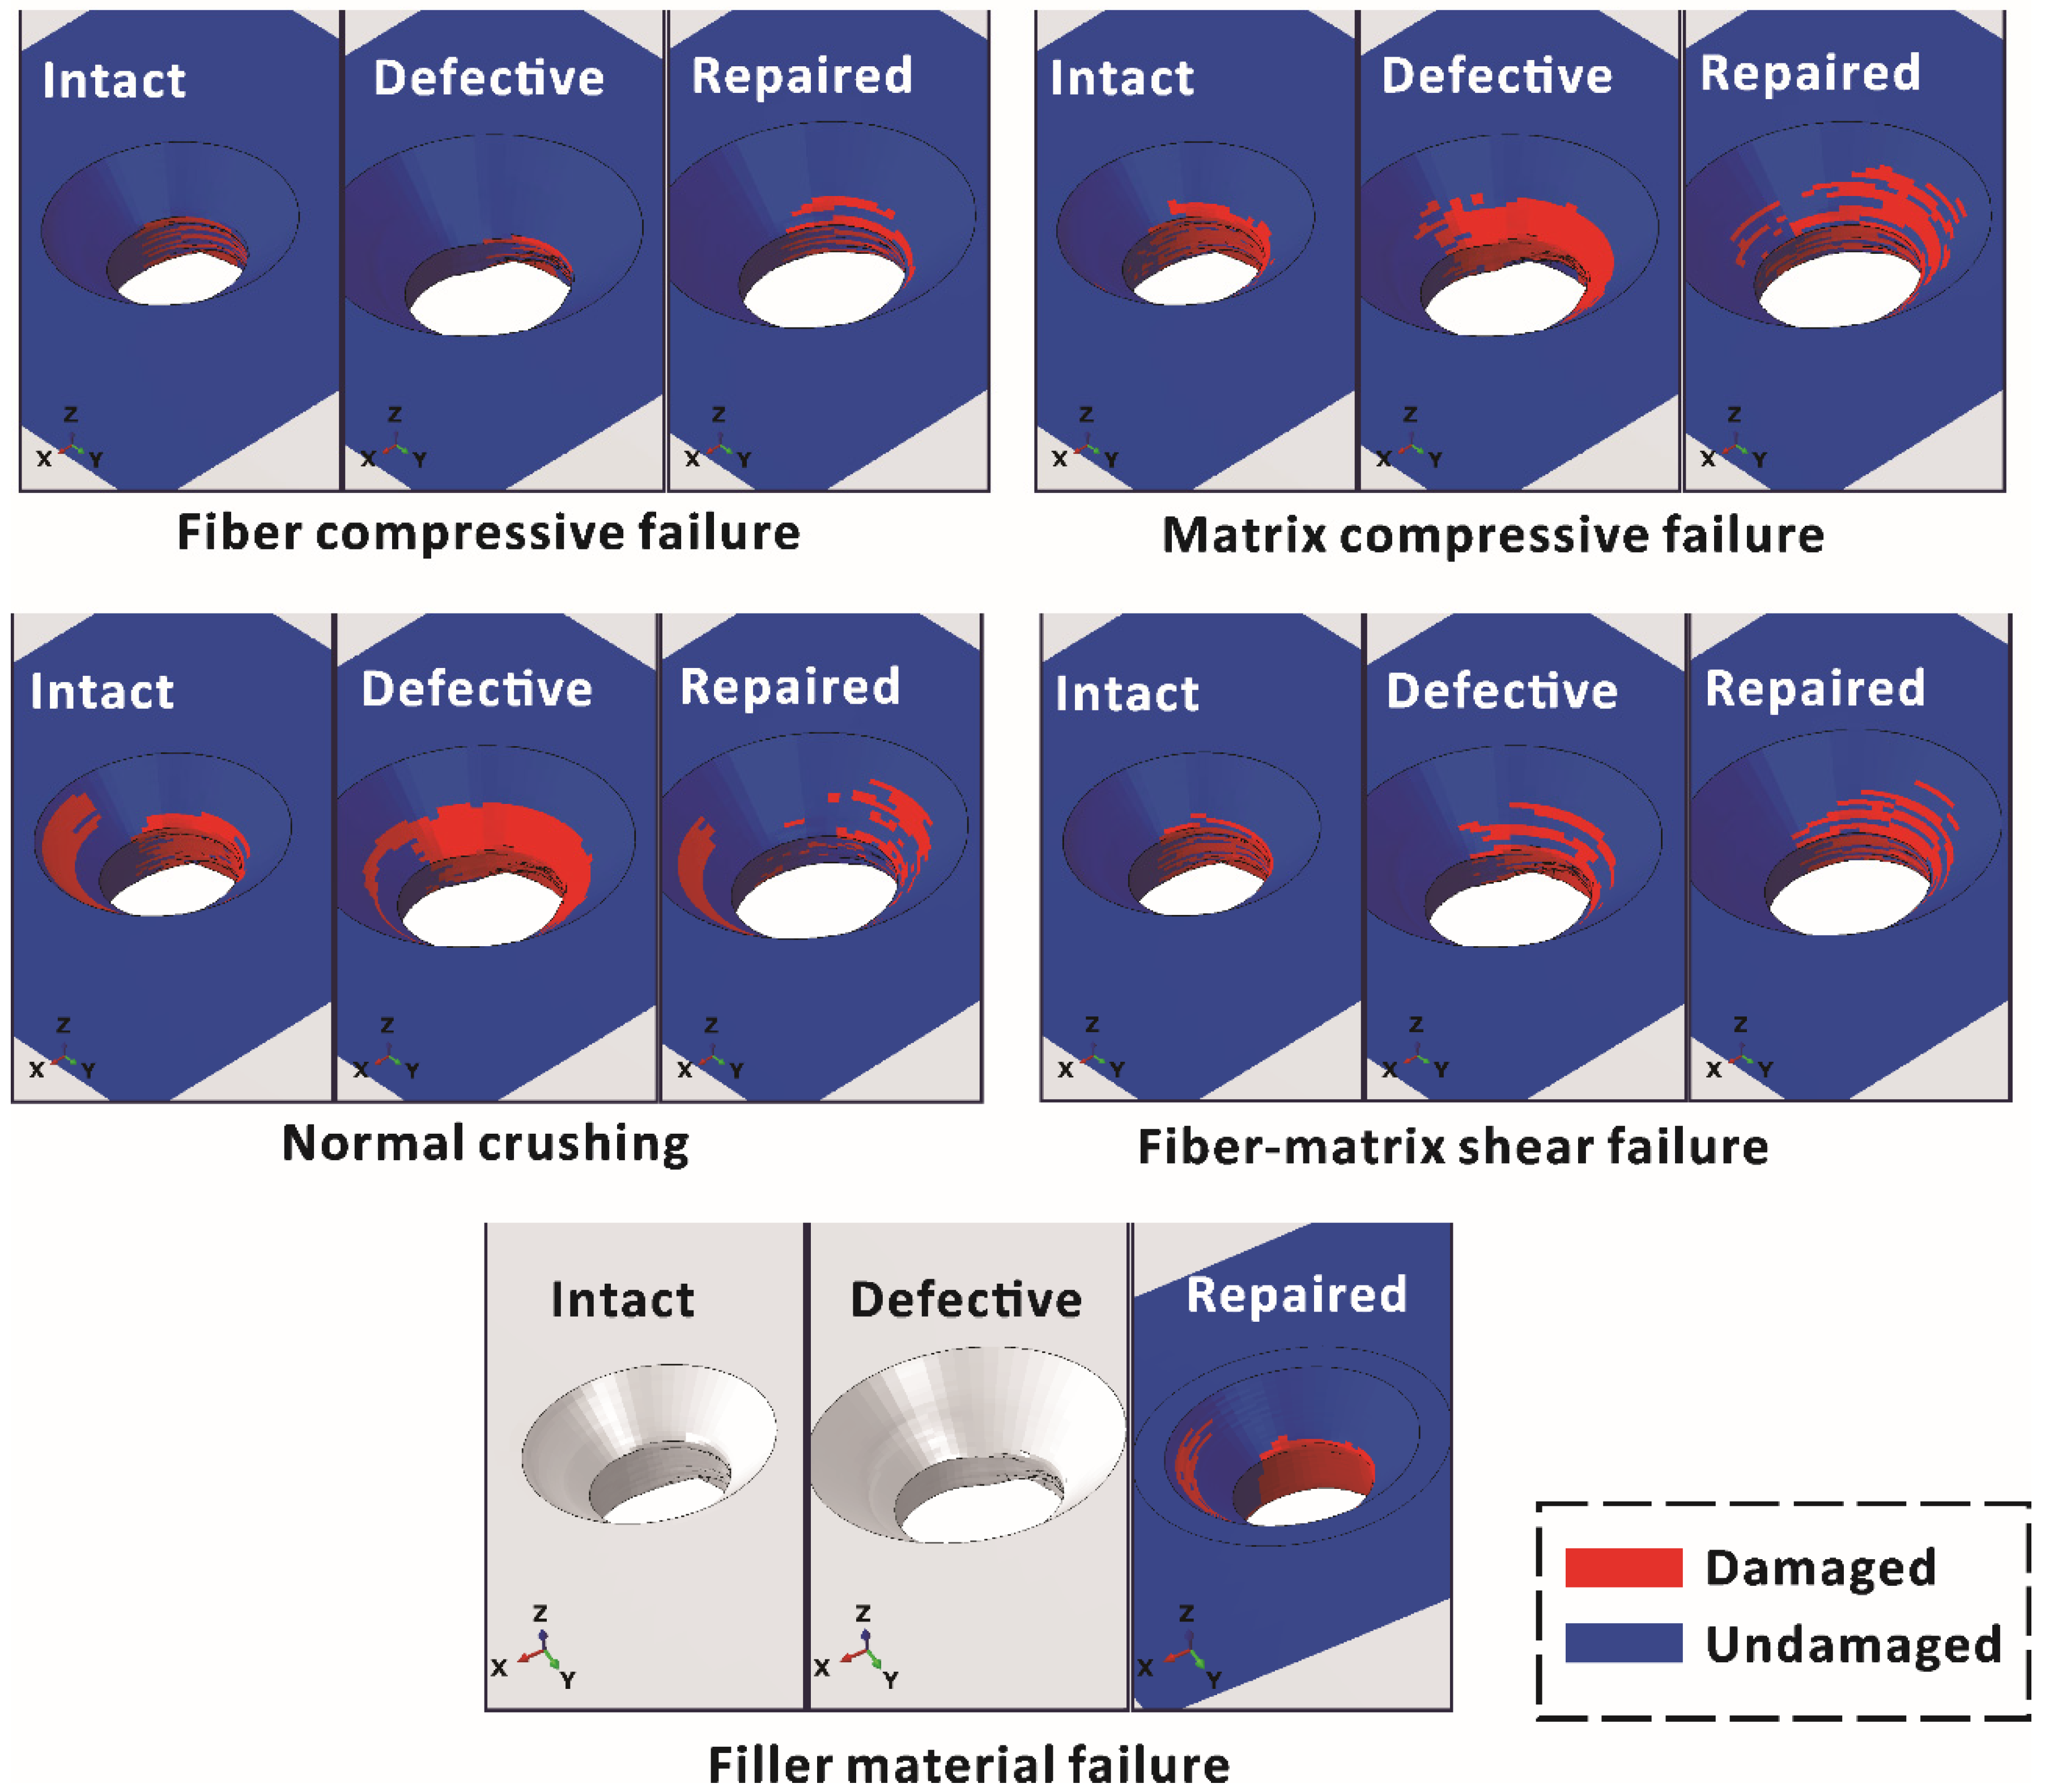
5.3. Failure Mechanisms
6. Conclusions
- Hole edge defects would reduce the mechanical properties of the joints. Defective joints with over-tolerance countersink had a significantly lower failure load than the other samples (the average failure load of defective samples was only 74.9% of intact samples). Moreover, the initial stiffness of defective joints was lower than that of the other joints, where a transition point in the stiffness at about 3 kN was observed.
- The average failure load of repaired samples was 96.9% of intact samples (the lower and upper limit of load capacity recovery ratio were 93.4% and 99.1%, respectively). The short fiber filling repair method proposed in this study could adequately restore the ultimate strength and partial stiffness of the samples, showing excellent repair efficiency.
- Numerical analysis indicated that the low initial stiffness and transition point for defective joints were due to the load being transmitted by the bolt head instead of the bolt shank during initial deformation, which was caused by the large clearance and mismatched countersink. The short fiber material filled the geometric defect and improved the mechanical behavior of the repaired joints, resulting in a higher initial stiffness and failure load compared with the defective joints, which explained the repair mechanism.
- Both the experimental and numerical results showed that the laminate failure of three types of joints mainly occurred around the hole and countersink; nevertheless, due to the effects of geometric defects and secondary bending, the failure distribution of defective joints differed slightly from the other joints.
Author Contributions
Funding
Data Availability Statement
Conflicts of Interest
References
- Thoppul, S.D.; Finegan, J.; Gibson, R.F. Mechanics of mechanically fastened joints in polymer–matrix composite structures—A review. Compos. Sci. Technol. 2009, 69, 301–329. [Google Scholar] [CrossRef]
- Mccarthy, M.A.; Lawlor, V.P.; Stanley, W.F.; Mccarthy, C.T. Bolt-hole clearance effects and strength criteria in single-bolt, single-lap, composite bolted joints. Compos. Sci. Technol. 2002, 62, 1415–1431. [Google Scholar] [CrossRef]
- Scalea, F.L.D.; Cloud, G.L.; Cappello, F. A study on the effects of clearance and interference fits in a pin-loaded cross-ply FGRP laminate. J. Compos. Mater. 1998, 32, 783–802. [Google Scholar] [CrossRef]
- Zhai, Y.; Li, D.; Li, X.; Liang, W.; Yu, Y. An experimental study on the effect of bolt-hole clearance and bolt torque on single-lap, countersunk composite joints. Compos. Struct. 2015, 127, 411–419. [Google Scholar] [CrossRef]
- Tan, P. Numerical simulation of the ballistic protection performance of a laminated armor system with pre-existing debonding/delamination. Compos. Part B Eng. 2014, 59, 50–59. [Google Scholar] [CrossRef]
- Kolanu, N.R.; Raju, G.; Ramji, M. A unified numerical approach for the simulation of intra and inter laminar damage evolution in stiffened CFRP panels under compression. Compos. Part B Eng. 2020, 190, 107931. [Google Scholar] [CrossRef]
- Rozylo, P. Stability and failure of compressed thin-walled composite columns using experimental tests and advanced numerical damage models. Int. J. Numer. Methods Eng. 2021, 122, 5076–5099. [Google Scholar] [CrossRef]
- Qin, T.; Zhao, L.; Zhang, J.; Qin, T.; Zhao, L.; Zhang, J. Fastener effects on mechanical behaviors of double-lap composite joints. Compos. Struct. 2013, 100, 413–423. [Google Scholar] [CrossRef]
- Stocchi, C.; Robinson, P.; Pinho, S.T. A detailed finite element investigation of composite bolted joints with countersunk fasteners. Compos. Part A Appl. Sci. Manuf. 2013, 52, 143–150. [Google Scholar] [CrossRef]
- Liu, P.; Cheng, X.; Wang, S.; Liu, S.; Cheng, Y. Numerical analysis of bearing failure in countersunk composite joints using 3D explicit simulation method. Compos. Struct. 2016, 138, 30–39. [Google Scholar] [CrossRef]
- Dano, M.L.; Kamal, E.; Gendron, G. Analysis of bolted joints in composite laminates: Strains and bearing stiffness predictions. Compos. Struct. 2007, 79, 562–570. [Google Scholar] [CrossRef]
- Olmedo, Á.; Santiuste, C. On the prediction of bolted single-lap composite joints. Compos. Struct. 2012, 94, 2110–2117. [Google Scholar] [CrossRef] [Green Version]
- Tserpes, K.I.; Papanikos, P.; Kermanidis, T. A three-dimensional progressive damage model for bolted joints in composite laminates subjected to tensile loading. Fatigue Fract. Eng. Mater. Struct. 2010, 24, 663–675. [Google Scholar] [CrossRef]
- Dai, J.; Zhao, P.; Su, H.; Wang, Y. Mechanical Behavior of Single Patch Composite Repaired Al Alloy Plates: Experimental and Numerical Analysis. Materials 2020, 13, 2740. [Google Scholar] [CrossRef] [PubMed]
- Wen, Q.; Guo, D.; Gao, H.; Zhao, D. Comprehensive evaluation method for carbon/epoxy composite hole-making damages. Acta Mater. Compos. Sin. 2016, 33, 265–272. [Google Scholar]
- Wen, Q. Study of Formation Mechanism and Evaluation Method of C/E Composites Hole-Making Damages; Dalian University of Technology: Dalian, China, 2014. [Google Scholar]
- Turki, Y.; Habak, M.; Velasco, R.; Aboura, Z.; Khellil, K.; Vantomme, P. Experimental investigation of drilling damage and stitching effects on the mechanical behavior of carbon/epoxy composites. Int. J. Mach. Tools Manuf. Des. Res. Appl. 2014, 87, 61–72. [Google Scholar] [CrossRef]
- Arhamnamazi, S.; Aymerich, F.; Buonadonna, P.; Mehtedi, M.E. Assessment of drilling-induced delamination and tool wear in carbon fibre reinforced laminates. Polym. Polym. Compos. 2021, 29, S729–S740. [Google Scholar] [CrossRef]
- Durao, L.M.P.; Tavares, J.M.R.S.; Albuquerque, V.; Goncalves, D.J.S. Damage evaluation of drilled carbon/epoxy laminates based on area assessment methods. Compos. Struct. 2013, 96, 576–583. [Google Scholar] [CrossRef] [Green Version]
- Pamidi, G.K.; Penumakala, P.K.; Prasad, A. Failure analysis of the patch repaired E-glass chopped fiber strand mat/epoxy composites. J. Braz. Soc. Mech. Sci. Eng. 2021, 43, 402. [Google Scholar] [CrossRef]
- Chong, H.M.; Liu, S.L.; Subramanian, A.S.; Ng, S.P.; Tay, S.W.; Wang, S.Q.; Feih, S. Out-of-autoclave scarf repair of interlayer toughened carbon fibre composites using double vacuum debulking of patch. Compos. Part A Appl. Sci. Manuf. 2018, 107, 224–234. [Google Scholar] [CrossRef]
- Yoo, S.-Y.; Kim, C.-H.; Kweon, J.-H.; Choi, J.-H. The structural analysis and strength evaluation of the rivet nut joint for composite repair. Compos. Struct. 2016, 136, 662–668. [Google Scholar] [CrossRef]
- Slattery, P.G.; Mccarthy, C.T.; O’Higgins, R. Assessment of residual strength of repaired solid laminate composite materials through mechanical testing. Compos. Struct. 2016, 147, 122–130. [Google Scholar] [CrossRef]
- Cheng, X.; Fan, J.; Liu, S.; Guo, X.; Xu, Y.; Zhang, T. Design and investigation of composite bolted π-joints with an unconventional configuration under bending load. Compos. Part B Eng. 2016, 85, 59–67. [Google Scholar] [CrossRef]
- Zhang, D.-N.; Shangguan, Q.-Q.; Xie, C.-J.; Liu, F. A modified Johnson–Cook model of dynamic tensile behaviors for 7075-T6 aluminum alloy. J. Alloy. Compd. 2015, 619, 186–194. [Google Scholar] [CrossRef]
- Wang, X.; Shi, J. Validation of Johnson-Cook plasticity and damage model using impact experiment. Int. J. Impact Eng. 2013, 60, 67–75. [Google Scholar] [CrossRef]
- Hashin, Z. Failure criteria for unidirectional fiber composites. J. Appl. Mech. 1980, 47, 329–334. [Google Scholar] [CrossRef]
- Dassault Systèmes. ABAQUS Documentation, Version 6.13; Dassault Systèmes: Waltham, MA, USA, 2013. [Google Scholar]


| Elastic Property | Value | Strength | Value |
|---|---|---|---|
| Longitudinal Young’s modulus E11 (GPa) | 146 | Longitudinal tensile strength XT (MPa) | 2391 |
| Transverse Young’s modulus E22 = E33 (GPa) | 104 | Longitudinal compression strength XC (MPa) | 1410 |
| Longitudinal shear modulus G12 = G13 (GPa) | 6.45 | Transverse tensile strength YT = ZT (MPa) | 67 |
| Transverse shear modulus G23 (GPa) | 3.37 | Transverse compression strength YC = ZC (MPa) | 219 |
| Longitudinal Poisson’s ratio v12 = v13 | 0.28 | Longitudinal shear strength S12 = S13 (MPa) | 94 |
| Transverse Poisson’s ratio v23 | 0.30 | Transverse shear strength S23 (MPa) | 94 |
| Density ρ (g/cm3) | 1.6 |
| Mechanical Property | Value |
|---|---|
| Elastic modulus Esf (GPa) | 10 |
| Poisson’s ratio vsf | 0.36 |
| Compression strength σsf (MPa) | 290 |
| Density ρsf (g/cm3) | 1.2 |
| Sample Types | Failure Load (kN) | Average Failure Load (kN) | Standard Deviation (kN) | Variation Coefficient (%) |
|---|---|---|---|---|
| Intact samples | 12.95 | 12.94 | 0.60 | 4.6 |
| 13.54 | ||||
| 12.34 | ||||
| Defective samples | 9.52 | 9.70 | 0.52 | 5.4 |
| 10.29 | ||||
| 9.30 | ||||
| Repaired samples | 12.08 | 12.55 | 0.41 | 3.2 |
| 12.82 | ||||
| 12.74 |
| Failure Mode | Failure Criterion | Degradation Rule |
|---|---|---|
| Fiber tensile failure (FT) | E11 = 0.1E11, v12 = 0.1v12, v13 = 0.1v13, G12 = 0.1G12, G13 = 0.1G13 | |
| Fiber compressive failure (FC) | ||
| Matrix tensile failure (MT) | E22 = 0.3E22, v12 = 0.3v12, v23 = 0.3v23, G12 = 0.3G12, G23 = 0.3G13 | |
| Matrix compressive failure (MC) | ||
| Delamination in tension (DT) | E33 = 0.2E33, v23 = 0.2v23, v13 = 0.2v13, G13 = 0.2G13, G23 = 0.2G23 | |
| Normal crushing (NC) | ||
| Fiber-matrix shear failure (SS) | v12 = 0.2v12, G12 = 0.2G12 |
| Failure Criterion | Degradation Rule |
|---|---|
| Esf = 0.4Esf |
Publisher’s Note: MDPI stays neutral with regard to jurisdictional claims in published maps and institutional affiliations. |
© 2022 by the authors. Licensee MDPI, Basel, Switzerland. This article is an open access article distributed under the terms and conditions of the Creative Commons Attribution (CC BY) license (https://creativecommons.org/licenses/by/4.0/).
Share and Cite
Huang, Y.; Guan, Z.; Yi, X.; Ni, Z.; Ouyang, T.; Li, Z. Experimental and Numerical Investigation of Intact, Defective and Repaired Countersunk Composite Joints under Tensile Loading. Materials 2022, 15, 4677. https://doi.org/10.3390/ma15134677
Huang Y, Guan Z, Yi X, Ni Z, Ouyang T, Li Z. Experimental and Numerical Investigation of Intact, Defective and Repaired Countersunk Composite Joints under Tensile Loading. Materials. 2022; 15(13):4677. https://doi.org/10.3390/ma15134677
Chicago/Turabian StyleHuang, Yongjie, Zhidong Guan, Xian Yi, Zhangsong Ni, Tian Ouyang, and Zengshan Li. 2022. "Experimental and Numerical Investigation of Intact, Defective and Repaired Countersunk Composite Joints under Tensile Loading" Materials 15, no. 13: 4677. https://doi.org/10.3390/ma15134677