Simulation of the Refractive Index Variation and Validation of the Form Deviation in Precisely Molded Chalcogenide Glass Lenses (IRG 26) Considering the Stress and Structure Relaxation

 , and
, and
Abstract
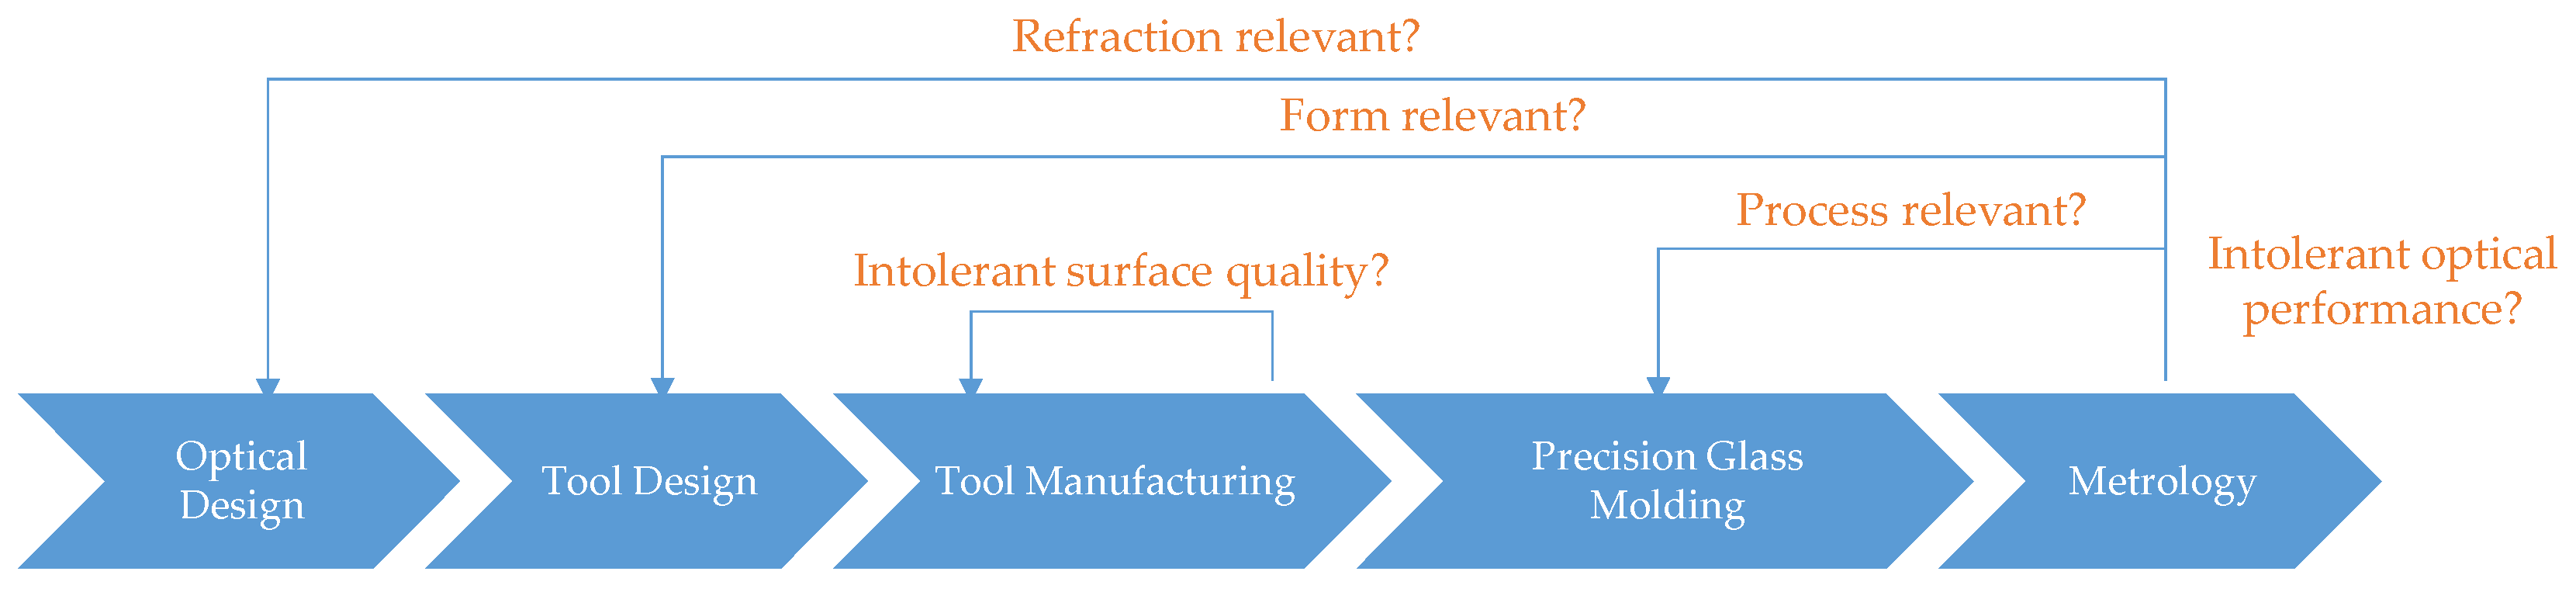
:1. Introduction
2. Materials and Methods
2.1. Chalcogenide Glass as an Infrared Optic Material
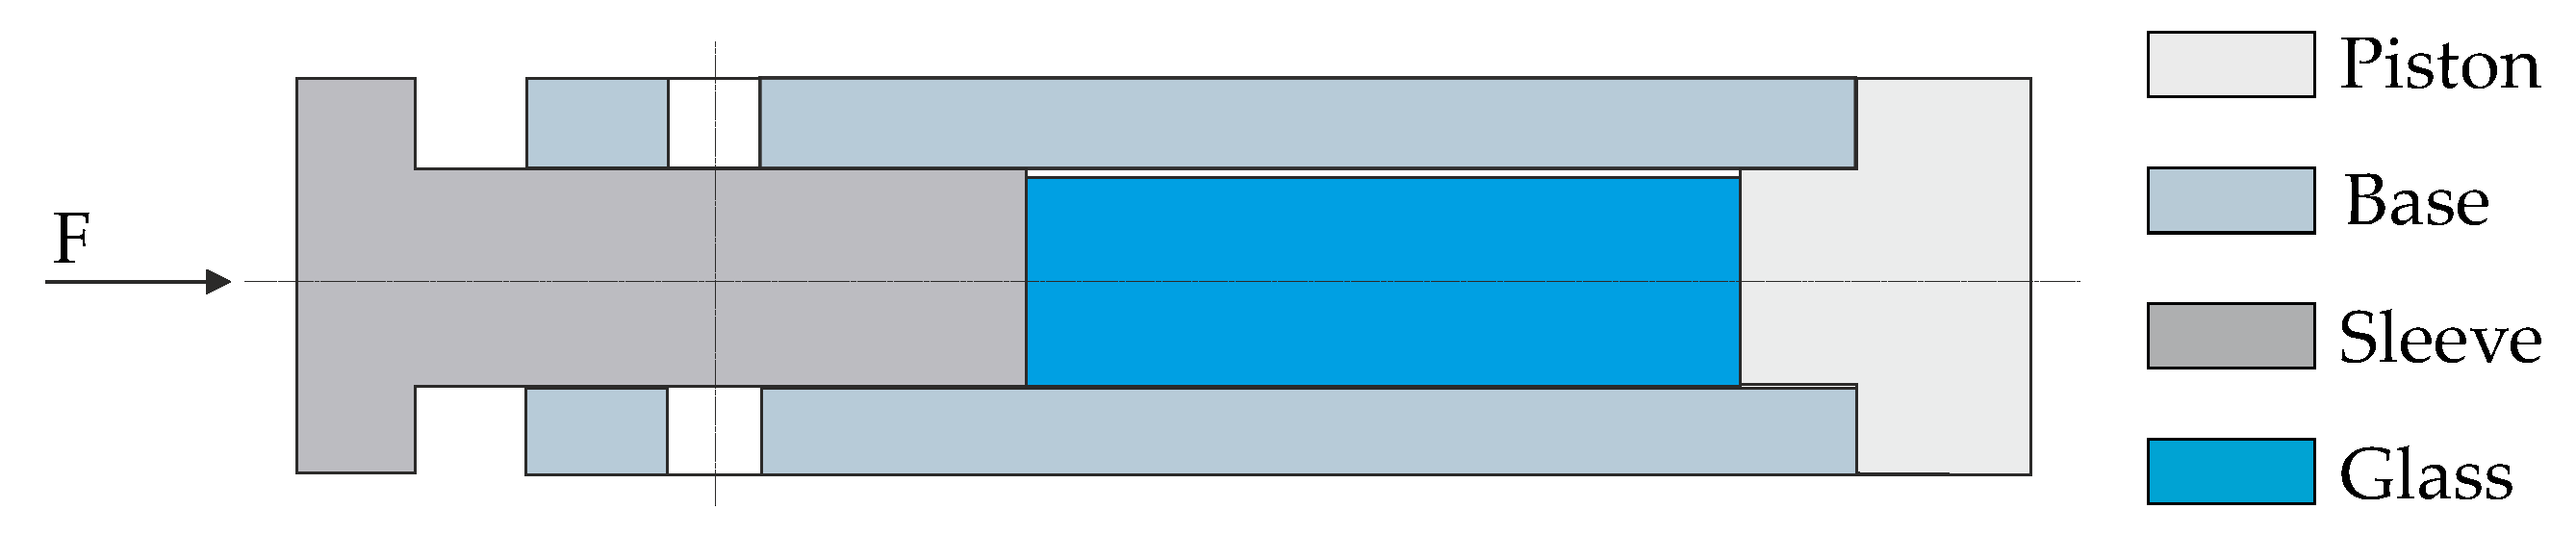
2.2. PGM Machine and Tools
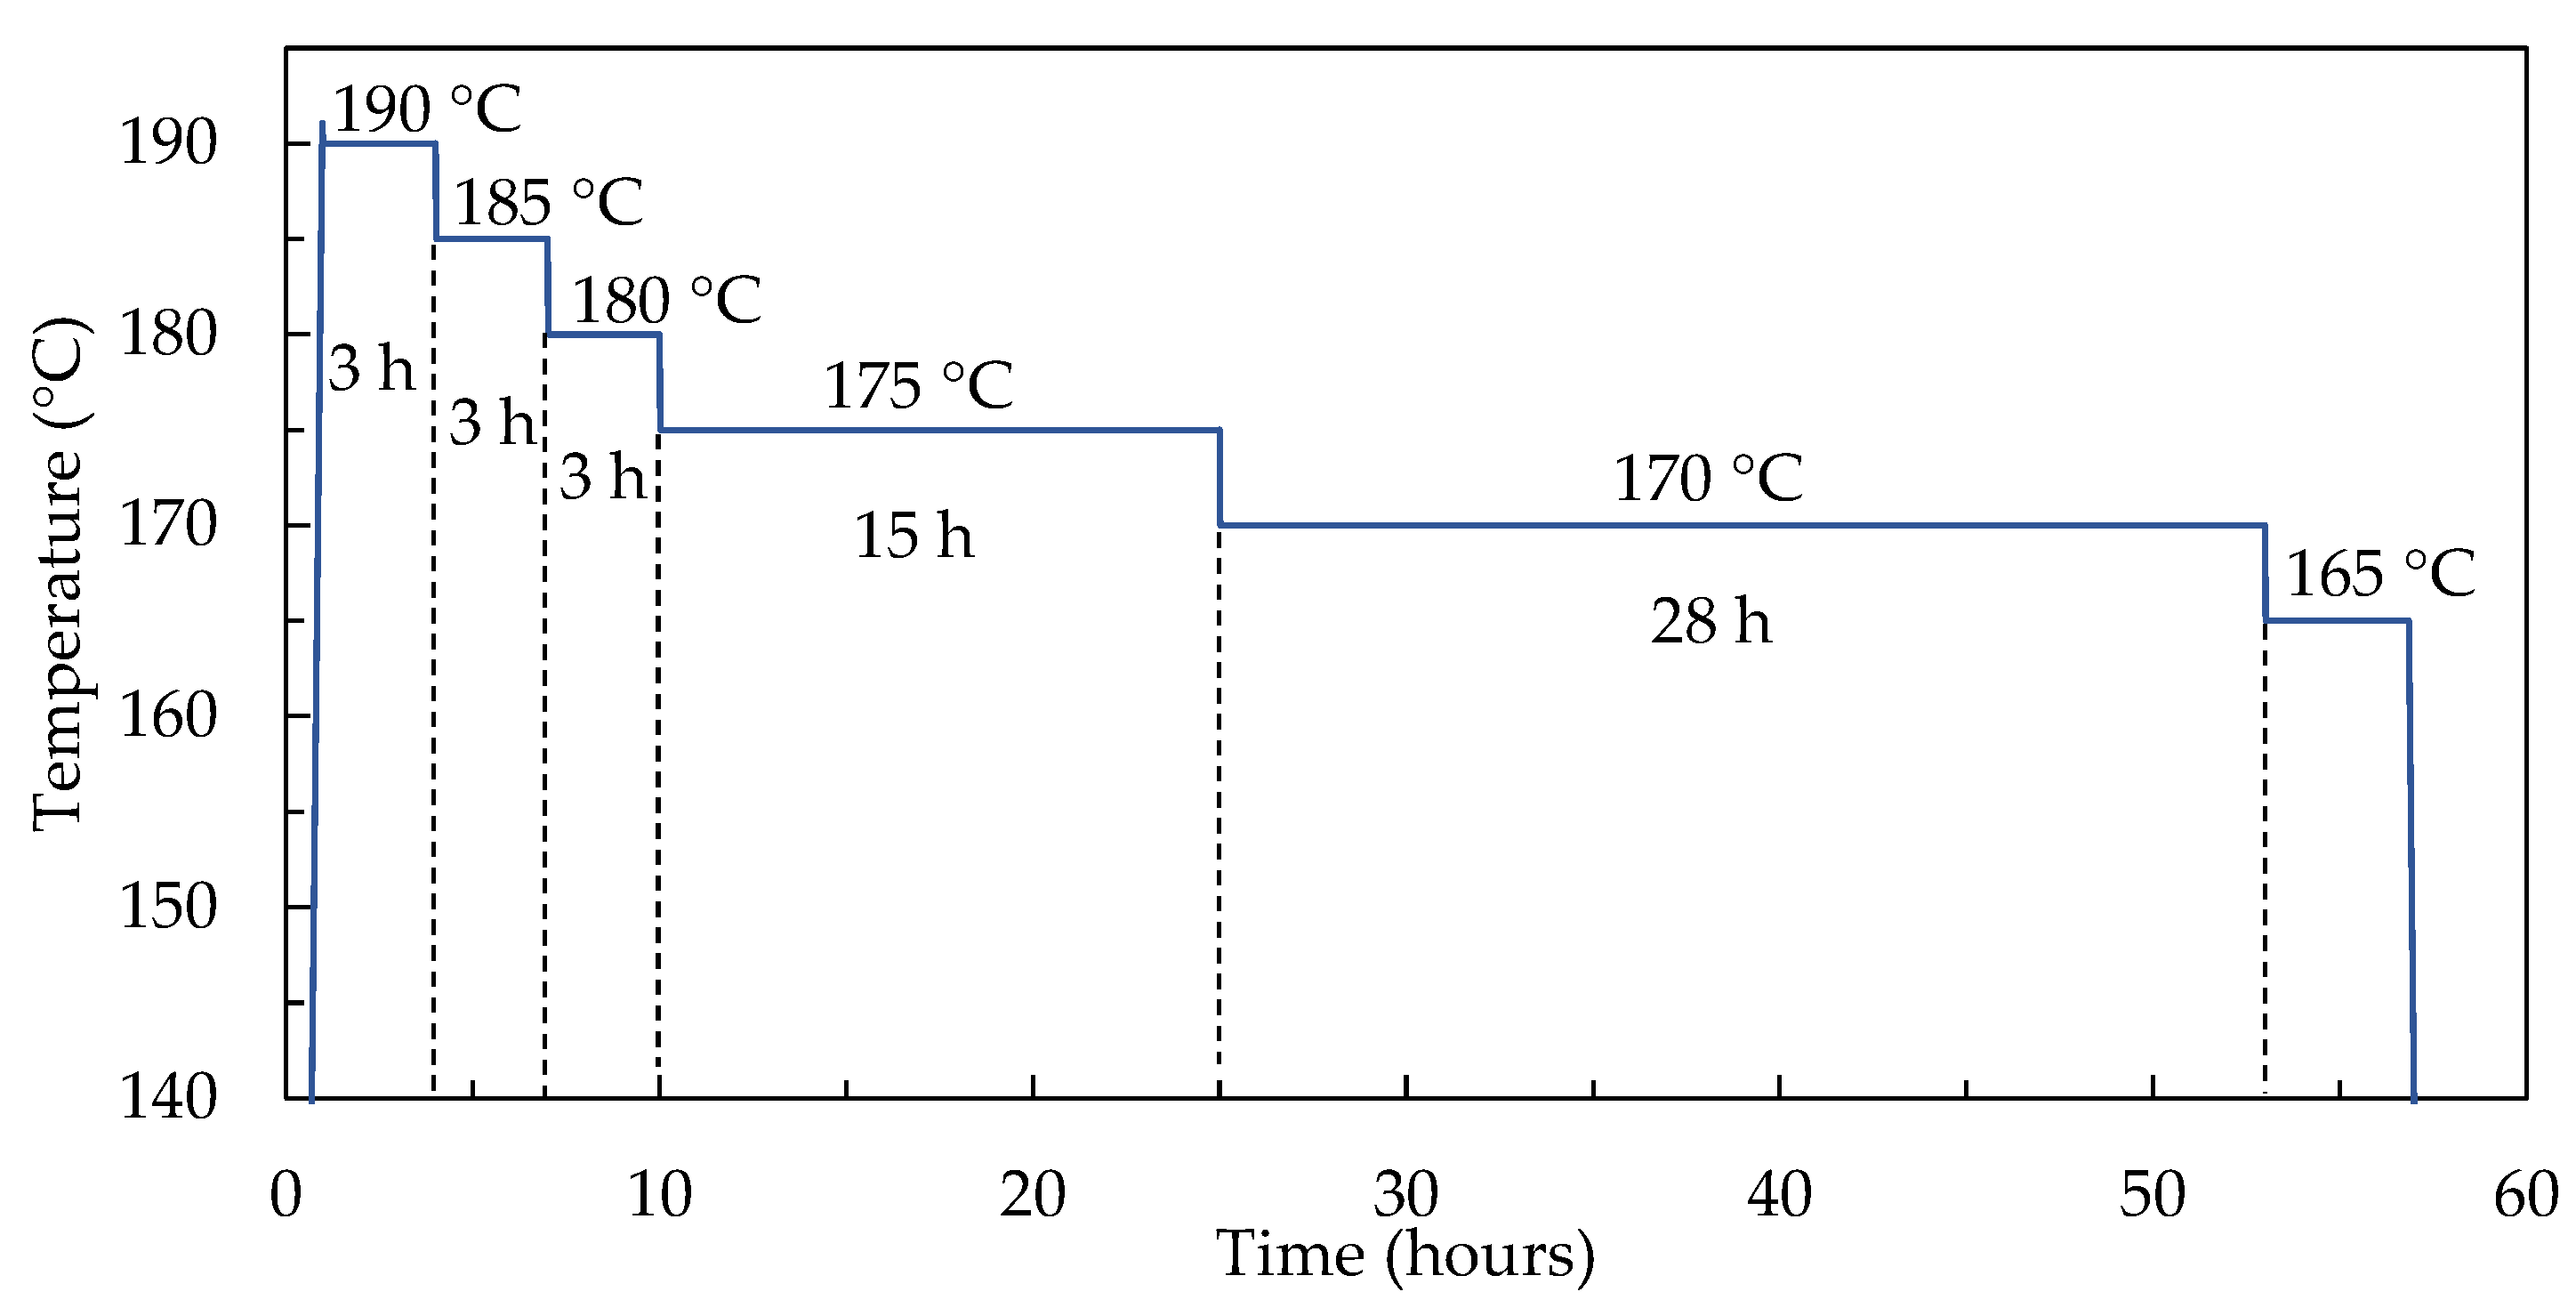
2.3. Material Characterization
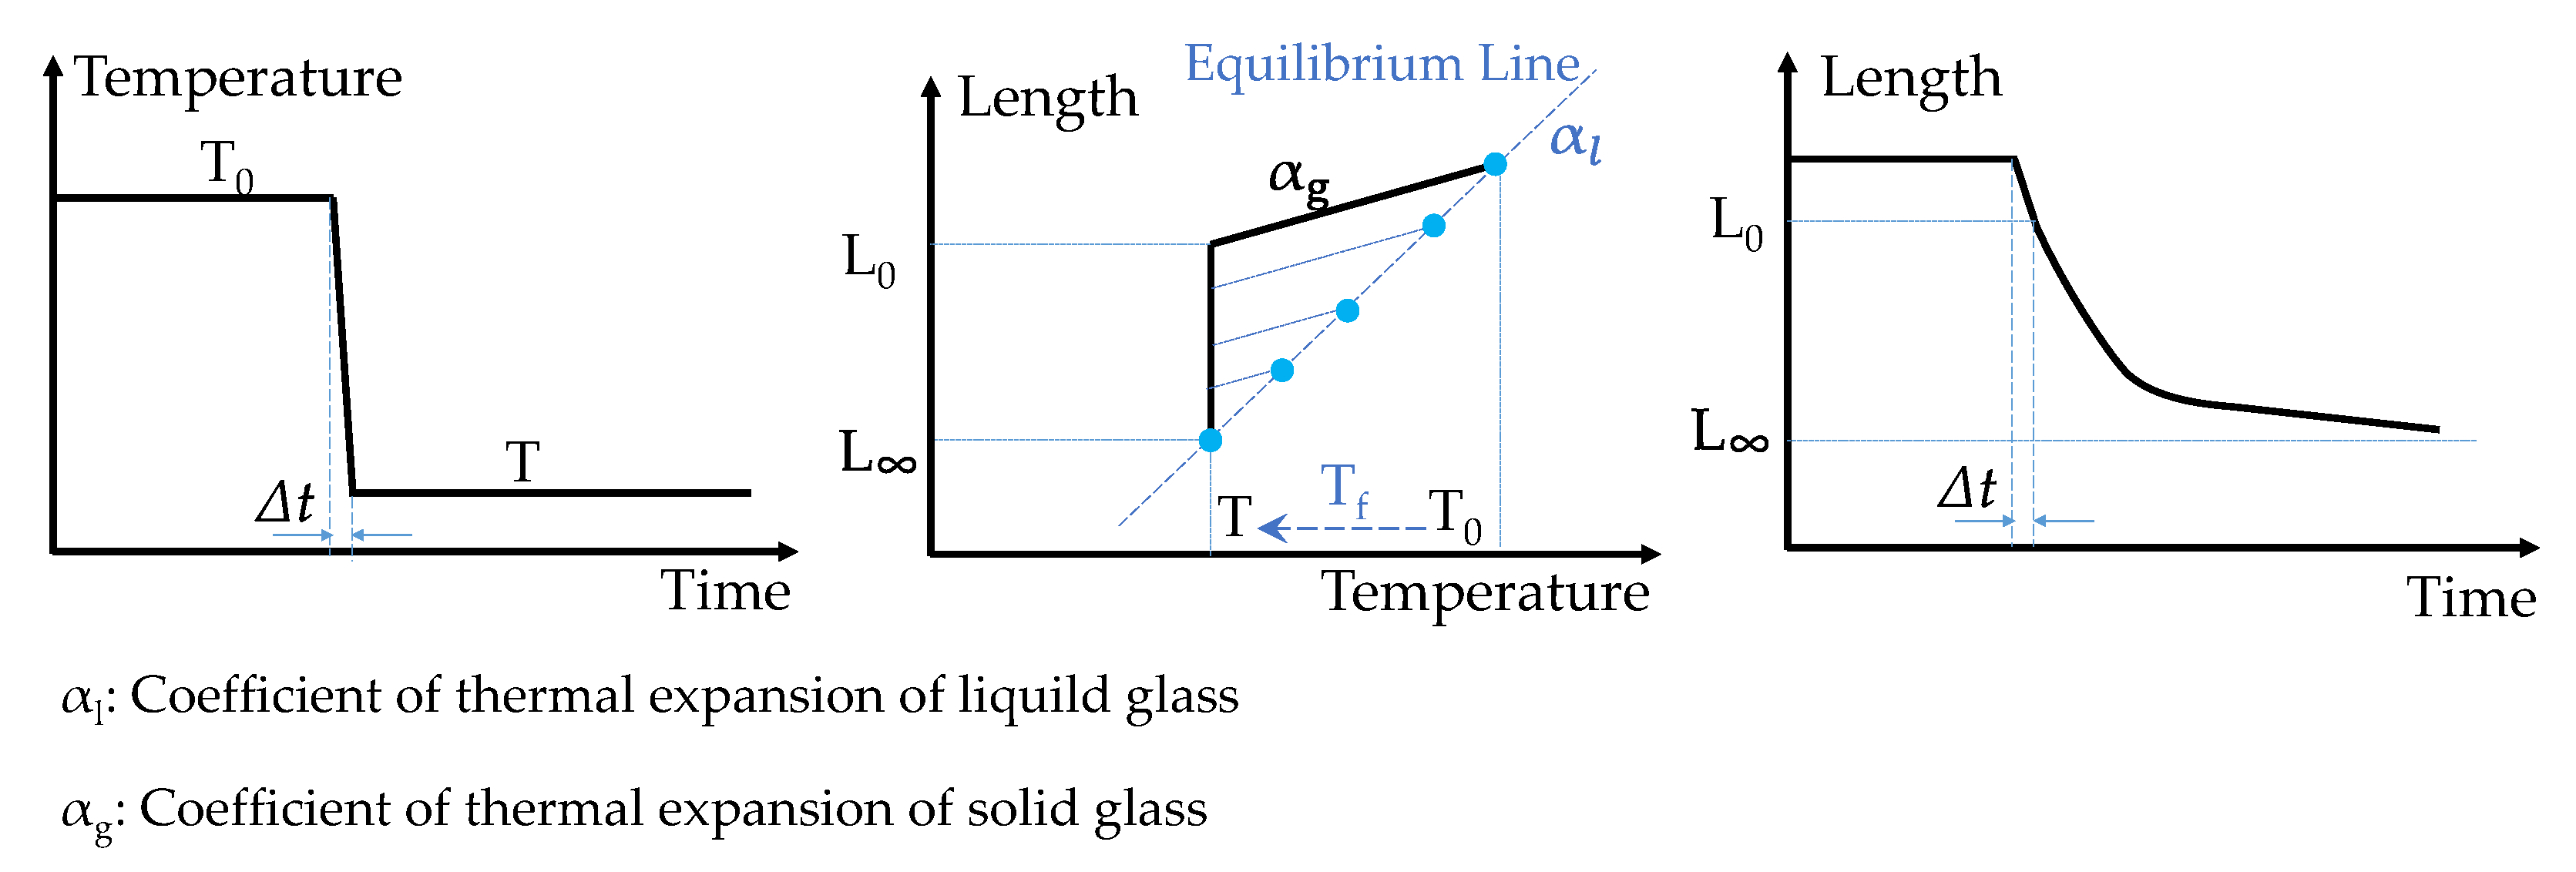
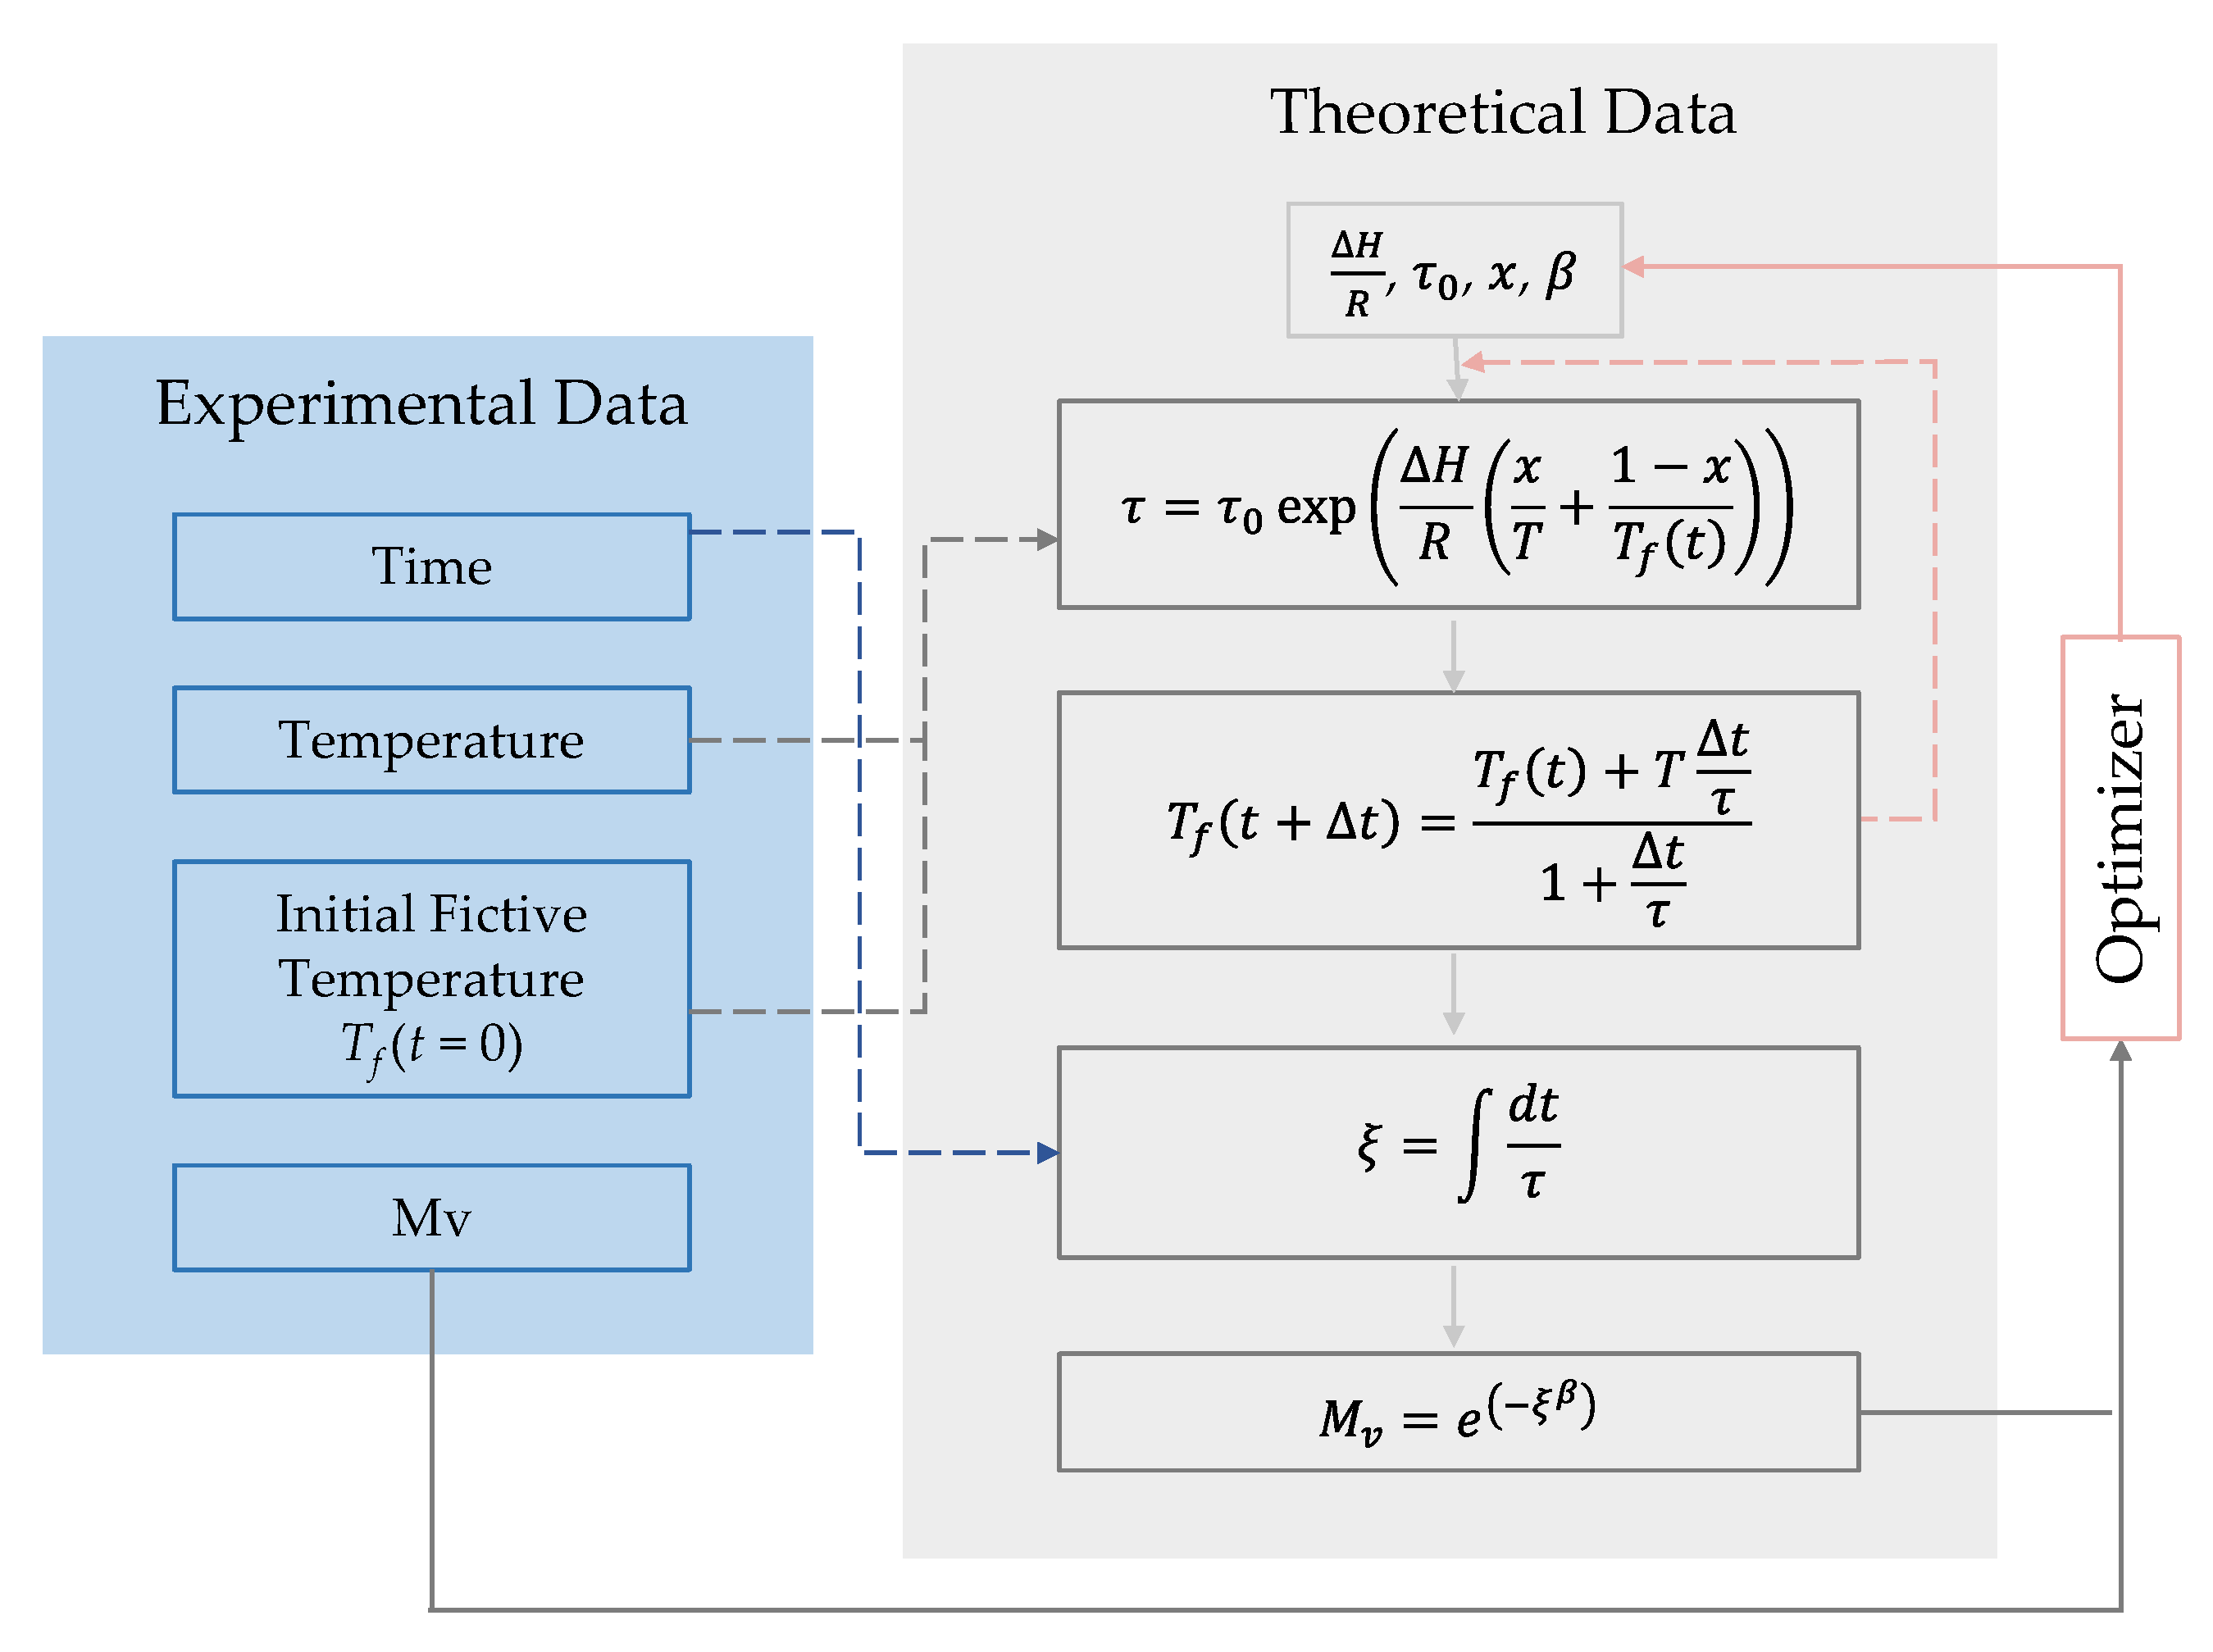
2.3.1. Structure Relaxation and TNM (Tool–Narayanaswamy–Moynihan) Model
| R: | Ideal gas constant |
| : | Relaxation spectrum under the reference temperature |
| : | Relaxation spectrum |
| ΔH: | Activation enthalpy |
| x: | Constant, 0 ≤ x ≤ 1 |
| : | Fictive temperature spectrum |
| : | Fictive temperature |
| T: | Temperature |
| : | Weight factor for the fictive temperature spectrum |
| Leq: | Length in the equilibrium |
| αg: | CTE of solid glass |
| αl: | CTE of liquid glass |
| Δt: | Time increment |
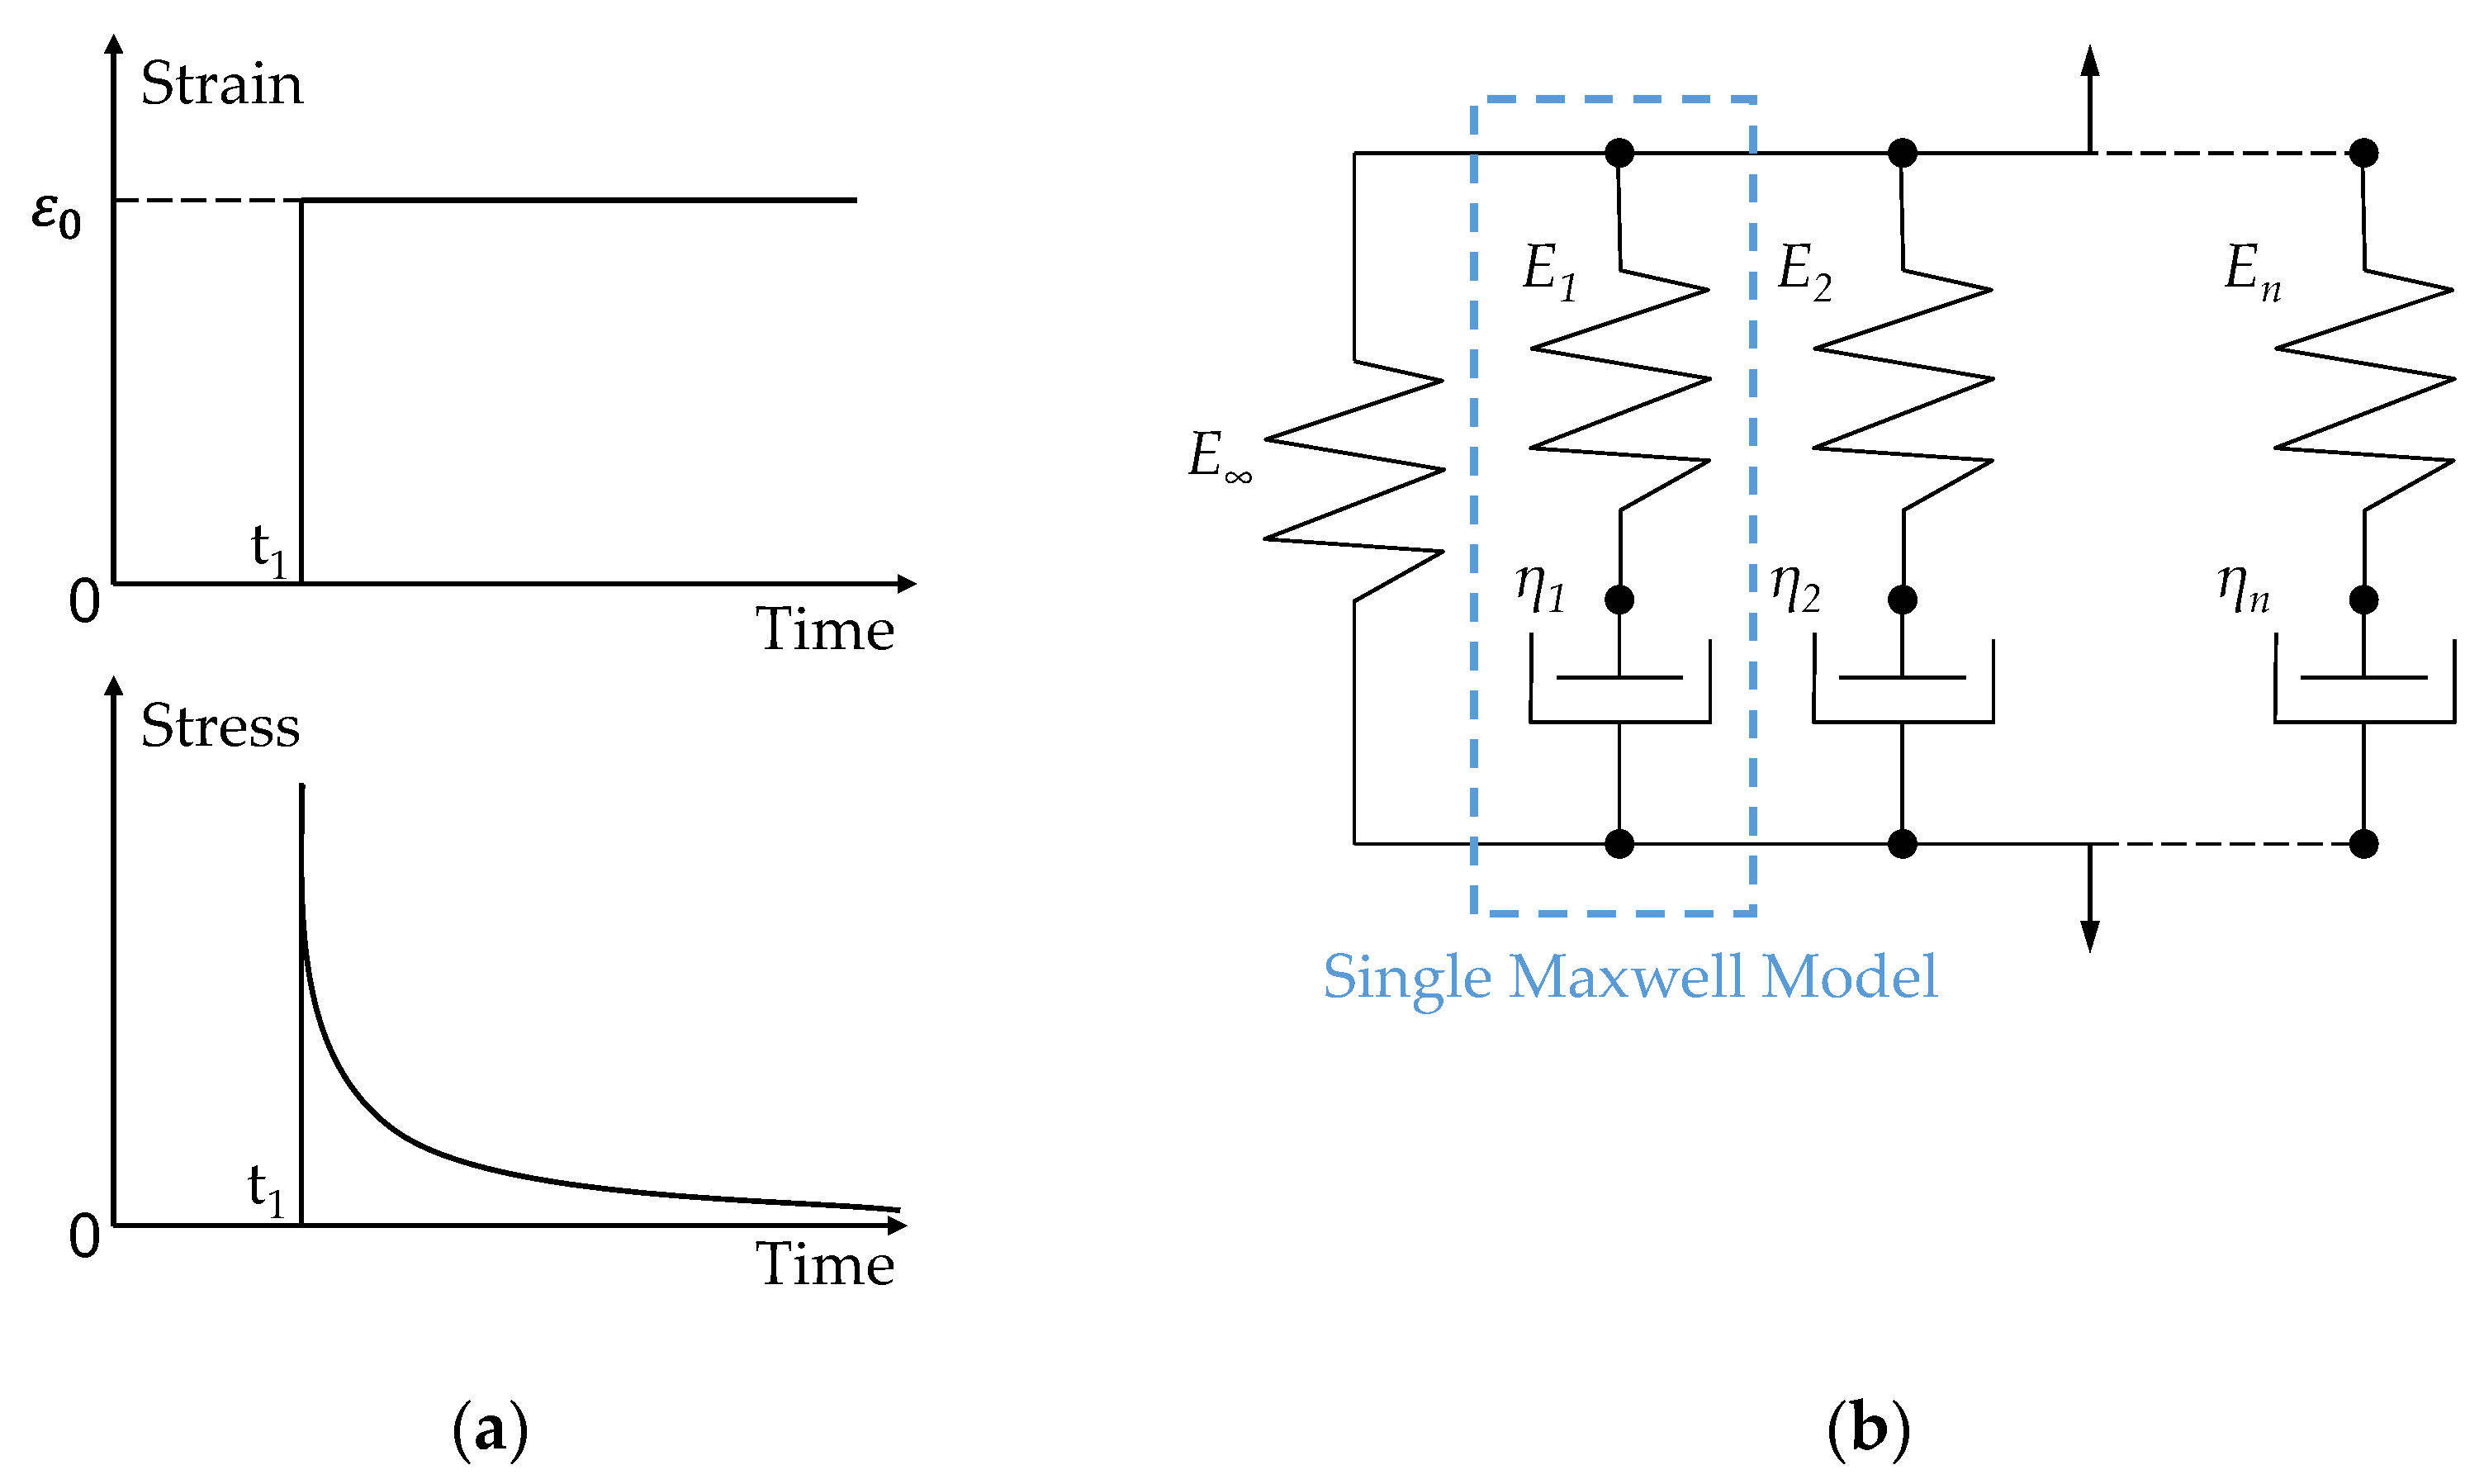
2.3.2. Stress Relaxation and General Maxwell Model
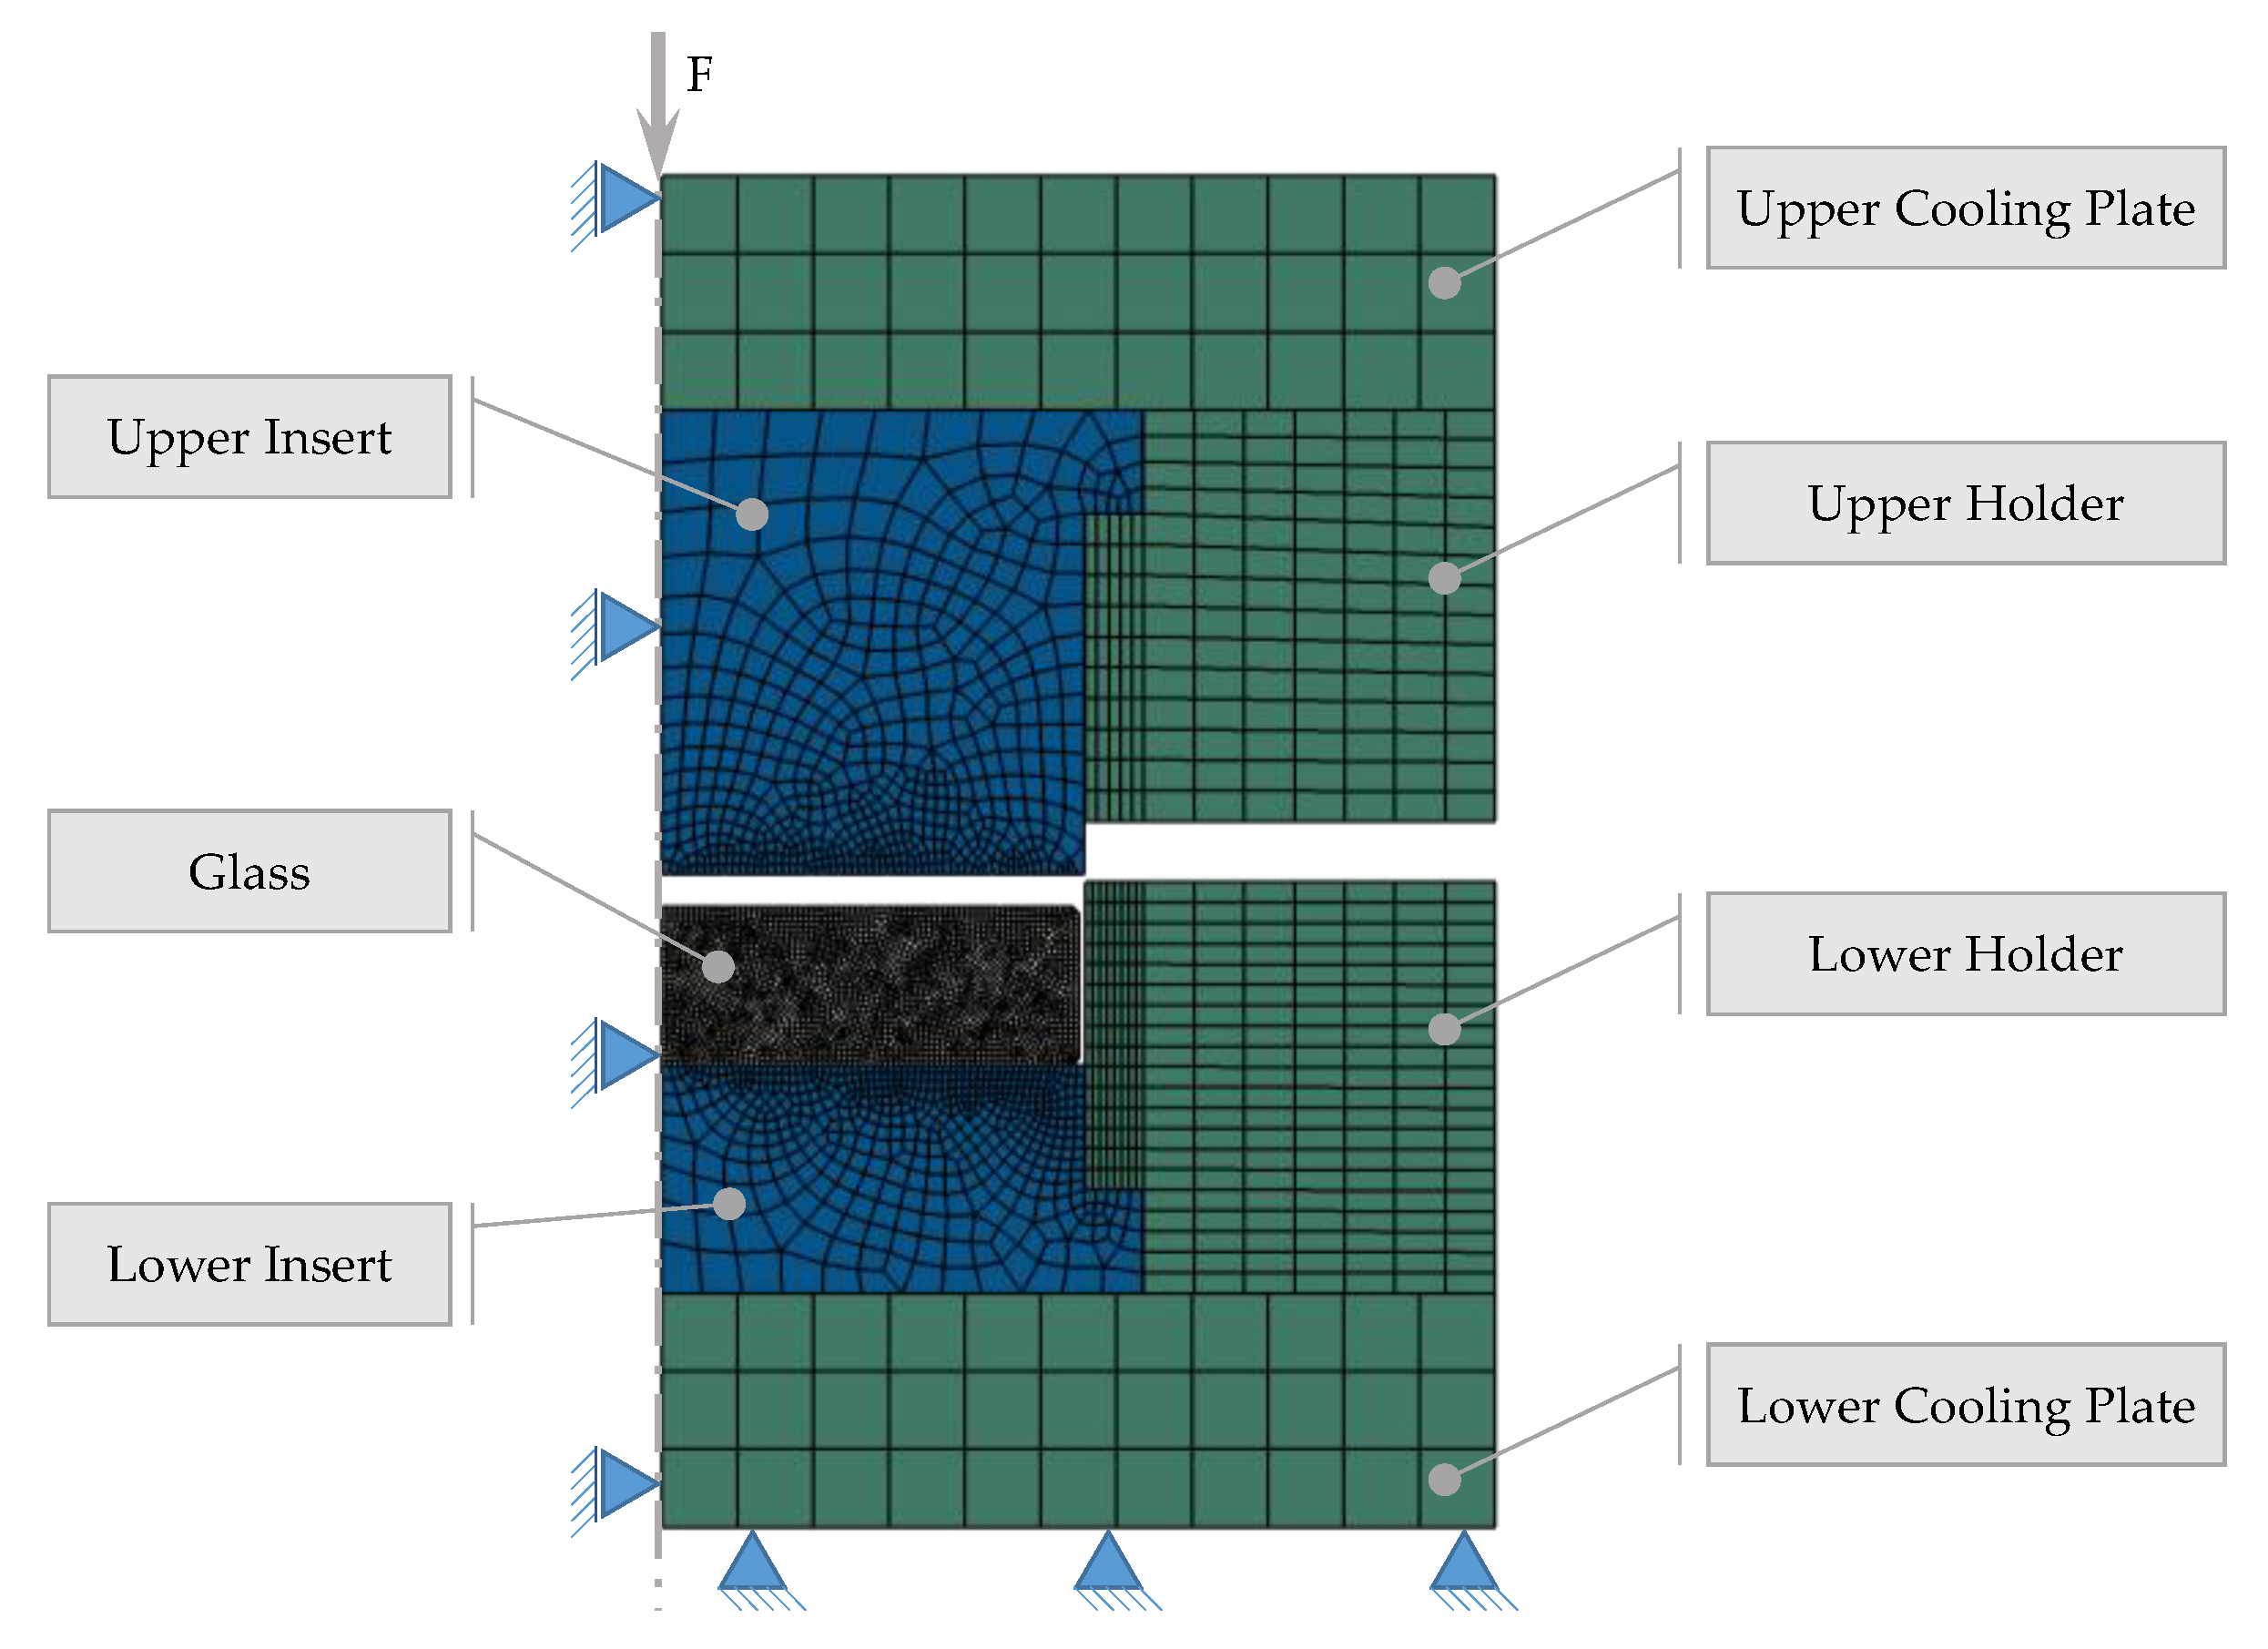
2.4. Simulation Model
3. Results
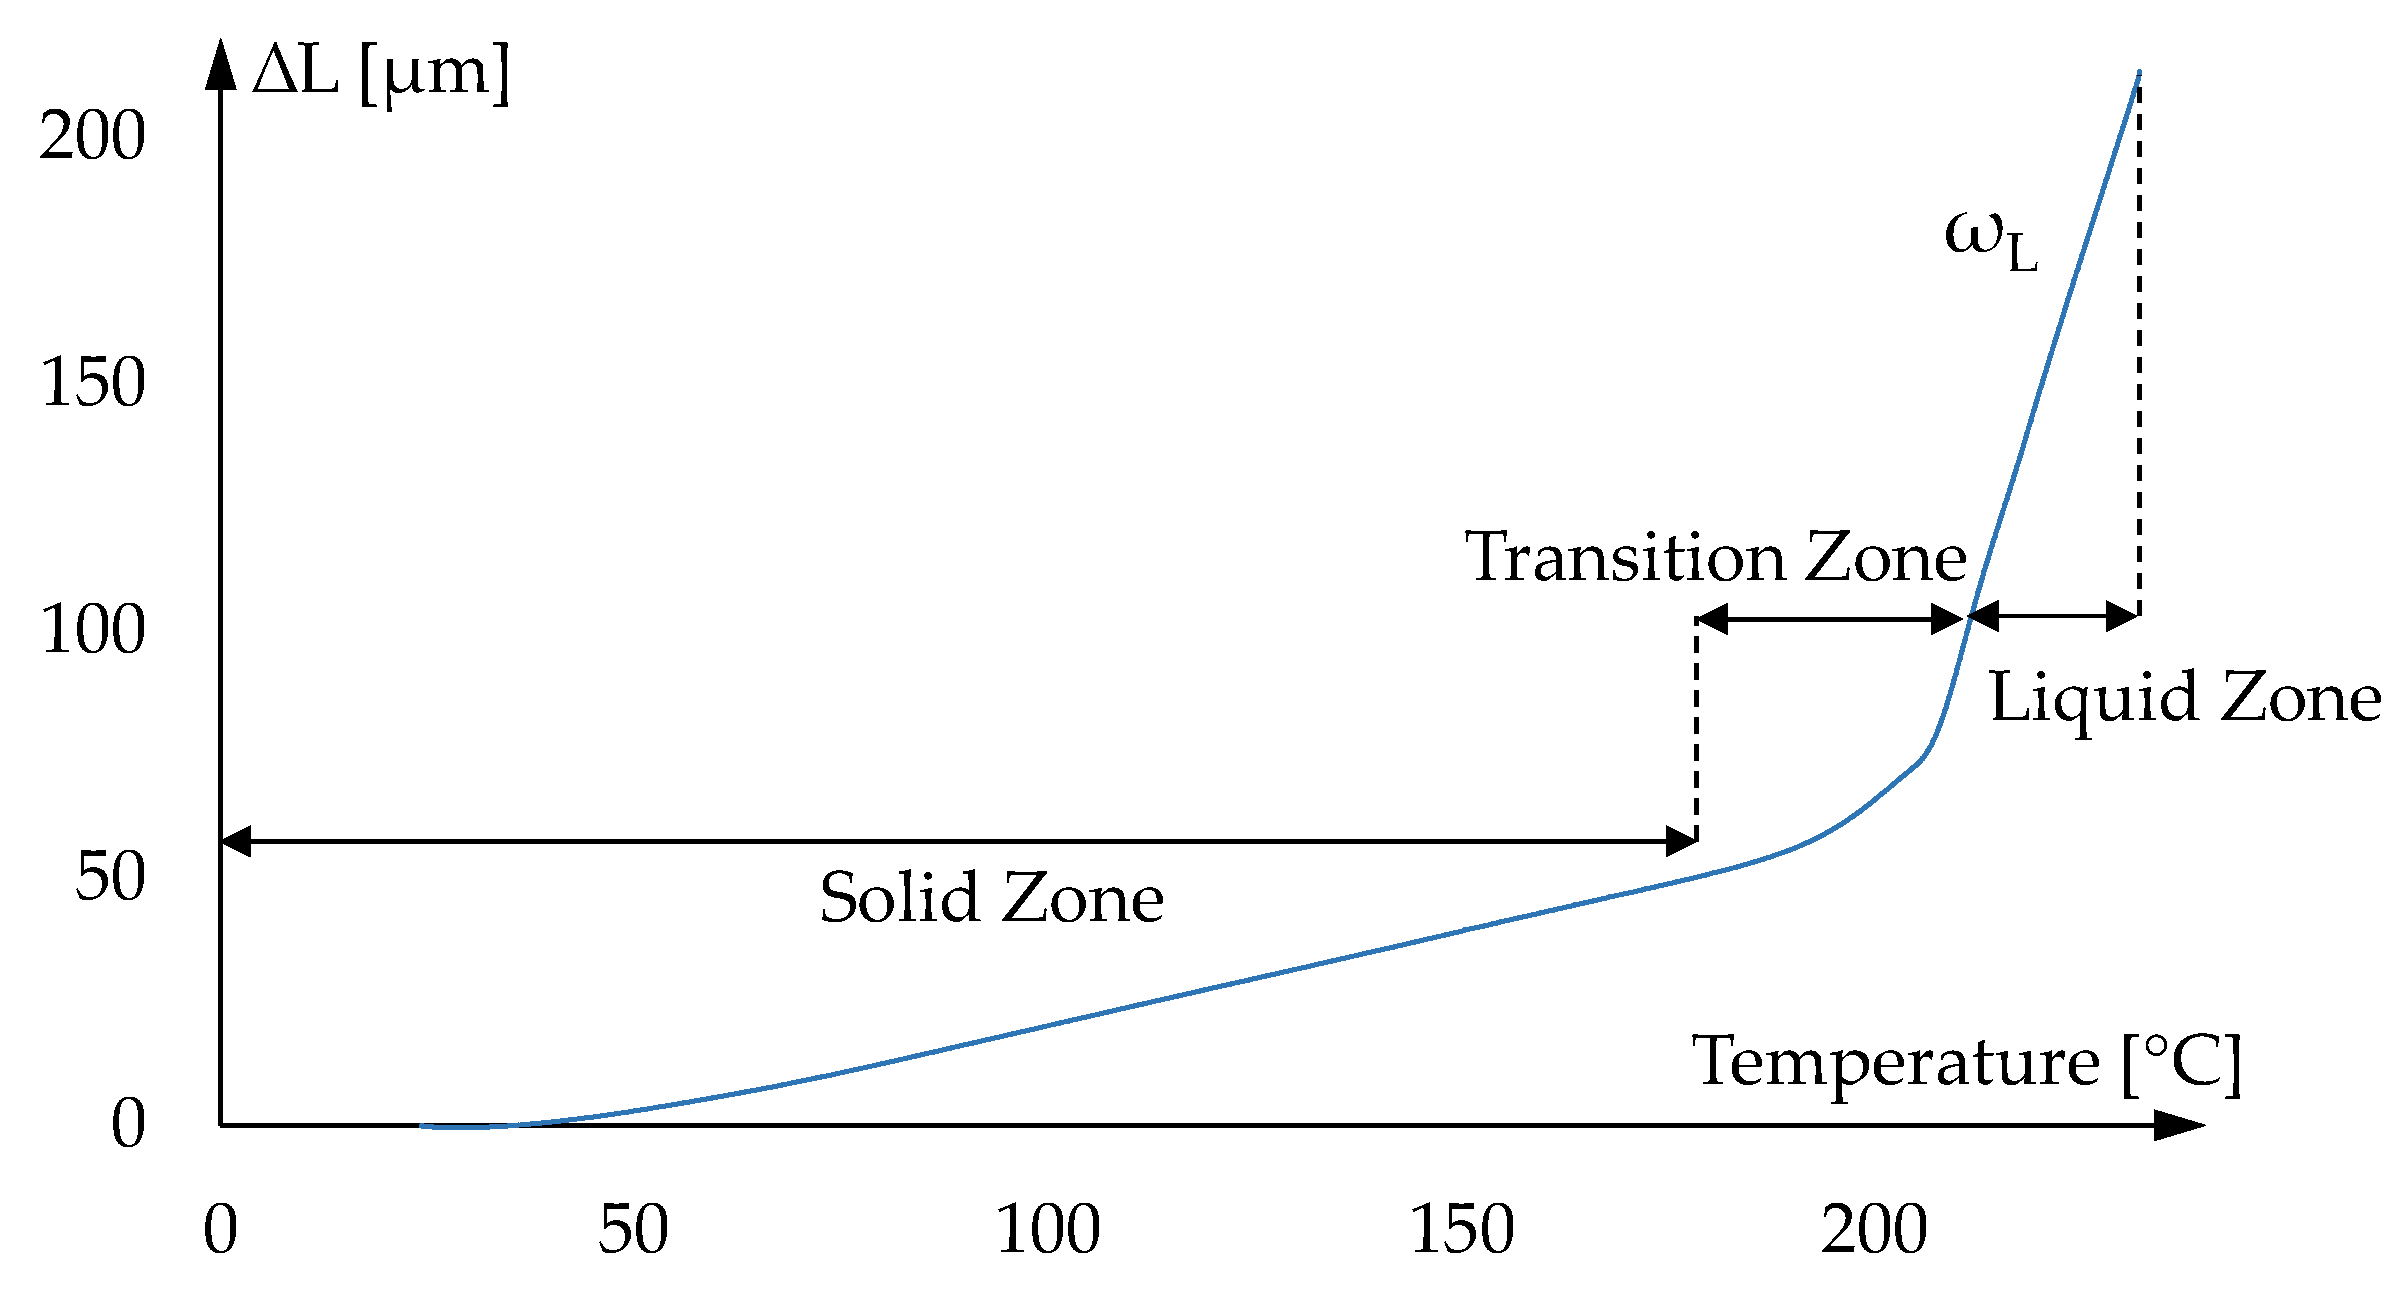
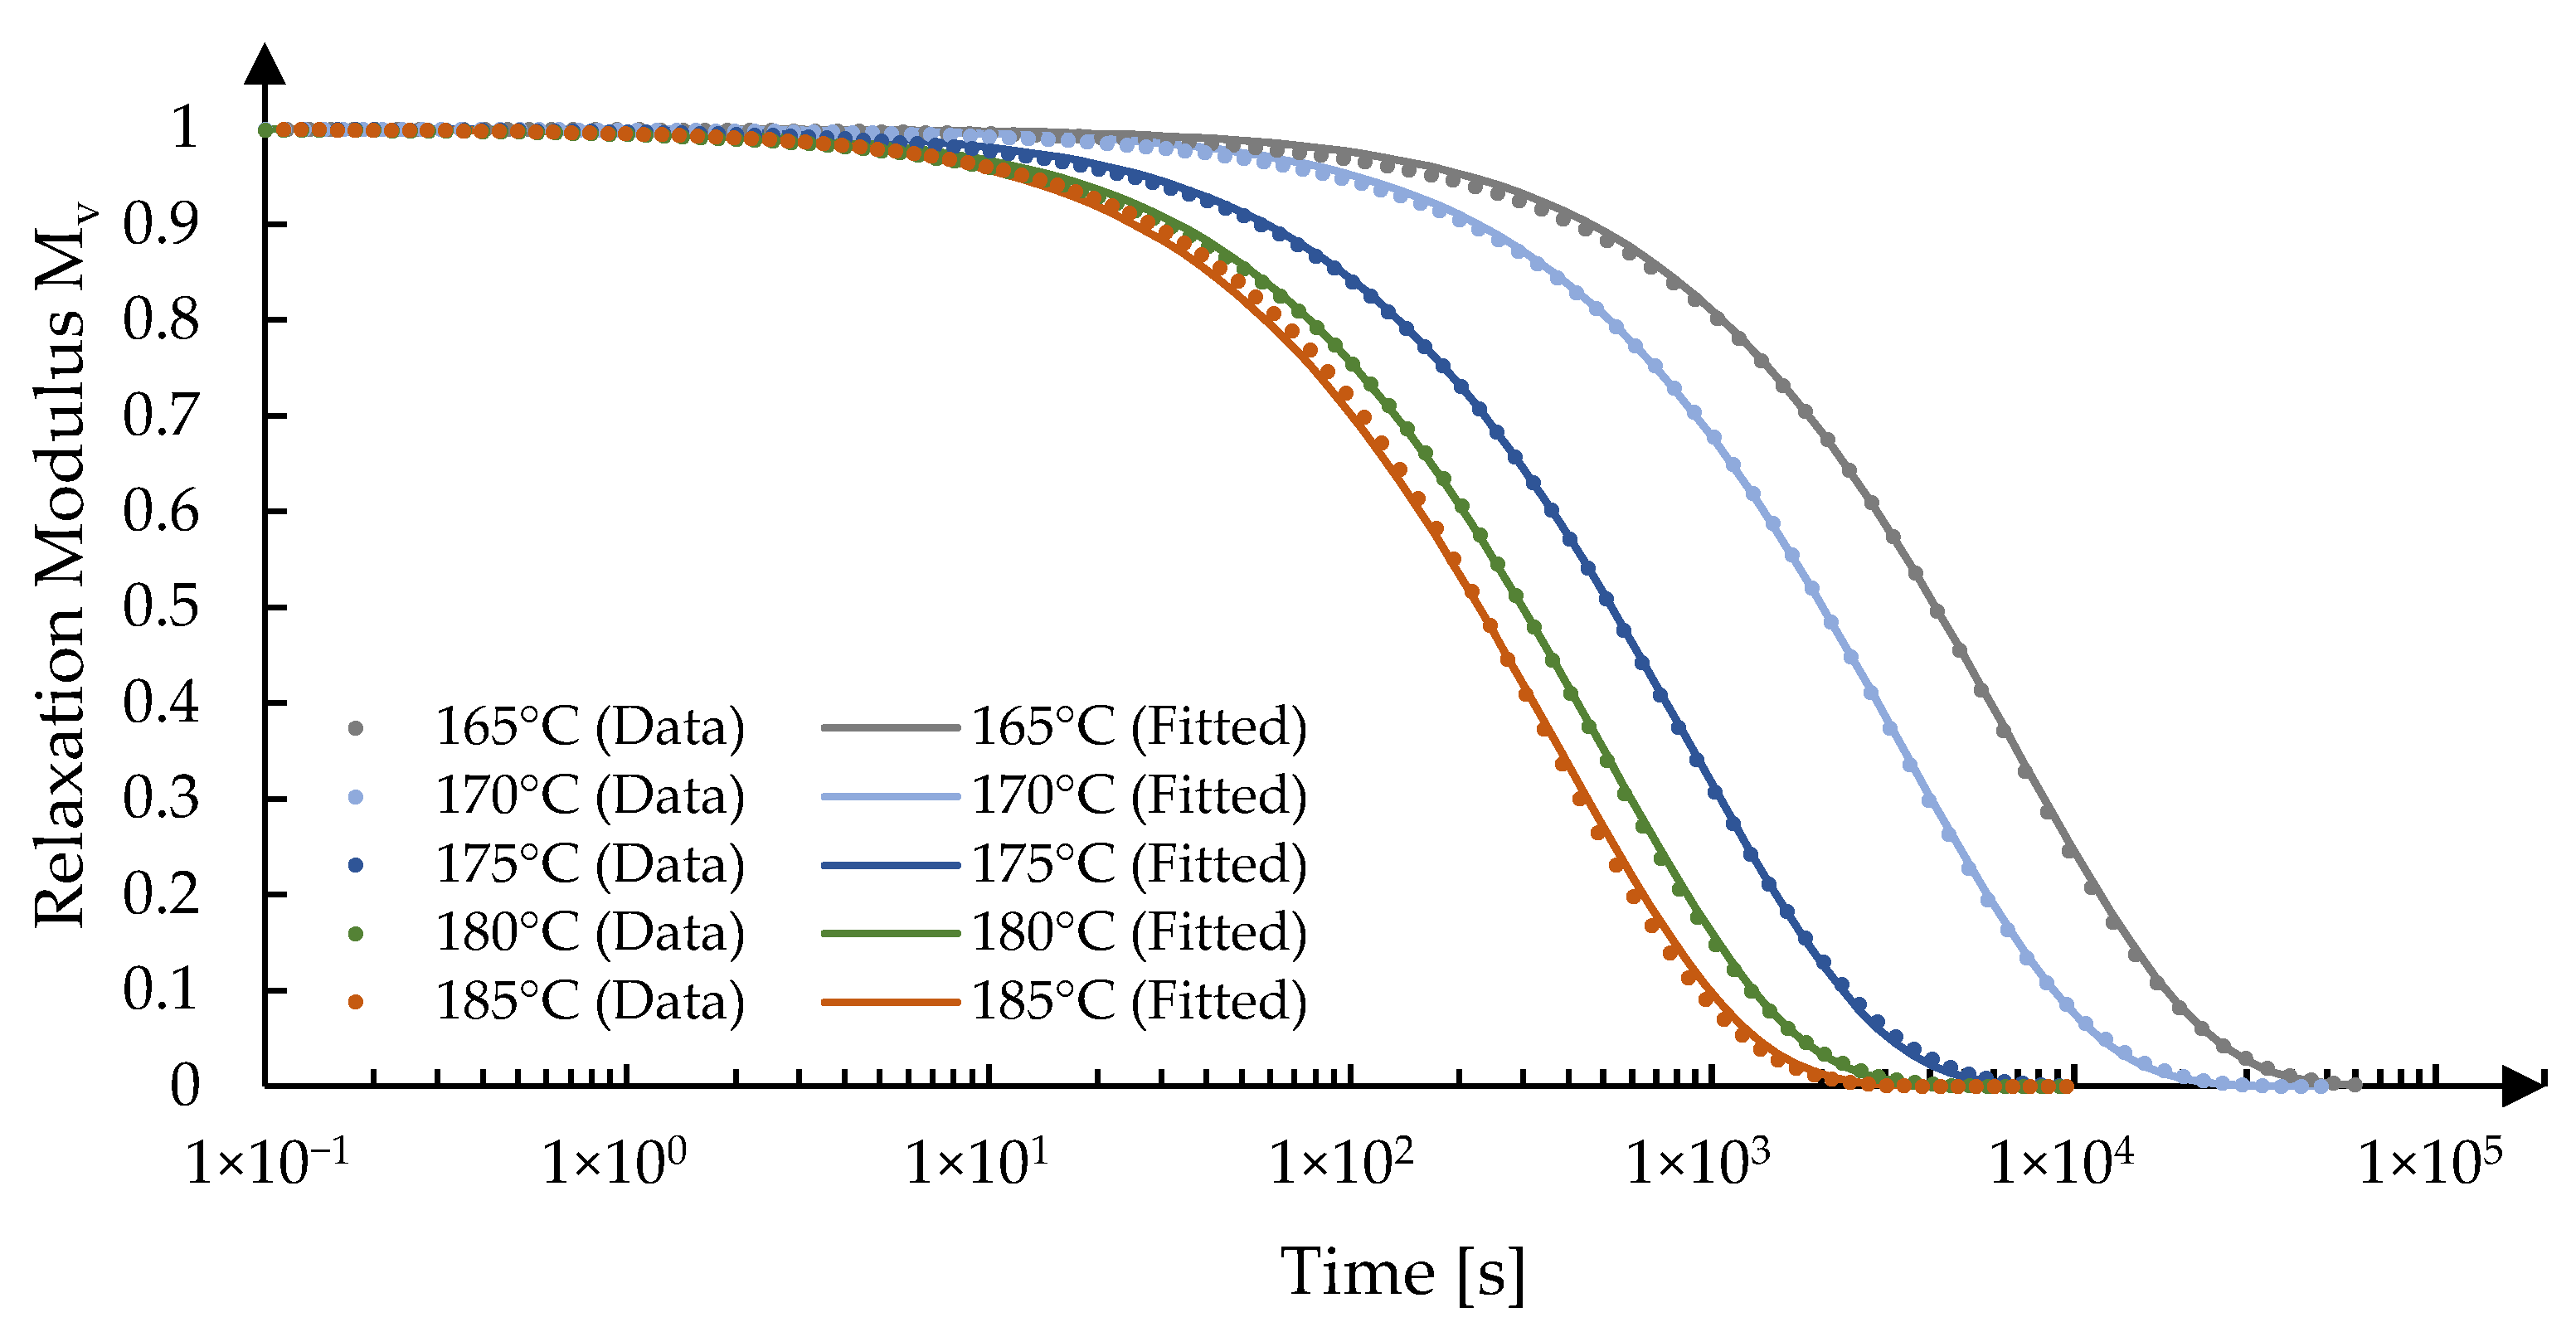
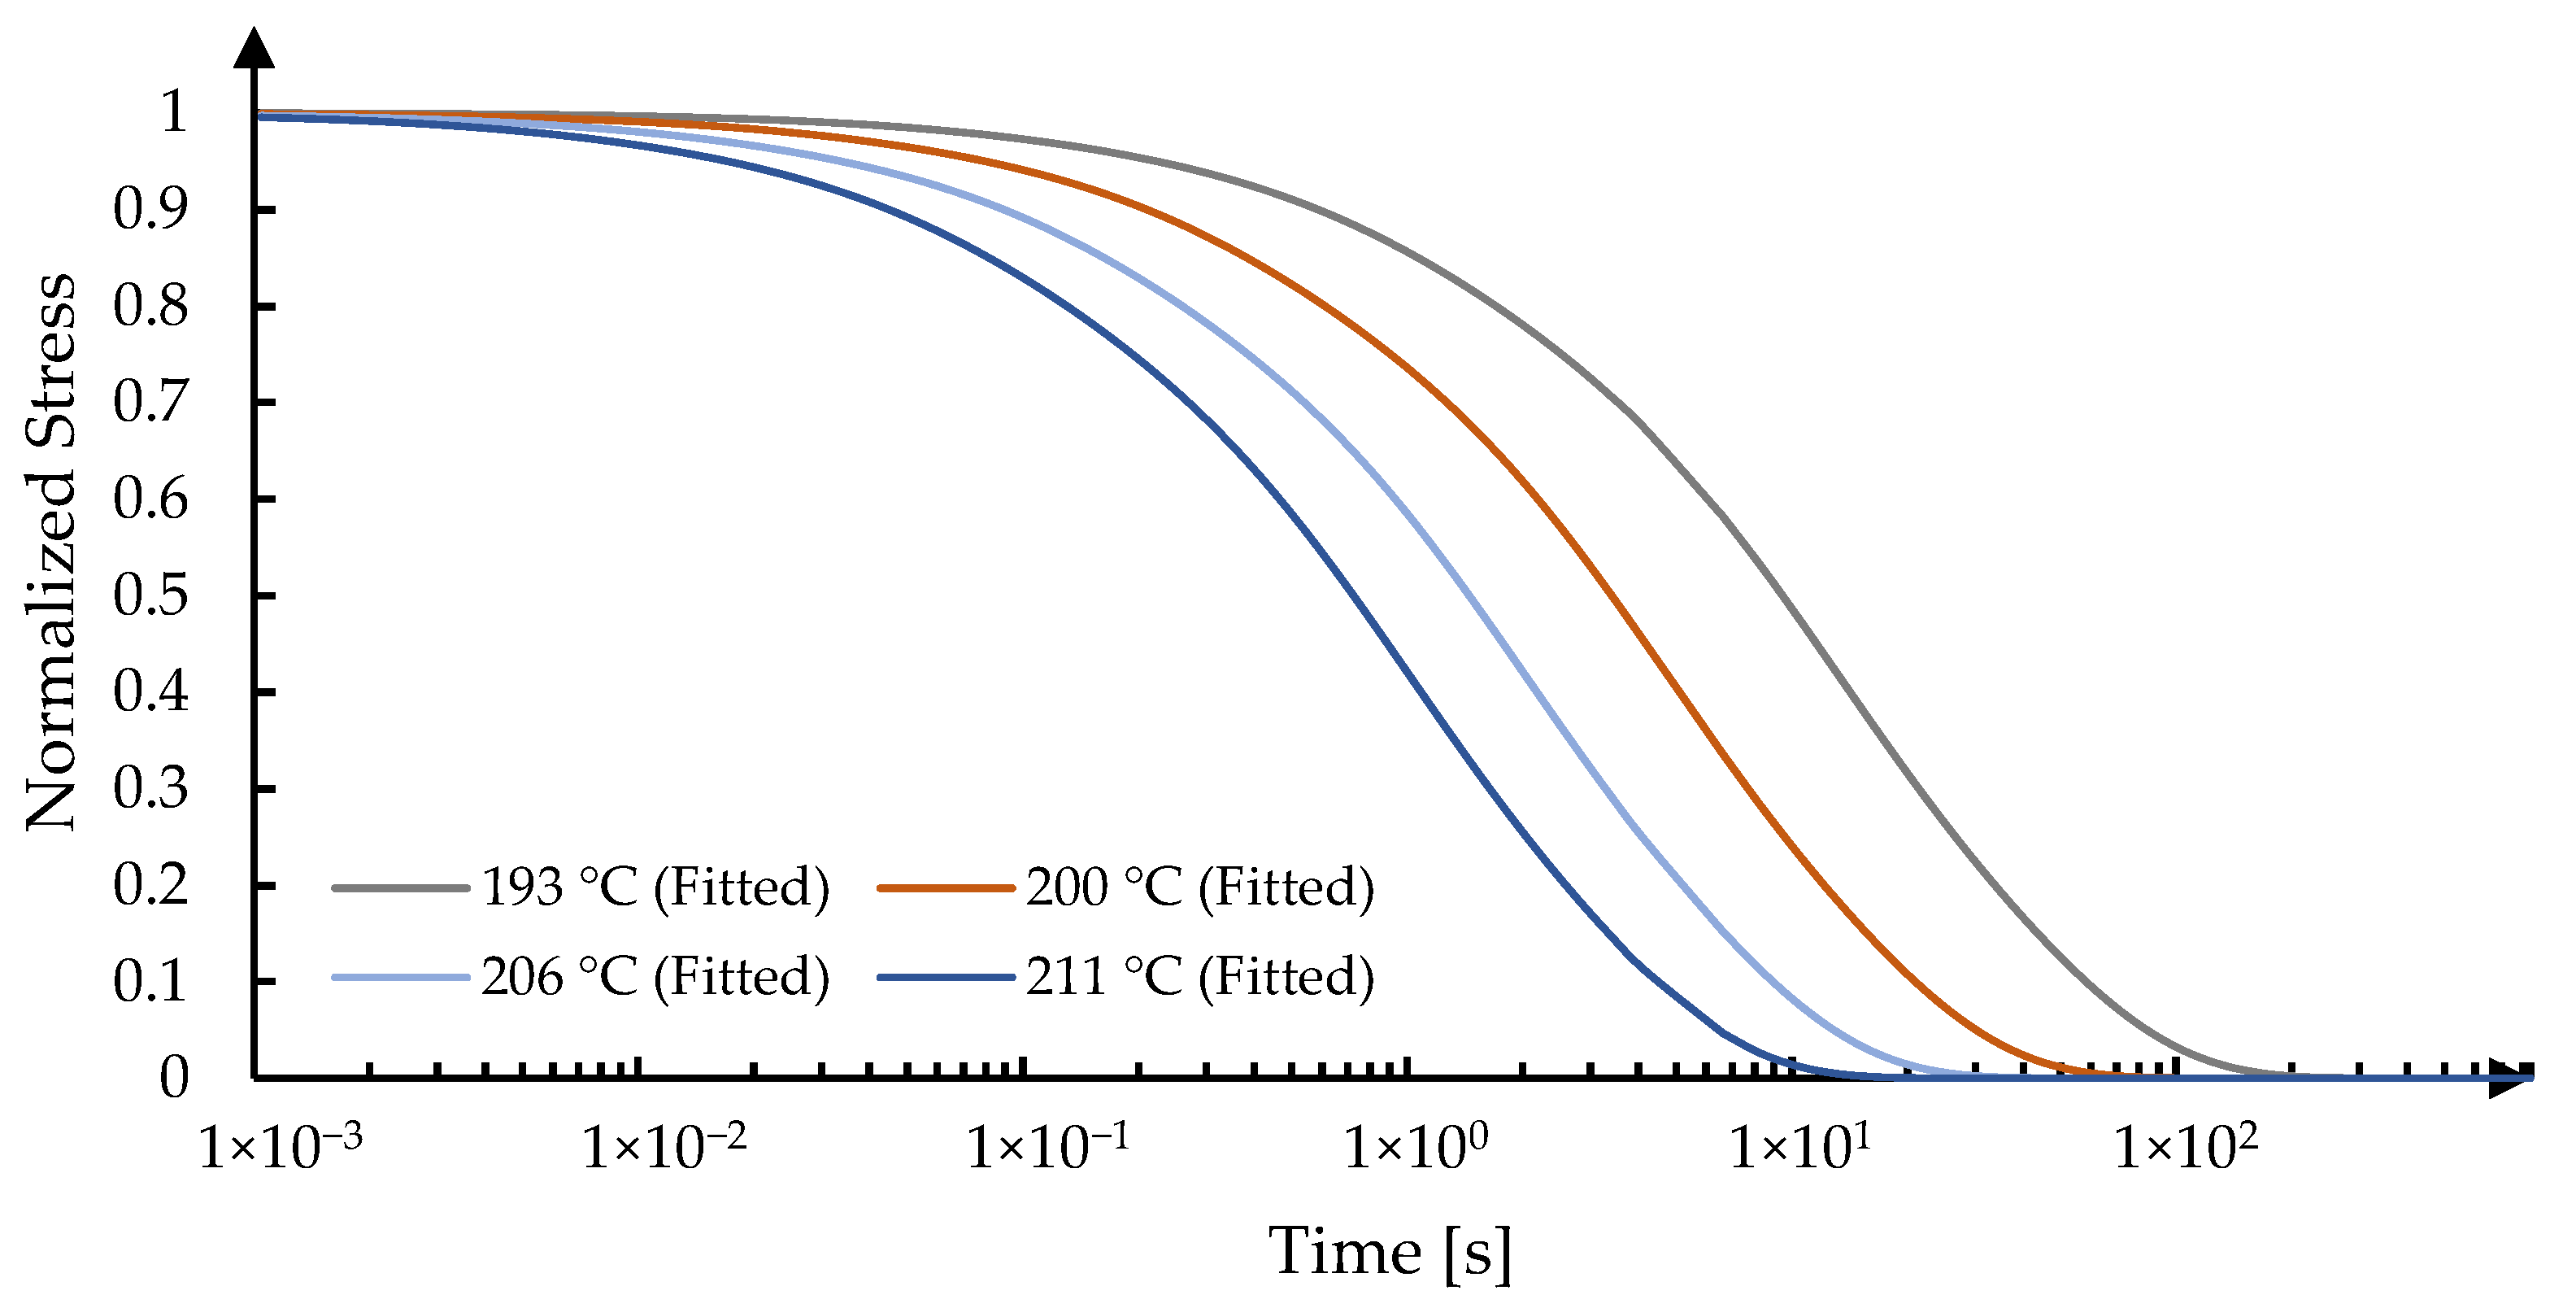
3.1. Material Characterization
| β: | Stretching parameter, 0 < β ≤ 1 |
| : | Reduced time |
3.2. Validation of the Implemented Simulation Model
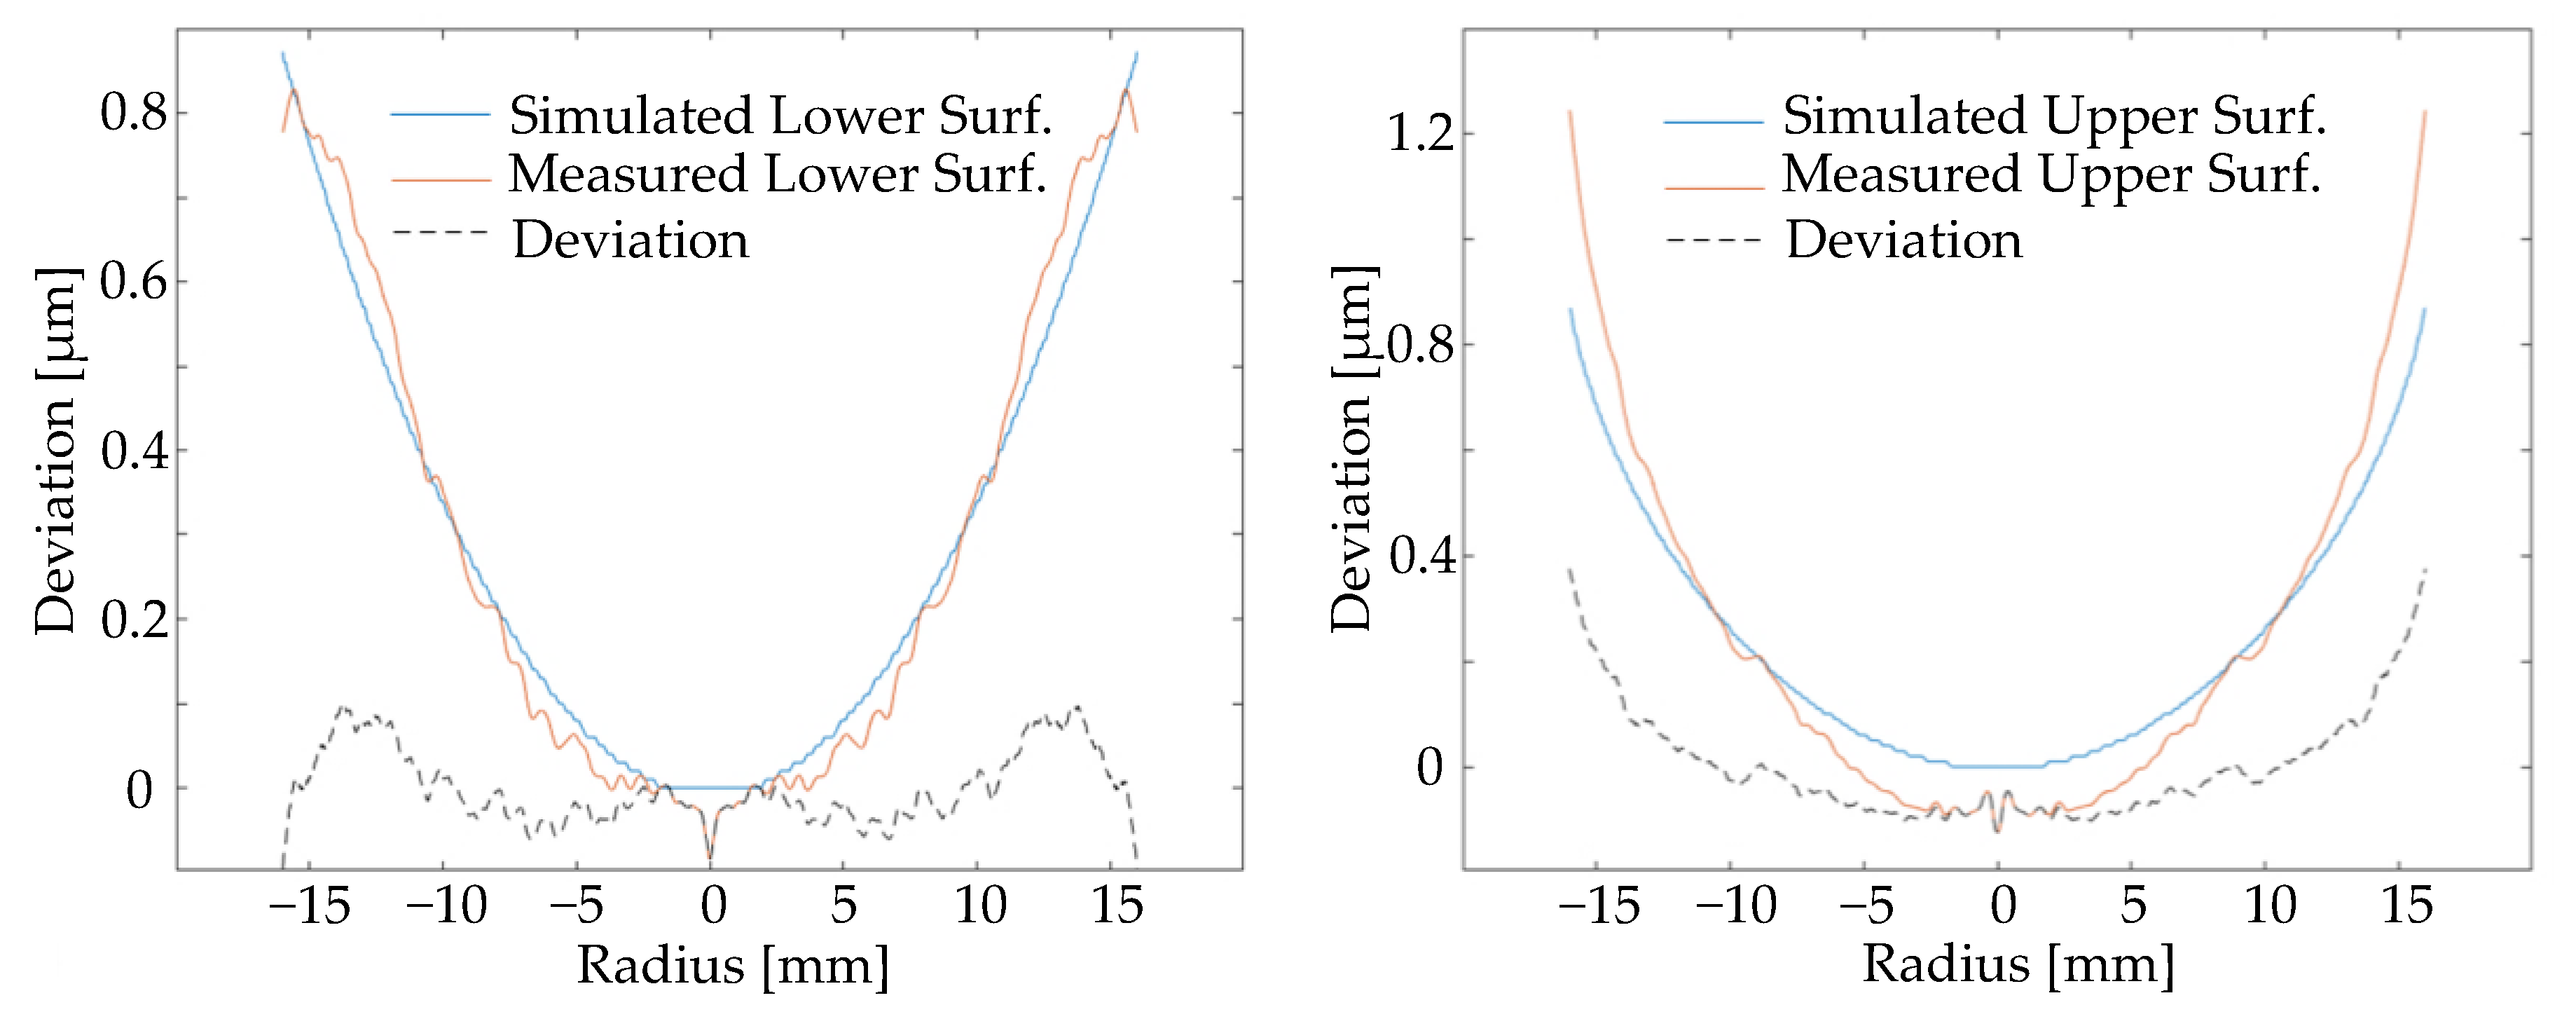
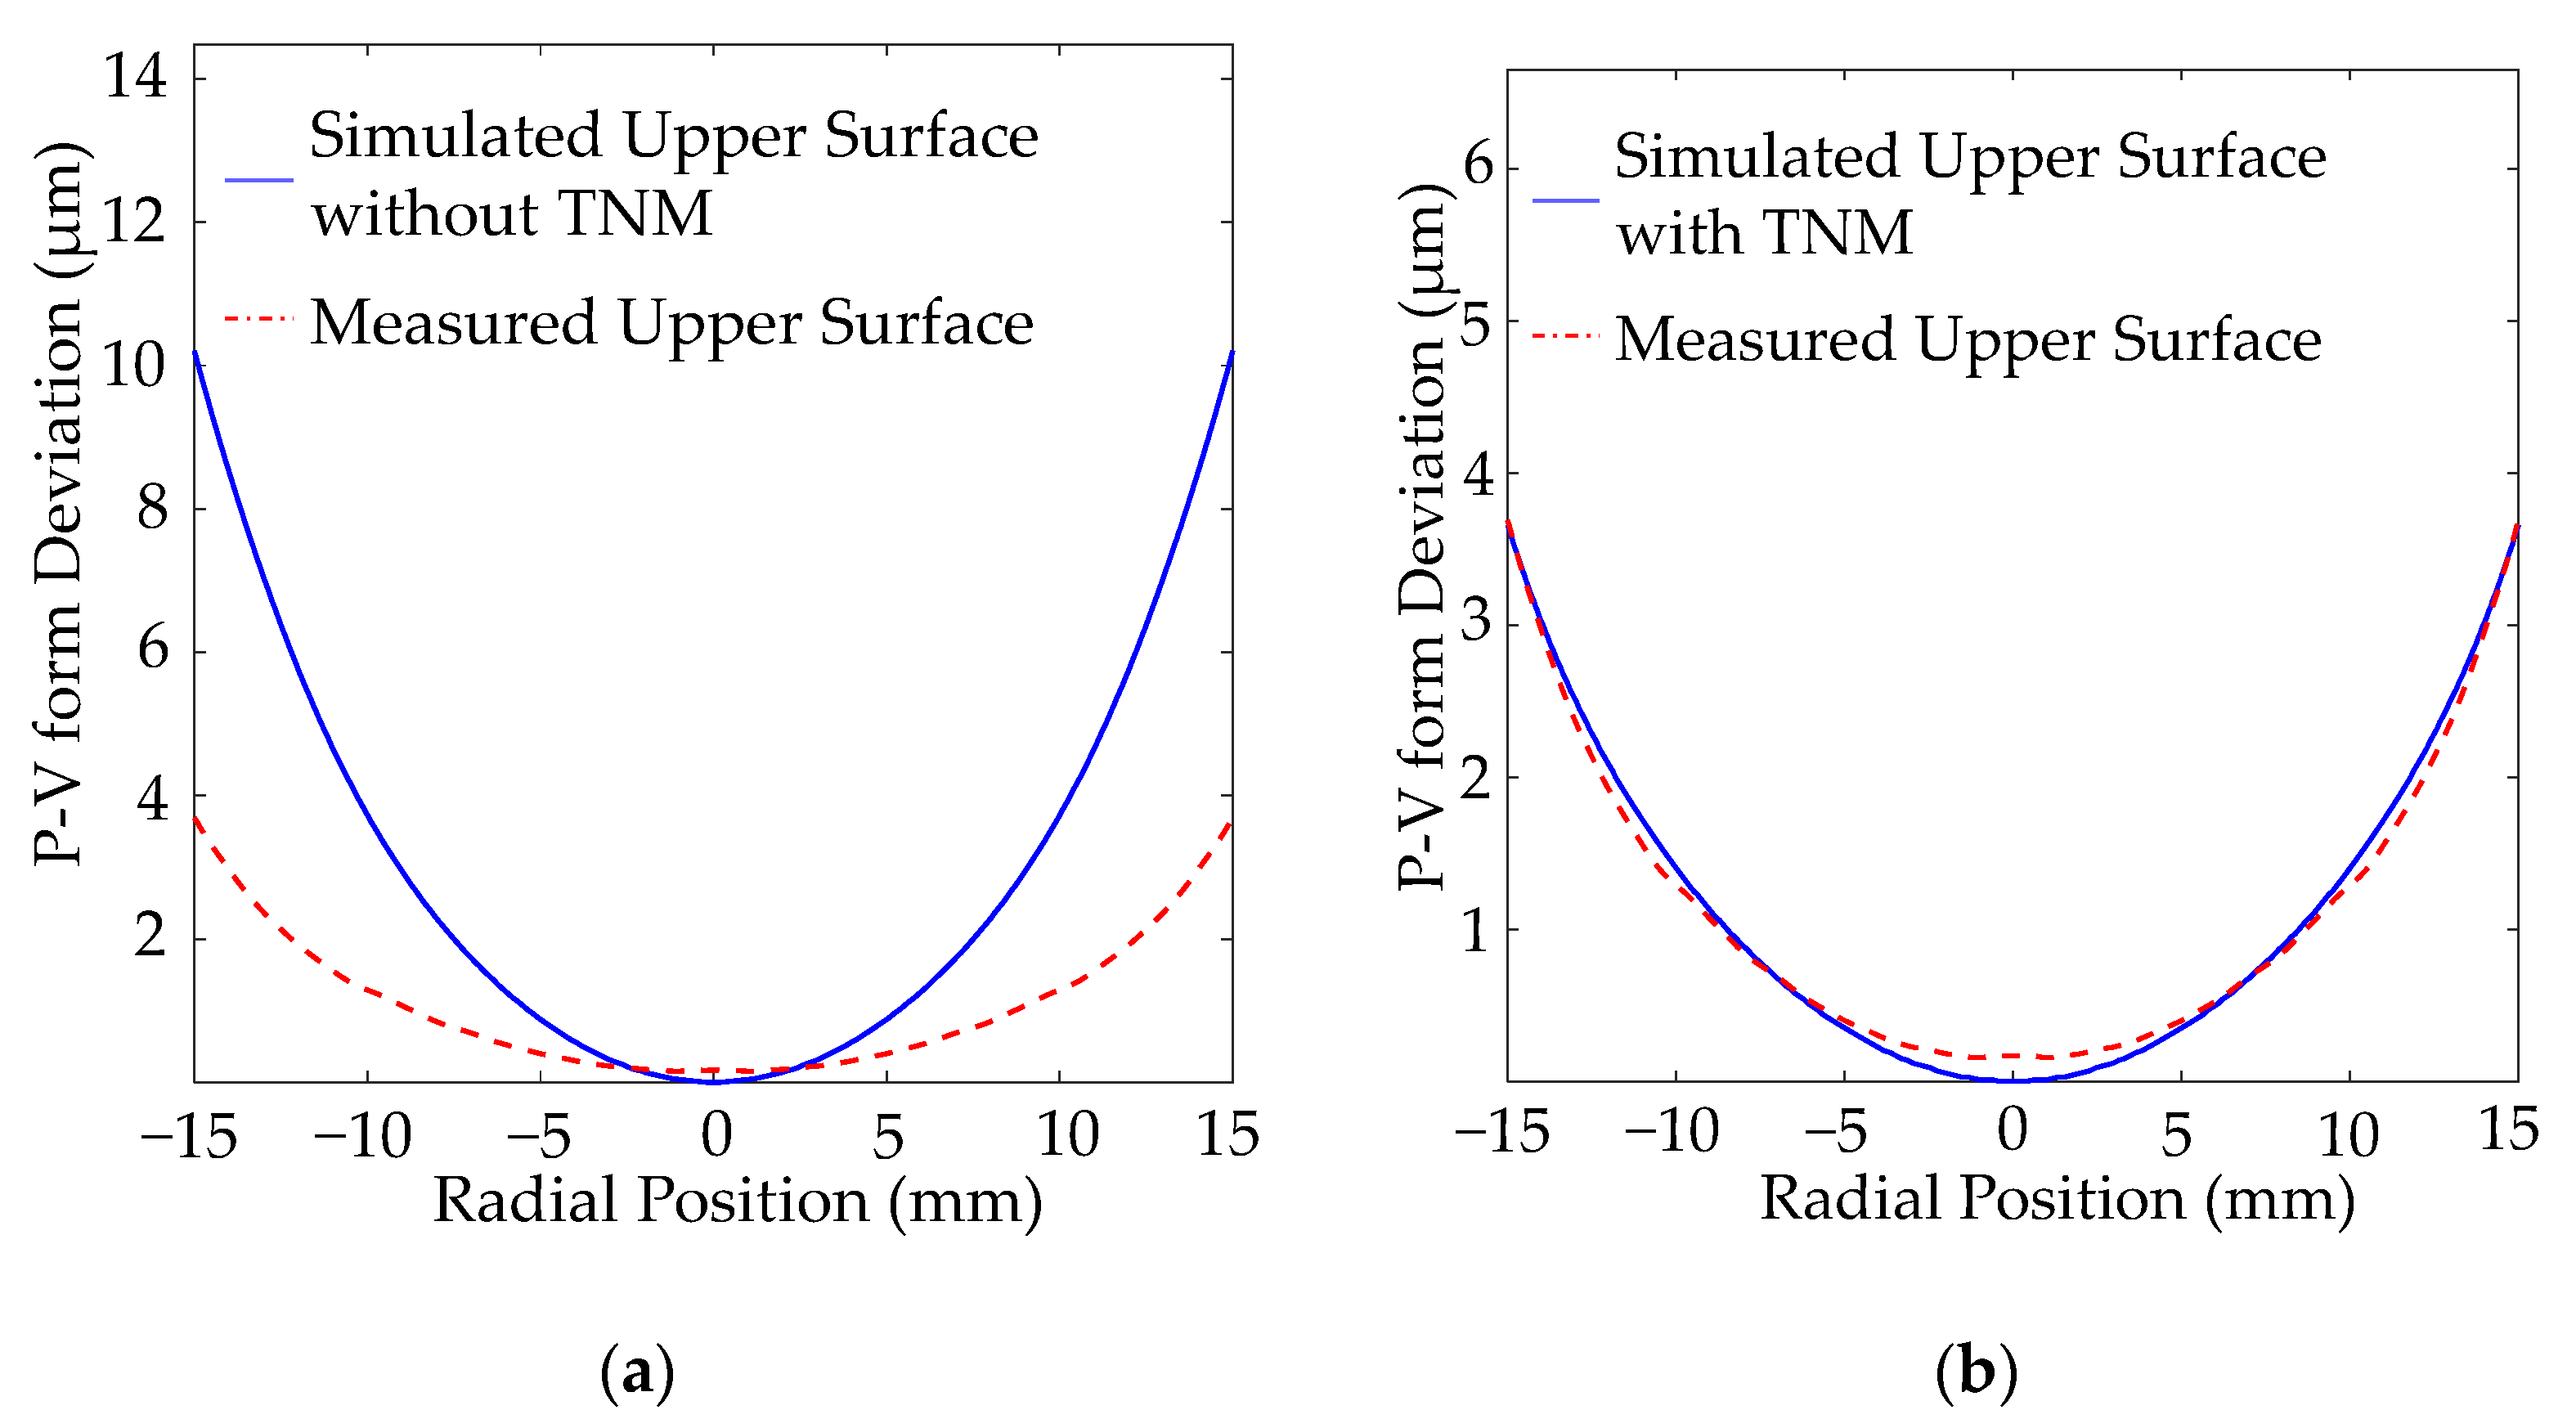
3.2.1. Validation of Surface Form
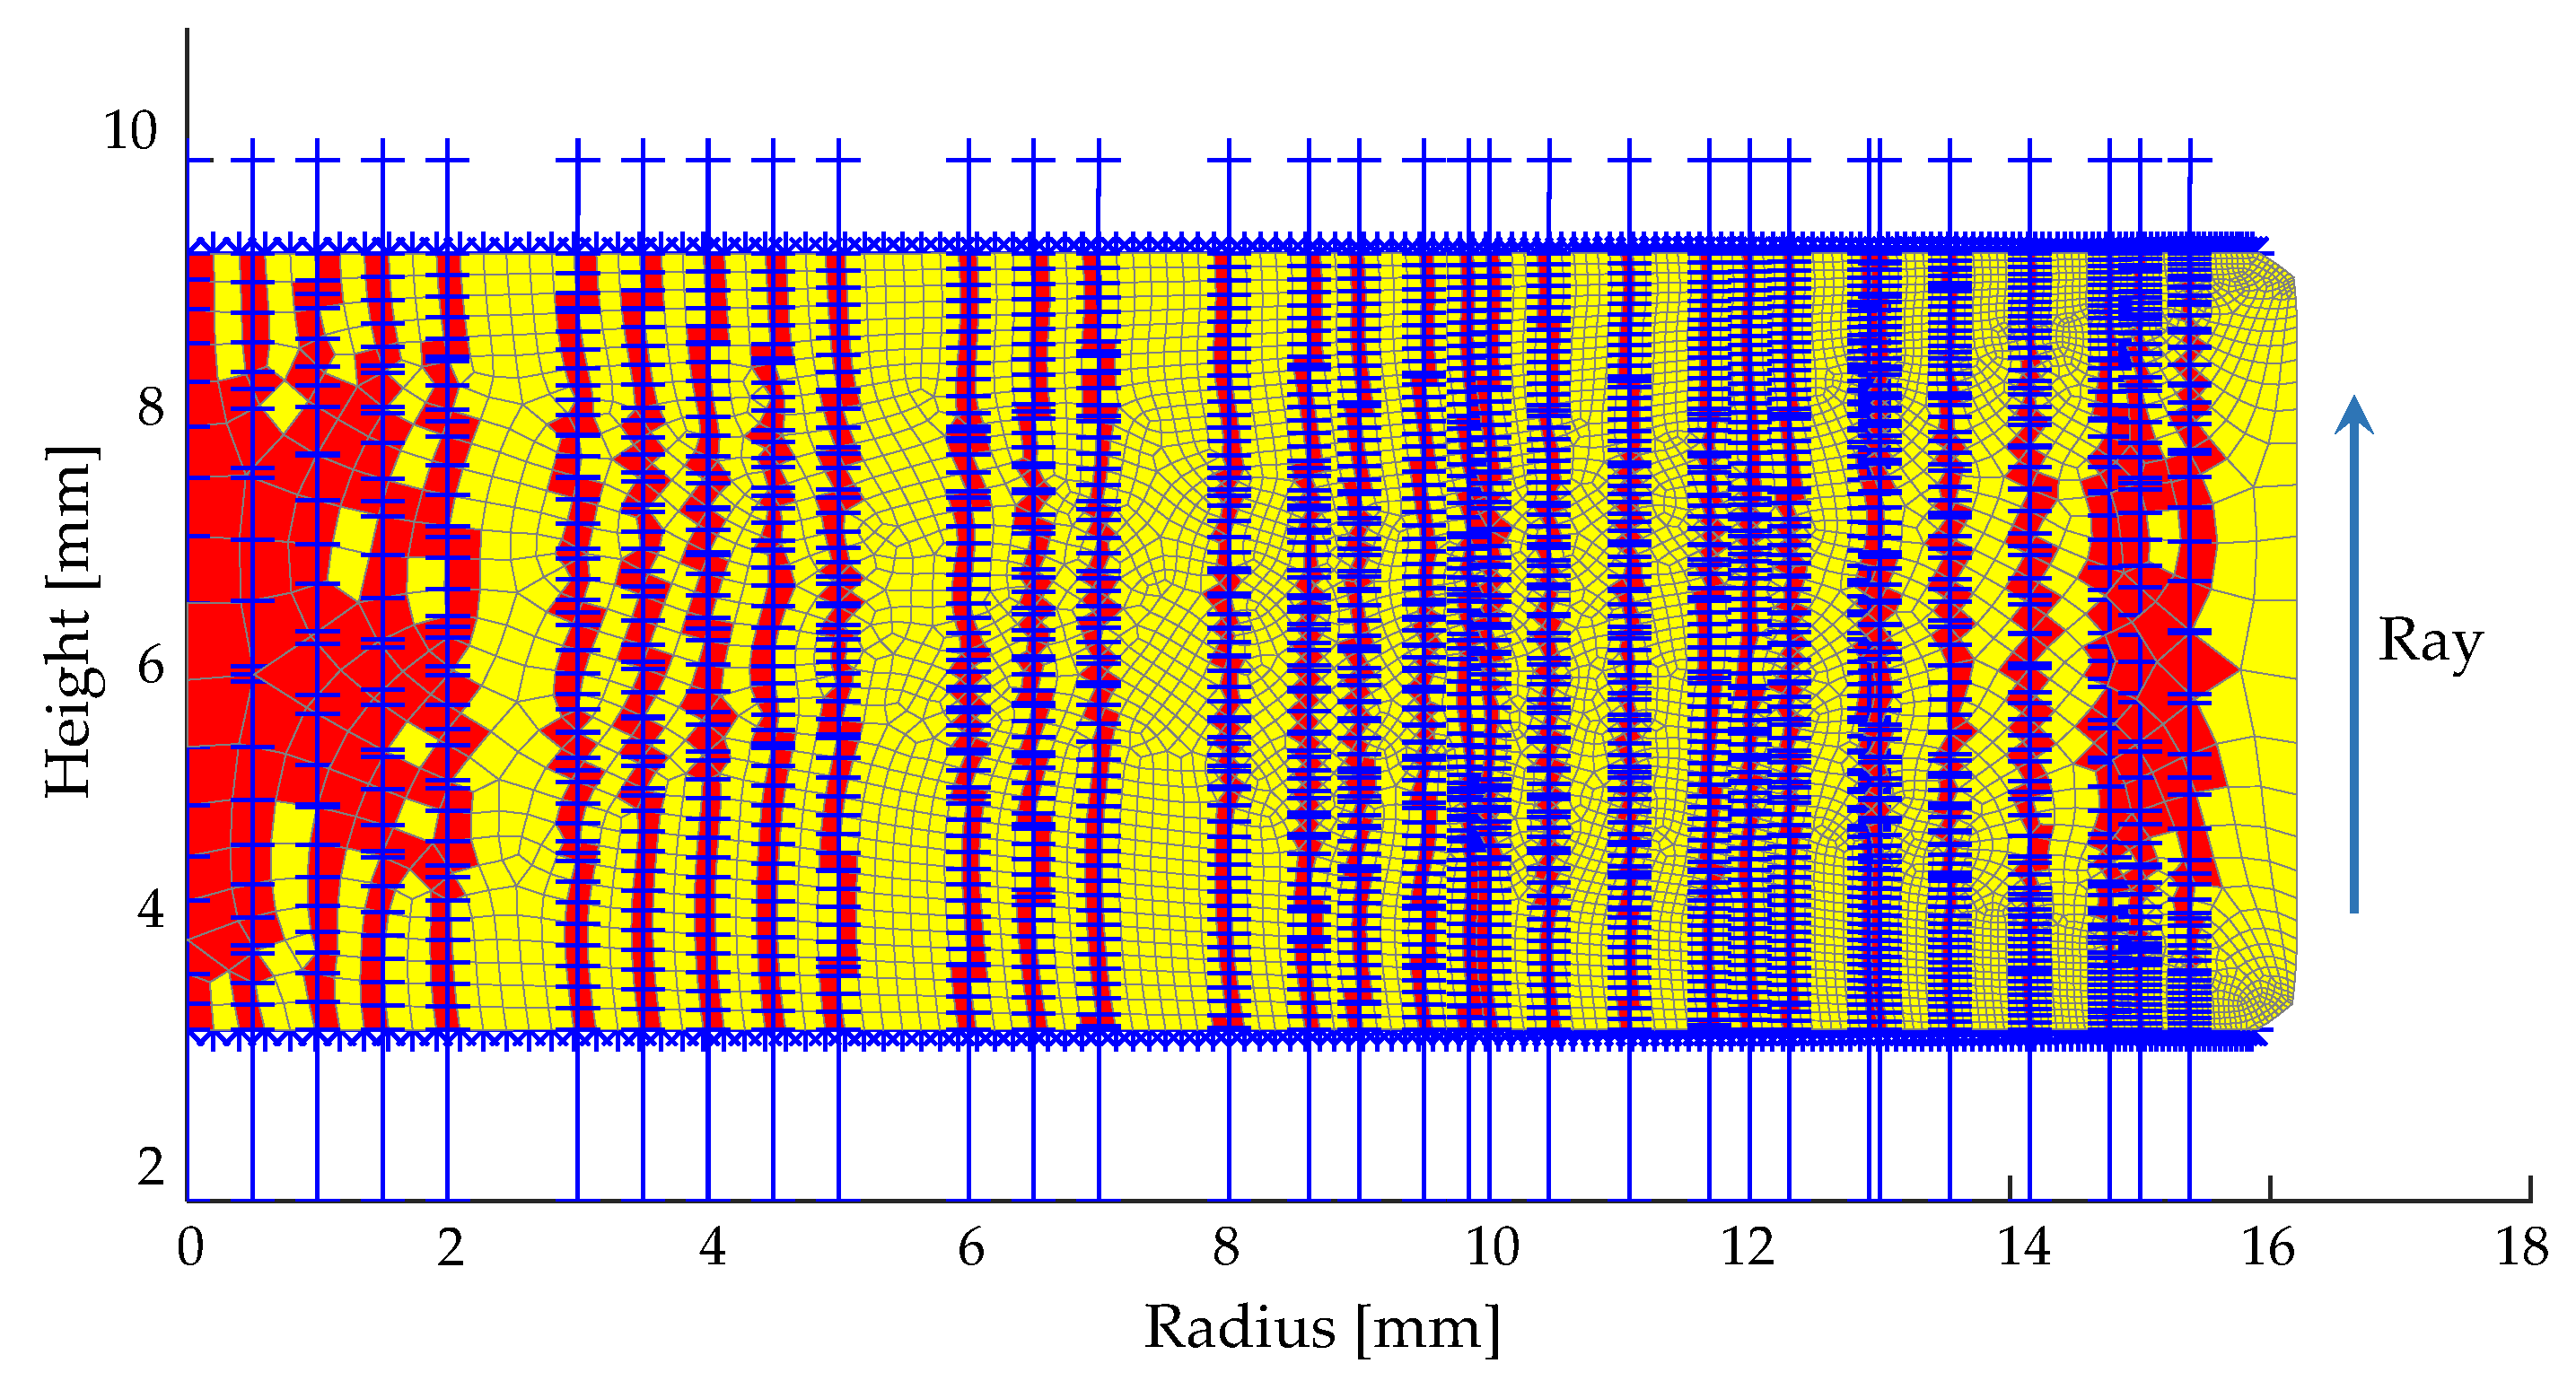
3.2.2. Simulation of Inhomogeneity
4. Conclusions
Author Contributions
Funding
Institutional Review Board Statement
Informed Consent Statement
Data Availability Statement
Conflicts of Interest
References
- Fischbach, K.D.; Georgiadis, K.; Wang, F.; Dambon, O.; Klocke, F.; Chen, Y.; Yi, A.Y. Investigation of the effects of process parameters on the glass-to-mold sticking force during precision glass molding. Surf. Coat. Technol. 2010, 205, 312–319. [Google Scholar] [CrossRef]
- Ananthasayanam, B.; Joseph, P.F.; Joshi, D.; Gaylord, S.; Petit, L.; Blouin, V.Y.; Richardson, K.C.; Cler, D.L.; Stairiker, M.; Tardiff, M. Final Shape of Precision Molded Optics: Part I—Computational Approach, Material Definitions and the Effect of Lens Shape. J. Therm. Stresses 2012, 35, 550–578. [Google Scholar] [CrossRef]
- Palanthandalam, S.; Kim, H.-N.; Tohme, Y. Predictive Molding of Precision Glass Optics. Opt. Soc. Am. Opt. Des. Fabr. 2008.
- Zhang, Y.; You, K.; Fang, F. Pre-Compensation of Mold in Precision Glass Molding Based on Mathematical Analysis. Micromachines 2020, 11, 1069. [Google Scholar] [CrossRef]
- Dambon, O.; Wang, F.; Klocke, F.; Pongs, G.; Bresseler, B.; Chen, Y.; Yi, A.Y. Efficient mold manufacturing for precision glass molding. J. Vac. Sci. Technol. B 2009, 27, 1445. [Google Scholar] [CrossRef]
- Zhao, W.; Chen, Y.; Shen, L.; Yi, A.Y. Investigation of the refractive index distribution in precision compression glass molding by use of 3D tomography. Meas. Sci. Technol. 2009, 20, 55109. [Google Scholar] [CrossRef]
- Su, L.; Wang, F.; He, P.; Dambon, O.; Klocke, F.; Yi, A.Y. An integrated solution for mold shape modification in precision glass molding to compensate refractive index change and geometric deviation. Opt. Lasers Eng. 2014, 53, 98–103. [Google Scholar] [CrossRef]
- Yi, A.Y.; Jain, A. Compression Molding of Aspherical Glass Lenses-A Combined Experimental and Numerical Analysis. J. Am. Ceram. Soc. 2005, 88, 579–586. [Google Scholar] [CrossRef]
- Jain, A.; Yi, A.Y. Finite Element Modeling of Structural Relaxation During Annealing of a Precision-Molded Glass Lens. J. Manuf. Sci. Eng. 2006, 128, 683–690. [Google Scholar] [CrossRef]
- Zhou, T.; Zhu, Z.; Liu, X.; Liang, Z.; Wang, X. A Review of the Precision Glass Molding of Chalcogenide Glass (ChG) for Infrared Optics. Micromachines 2018, 9, 337. [Google Scholar] [CrossRef]
- Zhang, X.H.; Guimond, Y.; Bellec, Y. Production of complex chalcogenide glass optics by molding for thermal imaging. J. Non-Cryst. Solids 2003, 326, 519–523. [Google Scholar] [CrossRef]
- Zhang, X.; Ma, H.; Lucas, J. Applications of Chalcogenide Glass Bulks and Fibres. J. Optoelectron. Adv. Mater. 2003, 5. [Google Scholar]
- Zhang, X.-H.; Adam, J.-L.; Bureau, B. Chalcogenide Glasses. In Springer Handbook of Glass; Musgraves, J.D., Hu, J., Calvez, L., Eds.; Springer International Publishing: Cham, Switzerland, 2019; pp. 525–552. ISBN 978-3-319-93726-7. [Google Scholar]
- Schott. Schott IRG 26 Infrared Chalcogenide Glass. Available online: https://www.schott.com/shop/advanced-optics/en/IRG-26/c/glass-IRG26 (accessed on 28 September 2022).
- Bernhardt, F.; Georgiadis, K.; Dambon, O.; Klocke, F. Novel testing facility for investigating wear on PGM sample tools. In Optifab 2013. SPIE Optifab, Rochester, New York, USA, Monday 14 October 2013; Bentley, J.L., Pfaff, M., Eds.; SPIE: New York, NY, USA, 2013; p. 88841V. [Google Scholar]
- Donth, E.-J. The Glass Transition: Relaxation Dynamics in Liquids and Disordered Materials; Springer: Berlin/Heidelberg, Germany, 2001; ISBN 978-3-662-04365-3. [Google Scholar]
- Tool, A.Q. Relation between inelastic deformability and thermal expansion of glass in its annealing range*. J. Am. Ceram. Soc. 1946, 29, 240–253. [Google Scholar] [CrossRef]
- Narayanaswamy, O.S. A Model of Structural Relaxation in Glass. J. Am. Ceram. Soc. 1971, 54, 491–498. [Google Scholar] [CrossRef]
- Moynihan, C.T.; Macedo, P.B.; Montrose, C.J.; Gupta, P.K.; DeBolt, M.A.; Dill, J.F.; Dom, B.E.; Drake, P.W.; Easteal, A.J.; Elterman, P.B.; et al. Structural relaxation in vitreous materials. Ann. N Y Acad. Sci. 1976, 279, 15–35. [Google Scholar] [CrossRef]
- Scherer, G.W. Use of the Adam-Gibbs Equation in the Analysis of Structural Relaxation. J. Am. Ceram. Soc. 1984, 67, 504–511. [Google Scholar] [CrossRef]
- Malek, J. Rate-determining factors for structural relaxation in non-crystalline materials I. Stabilization period of isothermal volume relaxation. Thermochim. Acta 1998, 313, 181–190. [Google Scholar] [CrossRef]
- Hollstegge, D. Process-Induced Changes in Optical Properties of Precision Molded Glass Lenses. Ph.D. Thesis, Rheinisch-Westfälische Technische Hochschule Aachen, Apprimus Verlag, Aachen, Germany, 2016. [Google Scholar]
- Markovsky, A.; Soules, T.F.; Boyd, D.C. An Efficient and Stable Algorithm for Calculating Fictive Temperatures. J. Am. Ceram. Soc. 1984, 67, c56–c57. [Google Scholar] [CrossRef]
- Gottsmann, J.; Dingwell, D.B.; Gennaro, C. Thermal expansion of silicate liquids: Direct determination using container-based dilatometry. Am. Mineral. 1999, 84, 1176–1180. [Google Scholar] [CrossRef]
- Yu, H.; Adams, R.D.; da Silva, L.F. Development of a dilatometer and measurement of the shrinkage behaviour of adhesives during cure. Int. J. Adhes. Adhes. 2013, 47, 26–34. [Google Scholar] [CrossRef]
- Scherer, G.W. Relaxation in Glass and Composites; Wiley: New York, NY, USA, 1986; ISBN 9780471819912. [Google Scholar]
- ASTM C1161-02c; Standard Test Method for Flexural Strength of Advanced Ceramics at Ambient Temperature. ASTM Committee: West Conshohocken, PA, USA, 2002.
- Quinn, G.D. NIST Recommended Practice Guide: Fractography of Ceramics and Glasses; NIST: Gaithersburg, MD, USA, 2020.
- Williams, M.L.; Landel, R.F.; Ferry, J.D. The Temperature Dependence of Relaxation Mechanisms in Amorphous Polymers and Other Glass-forming Liquids. J. Am. Chem. Soc. 1955, 77, 3701–3707. [Google Scholar] [CrossRef]
- Su, L.; Yi, A.Y. Investigation of the effect of coefficient of thermal expansion on prediction of refractive index of thermally formed glass lenses using FEM simulation. J. Non-Cryst. Solids 2011, 357, 3006–3012. [Google Scholar] [CrossRef]
- Koontz, E. Characterization of Structural Relaxation in Inorganic Glasses using Length Dilatometry. All Dissertations 2015, 1485. [Google Scholar]


| Refractive Index (at 3 µm) | 2.8015 |
|---|---|
| Abbe Number (at 3–5 µm) | 167 |
| Glass Transition Temperature | 185 °C |
| Density | 4630 kg/m3 |
| Young´s Modulus | 18.3 GPa |
| Coefficient of Thermal Expansion (20–100 °C) | 20.7 × 10⁻⁶/K |
| Thermal Conductivity | 0.24 W/(m·K) |
| Prony Series of Structure Relaxation | Parameter | Fitted Value | Parameter | Fitted Value |
| g1 | 0.0118 | τ1 | 36.75 | |
| g2 | 0.0328 | τ2 | 100.0 | |
| g3 | 0.2542 | τ3 | 332.4 | |
| g4 | 0.1585 | τ4 | 754.8 | |
| g5 | 0.5427 | τ5 | 1556 | |
| Shift Function | Parameter | Fitted Value | ||
| x | 0.68 | |||
| ∆H/R | 38,392 | |||
| Prony Series of Stress Relaxation | Parameter | Fitted Value | Parameter | Fitted Value |
| G1 | 0.0719 | τ1 | 0.0946 | |
| G2 | 0.4040 | τ2 | 0.7367 | |
| G3 | 0.4244 | τ3 | 4.7185 | |
| G4 | 0.0997 | τ4 | 29.959 | |
| WLF Shift Function Parameters for TRS | Parameter | Fitted Value | ||
| C1 | 32.67 | |||
| C2 | 451 | |||
| Tr | 178 | |||
Publisher’s Note: MDPI stays neutral with regard to jurisdictional claims in published maps and institutional affiliations. |
© 2022 by the authors. Licensee MDPI, Basel, Switzerland. This article is an open access article distributed under the terms and conditions of the Creative Commons Attribution (CC BY) license (https://creativecommons.org/licenses/by/4.0/).
Share and Cite
Jiang, C.; Tovar, C.M.; Staasmeyer, J.-H.; Friedrichs, M.; Grunwald, T.; Bergs, T. Simulation of the Refractive Index Variation and Validation of the Form Deviation in Precisely Molded Chalcogenide Glass Lenses (IRG 26) Considering the Stress and Structure Relaxation. Materials 2022, 15, 6756. https://doi.org/10.3390/ma15196756
Jiang C, Tovar CM, Staasmeyer J-H, Friedrichs M, Grunwald T, Bergs T. Simulation of the Refractive Index Variation and Validation of the Form Deviation in Precisely Molded Chalcogenide Glass Lenses (IRG 26) Considering the Stress and Structure Relaxation. Materials. 2022; 15(19):6756. https://doi.org/10.3390/ma15196756
Chicago/Turabian StyleJiang, Cheng, Carlos Marin Tovar, Jan-Helge Staasmeyer, Marcel Friedrichs, Tim Grunwald, and Thomas Bergs. 2022. "Simulation of the Refractive Index Variation and Validation of the Form Deviation in Precisely Molded Chalcogenide Glass Lenses (IRG 26) Considering the Stress and Structure Relaxation" Materials 15, no. 19: 6756. https://doi.org/10.3390/ma15196756