
Thermoelectric Properties of Co-Substituted Al–Pd–Re Icosahedral Quasicrystals


National Institute for Materials Science (NIMS), 1-2-1 Sengen, Tsukuba 305-0047, Japan
Materials 2022, 15(19), 6816; https://doi.org/10.3390/ma15196816
Submission received: 9 September 2022
/
Revised: 25 September 2022
/
Accepted: 28 September 2022
/
Published: 30 September 2022
(This article belongs to the Special Issue Future Trends in Thermoelectric Performance and Applications of Materials)
Abstract
:The practical application of quasicrystals (QCs) as thermoelectric materials makes icosahedral (i-) Al–Pd–Re QC attractive because of its moderate electrical conductivity (~280 Ω−1 cm−1), relatively high Seebeck coefficient (~100 μV K−1), and low thermal conductivity (~1.3 W m−1 K−1) at room temperature. To develop a thermoelectric Π-shaped power generation module, we need both p- and n-type thermoelectric materials. In this work, we aimed to develop an n-type i-Al–Pd–Re-based QC and investigated the effect of Co substitution for Re on the thermoelectric properties, i.e., the electron-doping effect. We synthesized dense bulk samples with nominal compositions of Al71Pd20(Re1−xCox)9 (x = 0, 0.1, 0.2, 0.3, 0.4, 0.5) via arc-melting, annealing, and sintering methods. We found that Co can produce n-type carriers in dilute substitution amounts of x = 0.1 and 0.2; however, the Seebeck coefficient at 300 K showed an n- to p-type transition with increasing x. This indicates that a simple rigid-band approximation is not applicable for i-Al–Pd–Re QC, which makes it difficult to synthesize an n-type i-Al–Pd–Re-based QC. Although the thermal conductivity was reduced from 1.28 (x = 0) to 1.08 W m−1 K−1 (x = 0.3) at 373 K by lowering of the electron thermal conductivity (electrical conductivity) and the alloying effect via Co substitution, the dimensionless figure of merit was not enhanced because of lowering of the power factor for all samples. The elastic moduli of i-Al–Pd–Re QC decreased by Co substitution, indicating that i-Al–Pd–Re-Co QC had a more ionic and brittle character.
1. Introduction
From the viewpoint of highly efficient energy use, the importance of thermoelectric conversion technology that directly converts thermal energy into electrical energy is increasing. There are many reports on research and development related to various high-performance thermoelectric materials [1] and modularization technology [2]. The dimensionless figure of merit (zT) is an evaluation index for a thermoelectric material, expressed as:
where S, σ, κtotal, and T are the Seebeck coefficient, electrical conductivity, total thermal conductivity, and temperature, respectively [3,4]. Here, κtotal is the sum of two contributions: the electron contribution, κelectron, and the phonon contribution, κphonon, i.e.,
κelectron is proportional to σ through the Wiedemann–Franz law:
where L0 is the Lorenz number. Thus, both optimizing S and σ and lowering κphonon are necessary to enhance the zT value. Relevant materials designs, such as band engineering and valleytronics [5], can improve the power factor (S2σ), and nano-structuring [6] and phonon engineering [2] can be employed to reduce κphonon.
In recent years, the application of thermoelectric materials as autonomous power supplies to drive Internet-of-Things (IoT) devices [7] has become possible [8,9]. The usable temperature range is below 200 °C, as derived from environmental heat sources and low-temperature waste heat, and it is crucial to ensure a temperature difference when using thermoelectric power generation modules. For this purpose, the κtotal of a material-forming thermoelectric module should be low, i.e., less than a few W m−1 K−1 at operating temperature. In contrast, a high output voltage is required when driving IoT devices with a DC–DC converter; thus, a high S is required for the material.
Icosahedral quasicrystals (i-QCs) exhibit interesting electrical and thermal transport properties [10], and their applications [11] vary in structural materials [12], thermal rectifiers [13], and thermoelectric materials [14]. Regarding thermoelectric applications, i-Al–Pd–Re QC has been widely investigated from experimental [14] and theoretical [15] points of view. The i-Al–Pd–Re QC exhibits promising thermoelectric properties because of its moderate σ (~280 Ω−1 cm−1), relatively high S (~100 μV K−1), and low κtotal (~1.3 W m−1 K−1) at room temperature [16], which are brought about by pseudo-gap formation at the Fermi energy (EF) [17] and their complex crystal structures with icosahedral symmetry [18]. Recently, we obtained a relatively large zTmax value of 0.26 at 573 K for the Fe-substituted Al–Pd–Re system [16]: 2/1-Al–Pd–Re–Fe approximant crystal showed the highest S2σ of ~900 μW m−1 K−2 at 573 K. To date, we have succeeded in improving the thermoelectric performance of only p-type materials based on i-Al–Pd–Re QC [14,16] and isostructural i-Al–Pd–Mn QC [19,20].
To develop a robust thermoelectric Π-shaped power generation module, we need both p- and n-type thermoelectric materials with good mechanical properties. In this work, we aimed to develop an n-type i-Al–Pd–Re-based QC. We selected Co as an electron dopant because Co has a larger number of valence electrons than Re. Regarding the Al–Pd–Co ternary system, there is one report on the thermoelectric properties of 1/1-cubic approximant crystal [21]. This paper reports the effect of Co substitution for Re in i-Al–Pd–Re QC on the thermoelectric and mechanical properties.
2. Methods and Materials
Mother ingots of nominal compositions of Al71Pd20(Re1−xCox)9 (x = 0, 0.1, 0.2, 0.3, 0.4, 0.5) were synthesized by an arc-melting technique under a purified argon atmosphere (NEV-AD03TC; Nisshin Giken Co., Japan) using the starting materials Al (powder, 99.99%), Pd (powder, 99.9%), Re (powder, 99.9%), and Co (powder, >99%). The obtained bulk samples were annealed at 1223 K for 24 h under a purified argon atmosphere to prevent oxidization (MILA-5000; Advance Riko, Inc., Yokohama, Japan). The annealed samples were hand-milled in ethanol using an agate mortar and pestle. The hand-milled powder samples were sieved using a stainless-steel sieve of 45 μm mesh and then placed in a carbon die with an inner diameter of 10 mm for spark plasma sintering (SPS) (LABOX-110MC; SinterLand, Inc., Nagaoka, Japan) under a purified argon atmosphere. The applied pressure was set to 115 MPa during the sintering process to synthesize dense bulk samples. This value is twice as high as a condition that previously achieved a high relative density above 90% for i-Al–Pd–Re QC [22]. To obtain dense bulk samples, we performed 10 min at a sintering temperature (TS) of 1223–1233 K, at which the degree of shrinkage was saturated. Table 1 lists TS and bulk densities (dbulk) obtained from the Archimedes method for Al71Pd20(Re1−xCox)9 (x = 0, 0.1, 0.2, 0.3, 0.4, 0.5). Here, the data for the sample with x = 0 are quoted from a reported paper [16].
Phase characterization of the samples was evaluated by X-ray diffraction (XRD) with Cu Kα radiation (Mini-Flex 600; Rigaku, Inc., Akishima, Japan) and a scanning thermal probe micro-imaging apparatus (STPM-1000; Advance-Riko, Inc., Yokohama, Japan). The σ and S values were measured between 300 and 873 K by the four-probe and steady-state temperature gradient methods, respectively (ZEM-3; Advance Riko, Inc., Yokohama, Japan). The κtotal value was calculated from dbulk, the specific heat at constant pressure (CP), and thermal diffusivity (λ) using the relationship κtotal = dbulk∙CP∙λ. CP was measured using differential scanning calorimetry (DSC404-F3; NETZSCH Japan, Yokohama, Japan) and λ was measured by a light flash apparatus (LFA467-HT; NETZSCH Japan, Yokohama, Japan) from 373 to 873 K. The longitudinal (vlong) and transverse (vtrans) speeds of sound were measured by the ultrasonic pulse-echo method (Echometer 1062; Nihon Matech Corp., Tokyo, Japan). For rough estimations of the elastic moduli (Poisson’s ratio (ν), Young’s modulus (E), shear modulus (G), and bulk modulus (B)) for these QC samples, the following relations for isotropic materials were used for the calculations [23,24,25]:
3. Results and Discussion
The relative density of the sample with x = 0 was 95.7% [16], indicating that a dense bulk sample was fabricated by the SPS process. The ideal densities of the Co-substituted samples were calculated from dbulk (relative density: ~100%, 6.30 g cm–3) of the sample with x = 0 [22] and the rate of change in average atomic weight (Table 1). As a result, it was found that the dense bulk samples with relative densities of >95% were fabricated for Co-substituted samples. The overall trend of dbulk decreased with increasing Co concentration x, which can be understood as decreasing the average mass by substitution of the lighter element Co for Re.
We confirmed that all synthesized bulk samples were identified as an F-type quasi-crystalline phase [26], as shown in Figure 1A. In the Al–Pd–Re–Co system, the formation of 2/1- or 1/1-approximant crystal was not realized, unlike in Al–Pd–Re–Ru [27] and Al–Pd–Re–Fe [16] quaternary systems. We observed peak shifting to a higher degree with increasing x, indicating that the quasi-lattice constant (aR) decreased by Co substitution for Re (Figure 1B). This trend can be qualitatively explained by substitution of the smaller atomic radii of Co (0.125 nm) for Re (0.138 nm). However, we observed that the sample with x = 0.3 had a slight increase in aR, which may be brought about by a composition deviation, as discussed below.
The morphology of the dense bulk samples synthesized by the SPS process did not change with varying x. To assess the sample’s quality, the mapping measurements of S at 300 K, which is sensitive to local composition, were performed (Figure 2). As a result, homogeneous microstructures were obtained, except for the sample with x = 0.3, and there was no secondary precipitation. These results agree with the XRD measurements. The sample with x = 0.3 had a composite microstructure consisting of p- and n-type compositions with small absolute values of S. When x increased, the carrier type changed from p- to n-type, then turned to p-type again. However, its magnitude of S for an n-type material is relatively low (−10 μV K−1) for the sample with x = 0.2.
Figure 3a–c show the temperature dependence of σ, S, and S2σ from 300 to 873 K for the Al71Pd20(Re1−xCox)9 (x = 0 [16], 0.1, 0.2, 0.3, 0.4, 0.5) samples. All samples had a similar positive temperature coefficient of σ (semiconducting behavior), with a varying magnitude of 100–280 Ω−1 cm−1 at 300 K. The calculated activation energy from the Arrhenius plot was 0.11 eV for the sample with x = 0 and increased to 0.15 eV with Co substitution. Compared with transition metal-substituted i-Al–Pd–Re QCs, these values are comparable with those of i-Al–Pd–Re–Ru QC (0.05–0.12 eV) [28] and i-Al–Pd–Re–Fe QC (0.14–0.17 eV) [16]. Since S at 300 K decreased owing to Co substitution for Re, the decrease in carrier concentration was not the cause of the decrease in σ, i.e., lowering of the relaxation time owing to chemical disordering of Co at Fe sites. The absolute value of S for p-type materials (except for samples with x = 0.2 and 0.3) decreased with the increasing temperature, which is attributed to an increase in minority carriers. This is consistent with the temperature dependence of σ. The S2σ value showed a similar temperature dependence, with a peak at mid-temperatures of 600–700 K for all samples, and exhibited a maximum value of ~380 μW m−1 K−2 at 573 K for the unsubstituted sample, i.e., S2σ was not improved by Co substitution for Re because of the reduction of S and σ.
The highest value of σ at 300 K was measured for the i-Al71Pd20Re9 QC (~280 Ω−1 cm−1) [16]: σ decreased up to x = 0.4 and then increased for the sample with x = 0.5. This non-monotonic change in σ with varying x cannot be understood only in terms of the change in carrier concentration from the S measurement. Initially, we expected Co to be an n-type dopant and tried to replace it with Re. As expected, the S value of the sample with x = 0.2 showed n-type values (−10 μV K−1 at 300 K), but this changed to p-type with increasing x and its absolute value improved to 100 μV K−1 at 300 K for the sample with x = 0.5, which is close to that of the undoped sample (x = 0) [16]. These changes of σ and S suggest that a simple rigid-band approximation is not applicable to this system. As a result, we did not succeed in fabricating the desired n-type material with a high S.
The Co-substitution concentration dependence of σ and S is a rather complicated change and differs from those reported in previous studies on Ru [27] and Fe [28] substitution. Mizutani et al. reported an electron per atom ratio (e/a) for elements in the Periodic Table [29]: e/a = 1.31 for Re and e/a = 1.11 for Co. Using these e/a values of the constituent elements, the e/a value of i-Al–Pd–Re–Co QCs decreases with increasing Co concentration and, thus, EF shifts to a lower energy, which seems to be an opposite way to obtain an n-type material. In contrast, in dilute substitution amounts of x = 0.1 and 0.2, Co appears to function as an n-type dopant. Hall coefficient measurements may clarify the underlying mechanism; however, the Hall voltage of i-Al–Pd–Re QC is too low to obtain reliable data at this stage.
The temperature dependences of CP, λ, and κtotal from 373 to 973 K for all samples are shown in Figure 4a–c. The CP values of the Al–Pd–Re–Co QCs were distributed between 0.39 and 0.41 J g−1 K−1 at 373 K and increased with the increasing temperature. The λ values at 373 K for all samples showed similar values of 0.40–0.42 mm2 s−1 and a temperature dependence. Table 2 lists κtotal at 373 K (κtotal,373K) for all samples investigated. The κtotal,373K value decreased from 1.28 (x = 0) to 1.08 W m−1 K−1 (x = 0.3), probably due to the large decrease in σ, as shown in Figure 3a. Regarding the estimation of κelectron, the well-known Wiedemann–Franz law is not suited for QCs because it assumes that the spectral conductivity varies linearly with energy [30]. Maciá has discussed the validity of the Wiedemann–Franz law for QCs [31]. There is no empirical relationship to calculate κelectron for QCs; thus, we adopted the conventional relationship shown in Equation (8) and L0 values using an empirical model (L0 = 1.5 + exp[−|S|/116] × 10−8 V2 K−2) by Kim et al. [32] for a rough estimation of κphonon:
The calculated κphonon as a function of temperature is shown in Figure 4d, and we list κphonon at 373 K (κphonon,373K) for all samples in Table 2, together with the minimum thermal conductivity at 373 K (κmin,373K) using the Cahill model [33,34], which provides the lower limit of κphonon for amorphous solids and disordered crystals. The κmin value can be calculated as follows:
Here, kB is the Boltzmann constant, n is the number density of atoms, and θlong,trans is the cut-off temperature, which is given by , where ℏ is Planck’s constant. It should be noted that the apparent increase in κphonon at high temperatures, including for the Co-substituted samples, originates from conduction carriers [30]. The κphonon,373K was suppressed to 0.94 W m−1 K−1 by Co substitution, which is attributed to decreasing the phonon relaxation time (τphonon):
where Cv and vs are the specific heat at constant volume and the effective speed of sound, respectively. Here, the CV [35] and vs can be expressed as:
where V and α are the atomic volume and the linear thermal expansion coefficient, respectively. Although we have no information on α for the present i-Al–Pd–Re–Co QCs, qualitative changes are discussed using CP.
Co-substitution for Re could reduce κphonon,373K from 1.05 (x = 0) to 0.94 (x = 0.3) W m−1 K−1, i.e., up to a 10% reduction. The CP and vs values did not change significantly between samples with x = 0 and 0.3 (less than ~2% for each) (Table 2), so τphonon is likely reduced because of the alloying effect. Here, we note that κphonon,373K of the sample with x = 0 is the same as the κmin,373K value, and the observed κmin,373K > κphonon,373K relationship is attributed to overestimation of L0 [36]. This trend was also observed in the Al–Pd–Re–Fe quaternary system [16].
The estimated elastic parameters of ν, E, G, and B for Al71Pd20(Re1−xCox)9 (x = 0, 0.1, 0.2, 0.3, 0.4, 0.5) are listed in Table 3. The general mechanical properties of QCs are hard and brittle, so the estimated elastic moduli are consistent with the general trend. There is no literature on the mechanical properties of i-Al–Pd–Re QC. In general, an arc-melted and annealed i-Al–Pd–Re sample has a porous microstructure of a relative density of <70% because i-Al–Pd–Re QC forms from the peritectic reaction of Al3Pd2 and Al11Re4, and thus is very fragile [22]. We speculate that such a porous sample makes it difficult to measure intrinsic mechanical properties. The sintered bulk samples of i-Al–Pd–Re(–Co) QCs were dense enough to measure their intrinsic mechanical properties. Indeed, we obtained a higher B value of over 150 GPa for the sample with x = 0, which is close to Fe-based thermoelectric materials of Fe3Al2Si3, β-FeSi2, and FeAl2 [37]. It was found that Co substitution for Re slightly reduced the elastic moduli of ν, E, G, and B. The ν value is related to the volume change in the uniaxial deformation. Classical elastic theory predicts ν to be −1 to 0.5. A larger ν value means that a material possesses better plasticity. The estimated ν values of 0.260–0.303 for i-Al–Pd–Re–Co QCs are between those of ionic materials, such as NaCl (ν = 0.253) and CsCl (ν = 0.266) [38], and metallic materials, such as Aluminum 6061-T6 (ν = 0.33) and Cu (ν = 0.355) [38]. This may indicate that Co substitution for Re gives i-Al–Pd–Re QC a more ionic and brittle character. Compared with other i-QCs, such as i-Al–Pd–Mn QC [39,40] and i-Al–Cu–Fe QC [39], i-Al–Pd–Re–Co QCs had higher ν and B values, but the G value was almost identical. Decreasing ν will be associated with increasing covalency between atoms because covalent materials such as diamond and cubic boron nitride have low ν values of 0.069 and 0.14–0.18, respectively [38].
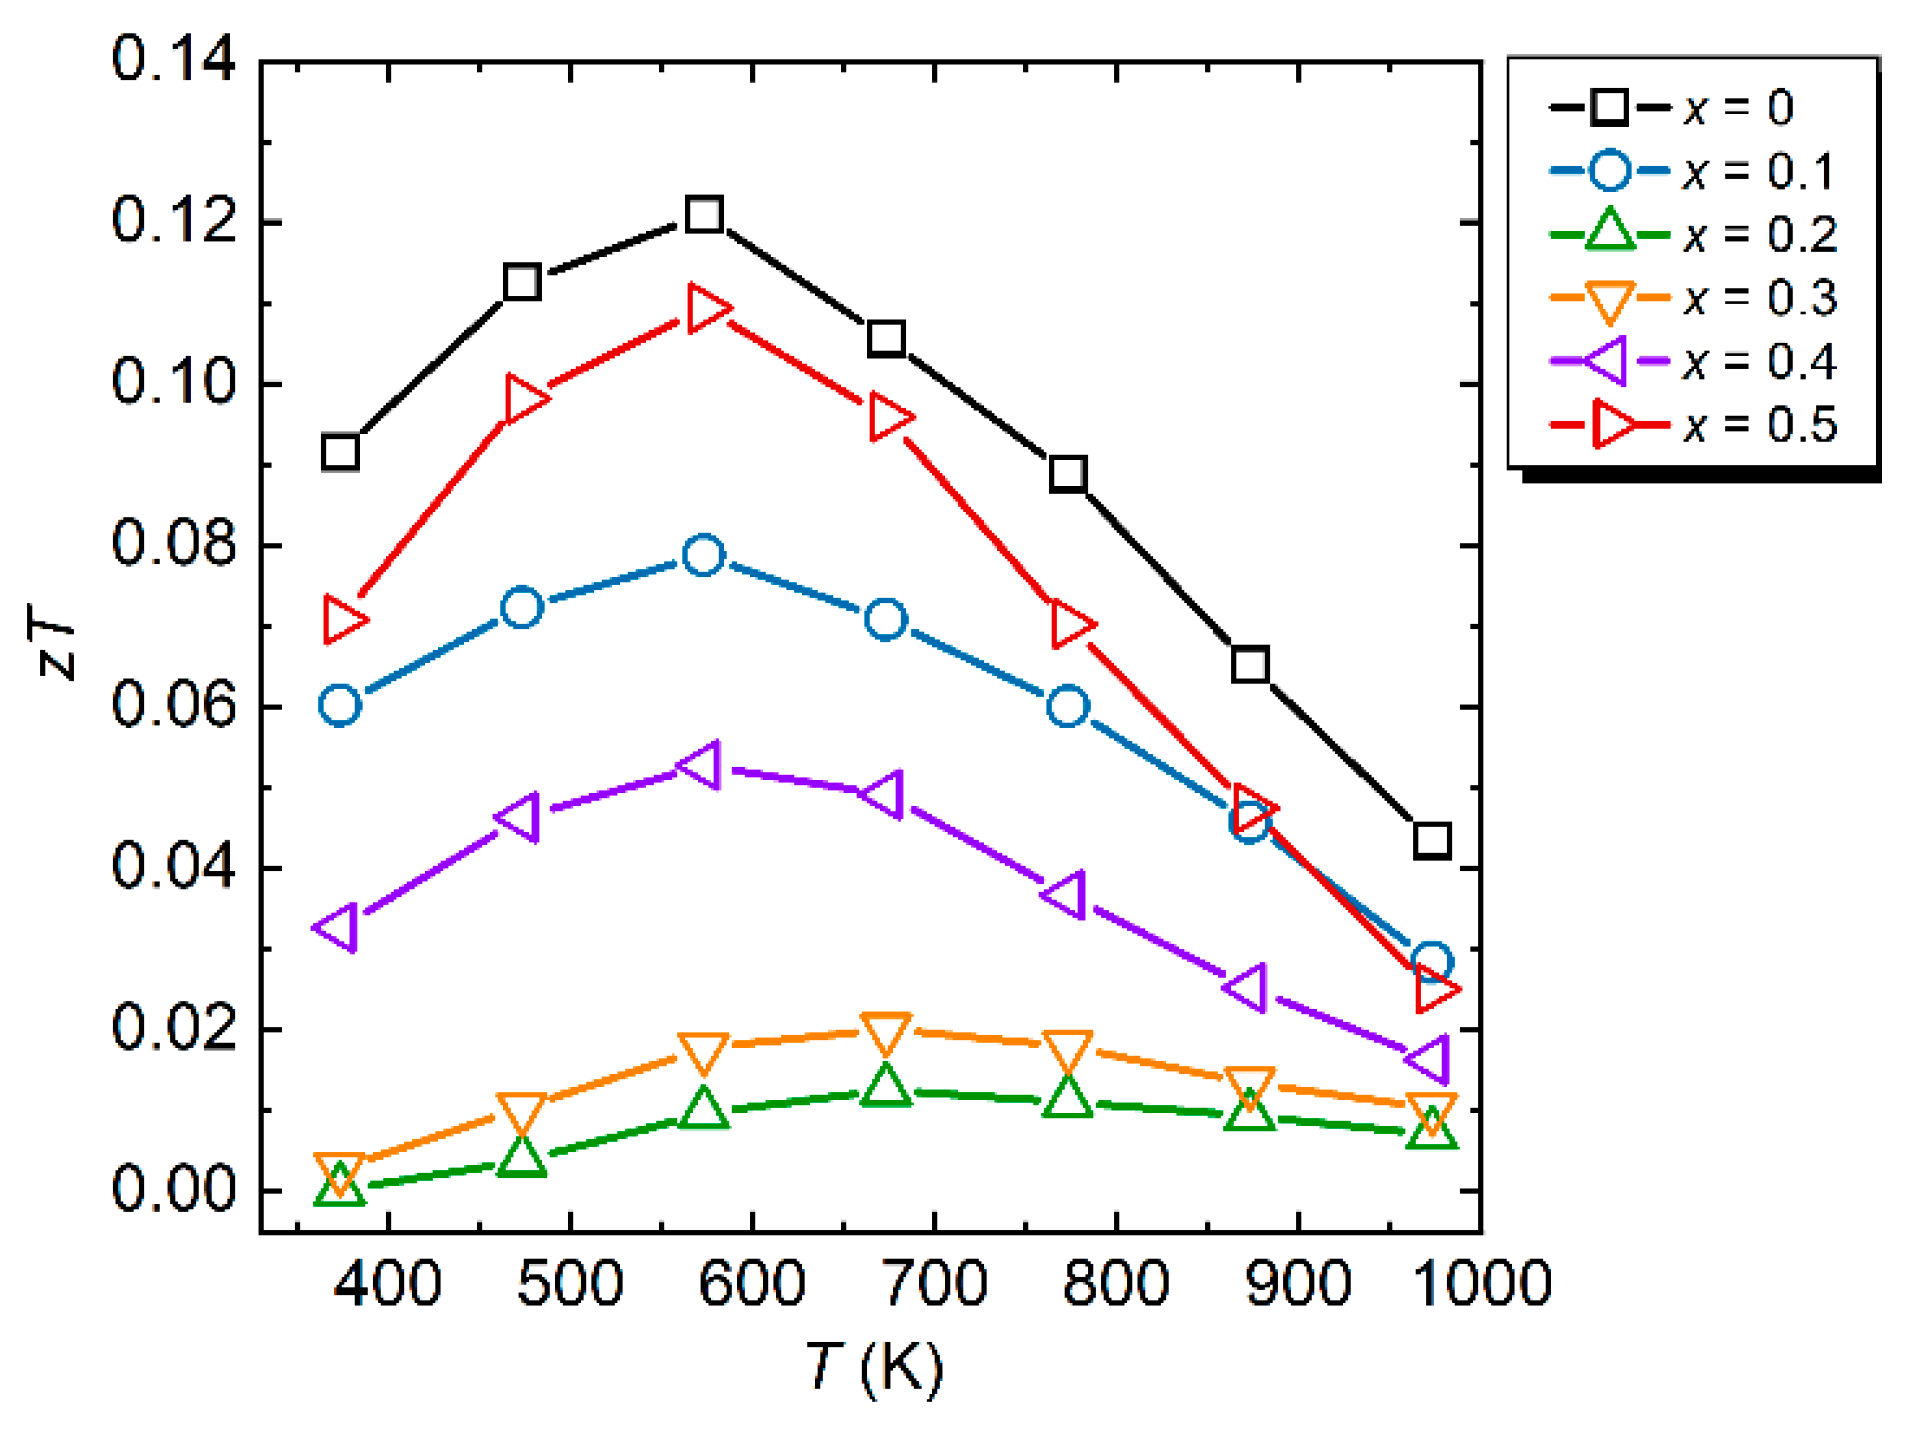
Finally, we briefly mention zT as a function of temperature, as shown in Figure 5. The maximum zT value (zTmax) was 0.12 at 573 K for the sample with x = 0. Although κtotal was reduced by the alloying effect via Co substitution for Re, zTmax was not enhanced because of the lowering of S2σ for all measured temperature ranges.
4. Conclusions
In this study, we systematically investigated the effect of Co substitution for Re for i-Al–Pd–Re QC on thermoelectric and mechanical properties. We found that the icosahedral quasi-crystalline phase can be synthesized by 50% replacement of Co for Re. Although κtotal was reduced by the alloying effect via Co substitution for Re, zTmax was not enhanced because of the lowering of S2σ for all measured temperature ranges. Co could produce n-type carriers in dilute substitution amounts of x = 0.1 and 0.2; however, S at 300 K showed an n- to p-type transition with increasing x. The observed effects of Co concentration on σ and S showed a complicated change, suggesting that a simple rigid-band approximation is not applicable to i-Al–Pd–Re QC. To develop a robust thermoelectric power generation module using Al-based QCs, we need to synthesize a high-performance n-type QC. This is a future challenge for the practical application of QCs.
Funding
This work was supported by KAKENHI (Grant No. 19H05821, 20H02469) from the Japan Society for the Promotion of Science (JSPS).
Institutional Review Board Statement
Not applicable.
Informed Consent Statement
Not applicable.
Data Availability Statement
The data presented in this study are available upon reasonable request from the corresponding author.
Acknowledgments
The author (Y.T.) acknowledges Noriko Iijima for support on synthesis and characterization. We thank Kathryn Sole for editing a draft of this manuscript.
Conflicts of Interest
The authors declare no conflict of interest.
References
- Freer, R.; Ekren, D.; Ghosh, T.; Biswas, K.; Qiu, P.; Wan, S.; Chen, L.; Han, S.; Fu, C.; Zhu, T.; et al. Key properties of inorganic thermoelectric materials-tables (version 1). J. Phys. Energy 2022, 4, 022002. [Google Scholar] [CrossRef]
- Shi, X.-L.; Zou, J.; Chen, Z.-G. Advanced Thermoelectric Design: From Materials and Structures to Devices. Chem. Rev. 2020, 120, 7399–7515. [Google Scholar] [CrossRef]
- Zevalkink, A.; Smiadak, D.M.; Blackburn, J.L.; Ferguson, A.J.; Chabinyc, M.L.; Delaire, O.; Wang, J.; Kovnir, K.; Marin, J.; Schelhas, L.T.; et al. A practical field guide to thermoelectrics: Fundamentals, synthesis, and characterization. Appl. Phys. Rev. 2018, 5, 021303. [Google Scholar] [CrossRef]
- Beretta, D.; Neophytou, N.; Hodges, J.M.; Kanatzidis, M.G.; Narducci, D.; Martin-Gonzalez, M.; Beekman, M.; Balke, B.; Cerretti, G.; Tremel, W.; et al. Thermoelectrics: From history, a window to the future. Mater. Sci. Eng. Rep. 2019, 138, 210–255. [Google Scholar] [CrossRef]
- Xin, J.; Tang, Y.; Liu, Y.; Zhao, X.; Pan, H.; Zhu, T. Valleytronics in thermoelectric materials. NPJ Quantum Mater. 2018, 3, 9. [Google Scholar] [CrossRef]
- Kanatzidis, M.G. Nanostructured thermoelectrics: The new paradigm? Chem. Mater. 2010, 22, 648–659. [Google Scholar] [CrossRef]
- Prauzek, M.; Konecny, J.; Borova, M.; Janosova, K.; Hlavica, J.; Musilek, P. Energy Harvesting Sources, Storage Devices and System Topologies for Environmental Wireless Sensor Networks: A Review. Sensors 2018, 18, 2446. [Google Scholar] [CrossRef]
- Takagiwa, Y.; Ikeda, T.; Kojima, H. Earth-Abundant Fe-Al-Si Thermoelectric (FAST) Materials: From Fundamental Materials Research to Module Development. ACS Appl. Mater. Interfaces 2020, 12, 48804–48810. [Google Scholar] [CrossRef] [PubMed]
- Takagiwa, Y.; Hou, Z.; Tsuda, K.; Ikeda, T.; Kojima, H. Fe–Al–Si Thermoelectric (FAST) Materials and Modules: Diffusion-Couple and Machine-Learning Assisted Materials Development. ACS Appl. Mater. Interfaces 2021, 13, 53346–53354. [Google Scholar] [CrossRef]
- Dolinšek, J. Electrical and thermal transport properties of icosahedral and decagonal quasicrystals. Chem. Soc. Rev. 2012, 41, 6730–6744. [Google Scholar] [CrossRef]
- Dubois, J.-M. Properties and applications of quasicrystals and complex metallic alloys. Chem. Soc. Rev. 2012, 41, 6760–6777. [Google Scholar] [CrossRef] [PubMed]
- Singh, A. Tailoring microstructure of Mg–Zn–Y alloys with quasicrystal and related phases for high mechanical strength. Sci. Technol. Adv. Mater. 2014, 15, 044803. [Google Scholar] [CrossRef] [PubMed]
- Takeuchi, T. Very large thermal rectification in bulk composites consisting partly of icosahedral quasicrystals. Sci. Technol. Adv. Mater. 2014, 15, 064801. [Google Scholar] [CrossRef] [PubMed]
- Takagiwa, Y.; Kimura, K. Metallic-covalent bonding conversion and thermoelectric properties of Al-based icosahedral quasicrystals and approximants. Sci. Technol. Adv. Mater. 2014, 15, 044802. [Google Scholar] [CrossRef] [PubMed]
- Maćia, E. Thermoelectric figure of merit of AlPdRe icosahedral quasicrystals: Composition-dependent effects. Phys. Rev. B 2004, 69, 184202. [Google Scholar] [CrossRef]
- Takagiwa, Y.; Kimura, K. Reinvestigation of the Thermoelectric Properties of Fe-Substituted Icosahedral Al–Pd–Re Quasicrytals. Phys. Status Solidi A 2022, 219, 2200073. [Google Scholar] [CrossRef]
- Trambly de Laissardière, G.; Nguyen-Manh, N.; Mayou, D. Electronic structure of complex Hume-Rothery phases and quasicrystals in transition metal aluminides. Prog. Mater. Sci. 2005, 50, 679–788. [Google Scholar] [CrossRef]
- Steurer, W. Why are quasicrystals quasiperiodic? Chem. Soc. Rev. 2012, 41, 6719–6729. [Google Scholar] [CrossRef]
- Takagiwa, Y.; Kamimura, T.; Okada, J.T.; Kimura, K. Thermoelectric Properties of Icosahedral Al–Pd–(Mn or Re) Quasicrystals: Improvement of the ZT Value by Ga Substitution for Al Atoms. J. Electron. Mater. 2010, 39, 1885–1889. [Google Scholar] [CrossRef]
- Takagiwa, Y.; Kamimura, T.; Hosoi, S.; Okada, J.T.; Kimura, K. Thermoelectric properties of polygrained icosahedral Al71−xGaxPd20Mn9 (x = 0, 2, 3, 4) quasicrystals. J. Appl. Phys. 2008, 104, 073721. [Google Scholar] [CrossRef]
- Iwasaki, Y.; Kashimura, T.; Kitahara, K.; Kimura, K. Possibility of Semiconducting Electronic Structure on AlPdCo 1/1 Cubic Quasicrystalline Approximant. Mater. Trans. 2021, 62, 317–320. [Google Scholar] [CrossRef]
- Takagiwa, Y.; Kamimura, T.; Hosoi, S.; Okada, J.T.; Kimura, K. Thermoelectric properties of Al–Pd–Re quasicrystal sintered by Spark Plasma Sintering (SPS): Effect of improvement of microstructure. Z. Kristallogr. 2009, 224, 79–83. [Google Scholar] [CrossRef]
- Birch, F. Finite Elastic Strain of Cubic Crystals. Phys. Rev. 1947, 71, 809–824. [Google Scholar] [CrossRef]
- Anderson, O.L. A simplified method for calculating the debye temperature from elastic constants. J. Phys. Chem. Solids 1963, 24, 909–917. [Google Scholar] [CrossRef]
- Shiota, Y.; Muta, H.; Yamamoto, K.; Ohishi, Y.; Kurosaki, K.; Yamanaka, S. A new semiconductor Al2Fe3Si3 with complex crystal structure. Intermetallics 2017, 89, 51–56. [Google Scholar] [CrossRef]
- Stadnik, Z.M.; Zhang, G.W.; Tsai, A.-P.; Inoue, A. Electronic structure of icosahedral Al65Cu20Ru15 studied by photoemission spectroscopy. Phys. Rev. B 1995, 81, 4023–4041. [Google Scholar] [CrossRef] [PubMed]
- Nagata, T.; Kirihara, K.; Kimura, K. Effect of Ru substitution for Re on the thermoelectric properties of AlPdRe icosahedral quasicrystals. J. Appl. Phys. 2003, 94, 6560–6565. [Google Scholar] [CrossRef]
- Okada, J.T.; Hamamatsu, T.; Hosoi, S.; Nagata, T.; Kimura, K. Improvement of thermoelectric properties of icosahedral AlPdRe quasicrystals by Fe substitution for Re. J. Appl. Phys. 2007, 101, 103702. [Google Scholar] [CrossRef]
- Mizutani, U.; Sato, H.; Inukai, M.; Zijlstra, E.S. e/a determination for 4d- and 5d-transition metal elements and their intermetallic compounds with Mg, Al, Zn, Cd and In. Philos. Mag. 2013, 93, 3353–3390. [Google Scholar] [CrossRef]
- Takeuchi, T. Unusual Increase of Electron Thermal Conductivity Caused by a Pseudogap at the Fermi Level. J. Electron. Mater. 2009, 38, 1354–1359. [Google Scholar] [CrossRef]
- Maciá, E.; Rodríguez-Oliveros, R. Theoretical assessment on the validity of the Wiedemann-Franz law for icosahedral quasicrystals. Phys. Rev. B 2007, 75, 104210. [Google Scholar] [CrossRef]
- Kim, H.-S.; Gibbs, Z.M.; Tang, Y.; Wang, H.; Snyder, G.J. Characterization of Lorenz number with Seebeck coefficient measurement. APL Mater. 2015, 3, 041506. [Google Scholar] [CrossRef]
- Cahill, D.G.; Pohl, R.O. Heat flow and lattice vibrations in glasses. Solid State Commun. 1989, 70, 927–930. [Google Scholar] [CrossRef]
- Cahill, D.G.; Watson, S.K.; Pohl, R.O. Lower limit to the thermal conductivity of disordered crystals. Phys. Rev. B 1992, 46, 6131–6140. [Google Scholar] [CrossRef]
- Fukushima, K.; Suyama, H.; Tokumoto, Y.; Kamimura, Y.; Takagiwa, Y.; Edagawa, K. Comparative study of high-temperature specific heat for Al-Pd-Mn icosahedral quasicrystals and crystal approximants. J. Phys. Commun. 2021, 5, 085002. [Google Scholar] [CrossRef]
- Putatunda, A.; Singh, D.J. Lorenz number in relation to estimates based on the Seebeck coefficient. Mater. Today Phys. 2019, 8, 49–55. [Google Scholar] [CrossRef]
- Hou, Z.; Takagiwa, Y.; Shinohara, Y.; Xu, Y.; Tsuda, K. First-principles study of electronic structures and elasticity of Al2Fe3Si3. J. Phys. Condens. Matter 2021, 33, 195501. [Google Scholar] [CrossRef]
- Mott, P.H.; Roland, C.M. Limits to Poisson’s ratio in isotropic materials. Phys. Rev. B 2009, 80, 132104. [Google Scholar] [CrossRef]
- Tanaka, K.; Mitarai, Y.; Koiwa, M. Elastic constants of Al-based icosahedral quasicrystals. Philos. Mag. 1996, 73, 1715–1723. [Google Scholar] [CrossRef]
- Duquesne, J.-Y.; Perrin, B. Elastic wave interaction in icosahedral AlPdMn. Phys. B 2002, 316, 317–320. [Google Scholar] [CrossRef]
Figure 1.
(A) X-ray diffraction patterns and (B) quasi-lattice constant of Al71Pd20(Re1−xCox)9 (x = 0 [16], 0.1, 0.2, 0.3, 0.4, 0.5).
Figure 1.
(A) X-ray diffraction patterns and (B) quasi-lattice constant of Al71Pd20(Re1−xCox)9 (x = 0 [16], 0.1, 0.2, 0.3, 0.4, 0.5).
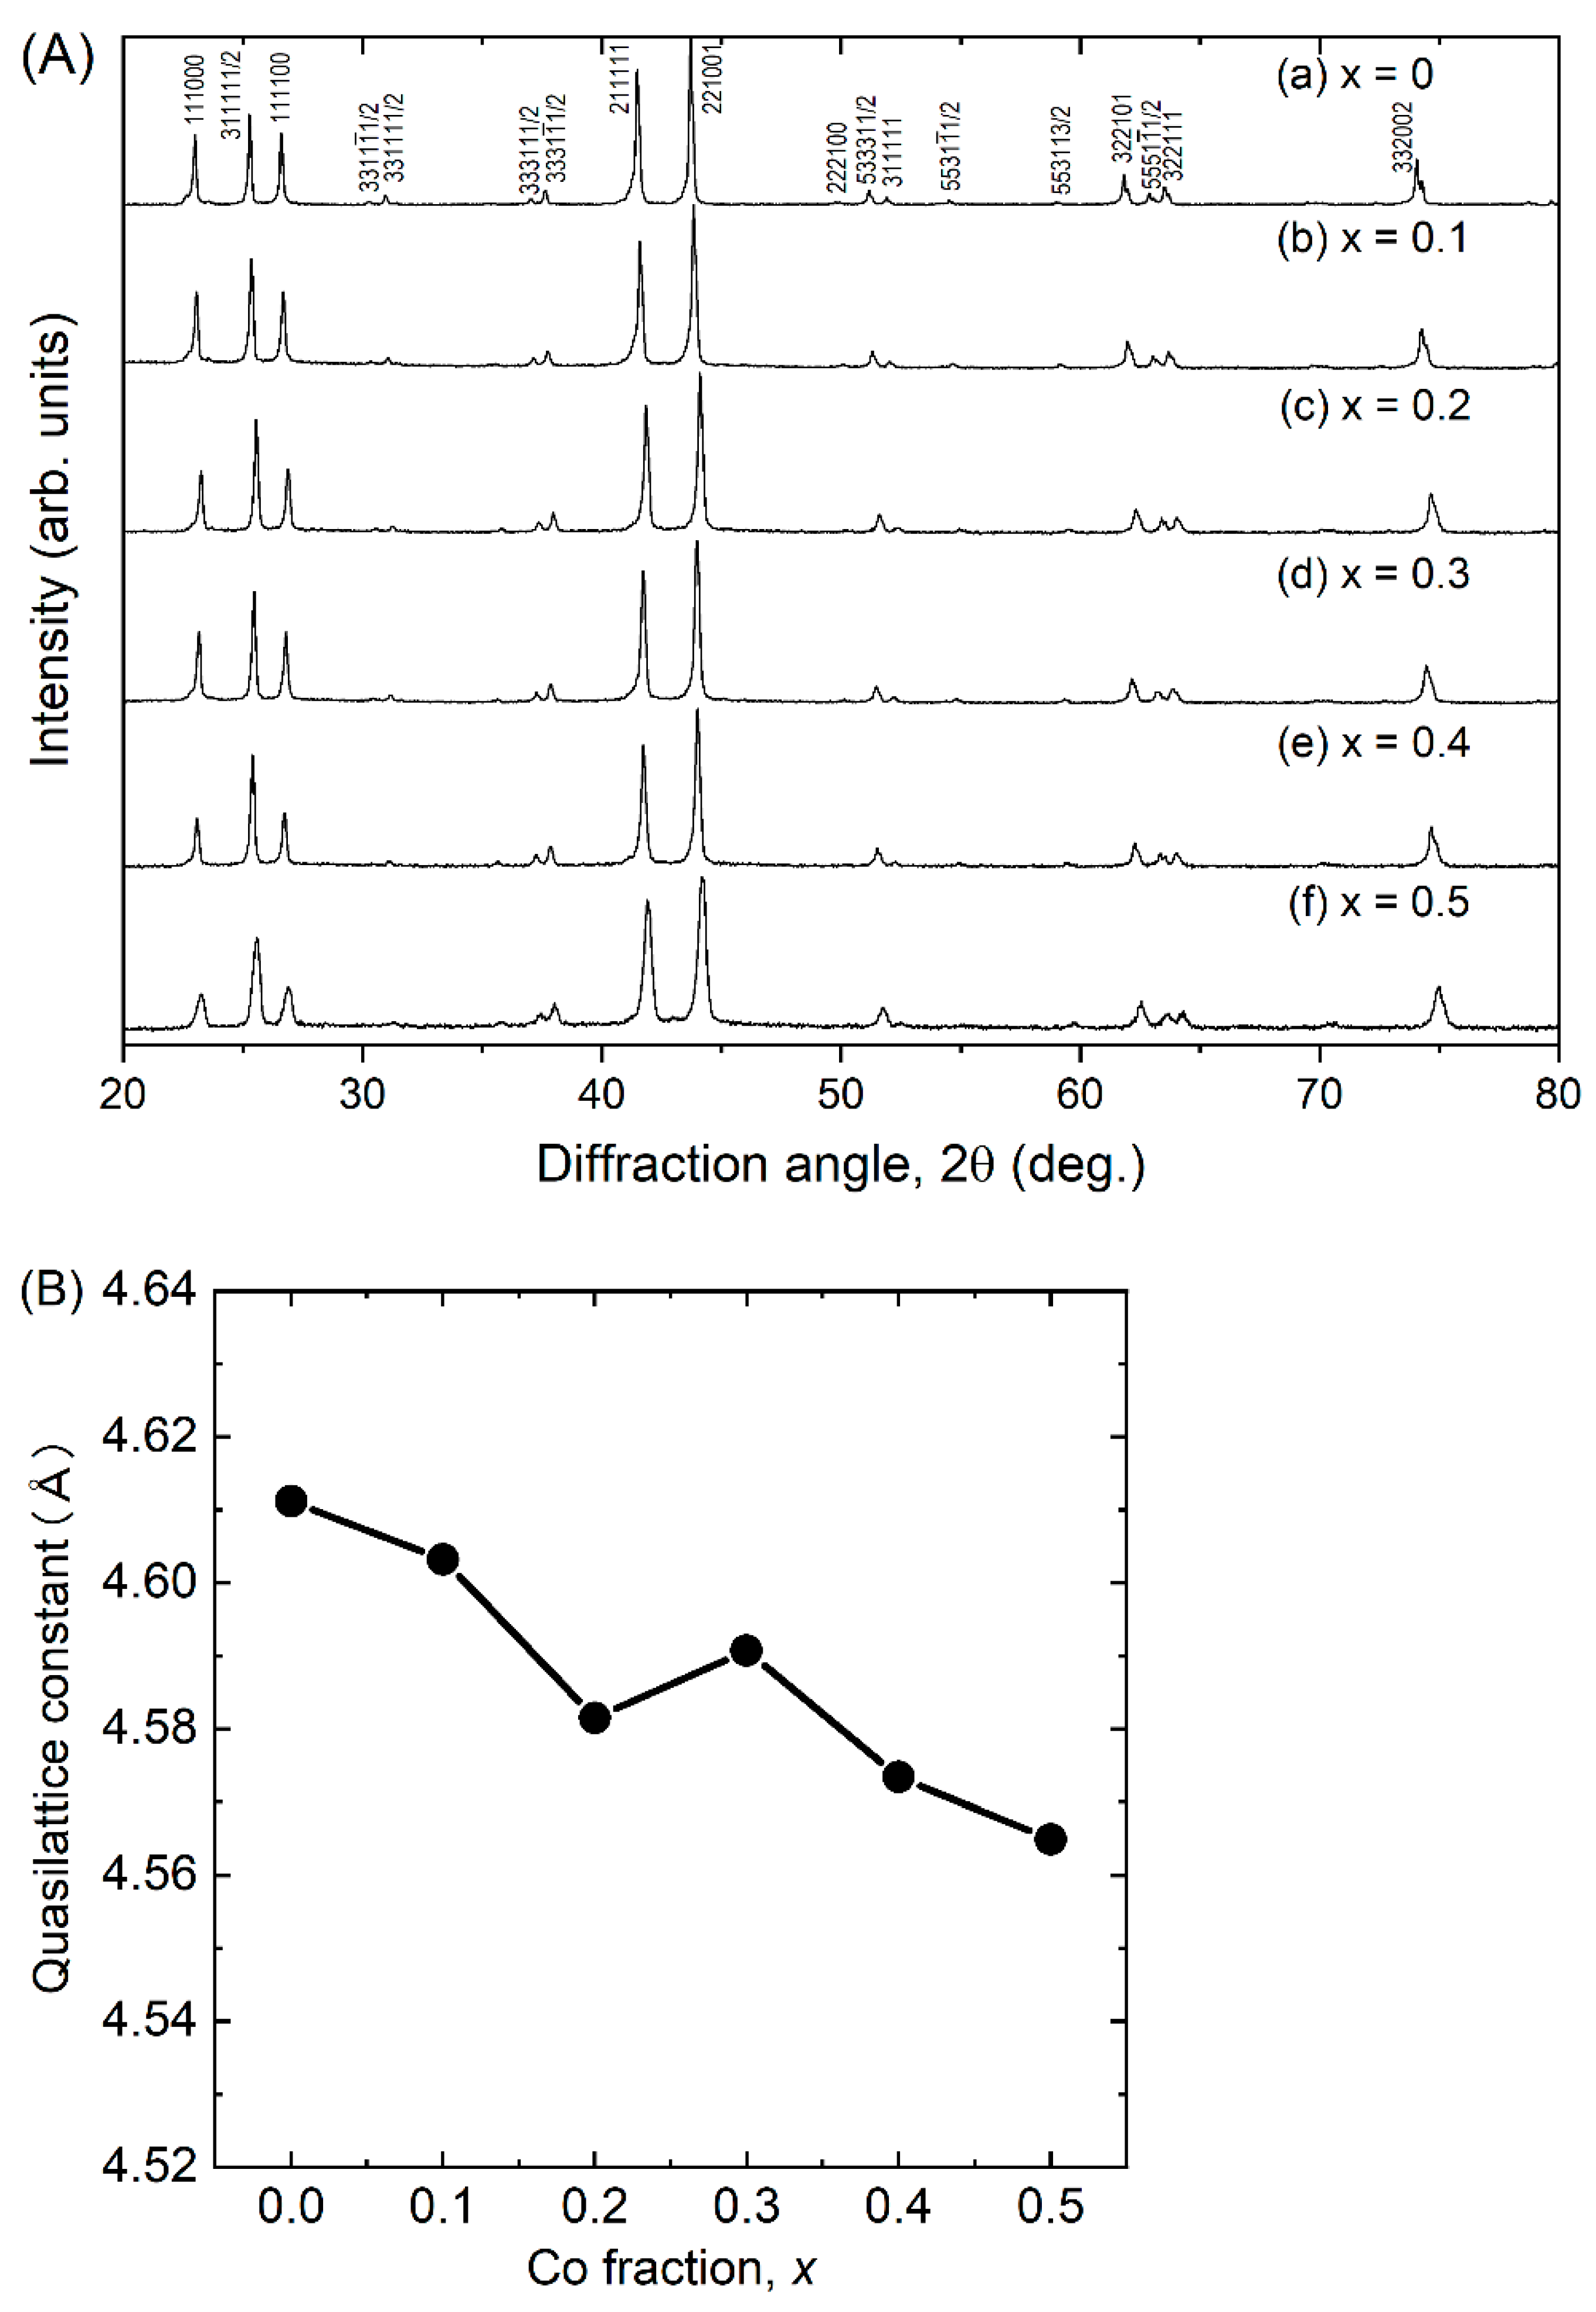
Figure 2.
Seebeck coefficient mapping measurements at room temperature for Al71Pd20(Re1−xCox)9 (x = 0 [16], 0.1, 0.2, 0.3, 0.4, 0.5).
Figure 2.
Seebeck coefficient mapping measurements at room temperature for Al71Pd20(Re1−xCox)9 (x = 0 [16], 0.1, 0.2, 0.3, 0.4, 0.5).
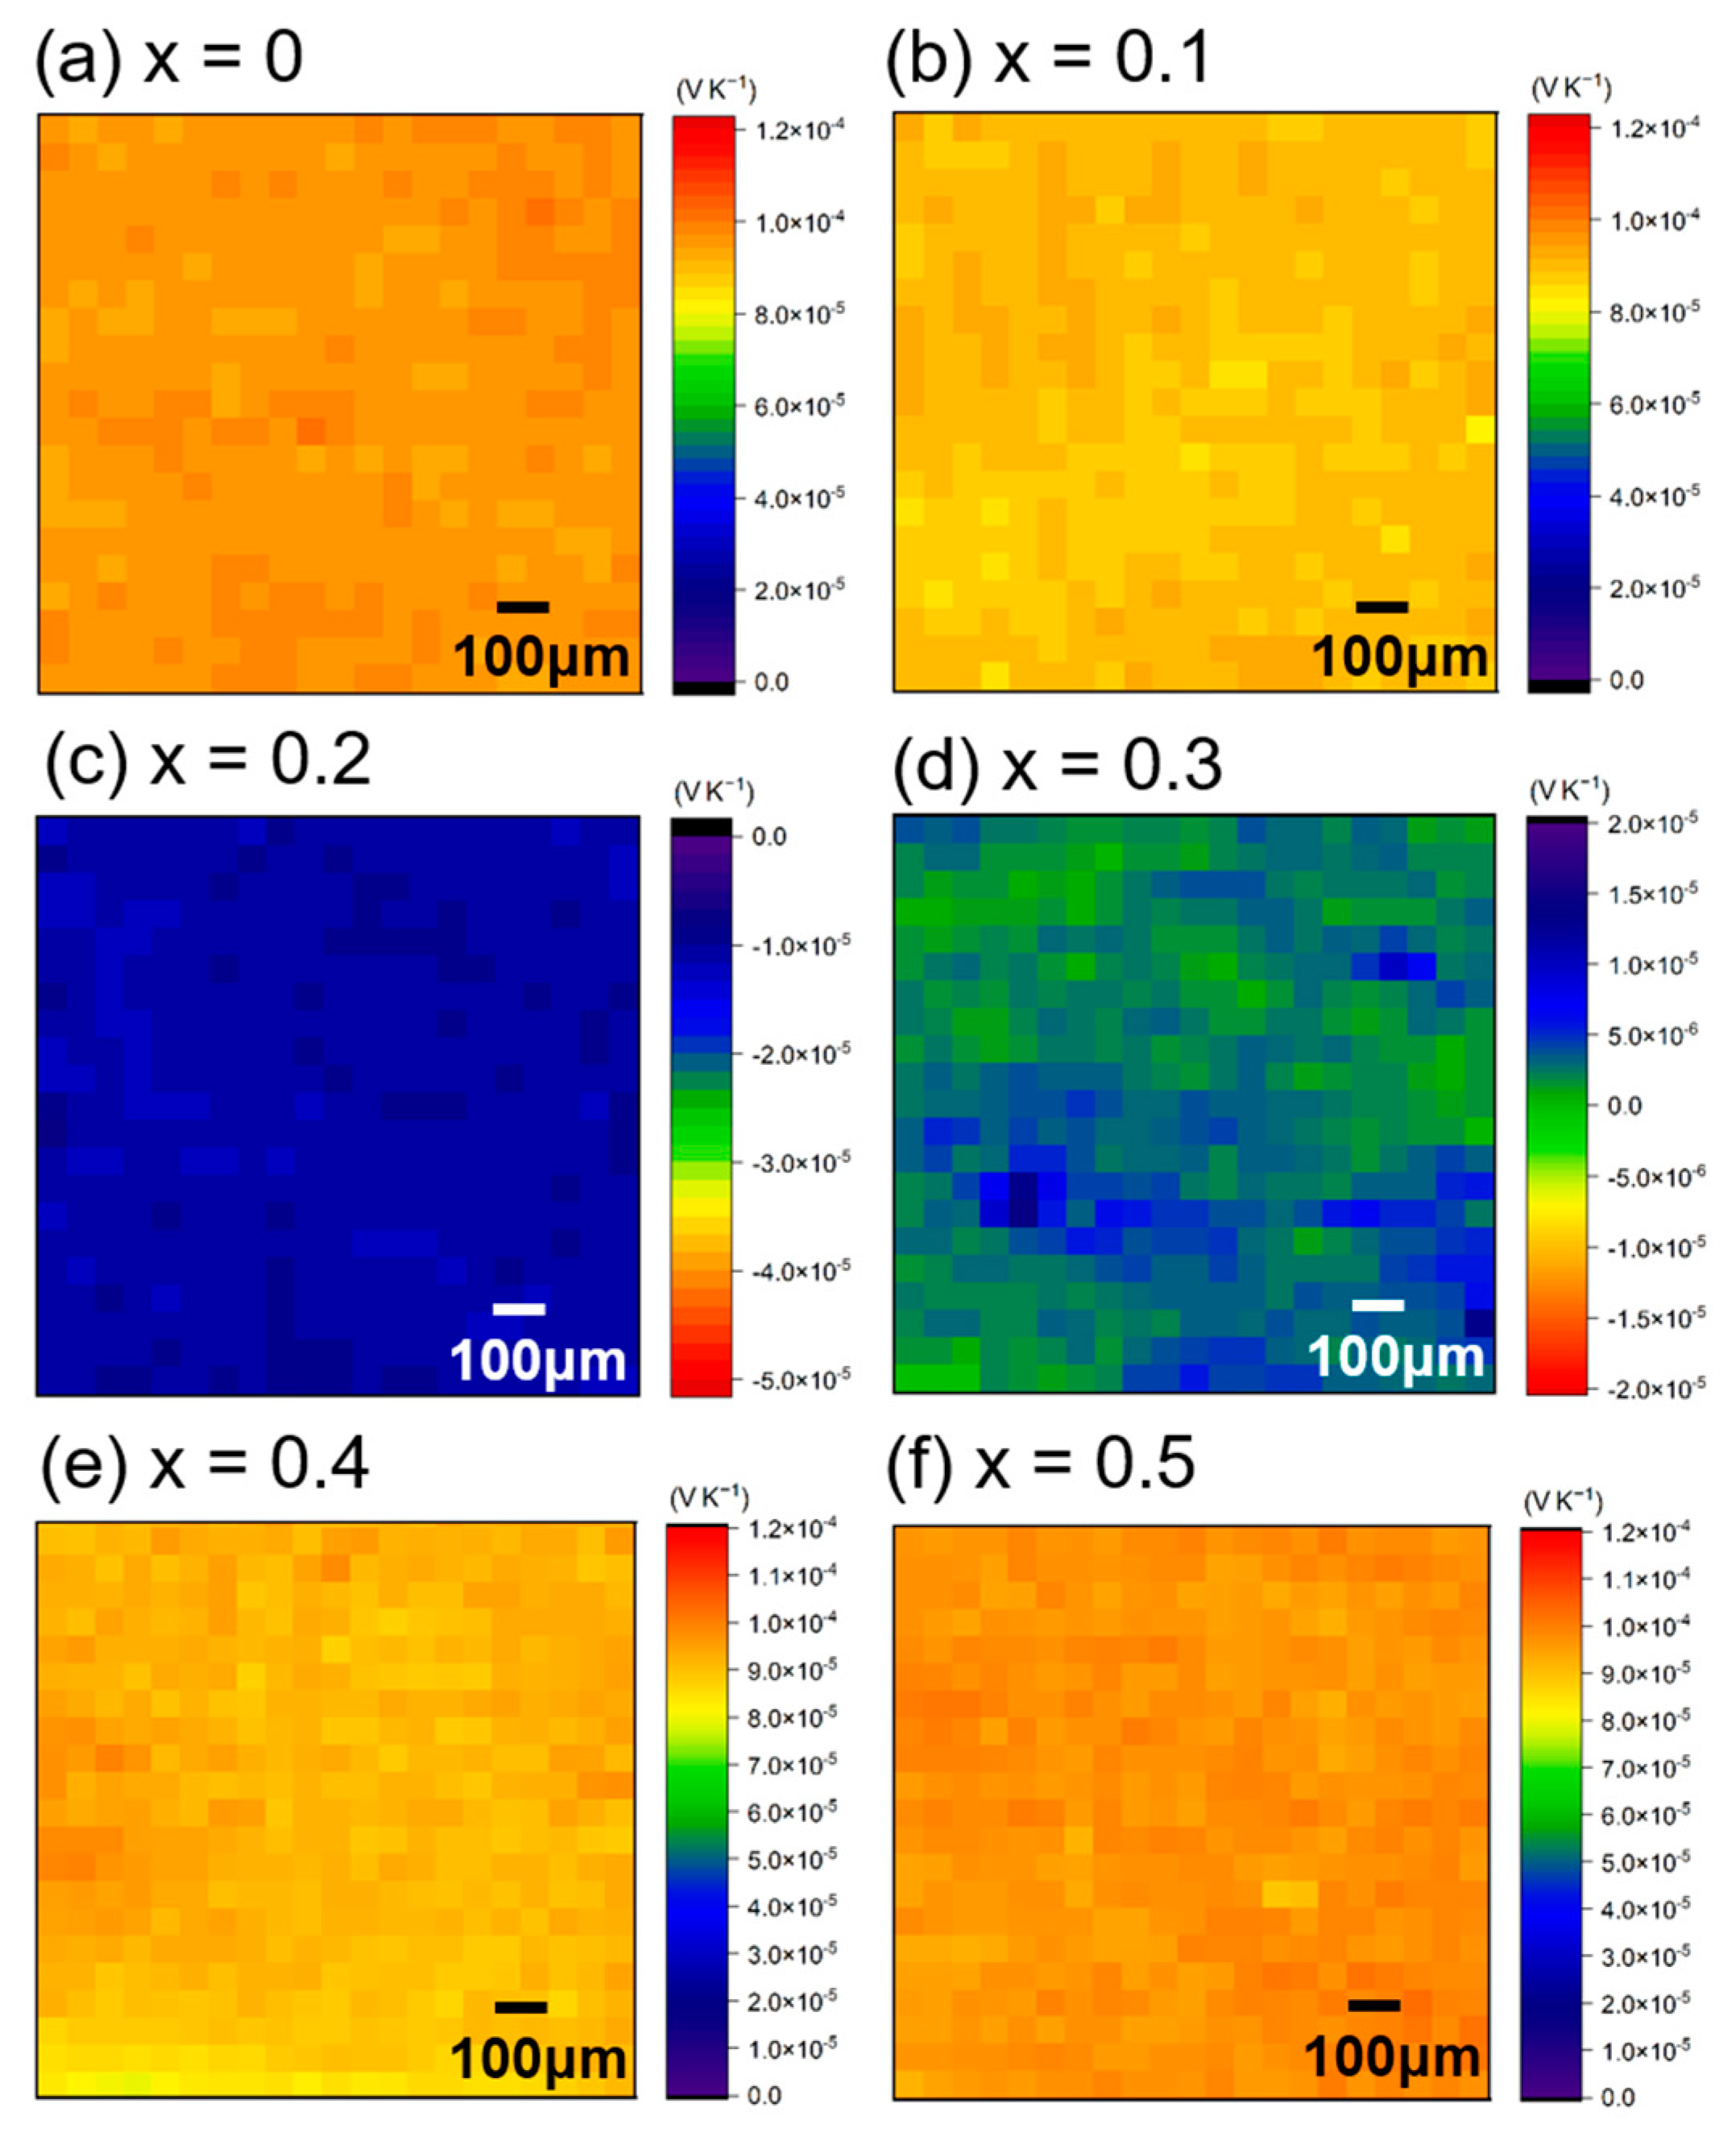
Figure 3.
(a) Electrical conductivity (σ), (b) Seebeck coefficient (S), and (c) power factor (S2σ) as functions of temperature for Al71Pd20(Re1−xCox)9 (x = 0 [16], 0.1, 0.2, 0.3, 0.4, 0.5).
Figure 3.
(a) Electrical conductivity (σ), (b) Seebeck coefficient (S), and (c) power factor (S2σ) as functions of temperature for Al71Pd20(Re1−xCox)9 (x = 0 [16], 0.1, 0.2, 0.3, 0.4, 0.5).
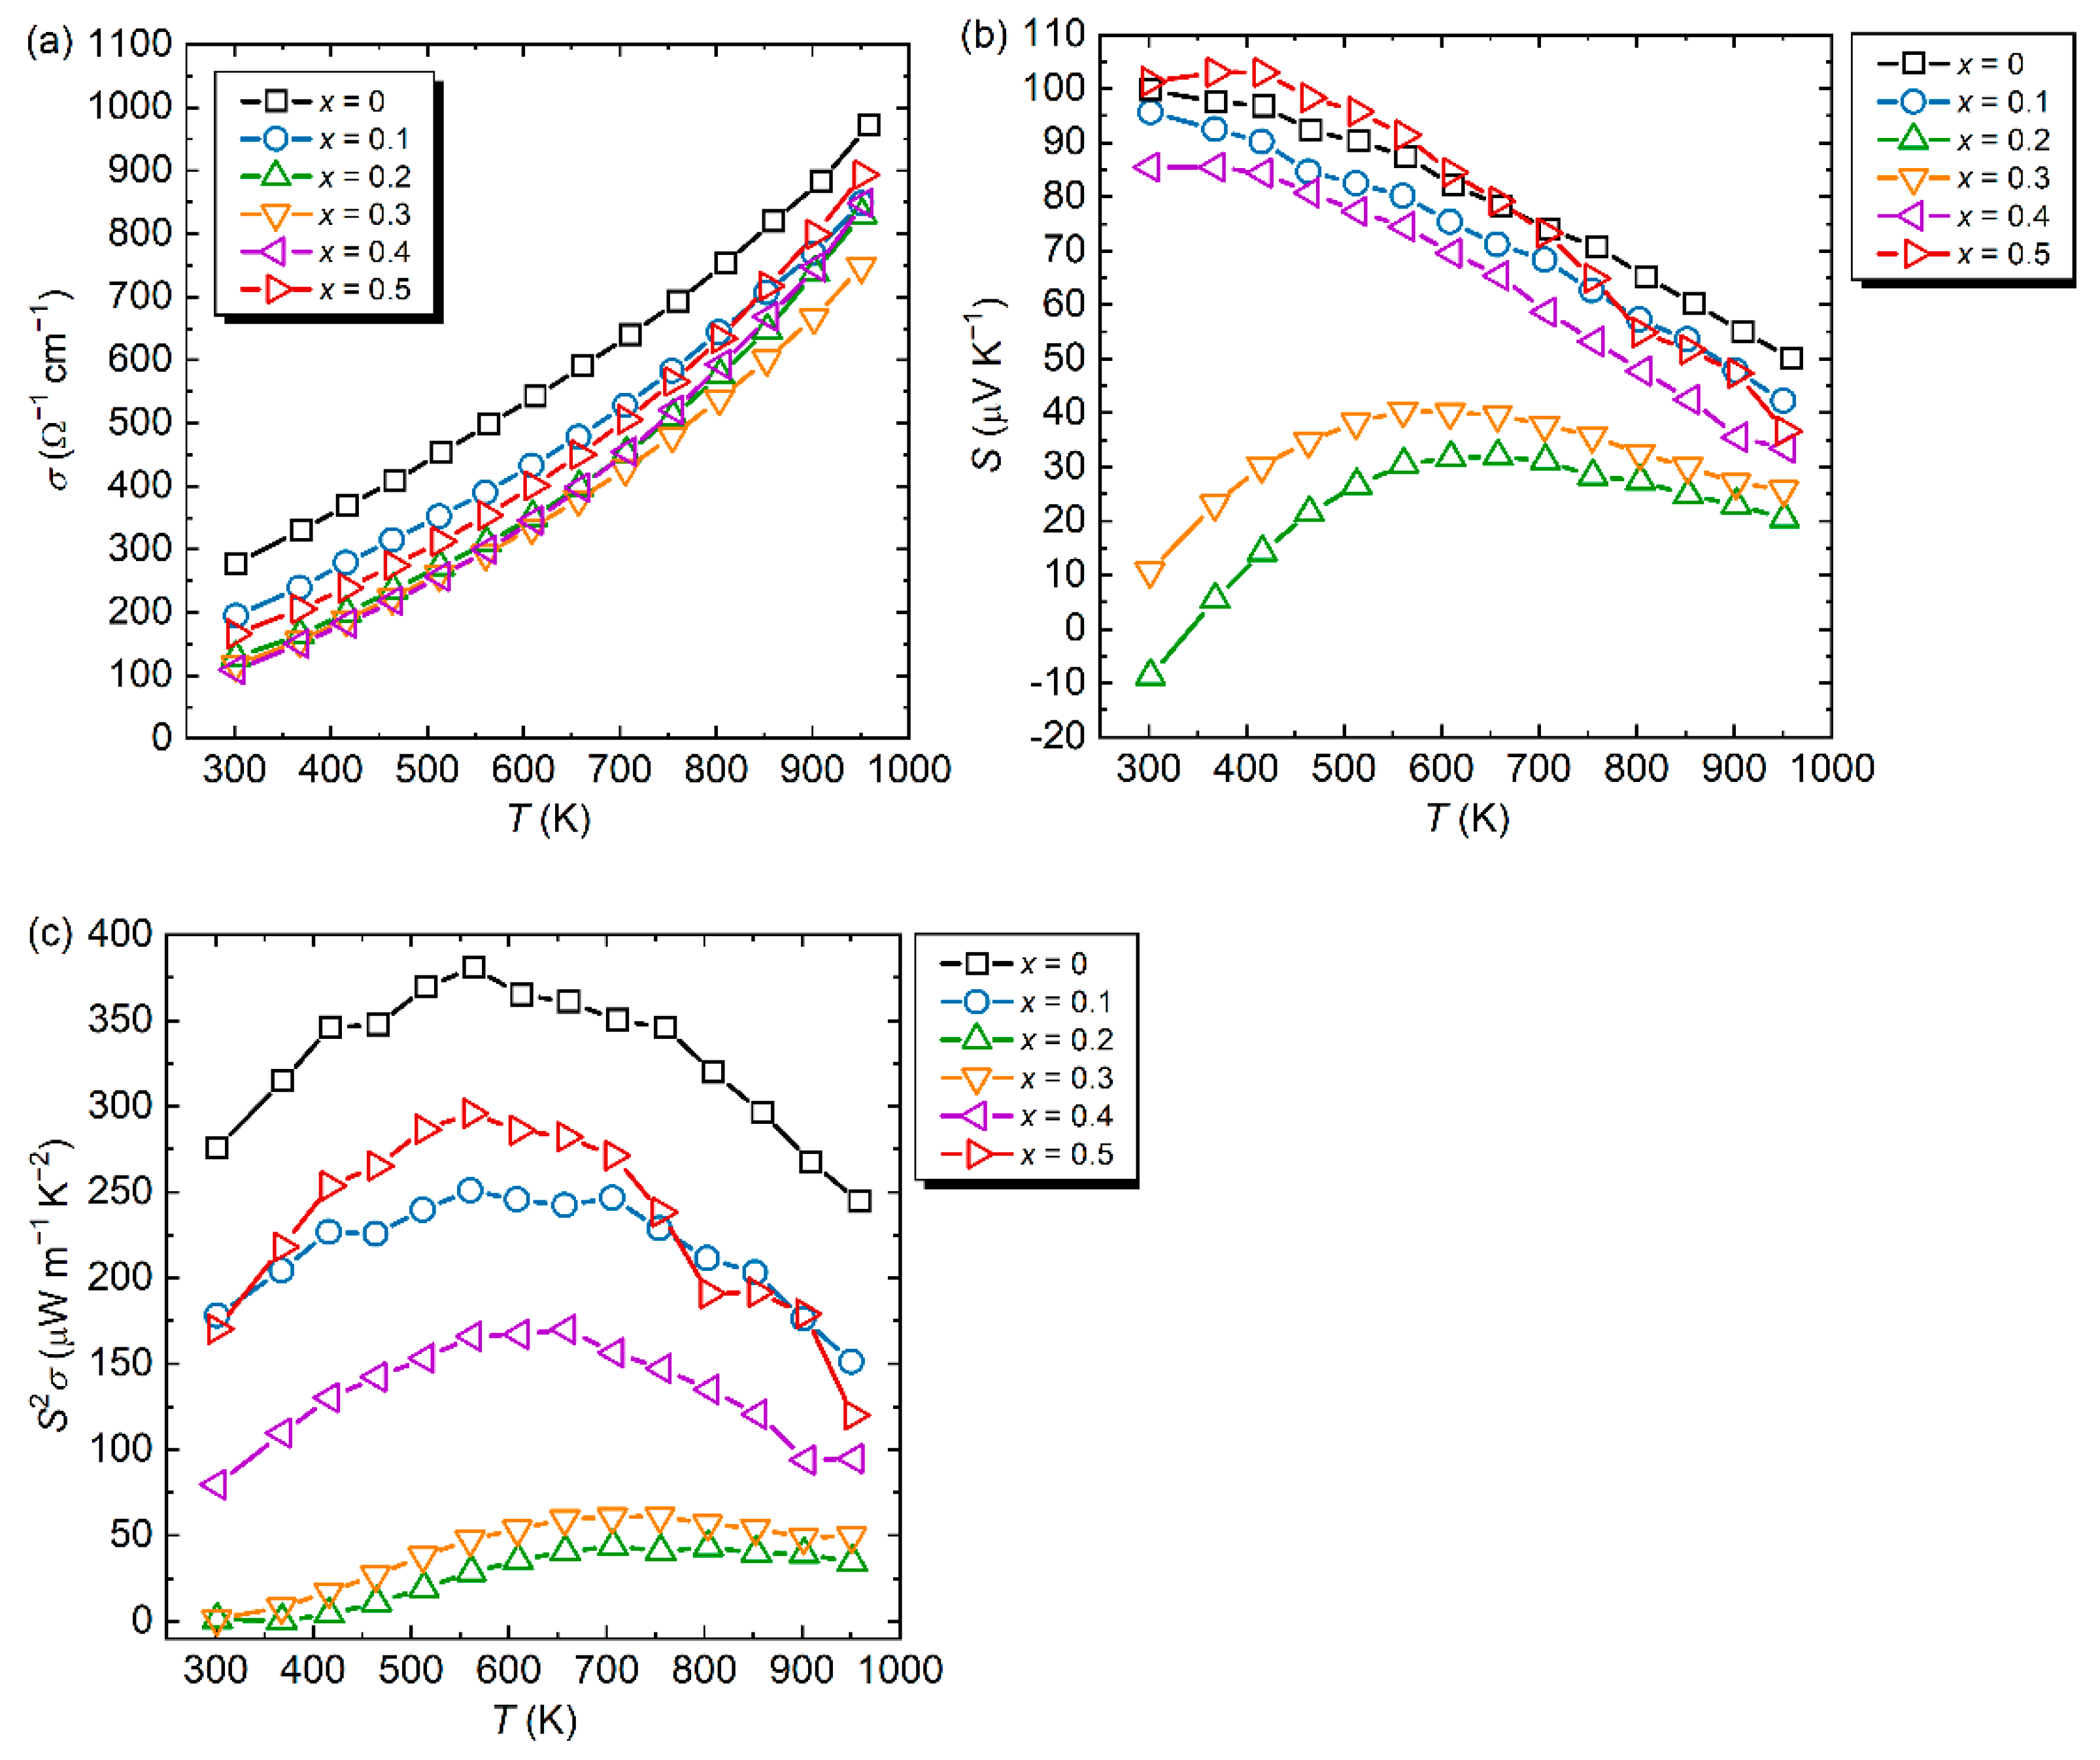
Figure 4.
(a) Specific heat at constant pressure (CP), (b) thermal diffusivity (λ), (c) total thermal conductivity (κtotal), and (d) phonon thermal conductivity (κphonon) as functions of temperature for Al71Pd20(Re1−xCox)9 (x = 0 [16], 0.1, 0.2, 0.3, 0.4, 0.5).
Figure 4.
(a) Specific heat at constant pressure (CP), (b) thermal diffusivity (λ), (c) total thermal conductivity (κtotal), and (d) phonon thermal conductivity (κphonon) as functions of temperature for Al71Pd20(Re1−xCox)9 (x = 0 [16], 0.1, 0.2, 0.3, 0.4, 0.5).
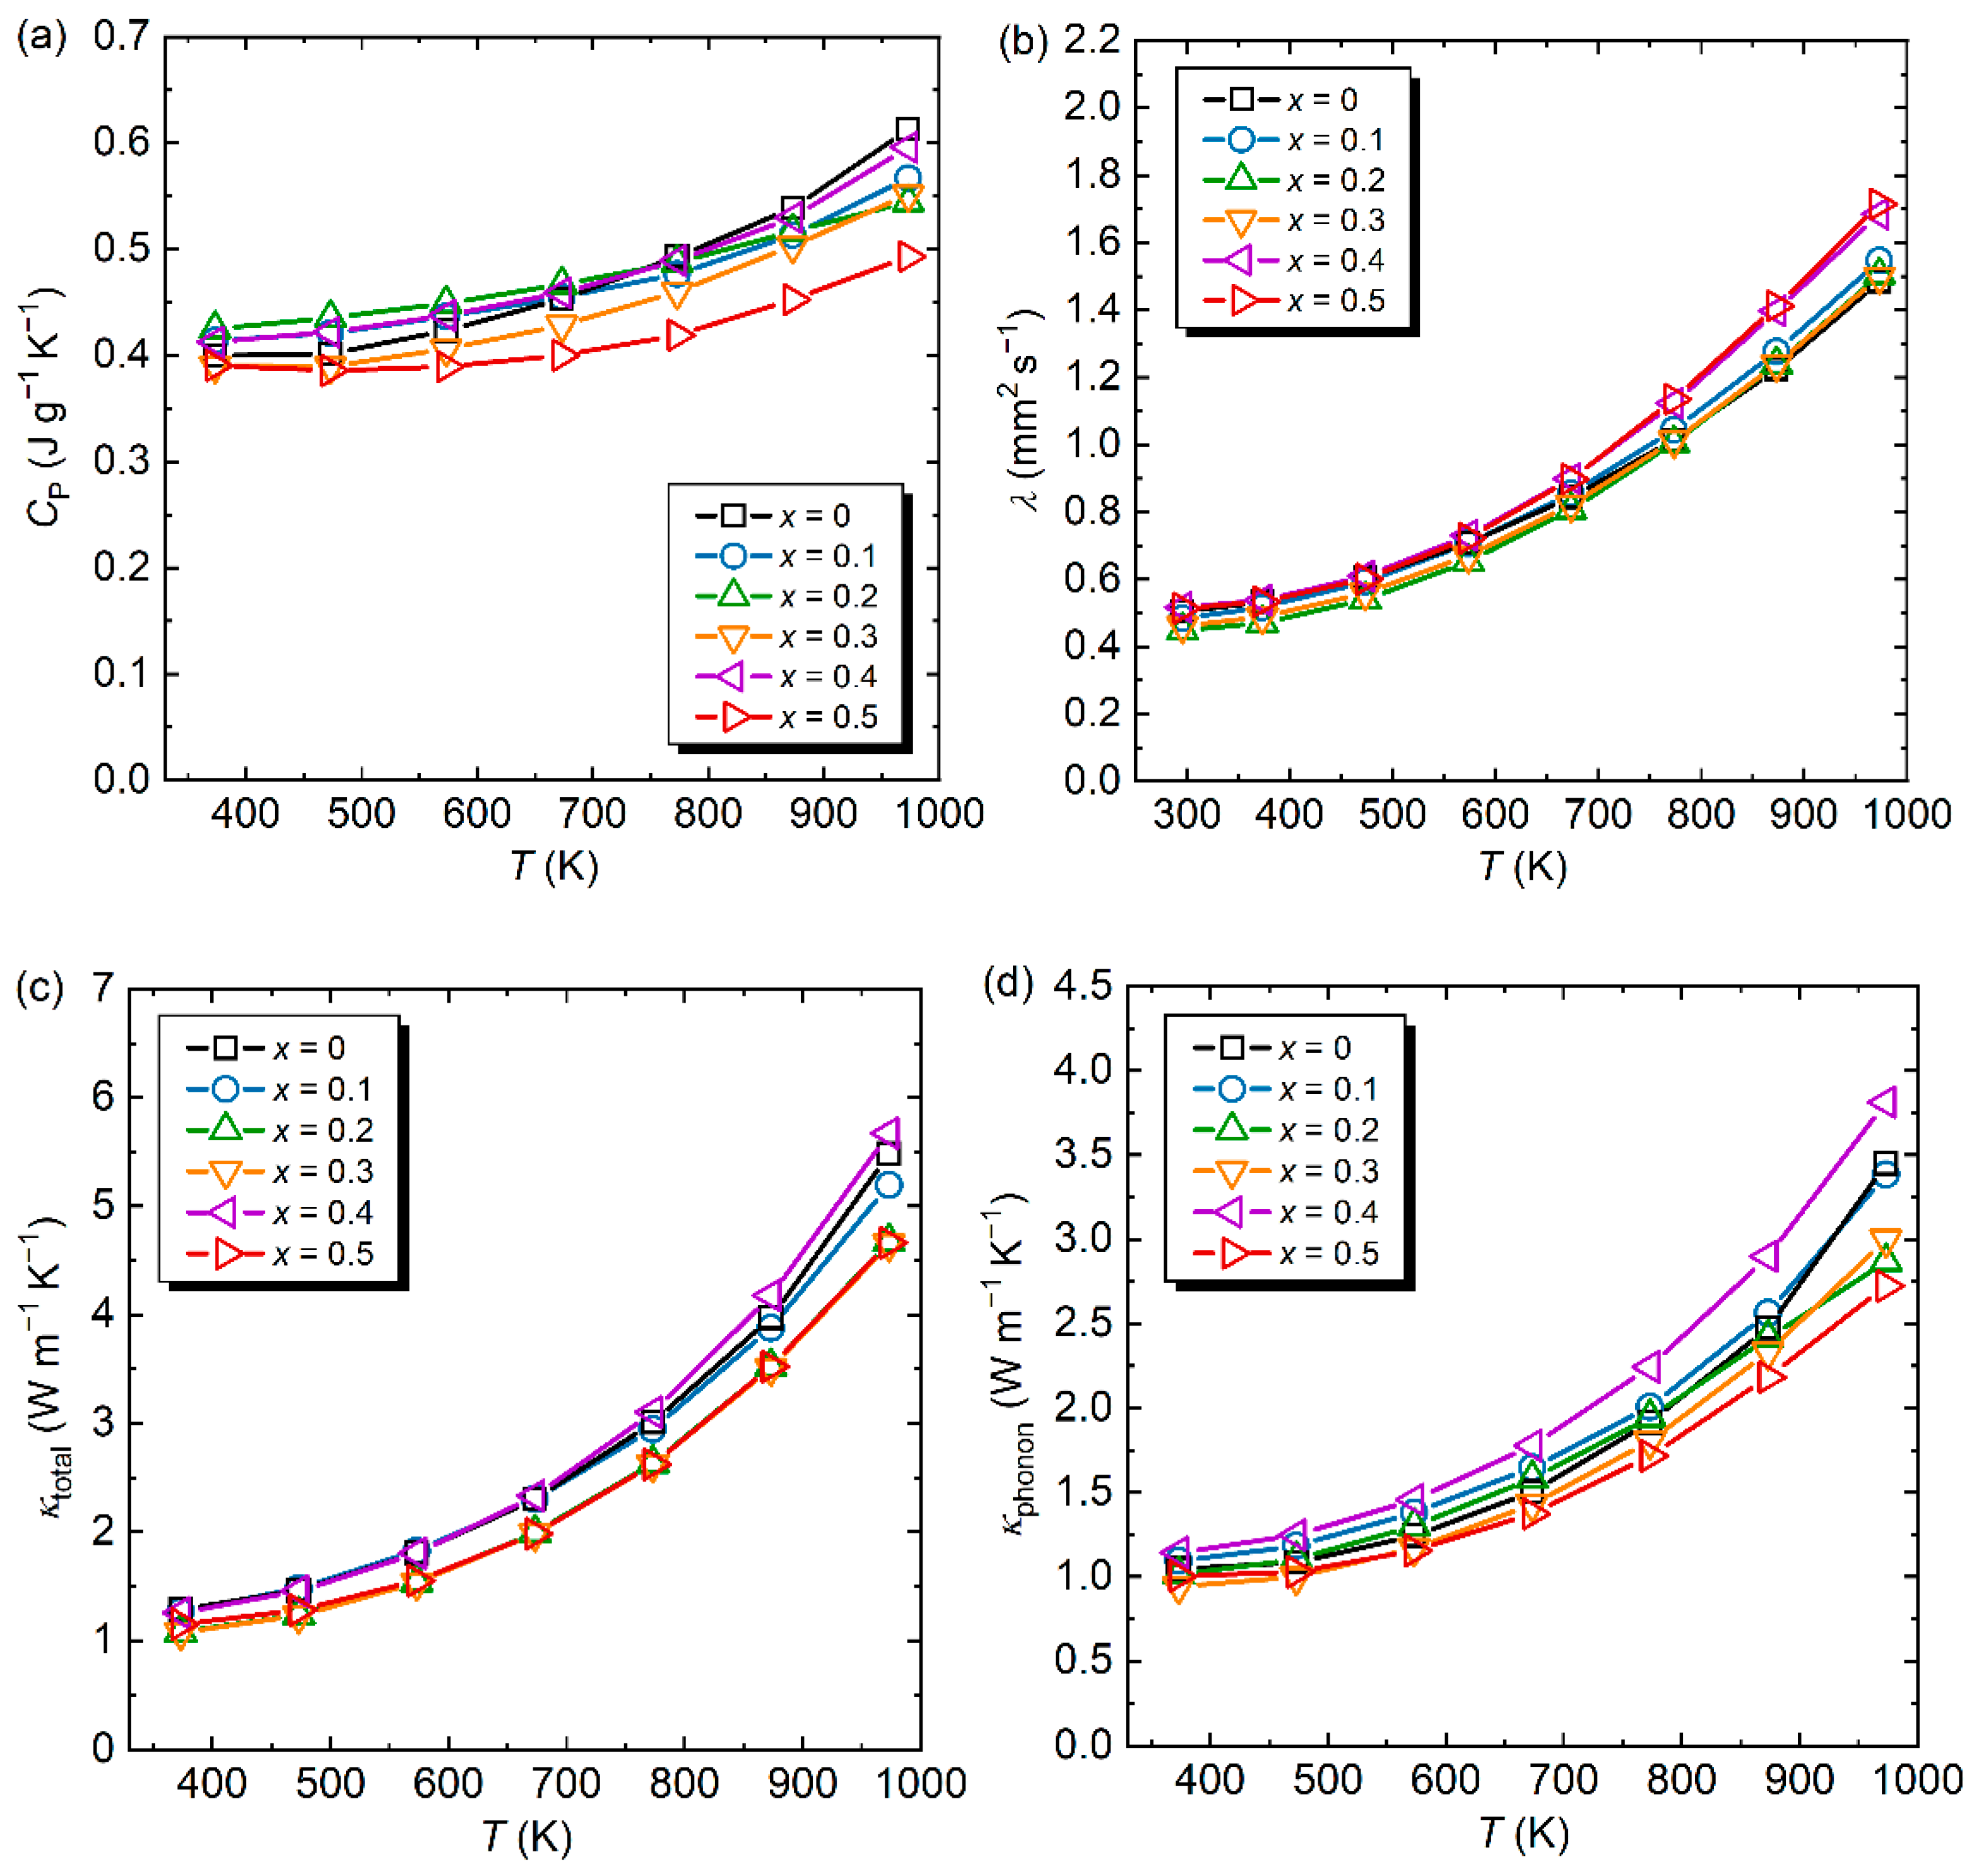
Figure 5.
Dimensionless figure of merit (zT) as a function of temperature for Al71Pd20(Re1−xCox)9 (x = 0 [16], 0.1, 0.2, 0.3, 0.4, 0.5).
Figure 5.
Dimensionless figure of merit (zT) as a function of temperature for Al71Pd20(Re1−xCox)9 (x = 0 [16], 0.1, 0.2, 0.3, 0.4, 0.5).

Table 1.
Sintering temperature (TS), bulk densities (dbulk), calculated densities (dcalc), and relative densities (dbulk/dcalc) for Al71Pd20(Re1−xCox)9 (x = 0 [16], 0.1, 0.2, 0.3, 0.4, 0.5).
Table 1.
Sintering temperature (TS), bulk densities (dbulk), calculated densities (dcalc), and relative densities (dbulk/dcalc) for Al71Pd20(Re1−xCox)9 (x = 0 [16], 0.1, 0.2, 0.3, 0.4, 0.5).
| Sample | TS (K) | dbulk (g cm–3) | dcalc (g cm–3) | dbulk/dcalc (%) |
|---|---|---|---|---|
| x = 0 [16] | 1223 | 6.026 | 6.30 [22] | 95.7 |
| x = 0.1 | 1233 | 5.924 | 6.17 | 96.0 |
| x = 0.2 | 1233 | 5.810 | 6.05 | 96.0 |
| x = 0.3 | 1233 | 5.656 | 5.92 | 95.5 |
| x = 0.4 | 1223 | 5.648 | 5.80 | 97.4 |
| x = 0.5 | 1223 | 5.517 | 5.67 | 97.3 |
Table 2.
Total thermal conductivity at 373 K (κtotal,373K), phonon thermal conductivity at 373 K (κphonon,300K), minimum thermal conductivity at 373 K (κmin,373K), longitudinal (vlong) and transverse (vtrans) speeds of sound, effective speed of sound (vs), rate of change in vs (Δvs/vs), specific heat at constant pressure at 373 K (CP,373K), and rate of change in CP,373K (ΔCP,373K/CP,373K) for Al71Pd20(Re1−xCox)9 (x = 0 [16], 0.1, 0.2, 0.3, 0.4, 0.5).
| Sample | κtotal,373K | κphonon,373K | κmin,373K | vlong/vtrans |
|---|---|---|---|---|
| (W m–1 K–1) | (W m–1 K–1) | (W m–1 K–1) | (m s–1) | |
| x = 0 [16] | 1.28 | 1.05 | 1.05 | 6430/3420 |
| x = 0.1 | 1.27 | 1.09 | 1.07 | 6400/3500 |
| x = 0.2 | 1.16 | 1.01 | 1.09 | 6430/3660 |
| x = 0.3 | 1.08 | 0.94 | 1.06 | 6370/3490 |
| x = 0.4 | 1.25 | 1.14 | 1.09 | 6480/3590 |
| x = 0.5 | 1.15 | 1.00 | 1.11 | 6690/3660 |
| Sample | vs | Δvs/vs | CP,373K | ΔCP,373K/CP,373K |
| (m s–1) | (%) | (J g−1 K−1) | (%) | |
| x = 0 [16] | 3820 | - | 0.3997 | - |
| x = 0.1 | 3900 | 2.1 | 0.4138 | 3.5 |
| x = 0.2 | 4070 | 6.5 | 0.4249 | 6.3 |
| x = 0.3 | 3890 | 1.8 | 0.3902 | −2.4 |
| x = 0.4 | 4000 | 4.7 | 0.4124 | 3.1 |
| x = 0.5 | 4080 | 6.8 | 0.3903 | 2.4 |
Table 3.
Estimated elastic moduli (Poisson’s ratio (ν), Young’s modulus (E), shear modulus (G), and bulk modulus (B)) for Al71Pd20(Re1−xCox)9 (x = 0, 0.1, 0.2, 0.3, 0.4, 0.5), and those of i-Al–Pd–Mn [39,40] and i-Al–Cu–Fe [39] QCs.
| Sample | ν | E | G | B |
|---|---|---|---|---|
| (-) | (GPa) | (GPa) | (GPa) | |
| x = 0 | 0.303 | 184 | 70.5 | 155 |
| x = 0.1 | 0.287 | 187 | 72.6 | 146 |
| x = 0.2 | 0.260 | 196 | 77.8 | 136 |
| x = 0.3 | 0.286 | 177 | 68.9 | 138 |
| x = 0.4 | 0.279 | 186 | 72.8 | 140 |
| x = 0.5 | 0.286 | 190 | 73.9 | 148 |
| i-Al–Pd–Mn [39] | 0.254 | - | 72.4 | 123 |
| i-Al–Pd–Mn [40] | 0.256 | - | 70.4 | 121 |
| i-Al–Cu–Fe [39] | 0.232 | - | 68.1 | 104 |
Publisher’s Note: MDPI stays neutral with regard to jurisdictional claims in published maps and institutional affiliations. |
© 2022 by the author. Licensee MDPI, Basel, Switzerland. This article is an open access article distributed under the terms and conditions of the Creative Commons Attribution (CC BY) license (https://creativecommons.org/licenses/by/4.0/).
Share and Cite
MDPI and ACS Style
Takagiwa, Y. Thermoelectric Properties of Co-Substituted Al–Pd–Re Icosahedral Quasicrystals. Materials 2022, 15, 6816. https://doi.org/10.3390/ma15196816
AMA Style
Takagiwa Y. Thermoelectric Properties of Co-Substituted Al–Pd–Re Icosahedral Quasicrystals. Materials. 2022; 15(19):6816. https://doi.org/10.3390/ma15196816
Chicago/Turabian StyleTakagiwa, Yoshiki. 2022. "Thermoelectric Properties of Co-Substituted Al–Pd–Re Icosahedral Quasicrystals" Materials 15, no. 19: 6816. https://doi.org/10.3390/ma15196816
Note that from the first issue of 2016, this journal uses article numbers instead of page numbers. See further details here.