Abstract
The existence of so-called blue-green cavities in the luminescence spectrum has been a hindrance to the improvement in the performance of traditional phosphor-converted white light emitting diodes. The commercial phosphors synthesized in reducing atmospheres can also cause problems such as equipment complexity, increased cost, and environmental pollution. Herein, a series of cyan-emitting Lu3GaxAl5−xO12: Ce3+ (x = 0, 1, 2, 3, 4) garnet phosphors were synthesized by a traditional solid-state reaction in a nonreducing atmosphere at different temperatures. The crystal structure, grain morphology, optical properties, and thermal quenching behavior were used to analyze the optical properties of the as-prepared phosphors. The luminescence intensity of samples is affected by the synthesis temperature and energy gap between the conduction band and the lowest energy of the 5d excited state of the host lattice. With the substitution of Al3+ by Ga3+, the regularity of the excitation and emission band movement is determined by the combined effects of crystal field splitting (CFS) and the nephelauxetic effect (NE). The temperature dependence of luminescence was studied. The thermal quenching mechanism was clarified by the thermal ionization model. Finally, by employing Lu2.94Ga2Al3O12: Ce3+0.06 as a cyan component, a w-LED with a high color rendering index of 93.2 and low correlation color temperature of 3880 K based on a blue chip and commercial red phosphors were fabricated in order to explore its possible application in high quality w-LED.
1. Introduction
White light emitting diodes (w-LEDs) are becoming a new generation of solid-state light sources for the lighting industry and display systems due to their excellent properties such as energy-saving, high energy efficiency, environment friendly, and small volume [1,2,3,4,5,6]. Nowadays, the main challenge for w-LEDs is to actualize high luminous efficiency, outstanding color rendering properties, moderate correlated color temperature, and excellent resistance to the thermal quenching behavior of photoluminescence. The most common way to realize white light via w-LEDs is composed of a blue LED chip and the yellow-emitting phosphors of Y3Al5O12: Ce3+ (YAG: Ce3+). However, this kind of LED suffers from limitations in the lack of red- (580–650 nm) and green-emission (470–510 nm) components in the white light, resulting in a poor color rendering index (CRI) and harsher correlation color temperature (CCT) [7,8]. Thus, the demand for indoor lighting and operating room lighting cannot be met. To solve this problem, appropriate red phosphors were added into a yellow-emitting phosphor, and even green phosphor and red phosphor were mixed to replace the yellow one to improve CRI and depress CCT.
For green phosphor, one of the necessary tasks is to develop cyan-emitting phosphors with peak values in the 480–500 nm emission region so that the blue-green cavity around 490 nm in the emission spectrum can be filled to adapt for high-quality w-LEDs. Up to now, many green phosphors have been developed to achieve this goal such as La3Br(SiS4)2: Ce3+, BaSi7N10: Eu2+, and Ca2LaZr2Ga3O12: Ce3+ [9,10,11]. Among them, Y3-yAl5−xGaxO12: yCe3+ (YAGG: Ce3+) is particularly noteworthy. It has been reported that the Ga3+ substituted YAG: Ce3+ phosphor can achieve a tunable color from yellow- to green-emitting, which implies that Ga3+ can achieve a spectral blue shift. In past studies, many researchers have investigated the structural transformation and luminescence properties of YAGG: Ce3+ such as the preferential entry of Ga3+ ions into different lattices of matrix [12,13], and the effect of Ga3+ ion content on its luminescence properties at different temperature [14,15,16,17]. However, it should also be noted that these phosphors have their own defects, for instance, the emission wavelength of Y3Al5−xGaxO12: Ce3+ can be blue shifted to 500 nm with x = 4, but the emission intensity decreases significantly; there is poor chemical stability and a high thermal quenching for La3Br(SiS4)2: Ce3+ with the emission peak at 466 nm based on near-ultraviolet (n-UV) LED chip; an expensive and harsh synthetic process for BaSi7N10: Eu2+; and a low quantum efficiency for Ca2LaZr2Ga3O12: Ce3+. Hence, it is still necessary to develop blue-green cyan phosphors aimed at improving the color rendering properties and thermal stability of luminescence, expanding the application field of blue-green phosphor for w-LEDs. As a kind of green-emitting phosphor with an emission wavelength around 510 nm, Lu3Al5O12: Ce3+ (LuAG: Ce3+), synthesized in a reducing atmosphere, has always been a matter of great concern because of its excellent luminescence efficiency and high thermal stability [18,19]. However, its emission spectrum is still not sufficient to fill the cavity near 490 nm. Therefore, it needs to be modified to achieve a further spectral blue-shift to meet the requirements.
Moreover, as known to all, the process of synthesis in a nonreducing atmosphere has numerous advantages such as a simple process, low cost, non-toxic, and so on. In the synthesis process of Y2.94Al3Ga2O12: 0.06Ce3+ reported by Zhu et al., it was found that sintering under a reducing atmosphere would lead to the appearance of Ga2O3, resulting in a hindrance in forming a pure phase of YAGG: Ce3+. It also indicated that the structure and properties of the material would be greatly affected by the synthetic atmosphere [20]. However, the luminescence properties of Ce3+ doped Lu3GaxAl5−xO12 garnet-typed phosphors synthesized in a nonreducing atmosphere have not been especially reported. Meanwhile, the influence of the synthesis temperature on the luminescence intensity has also not been involved in the previous reports of these phosphor systems. In order to narrow the cyan gap in the spectrum and improve the photoluminescence performances of the w-LEDs device, herein, we synthesized a series of excellent blue-light excited cyan phosphor Lu2.94GaxAl5−xO12: 0.06Ce3+ (LuAGG: Ce3+) based on the substitute of Al3+ by Ga3+ in the host. The effects of the synthesis conditions and concentration of Ga3+ ions on the luminescence and thermal stability of the samples were investigated systematically. Finally, a w-LED device was fabricated by using a blue GaN chip with the as-prepared cyan phosphor Lu2.94Ga2Al3O12: Ce3+0.06 and commercial red phosphor Sr2Si5N8: Eu2+, which has an excellent CRI of 93.2 at a CCT of 3880 K, indicating its identity of a promising candidate for high quality w-LEDs.
2. Experimental Section
2.1. Materials and Synthesis
A nominal formula of Lu2.94GaxAl5−xO12 (x = 0, 1, 2, 3, 4) doped with 0.06Ce3+, stoichiometric amounts of Al2O3 (99%, Ganzhou Kemingrui Nonferrous Metals Co. Ltd., Ganzhou, China), Lu2O3 (99.9%, Ganzhou Kemingrui Nonferrous Metals Co. Ltd., China), Ga2O3 (99%, A.R. Shanghai Macklin Biochemical Co. Ltd., Shanghai, China), Ce(NO3)3·6H2O (99%, A.R. Shanghai Macklin Biochemical Co. Ltd., Shanghai, China), and H3BO3 (99%, A.R. Tianjin Guangfu Co., Ltd., Tianjin, China) as a flux (4%) was weighed and prepared for mixing in an agate mortar for 0.5 h. The mixtures were placed in the alumina crucible in an airtight atmosphere at different temperatures (1350 °C, 1450 °C, and 1550 °C for 3 h). Finally, the products were naturally cooled to room temperature for complete reaction, and ground into powder for further analysis.
2.2. Characterization
The crystallographic structure of the samples was detected by powder X-ray diffraction (XRD, Rigaku, Ultima IV, Tokyo, Japan) using the parameters of 40 kV and 20 mA, and continuous scanning with the scanning speed of 4°/min was implemented in the scanning range of 10–80°. The emission and excitation spectra (PL and PLE) were monitored via a fluorescence spectrophotometer (model F-7000, Hitachi Ltd., Tokyo, Japan) equipped with a 150 W Xe lamp. The field-emission scanning electron microscope (SEM, JSM-6701F, JEOL, Akishima, Japan) was used to observe the gain morphology of the as-prepared samples at voltages of 3 kV. The temperature-dependence of the PL spectra were also recorded by the F-7000 fluorescence spectrometer attached to the homemade temperature controller at the range of 30–225 °C. Finally, a w-LED specimen was assembled with commercial red phosphors (Sr2Si5N8: Eu2+), a representative sample of Lu2.94Ga2Al3O12: Ce3+0.06 and GaN chips (λem = 450 nm). Its luminescence properties were evaluated on a SENSING SL-300 spectroradiometer. Except for the temperature-dependence of PL spectra, all tests were carried out at room temperature.
3. Results and Discussions
3.1. Crystal Structure Analysis and Micro-Morphology
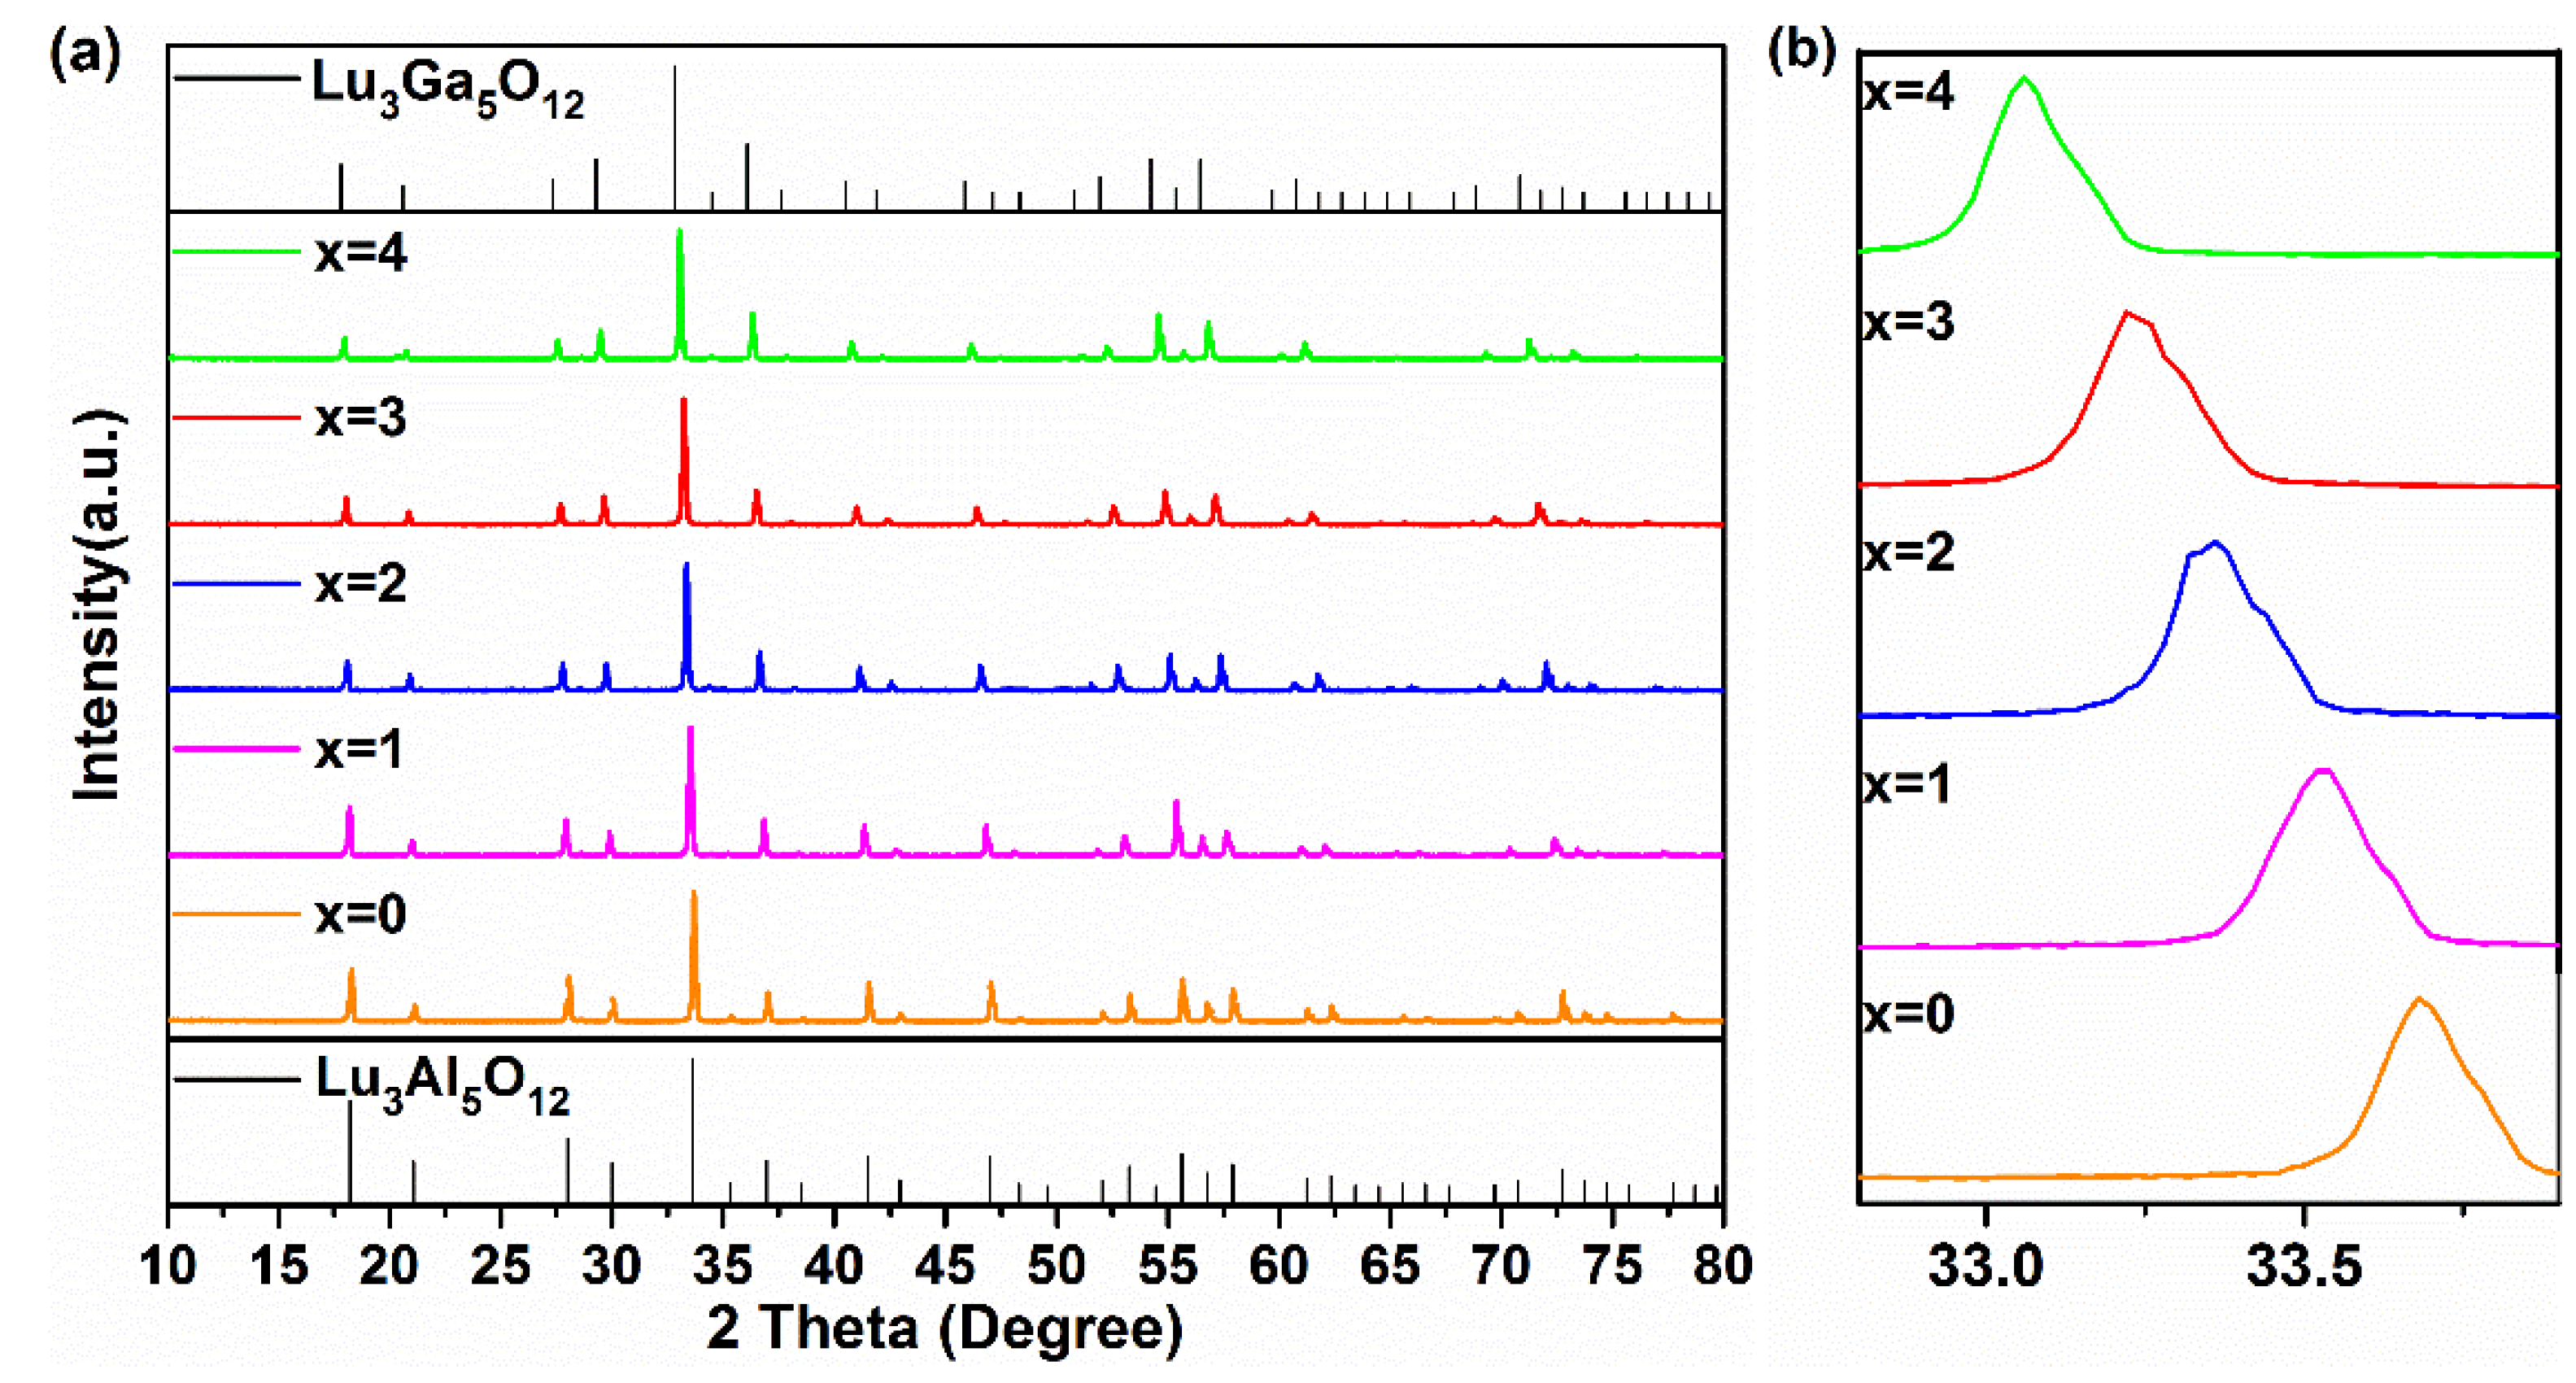
Figure 1a presents the XRD patterns of Lu2.94GaxAl5−xO12: 0.06Ce3+ (x = 0, 1, 2, 3, 4) synthesized at 1450 °C. All of these samples exhibited almost the same XRD patterns to that of the Lu3Al5O12 (LuAG, PDF#73-1368) pure phase. Since no impurities with other diffraction peaks were found in the figure, this indicated that the pure phase of these compounds could be successfully prepared due to the combined effect of the sintering process at 1450 °C/3 h (3 h) and co-solvents. With the increase in the Ga3+ content, the LuAGG: Ce3+ structure gradually evolved from Lu3Al5O12 to Lu3Ga5O12 (LuGG, Ga-PDF#73-1372).
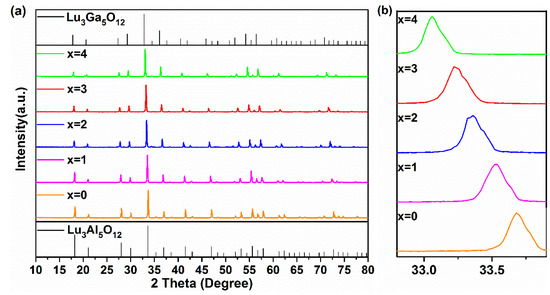
Figure 1.
(a) The XRD patterns and (b) enlarged XRD patterns around 33.5° of the Lu2.94GaxAl5−xO12: 0.06Ce3+ (x = 0–4) phosphors at 1450 °C for 3 h.
The detailed XRD patterns from 32.8° to 33.8° are depicted in Figure 1b. It is clear that the enlarged diffraction peaks belong to the (4 2 0) crystal face of the sample shifted to lower angles in the process of the increasing replacement of Ga3+ for Al3+ in the host, demonstrating that Ga(1)3+ (62 pm) and Ga(2)3+ (47 pm) had a bigger cationic radius instead of Al(1)3+ (53.5 pm), and Al(2)3+ (39 pm) entered the matrix of LuAG, resulting in lattice expansion.
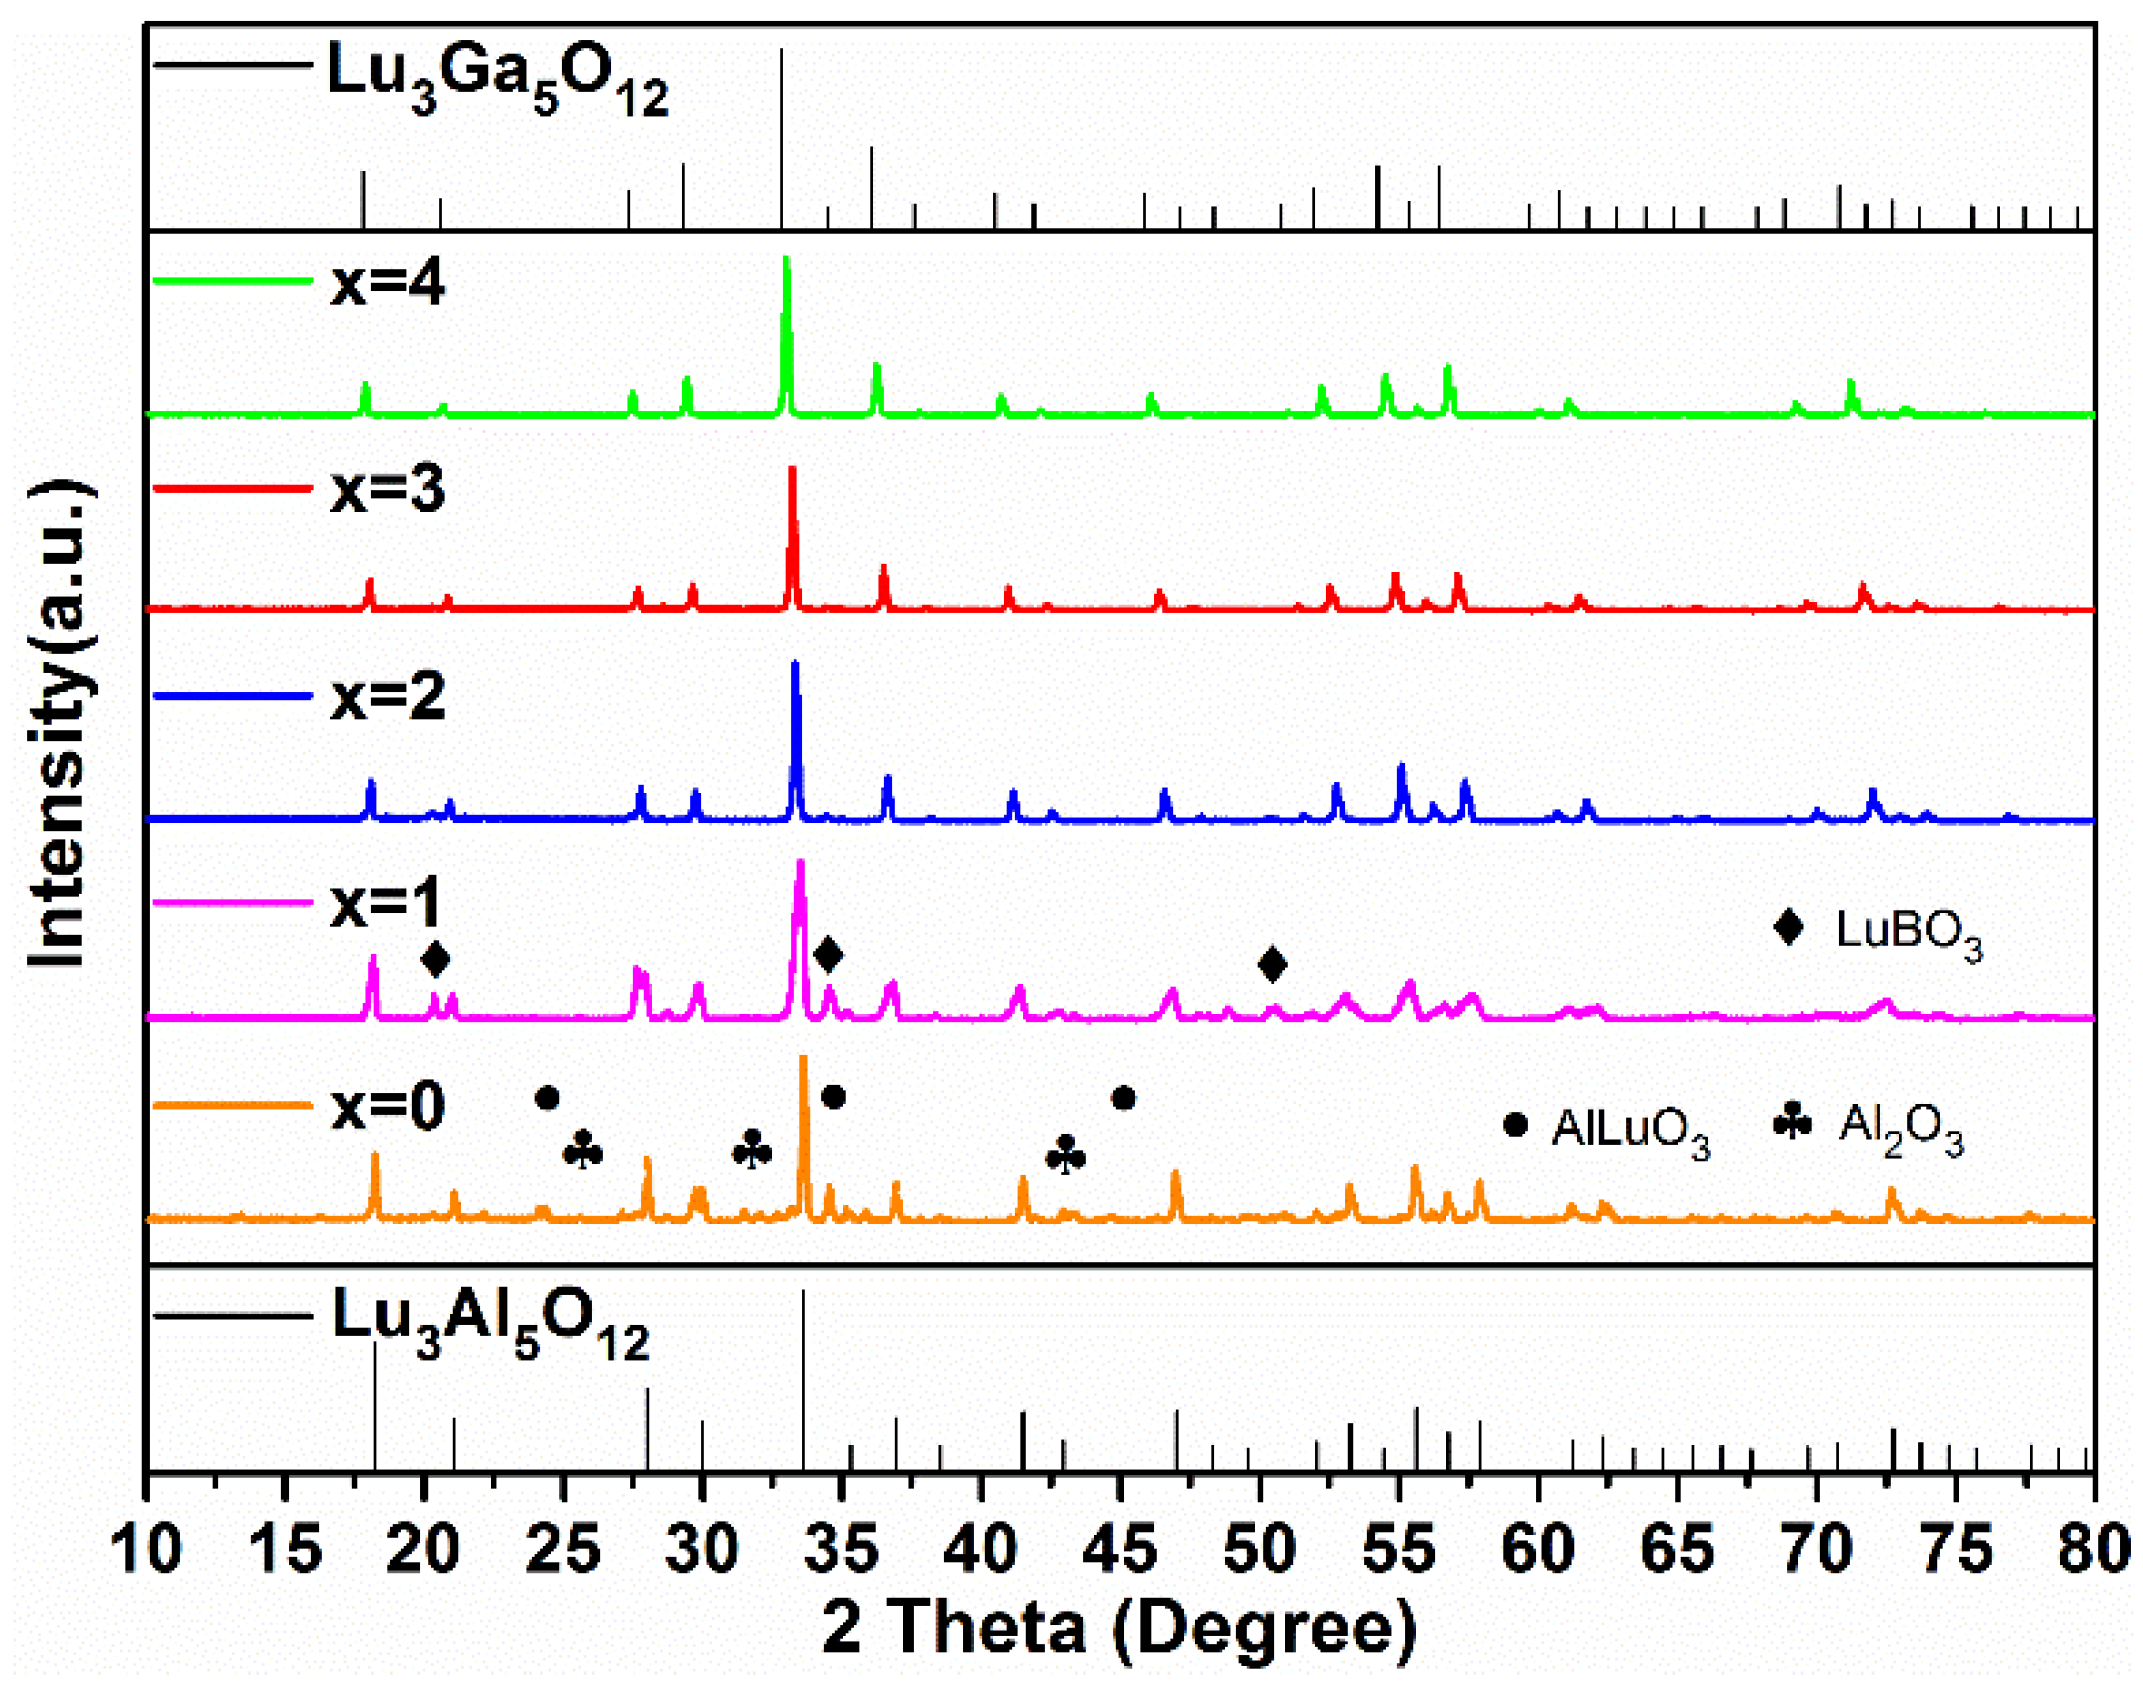
In order to further explore the possibilities of low energy consumption synthetic processes, the Lu2.94GaxAl5−xO12: 0.06Ce3+ samples with different Ga3+ concentrations (x = 0, 1, 2, 3, 4) were synthesized at 1350 °C for 3 h, whose XRD patterns are shown in Figure 2.
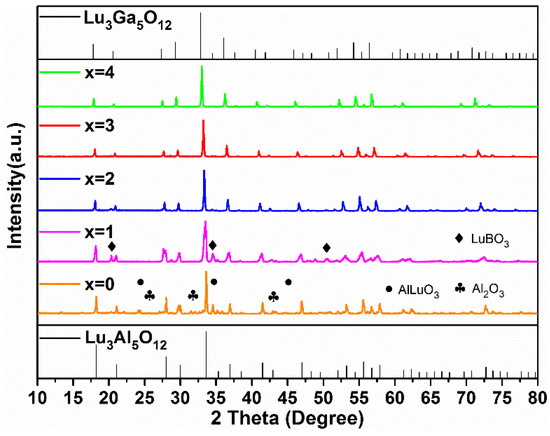
Figure 2.
The XRD patterns of the Lu2.94GaxAl5−xO12: 0.06Ce3+ (x = 0–4) phosphors synthesized at 1350 °C for 3 h.
As x ≥ 2, there were no diffraction peaks of the impurity phase in the XRD patterns. However, as x is less than 2, diffraction peaks of Al2O3 (PDF#46-1215, 74-1081), AlLuO3 (PDF#24-0690), and LuBO3 (PDF#74-1938) were found in the Lu2.94Al5O12: 0.06Ce3+ and Lu2.94GaAl4O12: 0.06Ce3+ phosphors. It is clearly indicated in the figure that the higher the Ga3+ concentration, the lower the formation temperature of the pure phase LuAGG becomes. The reason for this phenomenon can be explained by the bond dissociation energies. The value of the Ga-O pair (285 kJ/mol) was obviously less than that of the Al-O pair (512 kJ/mol). It can be concluded that Ga3+ ions are easier to combine with O2− ions, promoting the formation of a garnet structure at lower temperature. In contrast, when Al3+ ions completely replace Ga3+ in the raw material, a higher temperature is required to synthesize the Lu3Al5O12 pure phase.
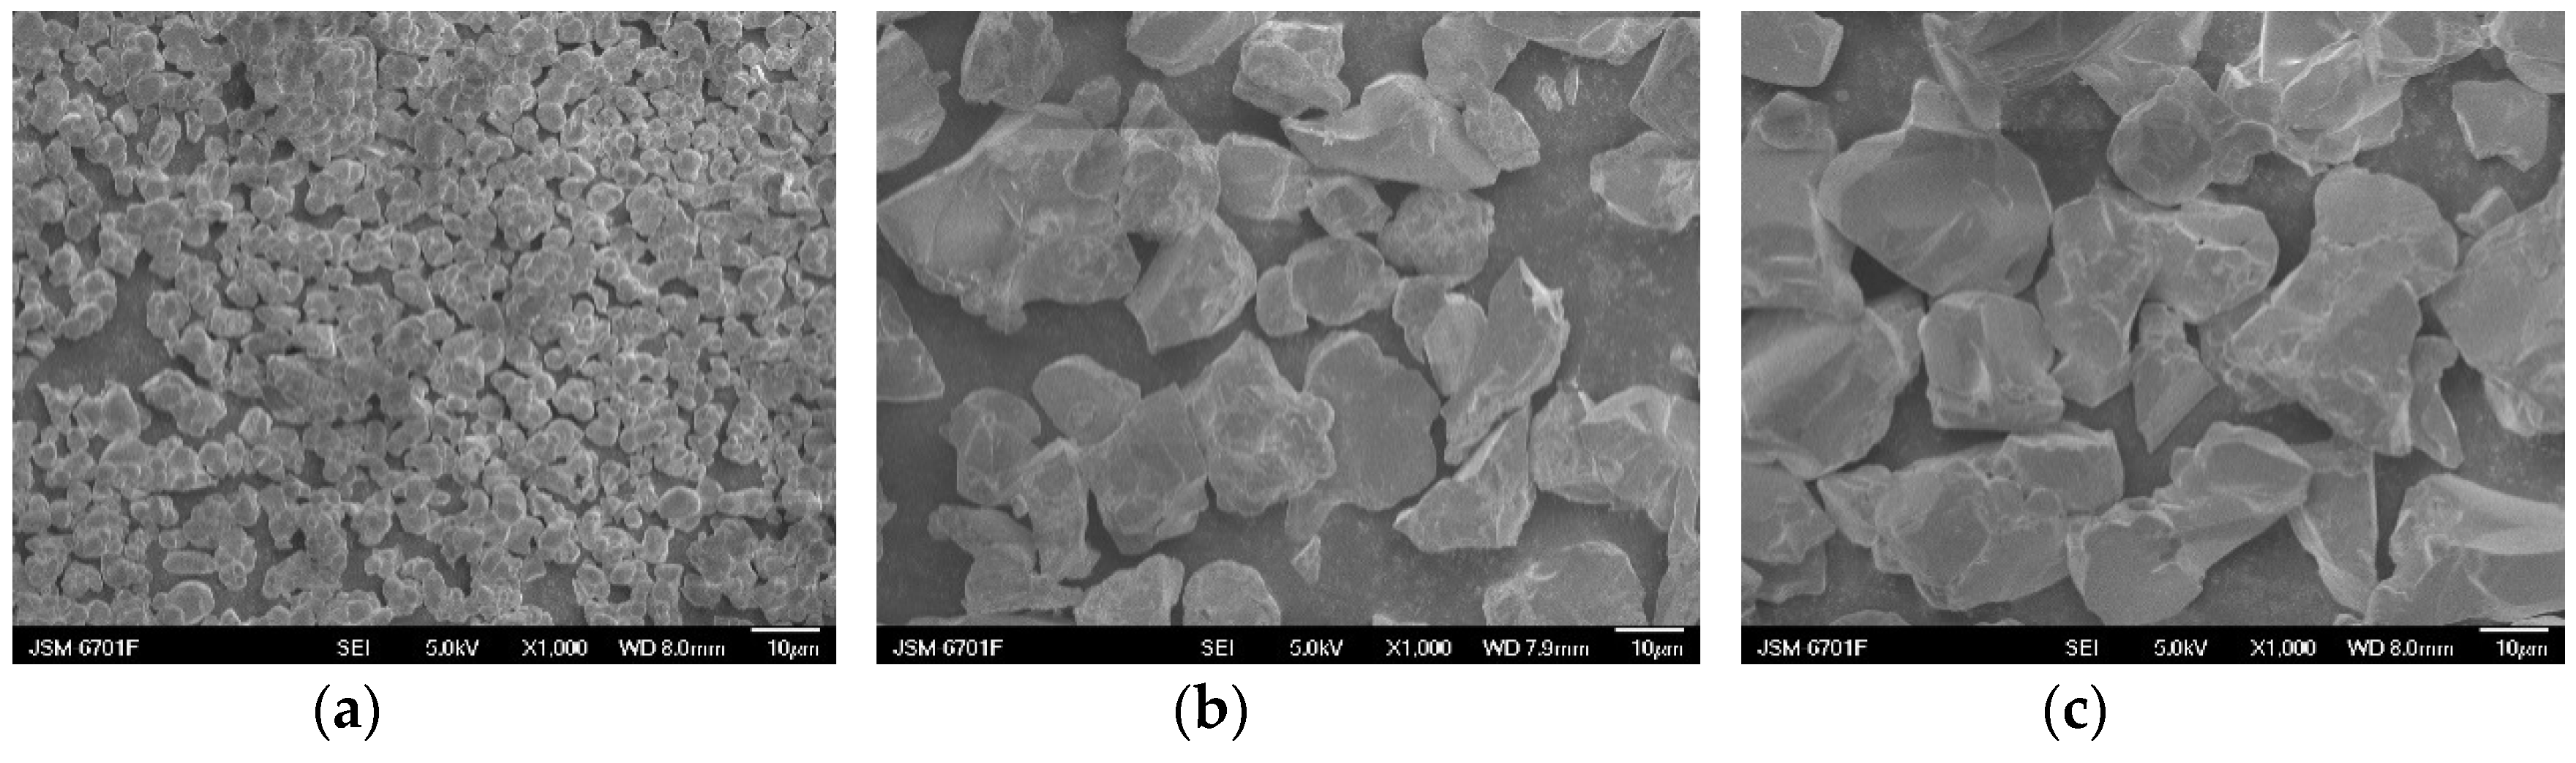
It is well-known that the size, crystallinity, and morphology of phosphor can affect its emission intensity. In this case, the SEM images of the Lu2.94Ga2Al3O12: 0.06Ce3+ phosphors sintered at 1350 °C, 1450 °C, and 1550 °C were exhibited in Figure 3. It can be observed from the figure that, as the temperature rises, the diameter range of the aggregated particle increased from 2–5 to 20–30 μm, and the morphology of the grain changed from an oval shape to an irregular shape. The reason for this phenomenon can be attributed to the increasing concentration of Ga3+ ions contributing to the decrease in the phase formation temperature. Furthermore, the size of the phosphor particles gradually grew with the increasing sintering temperature, and the sample shrank more seriously. Finally, it resulted in an increased hardness of the samples and led to fragmented crystal grains after grinding.
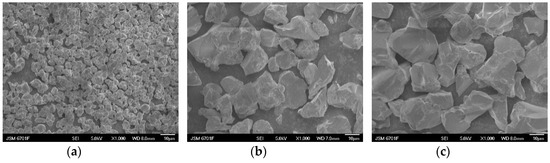
Figure 3.
The SEM images of the Lu3Ga2Al3O12: Ce3+ synthesized at (a) 1350 °C, (b) 1450 °C, and (c) 1550 °C for 3 h.
3.2. Photoluminescent Spectra
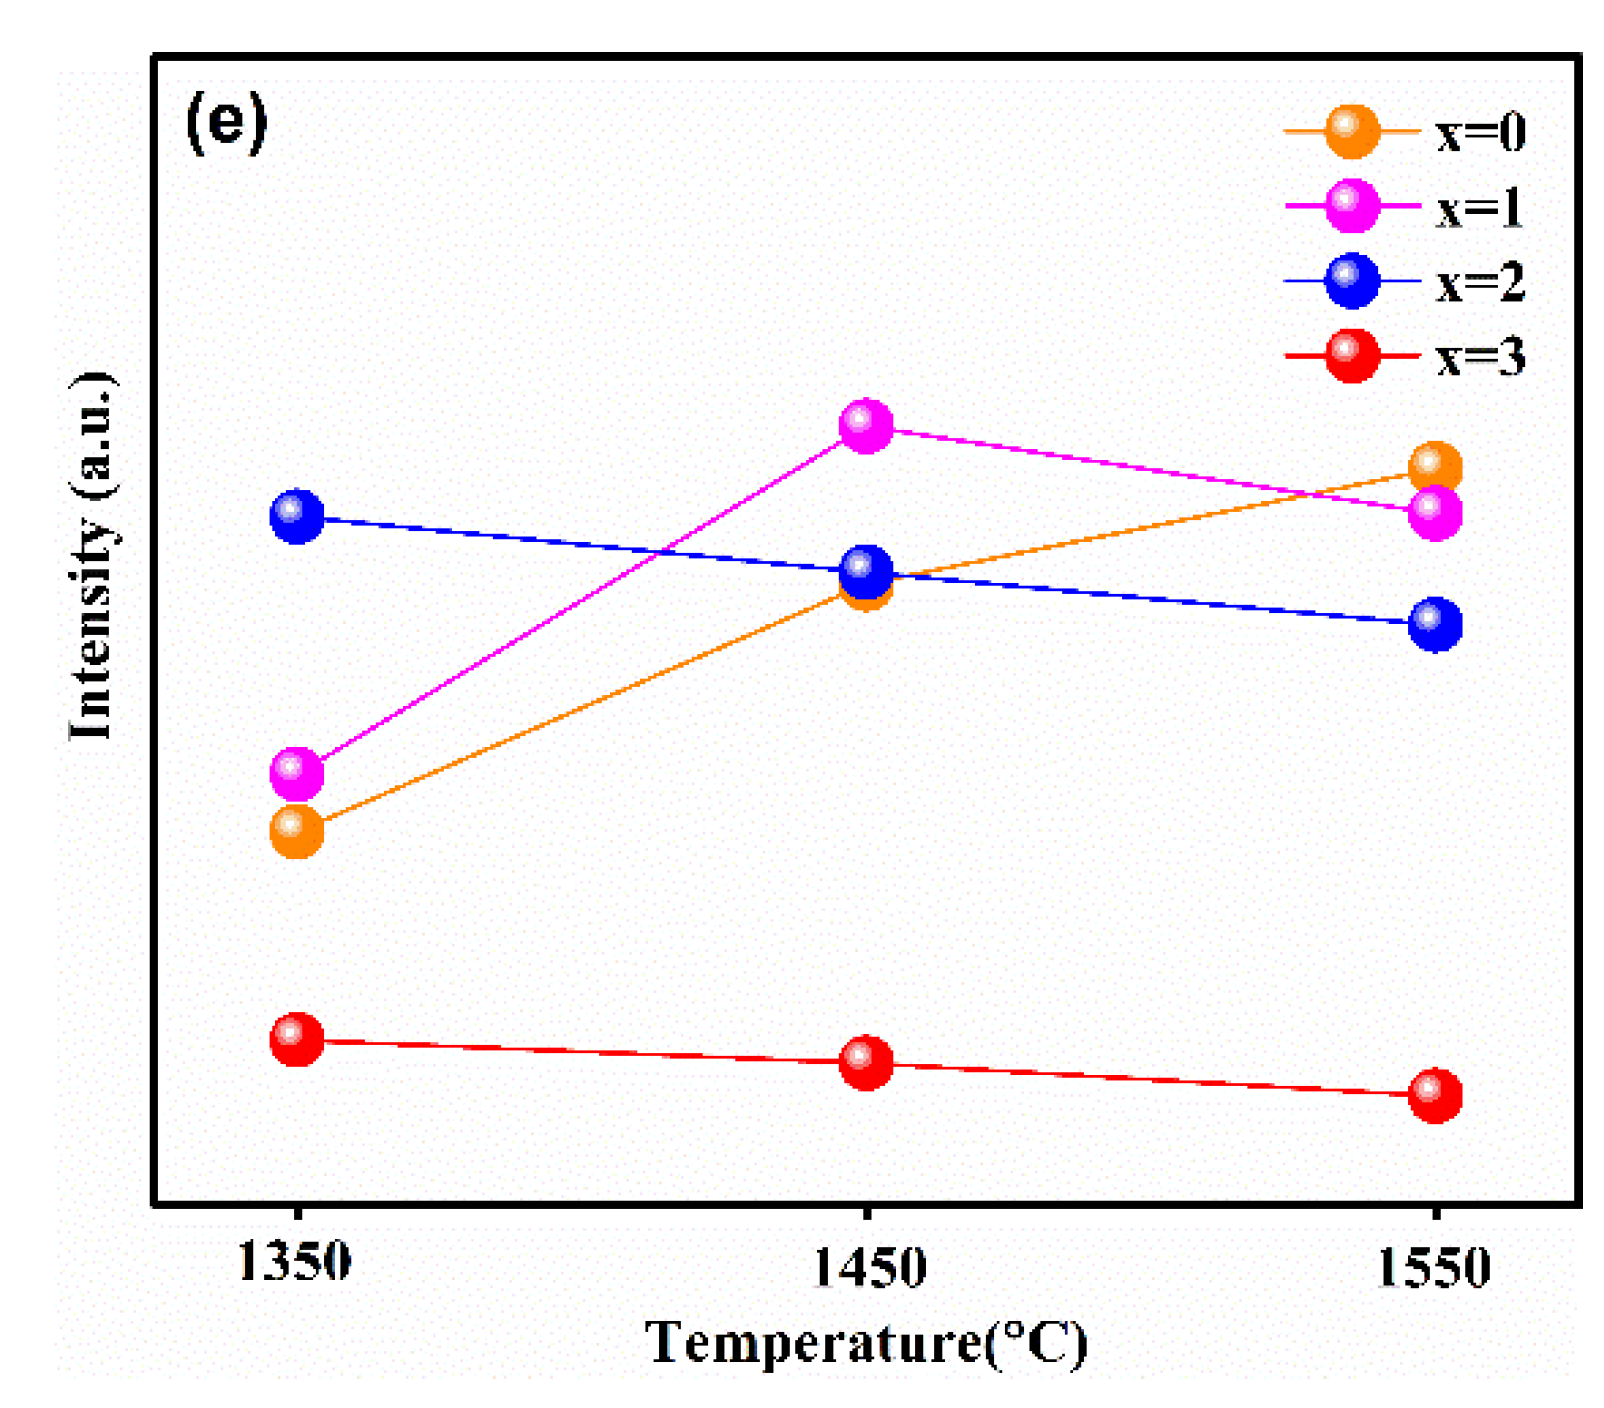
In order to reveal the relationship between the luminescence properties, the concentration of Ga3+ ions, and synthesis temperature, the PL and PLE spectra of the samples synthesized at different temperatures are recorded in Figure 4a–e. Figure 4e shows the relationship between the maximum emission intensity and sintering temperature at different Ga3+ concentrations. It can obviously be observed that the variation trend in the maximum emission intensity of samples with different Ga3+ concentrations with the increasing temperature was different. Furthermore, when the synthetic temperature was at 1550 °C, the emission intensity of sample with x = 0 was the strongest one relative to other Ga3+ concentrations of the samples; x = 1 was strongest at 1450 °C, and x = 2 was strongest at 1350 °C.
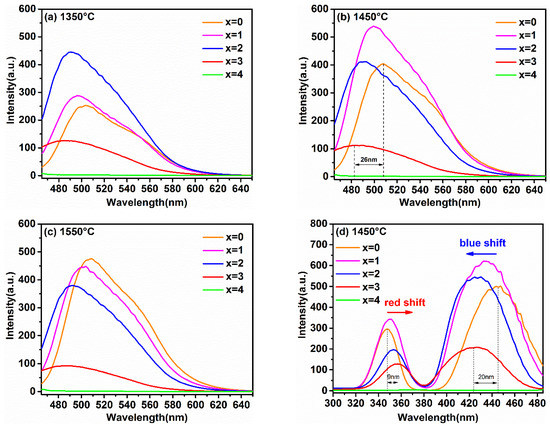
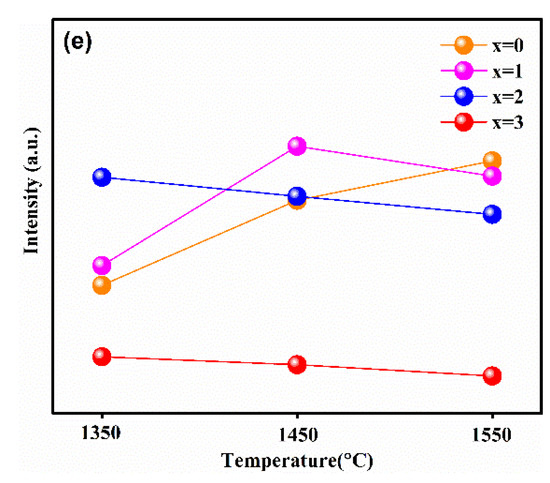
Figure 4.
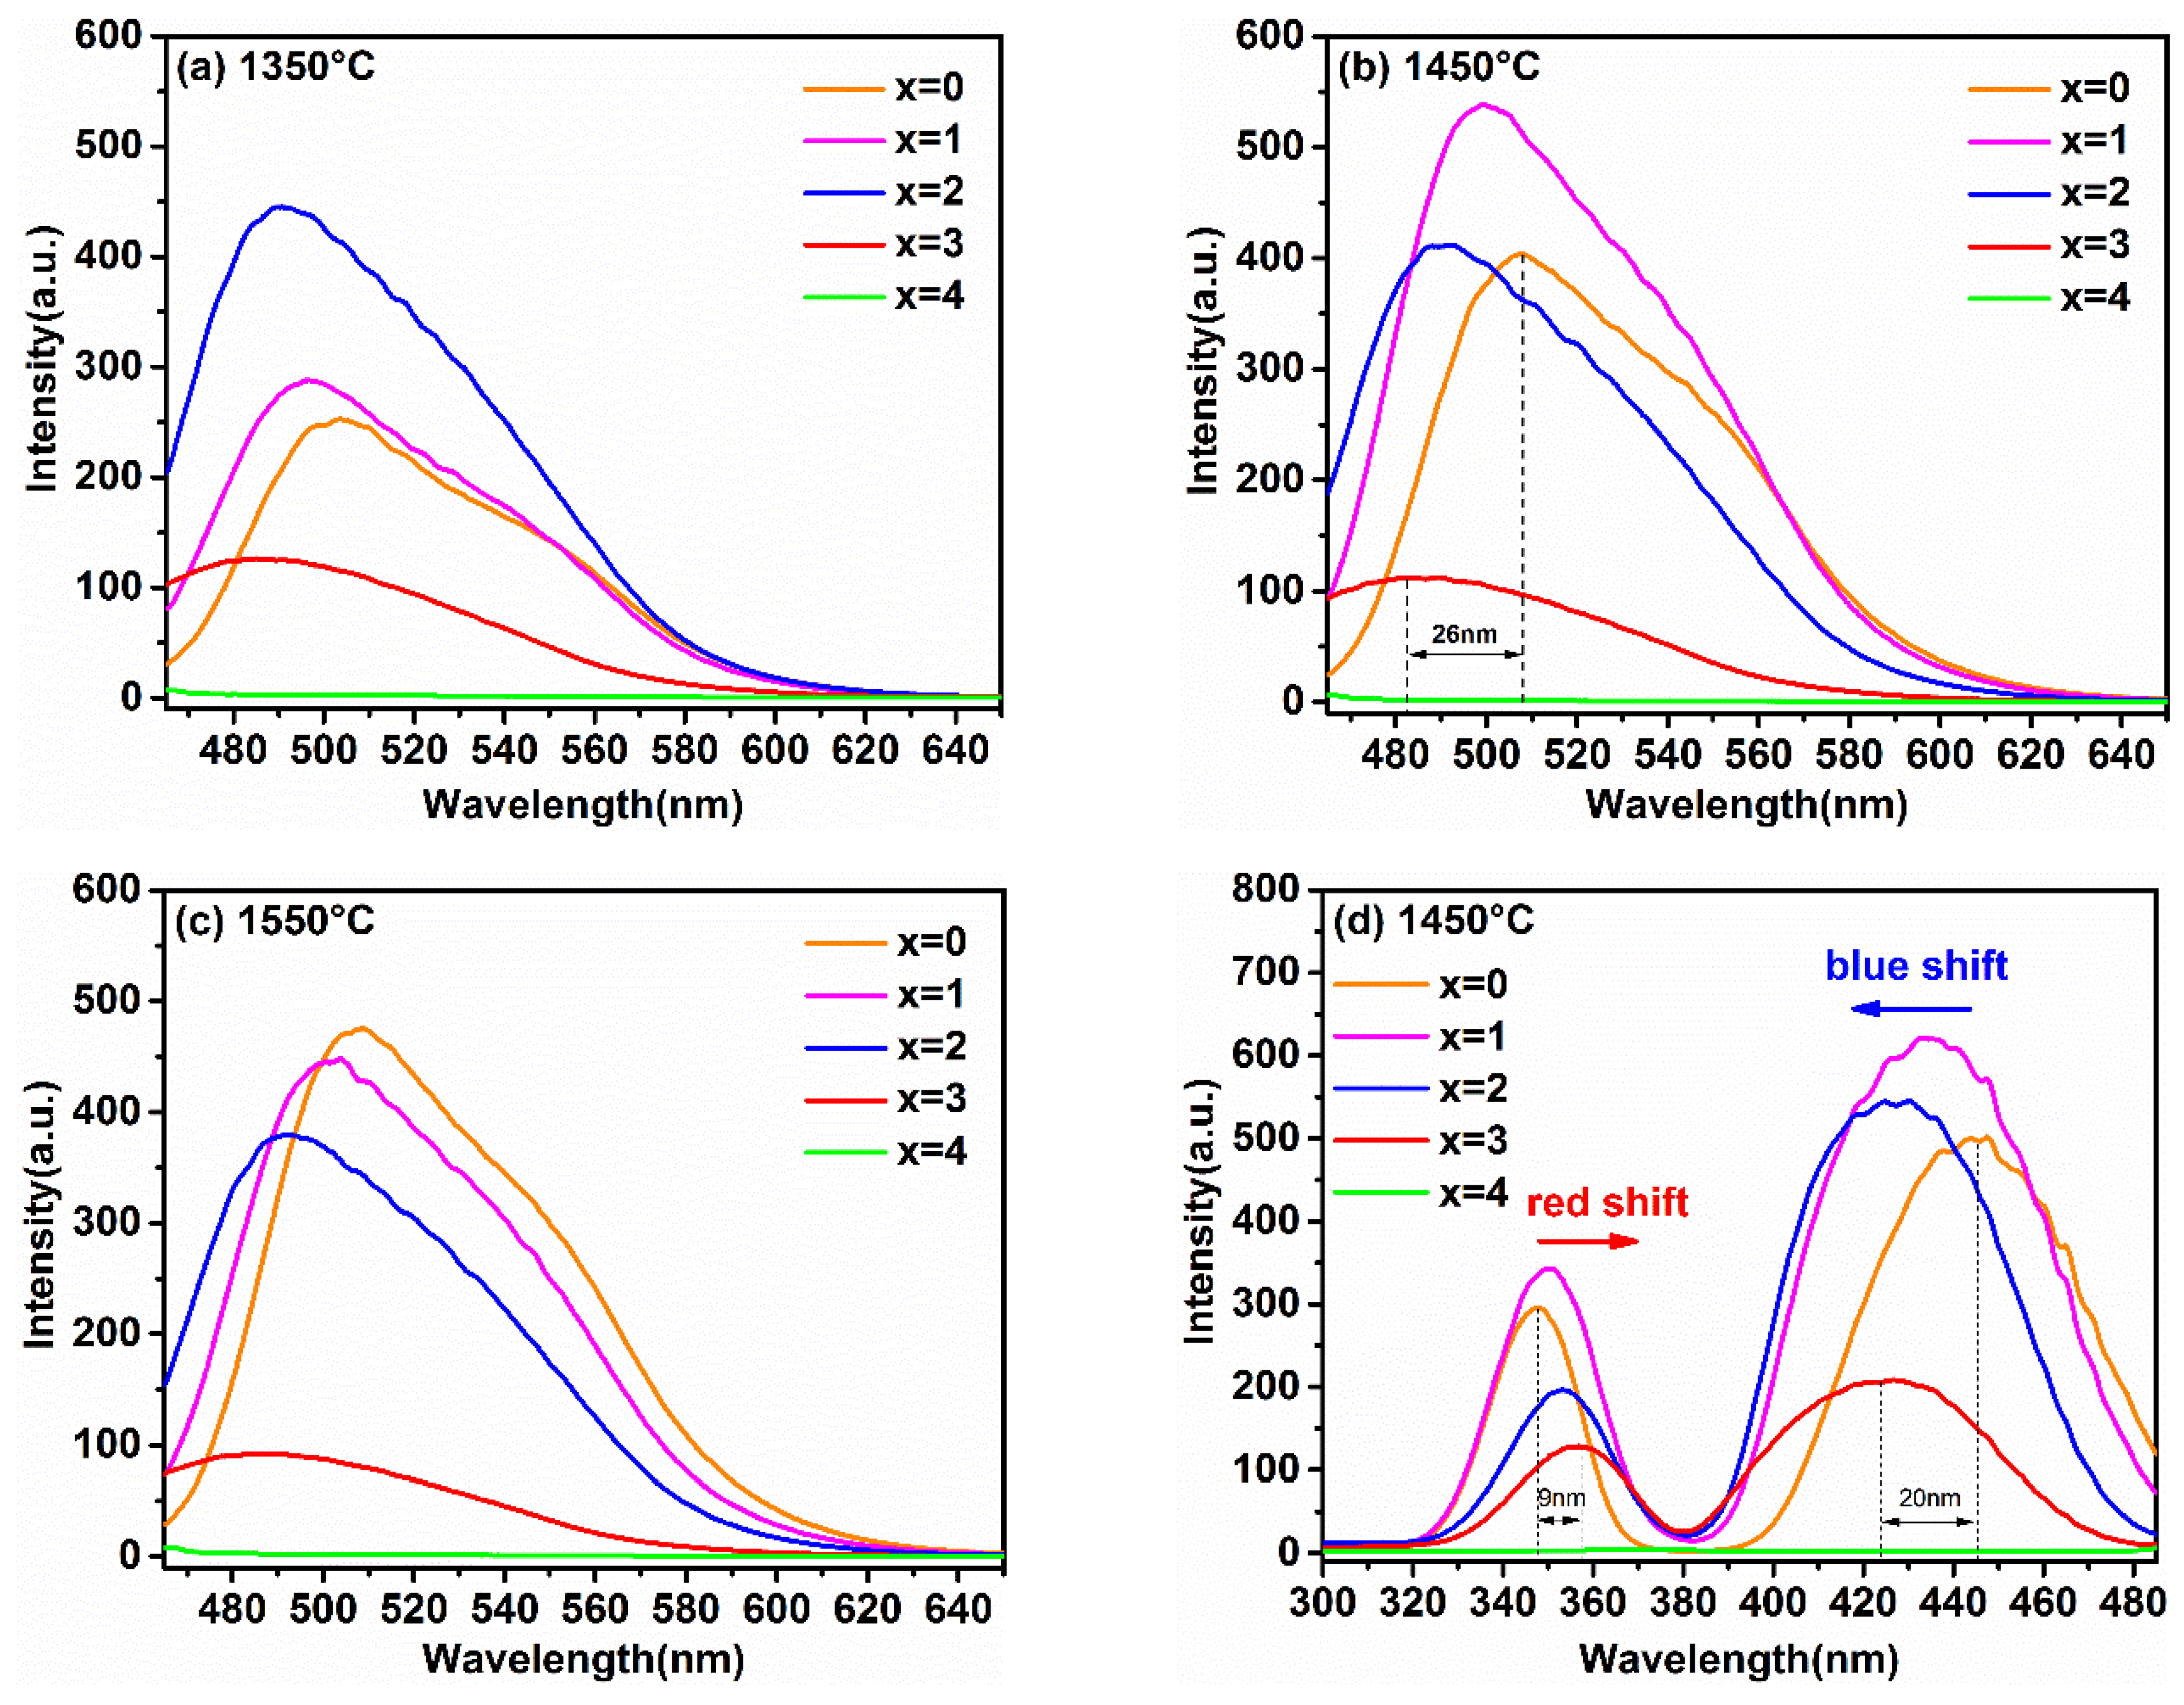
The emission spectra (λex = 450 nm) of Lu3GaxAl5−xO12: Ce3+ (x = 0, 1, 2, 3, 4) at (a) 1350 °C, (b) 1450 °C, (c) 1550 °C, (d) the excitation spectra (λem = 500 nm) of samples synthesized at 1450 °C and (e) the relationship of the maximum emission intensity versus the sintering temperature at different Ga3+ concentrations.
This phenomenon is consistent with the analysis on the crystal structure and micro-morphology. Generally, after exceeding the phase-forming temperatures, the emission intensity becomes stronger with the increasing particle size and sintering temperature. In general, the defect-free particles of phosphors with spherical or nearly spherical shape exhibit a superior emission intensity. The emission intensity of the as-prepared phosphors reached its maximum at the just phase forming temperature. Subsequently, with the increase in Ga3+ ion concentration, the phase formation temperature point decreases, resulting in the increase in particle aggregation at the same sintering temperature. Finally, it causes the emission intensities to decrease gradually with the increase in the synthesis temperature.
As shown in Figure 4a–c, the PL spectra of the Lu3GaxAl5−xO12: Ce3+ phosphors excited at 450 nm displayed a gradual blue-shift with the increasing Ga3+ content. Although similar phenomena have also been found in previous studies of the luminescent properties of YAG: Ce3+ [13,14], few have been systematically researched for the effect of Ga3+ doping on the luminescent properties in LuAG: Ce3+ at different temperatures. As exhibited in Figure 4b, the variety of peak position in the emission spectra display from 508 nm to 482 nm was accompanied by the change of x from 0 to 3. The blue-shift offset was 26 nm. Based on the above results, it can be predicted that a series of Ga3+-substituted lutetium aluminum garnet will be excellent stuffing into the blue-green cavity of the emission spectrum around 490 nm, which is conducive to a high CRI. Furthermore, the full-width at half-maximum (FWHM) of the emission profile with the introduction of Ga3+ ions broadened a small amount from 75 nm (x = 0) to 79 nm (x = 3), which will also be helpful in obtaining a high quality illumination source in w-LED applications.
As illustrated in Figure 4d, monitored at the optimal emission, all of the PLE spectra with similar morphological characteristics included two broad absorption bands. These two broad bands, peaking around 350 nm and 430 nm, were assigned to the 4f→5d2,1 spin-allowed transition of the Ce3+ ions. By comparing these curves, it can be found that with the increase in the Ga3+ ion concentration, the higher energy excitation band (4f-5d2) and the lower energy excitation band (4f-5d1) moved toward each other gradually. This phenomenon for the spectral shift of PL and PLE can be determined by two possible factors: the crystal field splitting (CFS) and the nephelauxetic effect (NE) [13,21,22].
According to reports by Robertson et al., the degree of crystal field splitting (Dq) can be defined as follows [23]:
where Dq represents the degree of energy level separation; Z is the charge of anion; e is the charge of electron; r is the radius of the d wavelength; and R is the bond length between the activator and coordination ion. As we know, a garnet-type structure with the chemical formula A3B2C3O12 consists of three different structures: AO8 (distorted dodecahedral), BO6 (octahedral), and CO4 (tetrahedral) framework. Ascribed to the larger cationic radius of Ga3+ ions than Al3+ ions, the cell parameters and cell volume (V) will increase with the replacement of Al3+ by Ga3+ at the tetrahedral and octahedral sites. This means that the bond distance (RCe−O) will become longer when Ce3+ ions enter the Lu3+ site. It can be inferred from the inverse proportional formula between Dq and R that the decrease in the crystal field intensity will cause the emission wavelength to move to the high-energy region, resulting in a continuous blue-shift of the PL spectra.
In addition, the positive correlation exists between the centroid shift (εc) of the Ce3+ 5d levels and the anion polarizability (αsp) based on the reports of Morrison and Dorenbos [19,20]. The anion polarizability in Ce3+ doped oxide compounds can be estimated by the following equation [24,25],
Meanwhile, the αsp is affected by the joint action of the average electronegativity χav of the cations in the host:
where χi denotes the electronegativity of cation i with formal charge zi; Nc represents the summation over all cations in the compound; Na and γi stand for the number and the formal negative charge of the anion in the formula, respectively. By Plugging Pauling-type electronegativity values in Equation (3), the values of χav were calculated to be 1.483, 1.508, 1.533, 1.558, and 1.583 in Lu2.94GaxAl5−xO12: 0.06Ce3+ for x = 0, 1, 2, 3, and 4, respectively. Based on Equation (2), the increasing χav will lead to the decrease in the anion polarizability αsp. As a result, the centroid of the Ce3+ 5d levels shift to a higher-energy position, resulting in a gradual blue-shift of the emission and excitation bands with the increase in the Ga3+ ion concentration from 0 to 4.
Figure 4d also shows that the 4f–5d1 excitation band of Lu2.94Ga3Al2O12: 0.06Ce3+ exhibited a larger blue-shift (20 nm), while the 4f–5d2 excitation band showed a smaller redshift (9 nm) compared to the excitation spectral band of Lu2.94Al5O12: 0.06Ce3+. Similar phenomena have been found in other research, but have been rarely mentioned [11,19]. This phenomenon of spectral shift caused by Ga3+ doping in Re3Al5O12:Ce3+ host (Re = Lu, Y) can be explained by the combined effects of CFS and NE. The experimental results combined with previous studies are listed in Table 1 [13,18,19,20]. It can be seen that a larger shift (represented by ↑↑) of the excitation band, which was attributed to the elevated energy level, was co-promoted by CFS and NE. The contradictory role of CFS and NE on the energy level led to a slighter shift (represented by ↓) of the excitation band. Meanwhile, this result also illustrates that CFS plays a more significant role than that of the increase in NE in the phosphors that are activated by Ce3+.

Table 1.
The relationship between CFS/NE and energy levels of LuAG: Ce3+, Lu3(Mg,Si)3Al2O12: Ce3+, Lu3Ga3Al2O12: Ce3+, YAG: Ce3+, and Y3Ga3Al2O12: Ce3+ phosphors. “0” represents the initial position of energy levels, “↑” and “↓” represent the increase and decrease of energy levels, respectively.
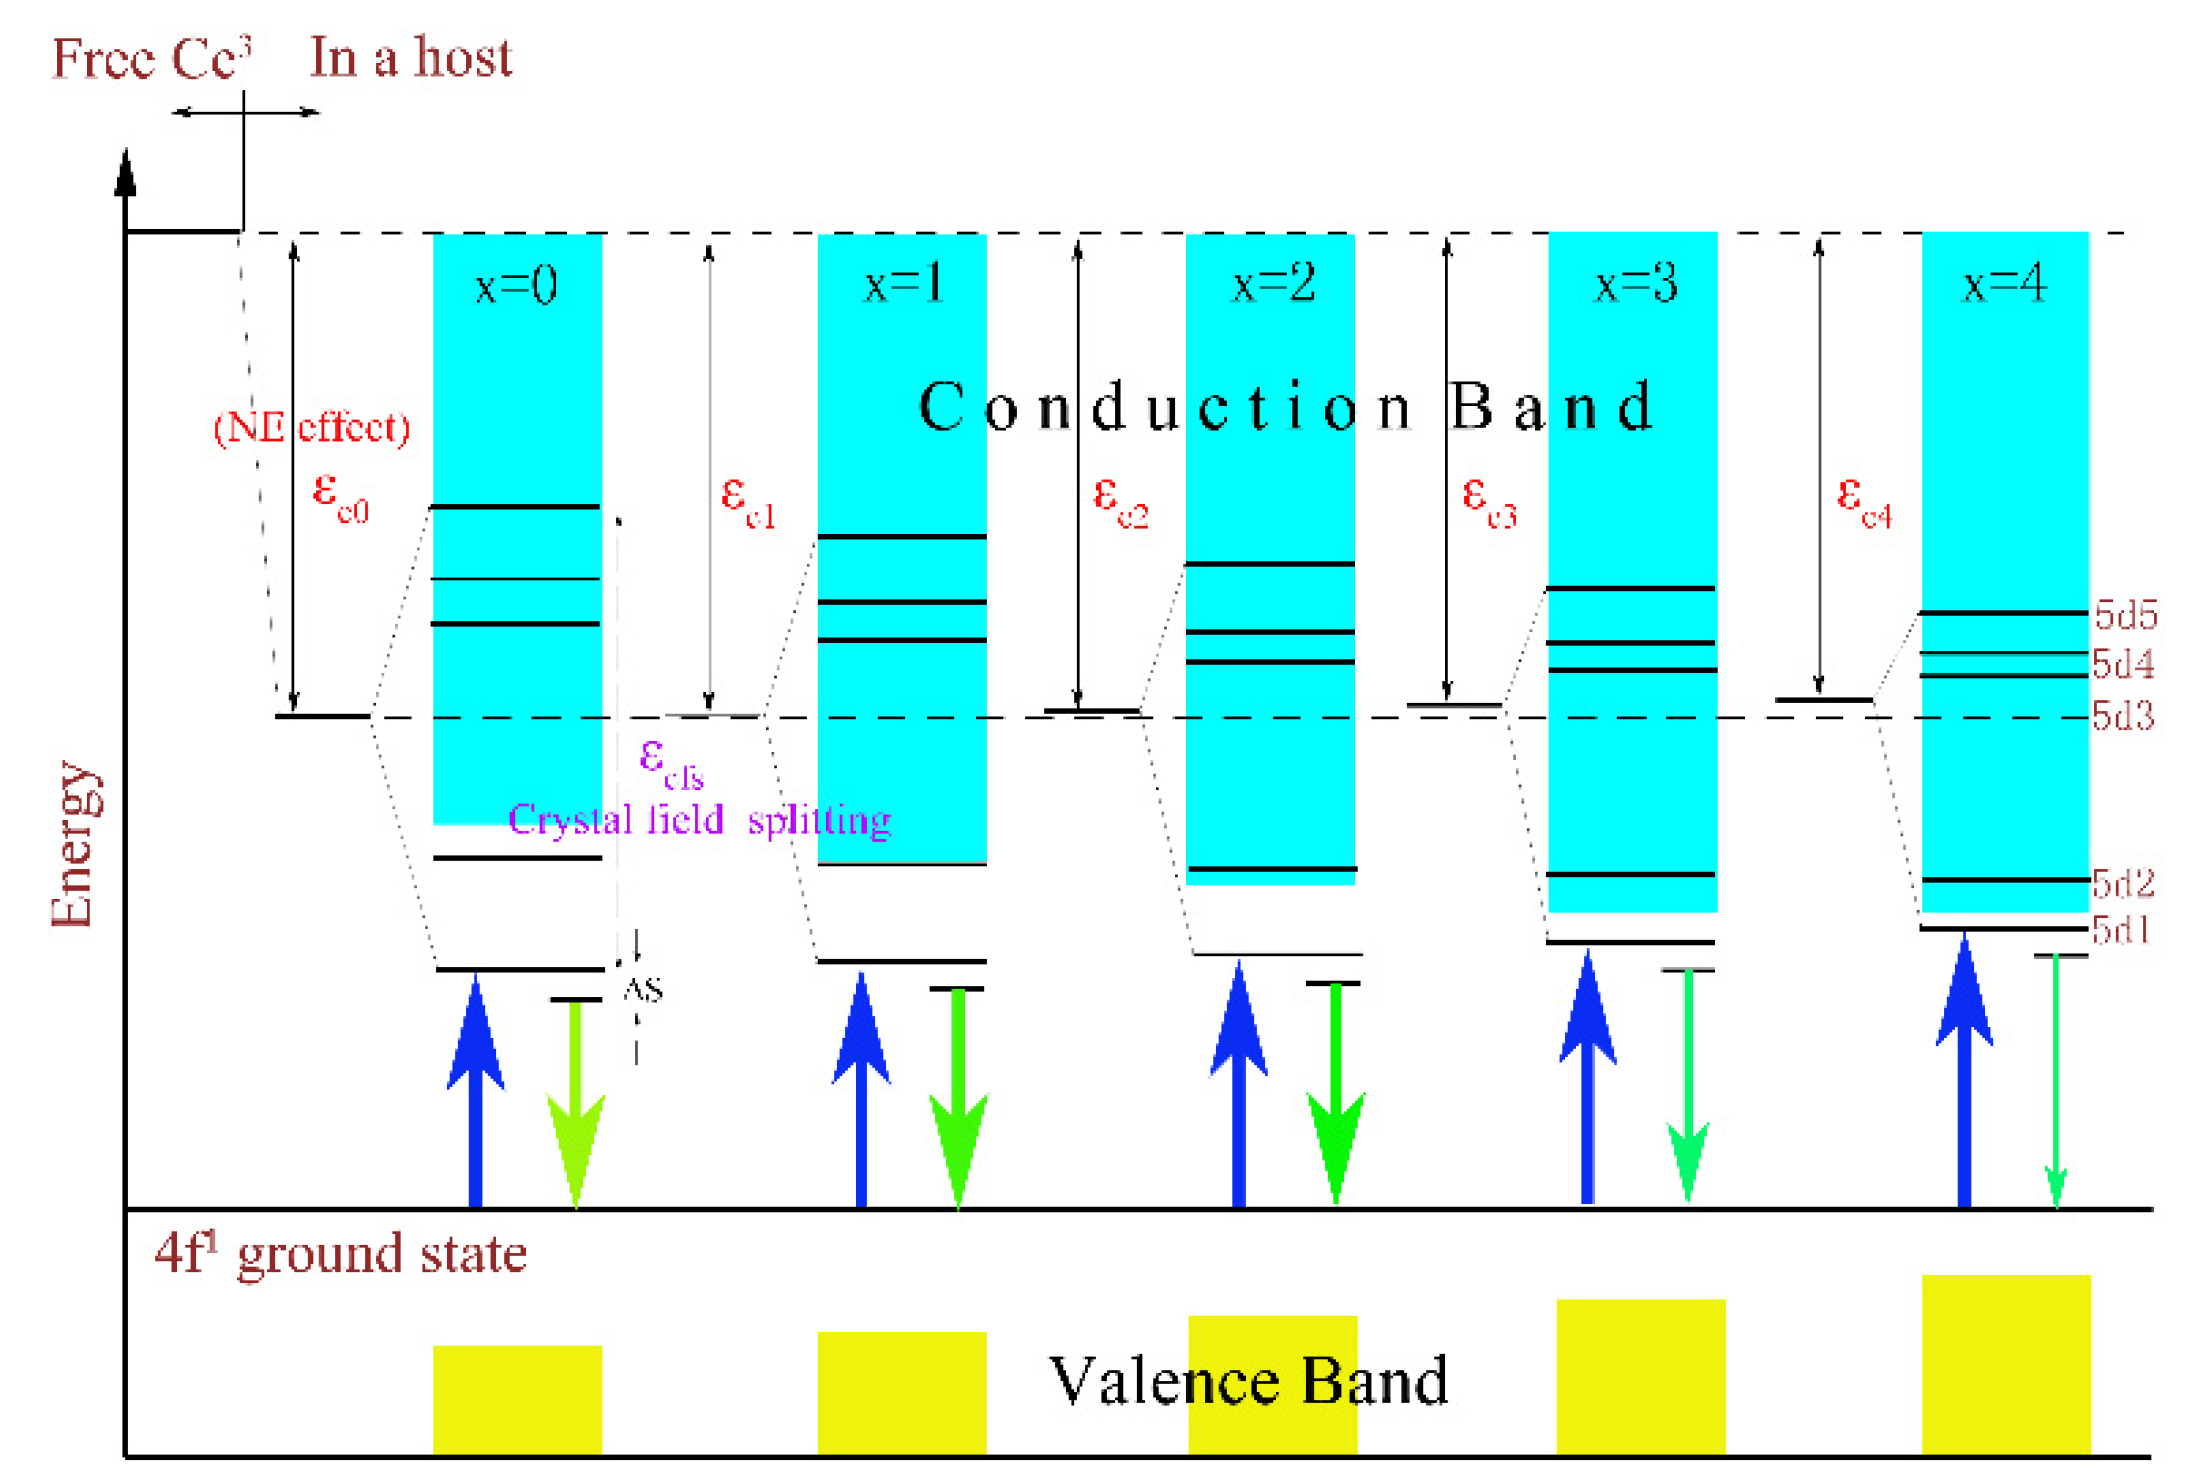
In addition, a clear evolutionary trend could also be observed in Figure 4 where the PL and PLE intensities of the samples with the increase in x gradually weakened and even emitted no radiation (as x = 4). The thermoelectric ionization model can be used to explain this phenomenon. According to previous studies [26], the valence band energy EV rose from −9.6 eV for Lu3Al5O12 to −9.0 eV for Lu3Ga5O12, but the conduction band energy EC declined from −1.7 eV to −2.5 eV. As a result, with the increase in the Ga3+ ion content, the 5d1 level will gradually approach the conduction band, and the 5d2 level will even enter the conduction band. Namely, the energy gap between the conduction band and the lowest energy of the 5d excited state of the host lattice will be reduced. This result enhances the probability of thermal ionization, and ultimately leads to a reduction in the emission intensity. The schematic diagram is described in Figure 5.

Figure 5.
The effects of CFS and NE on the energy levels of the Lu2.94GaxAl5−xO12: 0.06Ce3+ (x = 0, 1, 2, 3, 4) phosphors and its ionization processes.
In summary, the luminescence intensity of samples was determined by the synthesis temperature and energy gap. For one thing, the increasing sintering temperature will result in the aggregation of particles in Lu3GaxAl5−xO12: Ce3+, which will worsen the emission strength after grinding; for another, the energy gap between the conduction band and the lowest energy of the 5d excited state of host lattice is reduced with the increase in the Ga3+ concentration as it forces enormous excited electrons into entering the conduction band and leads to the poor or even non-luminous intensity.
3.3. Temperature Dependence Luminescence Intensity
When w-LEDs are in service, ambient temperatures of phosphors can typically reach 150 °C. In order to ensure the high energy efficiency and color stability of w-LEDs, the excellent thermal stability of phosphor is a crucial performance parameter. The temperature dependence of the normalized emission intensity for the Lu2.94GaxAl5−xO12: Ce3+0.06 (x = 0, 1, 2, 3) phosphors at T = 30–225 °C are shown in Figure 6. Lu2.94Ga4AlO12: Ce3+0.06 is not shown in the figure as it had almost no luminous properties. Statistical error of the thermal quenching measurement equipment was estimated as error bars.
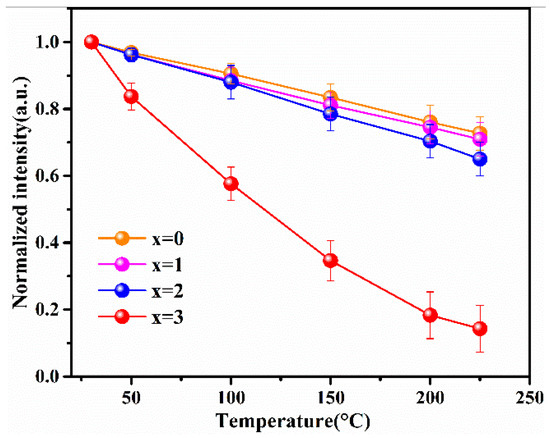
Figure 6.
The thermal quenching behavior in the Lu3GaxAl5−xO12: Ce3+ (x = 0, 1, 2, 3) phosphors sintered at 1450 °C.
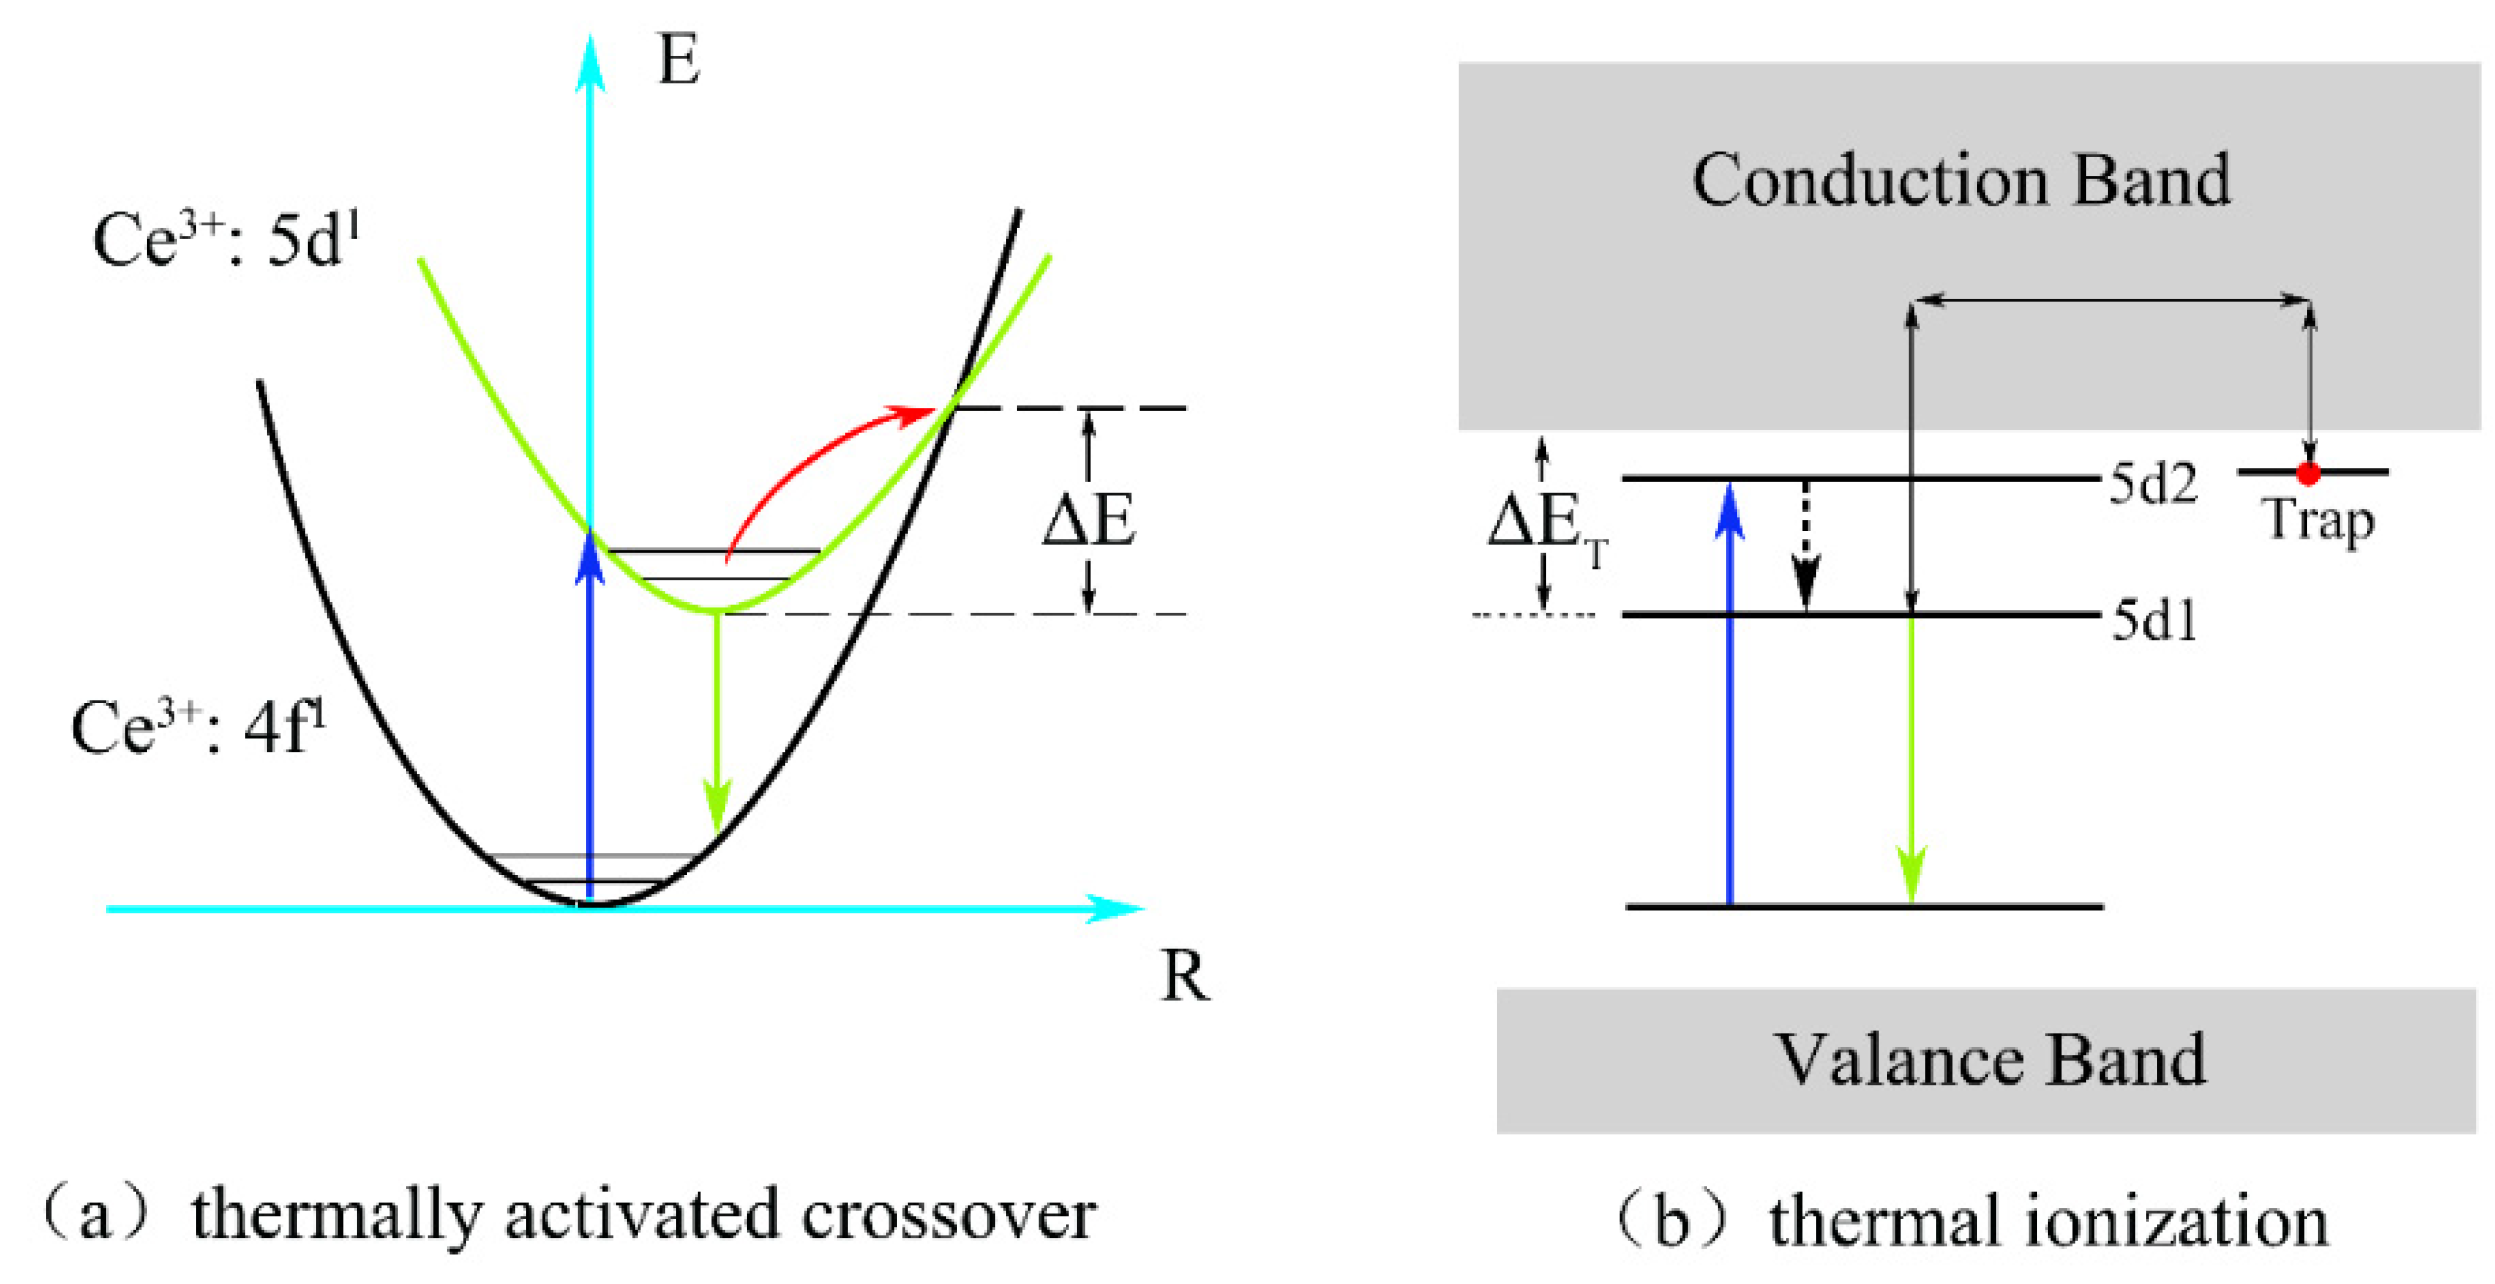
As can be observed in the figure, the integrated normalized emission intensity of the phosphors exhibited a quite monotonic decrease with the increase in the ambient temperature. Meanwhile, as the Ga3+ ion concentration increased, the normalized emission intensity tended to decrease, indicating that the thermal stability gradually deteriorated. It can also be observed that when the temperature was measured at 150 °C, the emission intensities of these samples dropped to 83%, 81%, and 79% of the initial value (25 °C), demonstrating an excellent stability against the thermal quenching of x = 0, 1, and 2, respectively. However, the emission intensity declined sharply as x = 3 with the rising temperature. The reason for this phenomenon is the gradual intensification of the interaction between the phonons and electrons with increasing temperature, leading to an increase in the probability of non-radiative transition. As a widely accepted theory, the thermally activated crossover mechanism is used to explain the weakening in thermal stability of Ga3+-doped phosphor. As shown in Figure 7a, excited electrons with sufficient thermal activation energy(ΔE) can pass through the cross-relaxation point between the 5d1 level and 4f level, and return relatively easily to the ground state with the increasing temperature in a non-radiative relaxation manner. However, according to the spectral analysis results, with the increase in the Ga3+ ion concentration, the blue-shift phenomenon of the emission spectrum indicates that the Stokes shift will decrease, which will lead to the increase in the ΔE value. In general, the thermal stability of phosphor with a larger value of ΔE will improve rather than deteriorate. However, this theory and its conjectures are contrary to the experimental results of thermal quenching. Herein, it can be inferred that the thermally activated crossover mechanism is not the dominant factor influenced on the thermal quenching of the system. Therefore, the thermal ionization mechanism was used to elaborate this abnormal thermal quenching phenomenon.

Figure 7.
(a) The thermally activated crossover and (b) thermal ionization model for the thermal quenching.
As shown in Figure 7b, the energy gap (ΔET) for the thermal ionization process, which is between the conduction band and the lowest energy of the 5d excited state, will narrow with the increase in the Ga3+ ion concentration. It can be inferred that the probability of 5d electrons enter into the conduction band based on thermal fluctuation will become more obvious with the increase in temperature. Hence, compared to the thermally activated crossover process, thermal ionization is more likely to cause non-radiative transition of 5d1 level electrons in the excited state and explains the reason quite well as to why there was a sudden deterioration phenomenon of thermal stability from x = 2 to 3. Therefore, the thermal ionization process, instead of the thermally activated crossover process, becomes the main reason for the strong thermal quenching for Lu2.94GaxAl5−xO12: Ce3+0.06 with the increase in the Ga3+ content.
3.4. Packaging Test
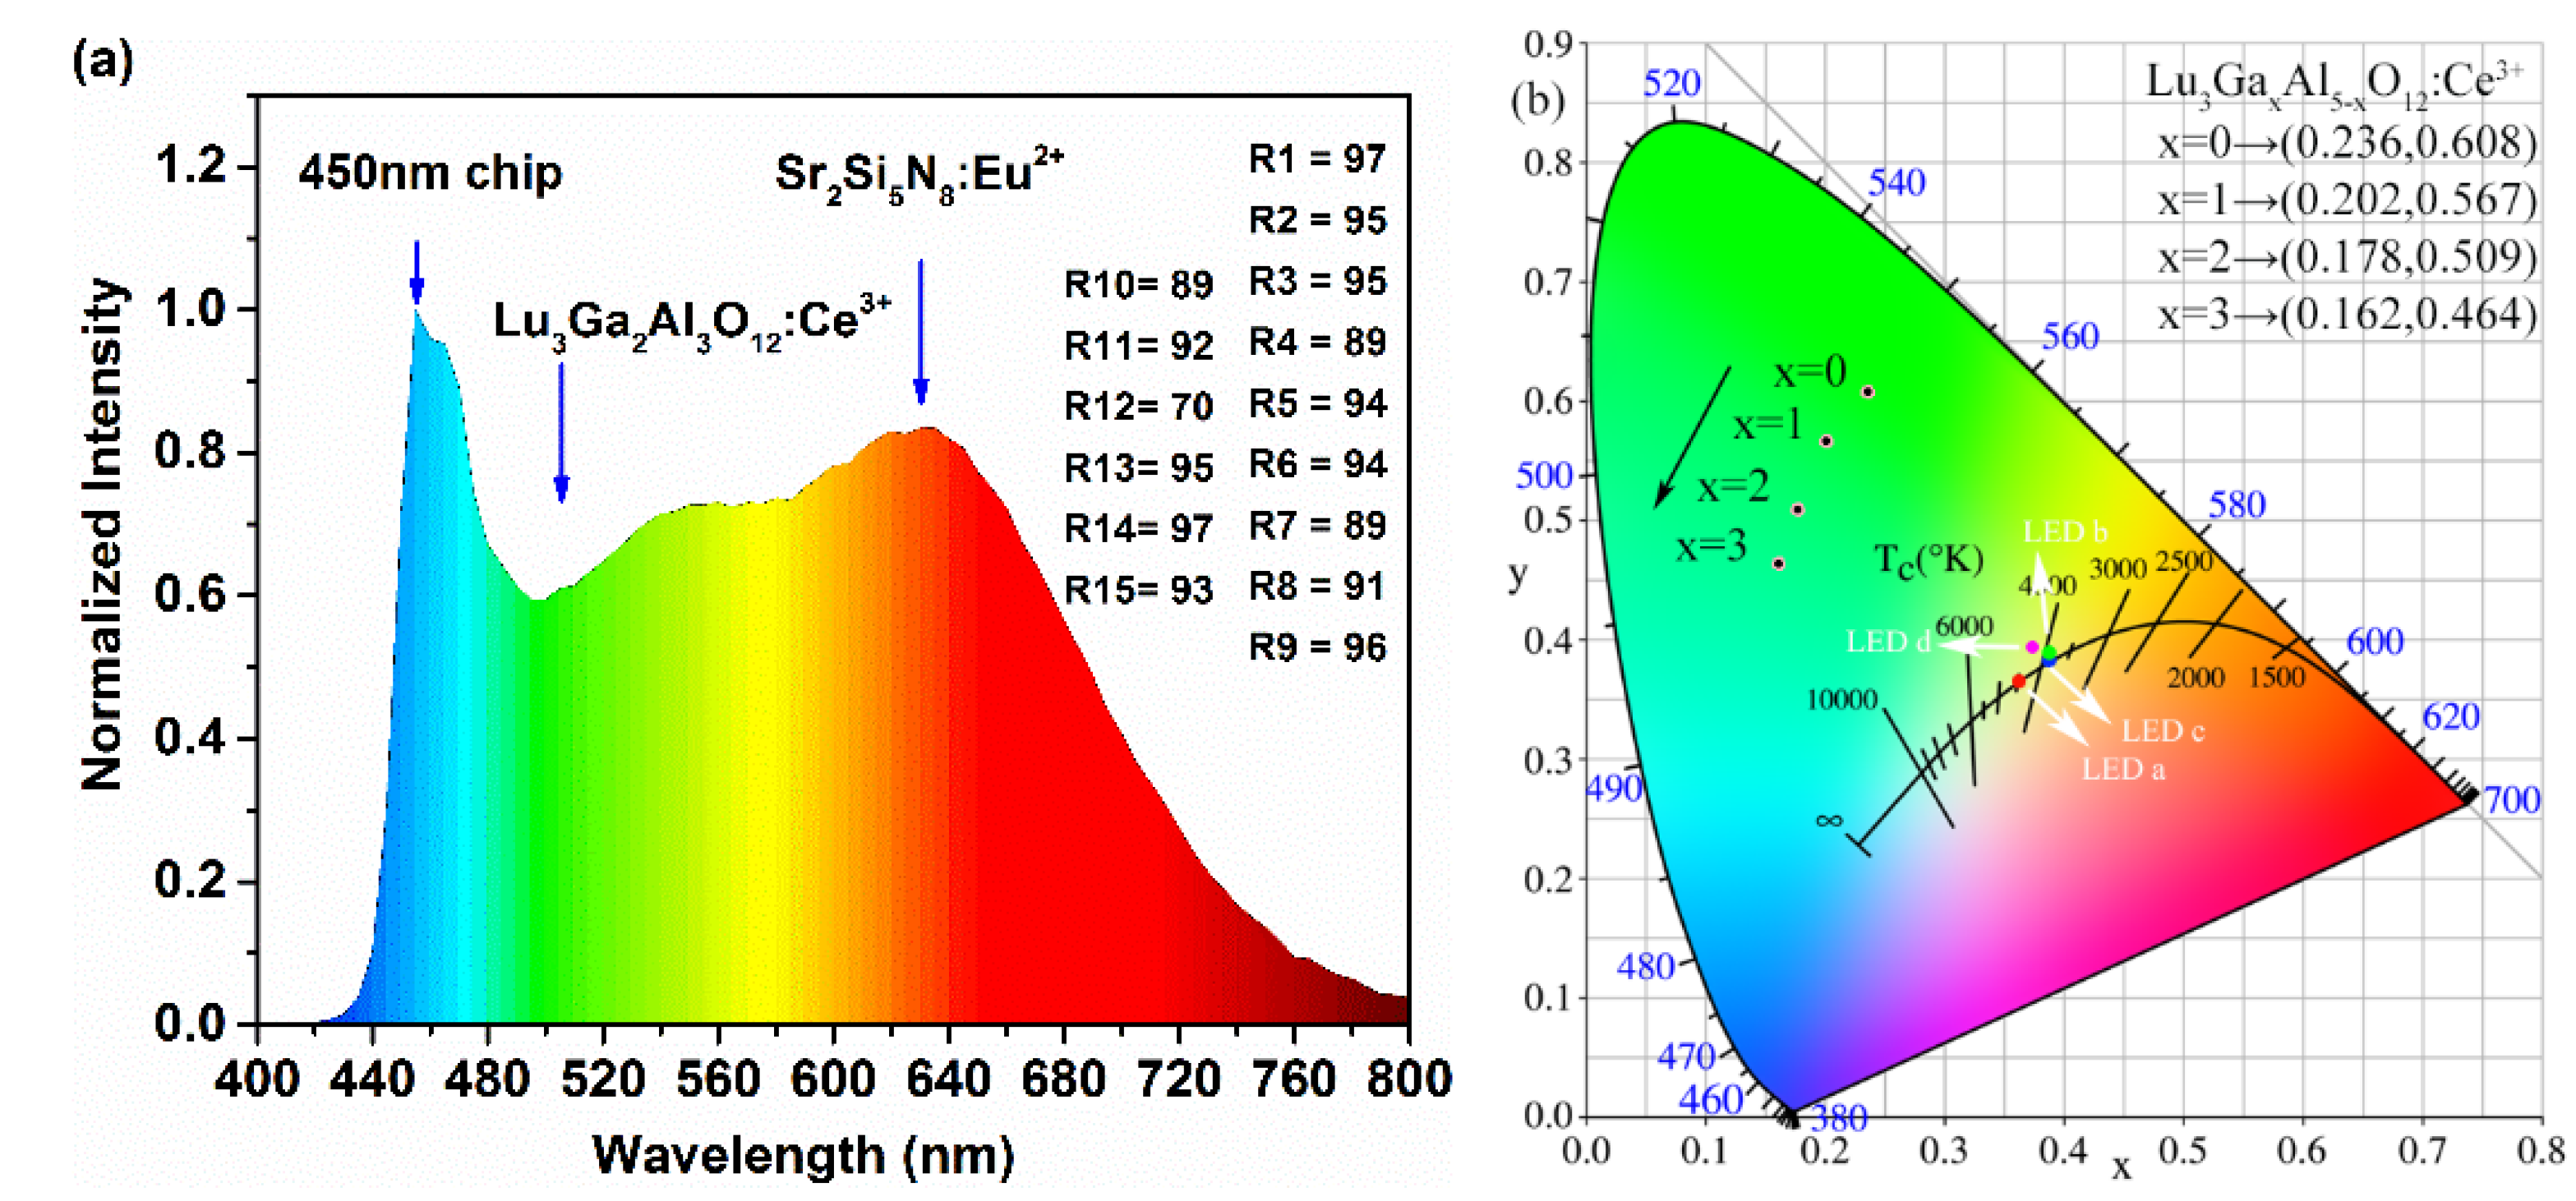
Aiming to evaluate the effectiveness of the cyan-green phosphor LuAGG: Ce3+(x = 0, 1, 2, 3) in practical application, a specimen of the w-LED device was obtained by mixing the as-prepared Lu2.94Ga2Al3O12: Ce3+0.06 sample with a certain amount of commercial red phosphor Sr2Si5N8: Eu2+ and encapsulating them on the blue GaN chip (450 nm). The emission spectrum of the as-fabricated w-LED device driven by a current of 20 mA is present in Figure 8a. Obviously, compared with the YAG: Ce3+ and LuAG: Ce3+ spectra [11,25], it can be conspicuously observed that the blue-green cavity of the emission spectrum of the as-prepared phosphor was filled and the spectrum covered the whole visible region smoothly.
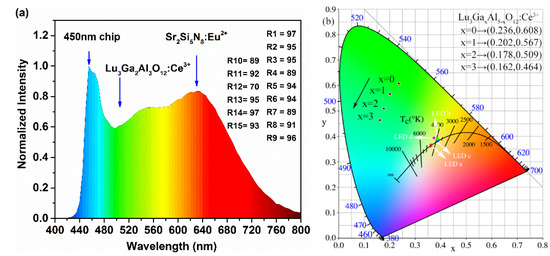
Figure 8.
(a) The luminescence spectrum of the specimen w-LED device. (b) The CIE chromaticity coordinates of the Lu3GaxAl5−xO12: Ce3+ (x = 0, 1, 2, 3) phosphors and specimen LEDs a, b, c, and d.
The experimental LED parameters of the specimen LED device marked as a, b c, and d including the CIE chromaticity coordinates, CRI, CCT, and luminous efficiency are listed in Table 2 and drawn in Figure 8b.
Table 2.
The LuAGG: Ce3+ (x = 0, 1, 2, 3) test sample with white LED parameters.
The results in Table 2 show that with the increase in the Ga3+ content in the as-prepared cyan-green phosphor, the CRI of the specimen LED device increased at first, and then dropped, which reached its maximum value at x = 2; the color temperature and the light efficiency decreased gradually. The reason for the increase in the CRI value is that the blue-green cavity of the emission spectrum was filled by an appropriate substitution of Ga3+ for Al3+, which could significantly improve the color index properties of the white LED device. However, due to the significant reduction in the emission intensity of the samples and the spectral absorption of red phosphors to the samples, these may be the reasons as to why the luminous efficiency of the w-LED device decreased when x = 3.
The CIE chromaticity diagram of these samples is drawn in Figure 8b, which demonstrates a succession of transitions from x = 0.236, y = 0.608 (green region) to x = 0.162, y = 0.464 (cyan region) with the Al3+ sites gradually occupied by Ga3+ ions. The results indicate that the as-prepared phosphors are hopeful in making a tunable blue-green emission under the excitation of blue light in order to compensate for the lack of spectrum in the 470–510 nm region.
4. Conclusions
A series of Lu2.94GaxAl5−xO12: Ce3+0.06 phosphors was synthesized in a nonreducing atmosphere by the high temperature solid state method at different temperatures. The phase formation temperature of these phosphors decreased with the increase in the Ga3+ concentration. The luminescence intensities of these samples were affected by the synthesis temperature and energy gap (ΔET). The peak position of emission spectrum under λex = 450 nm revealed a blue-shift from 508 nm to 482 nm based on the joint action of the crystal field splitting of 5d energy levels and nephelauxetic effect. Furthermore, the PL intensity of the samples (x = 1 and 2) still remained at 81% and 79% of the initial values (25 °C), which compared favorably with LuAG: Ce3+. The main reason for thermal quenching was elucidated by the thermal ionization model rather than the thermally activated crossover process. Meanwhile, by assembling the Lu2.94Ga2Al3O12: Ce3+0.06 phosphor and commercial red phosphor Sr2Si5N8: Eu2+ on a blue LED chip (450 nm), the blue-green cavity in the luminescence spectrum of the specimen LED can almost be filled. Finally, a satisfactory combination of parameters including a CCT of 3880 K and a CRI of 93.2 was obtained. The results demonstrate that the Lu2.94GaxAl5−xO12: Ce3+0.06 phosphors synthesized through a nonreducing atmosphere possess great potential for application in w-LEDs with high CRI.
Author Contributions
M.-Y.Q.: Data curation, Writing-original draft. T.-Q.L.: Formal—Analysis. Q.-L.L.: Writing—review & editing. All authors have read and agreed to the published version of the manuscript.
Funding
The National Natural Science Foundation of China (The funder: Xiao-Yun Mi, the funding number: NSFC Nos. 51602027); The National Natural Science Foundation of China (The funder: Li-Ping Lu, the funding number: NSFC Nos. 61307118); the Jilin Provincial Department of Science and Technology (The funder: Da-Yong Lu, the funding number: 20200801034GH).
Institutional Review Board Statement
Not applicable.
Informed Consent Statement
Informed consent was obtained from all subjects involved in the study.
Data Availability Statement
Not applicable.
Acknowledgments
This work was financially supported by the National Natural Science Foundation of China (NSFC Nos. 51602027 and 61307118) and the Jilin Provincial Department of Science and Technology (grant number 20200801034GH).
Conflicts of Interest
The authors declare that they have no known competing financial interests or personal relationships that could have appeared to influence the work reported in this paper.
References
- Dai, P.-P.; Li, C.; Zhang, X.-T.; Xu, J.; Chen, X.; Wang, X.-L.; Jia, Y.; Wang, X.; Liu, Y.-C. A single Eu2+-activated high-color-rendering oxychloride white-light phosphor for white-light-emitting diodes. Light Sci. Appl. 2016, 5, e16024. [Google Scholar] [CrossRef] [PubMed]
- Liu, Y.; Silver, J.; Xie, R.-J.; Zhang, J.; Xu, H.; Shao, H.; Jiang, J.; Jiang, H. An excellent cyan-emitting orthosilicate phosphor for NUV-pumped white LED application. J. Mater. Chem. C 2017, 5, 12365–12377. [Google Scholar] [CrossRef]
- Peng, Y.; Li, R.; Cheng, H.; Chen, Z.; Li, H.; Chen, M. Facile preparation of patterned phosphor-in-glass with excellent luminous properties through screen-printing for high-power white light-emitting diodes. J. Alloys Compd. 2017, 693, 279–284. [Google Scholar] [CrossRef]
- Senden, T.; Van Dijk-Moes, R.J.A.; Meijerink, A. Quenching of the red Mn4+ luminescence in Mn4+-doped fluoride LED phosphors. Light Sci. Appl. 2018, 7, 8. [Google Scholar] [CrossRef] [PubMed]
- Wang, L.; Xie, R.-J.; Suehiro, T.; Takeda, T.; Hirosaki, N. Down-Conversion Nitride Materials for Solid State Lighting: Recent Advances and Perspectives. Chem. Rev. 2018, 118, 1951–2009. [Google Scholar] [CrossRef]
- Yoon, S.; Dhoble, S.; Park, K. Synthesis and photoluminescence properties of La1−xAlO3:xTb3+ green phosphors for white LEDs. Ceram. Int. 2013, 40, 4345–4350. [Google Scholar] [CrossRef]
- Chen, D.; Zhou, Y.; Xu, W.; Zhong, J.; Ji, Z.; Xiang, W. Enhanced luminescence of Mn4+:Y3Al5O12 red phosphor via impurity doping. J. Mater. Chem. C 2016, 4, 1704–1712. [Google Scholar] [CrossRef]
- Xiao, Y.; Xiao, W.; Zhang, L.; Hao, Z.; Pan, G.-H.; Yang, Y.; Zhang, X.; Zhang, J. A highly efficient and thermally stable green phosphor (Lu2SrAl4SiO12: Ce3+) for full-spectrum white LEDs. J. Mater. Chem. C 2018, 6, 12159–12163. [Google Scholar] [CrossRef]
- Zhong, J.; Zhuang, W.; Xing, X.; Liu, R.; Li, Y.; Liu, Y.; Hu, Y. Synthesis, Crystal Structures, and Photoluminescence Properties of Ce3+-Doped Ca2LaZr2Ga3O12: New Garnet Green-Emitting Phosphors for White LEDs. J. Phys. Chem. C 2015, 119, 5562–5569. [Google Scholar] [CrossRef]
- Qin, J.; Zhang, H.; Lei, B.; Dong, H.; Liu, Y.; Meng, J.; Zheng, M.; Xiao, Y. Preparation and afterglow properties of highly condensed nitridosilicate BaSi7N10:Eu2+ phosphor. J. Lumin. 2013, 152, 230–233. [Google Scholar] [CrossRef]
- Lee, S.-P.; Liu, S.-D.; Chan, T.-S.; Chen, T.-M. Synthesis and Luminescence Properties of Novel Ce3+- and Eu2+-Doped Lanthanum Bromothiosilicate La3Br(SiS4)2 Phosphors for White LEDs. ACS App. Mater. Inter. 2016, 8, 9218–9223. [Google Scholar] [CrossRef] [PubMed]
- Nakatsuka, A.; Yoshiasa, A.; Yamanaka, T. Cation distribution and crystal chemistry of Y3Al5−xGaxO12 (0 ≤ x ≤ 5) garnet solid solutions. Acta Crystallogr. B. 2010, 55, 266–272. [Google Scholar] [CrossRef] [PubMed]
- He, X.; Liu, X.; You, C.; Zhang, Y.; Li, R.; Yu, R. Clarifying the preferential occupation of Ga3+ ions in YAG: Ce, Ga nanocrystals with various Ga3+-doping concentrations by nuclear magnetic resonance spectroscopy. J. Mater. Chem. C 2016, 4, 10691–10700. [Google Scholar] [CrossRef]
- Song, Z.; Wang, Z.; He, L.; Zhang, R.; Liu, X.; Xia, Z.; Geng, W.; Liu, Q. After-glow, luminescent thermal quenching, and energy band structure of Ce-doped yttrium aluminum-gallium garnets. J. Lumin. 2017, 192, 1278–1287. [Google Scholar] [CrossRef]
- Hansel, R.; Allison, S.; Walker, G. Temperature-dependent luminescence of gallium-substituted YAG:Ce. J. Mater. Sci. 2010, 45, 146–150. [Google Scholar] [CrossRef]
- Fu, S.; Tan, J.; Bai, X.; Yang, S.; You, L.; Du, Z. Effect of Al/Ga substitution on the structural and luminescence properties of Y3(Al1−xGax)5O12: Ce3+ phosphors. Opt. Mater. 2018, 75, 619–625. [Google Scholar] [CrossRef]
- Jiang, L.; Zhang, X.; Tang, H.; Zhu, S.; Li, Q.; Zhang, W.; Mi, X.; Lu, L.; Liu, X. A Mg2+-Ge4+ substituting strategy for optimizing color rendering index and luminescence of YAG: Ce3+ phosphors for white LEDs. Mater. Res. Bull. 2018, 98, 180–186. [Google Scholar] [CrossRef]
- Ji, H.; Wang, L.; Molokeev, M.S.; Hirosaki, N.; Xie, R.; Huang, Z.; Xia, Z.; Kate, O.M.T.; Liu, L.; Atuchin, V.V. Structure evolution and photoluminescence of Lu3(Al, Mg)2(Al, Si)3O12: Ce3+ phosphors: New yellow-color converters for blue LED-driven solid state lighting. J. Mater. Chem. C 2016, 4, 6855–6863. [Google Scholar] [CrossRef]
- Kim, H.T.; Kim, J.H.; Lee, J.-K.; Kang, Y.C. Green light-emitting Lu3Al5O12: Ce phosphor powders prepared by spray pyrolysis. Mater. Res. Bull. 2012, 47, 1428–1431. [Google Scholar] [CrossRef]
- Zhu, S.; Zhang, X.; Li, W.; Liu, M.; Cheng, L.; Mi, X.; Lu, L. Phase transformation and luminescence properties of Y2.94Al5−xGaxO12: 0.06Ce3+phosphors. Ceram. Int. 2019, 45, 4964–4971. [Google Scholar] [CrossRef]
- Dorenbos, P. 5d-level energies of Ce3+ and the crystalline environment. IV. Aluminates and “simple” oxides. J. Lumin. 2002, 99, 283–299. [Google Scholar] [CrossRef]
- Dorenbos, P. 5d level energies of Ce3+ and the crystalline environment. II. Chloride, bromide, and iodide compounds. Phys. Rev. B 2000, 62, 15650–15659. [Google Scholar] [CrossRef]
- Robertson, J.M.; van Tol, M.W.; Smits, W.H.; Heynen, J.P.H. Colourshift of the Ce3+ emission in monocrystalline epitaxially grown garnet layers. Philips J. Res. 1981, 36, 15–30. [Google Scholar]
- Dorenbos, P. Relating the energy of the [Xe]5d1 configuration of Ce3+ in inorganic compounds with anion polarizability and cation electronegativity. Phys. Rev. B 2002, 65, 235110. [Google Scholar] [CrossRef]
- Zhou, Y.; Zhuang, W.; Hu, Y.; Liu, R.; Xu, H.; Chen, M.; Liu, Y.; Li, Y.; Zheng, Y.; Chen, G. Cyan-Green Phosphor (Lu2M)(Al4Si)O12:Ce3+ for High-Quality LED Lamp: Tunable Photoluminescence Properties and Enhanced Thermal Stability. Inorg. Chem. 2019, 58, 1492–1500. [Google Scholar] [CrossRef]
- Dorenbos, P. Electronic structure and optical properties of the lanthanide activated RE3(Al1−xGax)5O12 (RE = Gd, Y, Lu) garnet compounds. J. Lumin. 2013, 134, 310–318. [Google Scholar] [CrossRef]

Publisher’s Note: MDPI stays neutral with regard to jurisdictional claims in published maps and institutional affiliations. |
© 2022 by the authors. Licensee MDPI, Basel, Switzerland. This article is an open access article distributed under the terms and conditions of the Creative Commons Attribution (CC BY) license (https://creativecommons.org/licenses/by/4.0/).