Abstract
Pr-doped CeO2 with different doping levels was prepared from Ce(NO3)3∙6H2O and Pr(NO3)3∙6H2O by solvothermal method without any additional reagents, in which the mixed solution of ethylene glycol and distilled water was employed as a solvent. The influences of Pr-doping on phase composition, crystal structure and morphology were investigated, as well as Pr valence and oxygen vacancy defects. The Pr cations entered into the CeO2 crystal lattice with normal trivalence and formed a Pr-CeO2 solid solution based on the fluorite structure. The larger trivalent Pr was substituted for tetravalent Ce in the CeO2 crystal and compensated by oxygen vacancy defects, which caused the local lattice expansion of the crystal lattice. Moreover, the Pr-doped CeO2 solid solutions exhibited visible color variation from bright cream via brick red to dark brown with the increasing of Pr contents. The degradation of AO7 dye was also investigated using a domestic medical ultraviolet lamp; the removal efficiency of AO7 by 1% and 2% Pr-doped CeO2 approached 100%, much higher than 66.2% for undoped CeO2.
1. Introduction
Cerium (Ce) is the most abundant and cheapest rare earth element in nature [1], and its stable oxide (ceria, CeO2) has special electronic configurations and abundant energy level structures, which has been widely used in various traditional and high-tech technologies, such as an oxidant [2], UV blocking agent [3], catalysts for organic reactions [4], catalyst carrier [5], glass polishing powder [6], glass decolorizing and coloring agent [7] and so on.
Energy and the environment are two major problems facing mankind today [8,9,10,11,12]. At present, the water pollution caused by azo dyes has caused widespread concern because of their carcinogenic risks and difficult biodegradation [13,14]. So far, numerous methods have been developed to remove azo dyes from contaminated water, such as adsorption technique [15], membrane separation technique [16], biofilm process [17], coagulation-flocculation precipitation [18], activated sludge method [19] and oxidation reduction method [20]. Among these available chemical and physical methods, the photocatalysis using semiconductor materials as catalysts for solar energy conversion and environmental protection has received extensive attention in recent years [21,22,23]. The greatest advantages of the photocatalytic process consist of not only the general mild reaction conditions, but also the possibility to abate refractory, toxic and difficult or non-biodegradable organic molecules [24,25]. Titanium dioxide (TiO2) is the most studied and widely used photocatalyst in the removal of organic dyes because of its non-toxicity, low-cost and excellent photocatalytic properties [26,27]. CeO2, an N-type semiconductor, is one of the more active, versatile and inexpensive rare earth oxides [28], which should be an alternative candidate photocatalyst due to the readily available intrinsic oxygen vacancies in CeO2 crystal. However, the use of CeO2 as the main active component or as a single catalyst for the photocatalytic degradation of azo dyes is really just beginning. For example, Foletto [29] et al. synthesized the CeO2-SnO2 nanocomposites with different CeO2 contents by a coprecipitation process. The CeO2-SnO2 composite with 7 wt.% CeO2 showed the highest photocatalytic activity for the degradation of Direct Black 38 (DB38) dye under sunlight, and its catalytic activity was similar to that of the commercially available TiO2 (Degussa P25). Mousavi [30] et al. also investigated the contribution of a nanofiber-based support and dendrimer coating on the catalytic activity of CeO2 nanoparticles towards phenol and azorubine dye under both UV and visible light illumination. The results indicated that these CeO2 nanoparticles possessed the capability to become a visible light photocatalyst with the support of the electrospun nanofiber mats. Moreover, Mishra [31] et al. synthesized the well-dispersed CeO2 nanoparticles by a microwave-assisted hybrid hydrothermal method and used them for simultaneous adsorption/photocatalytic decolourisation of Alizarin Red S (ARS) and Eriochrome Black-T (EBT) dyes. The monolayer adsorption capacities of ARS and EBT dyes on CeO2 nanoparticles were 44.1 and 57.8 mg/g without light irradiation, respectively. In addition, the overall decolourisation (adsorption/photo-degradation) of both ARS and EBT dyes (100 mg/L) increased substantially, and the optimum amounts of CeO2 required for ARS and EBT were 0.80 and 0.60 g/L, respectively. Despite this progress in the successful synthesis of CeO2 or their composites, it is still challenging to further improve their adsorption/photo-degradation capacity since the high band-gap energy of CeO2 restrains the utilization of the solar spectrum. For that, doping of CeO2 with other metal ions was presented, which performed by substituting lower valence cations into CeO2 lattice and introducing an oxygen vacancy defect to maintain overall charge neutrality.
Keeping this in mind, we chose a trivalent praseodymium cation (Pr3+; 0.1126 nm) with similar ionic radii to Ce4+ (0.097 nm) as the cation dopant based on the similarity–intermiscibility theory, and the Pr-doped CeO2 solid solutions by solvothermal method for simultaneous adsorption/photocatalytic degradation of Acid Orange 7 dye (AO7) were proposed. To date, many methods had been developed to synthesize Pr-doped CeO2, such as the Sol-Gel method [32], self-propagating method [33] and conventional solid-state reaction method [34]. Considering the advantages of simple operation and low energy consumption of the solvothermal method, a series of Pr-doped CeO2 with different Pr contents was prepared solvothermally from Ce(NO3)3∙6H2O as a cerium source, Pr(NO3)3∙6H2O as a dopant and the mixed solution of ethylene glycol and distilled water as a solvent in this work. The characterizations of the phase composition, lattice parameters, grain sizes, Pr valence, oxygen vacancy defects, specific surface area, morphology, light absorption ability and subjective color change of the as-prepared Pr-doped CeO2 were investigated and discussed. Subsequently, the decolourisation (adsorption/photo-degradation) of AO7 dye was also investigated using a domestic medical ultraviolet lamp.
2. Experimental
2.1. Starting Materials
Ce(NO3)3∙6H2O (99.95%) and Pr(NO3)3∙6H2O (99.99%) were supplied by Aladdin Co. Ltd., Ontario, CA, USA; ethylene glycol (99.5%) and ethanol (99.7%) were supplied by Chengdu Kelong Chemical Co. Ltd., Chengdu, China. And Acid Orange 7 (AO7, 97.0%) was supplied by Tokyo Chemical Industry Co. Ltd., Tokyo, Japan. All chemicals were used as received without further purification.
2.2. Synthesis of Undoped and Pr-Doped CeO2
A series of Pr-doped CeO2 was prepared with different molar concentrations of Pr cation through a solvothermal method combined with subsequent calcination in air, in which Ce(NO3)3∙6H2O served as cerium source, whereas Pr(NO3)3∙6H2O served as dopant. Typically, appropriate amounts of Ce(NO3)3∙6H2O and Pr(NO3)3∙6H2O with a total of 4.0 mmol were dissolved in a mixed solution of 25 mL ethylene glycol and 5 mL distilled water, and then the above-mentioned mixed solution was decanted into a 50 mL Teflon-lined stainless steel autoclave and sealed. After maintaining the solution at 200 °C for 24 h, the precursor powders were collected by centrifugation and washed with distilled water and ethanol, and then dried in air at 60 °C for 24 h. Finally, a series of Pr-doped CeO2 powders was obtained by subsequent calcination in air at 500 °C for 2 h. The as-prepared Pr-doped CeO2 powders with different molar concentrations of Pr were labeled as 1% Pr-doped CeO2, 2% Pr-doped CeO2, 3% Pr-doped CeO2, 4% Pr-doped CeO2, 5% Pr-doped CeO2 and 6% Pr-doped CeO2. Similarly, the undoped CeO2 powders were also prepared following the same procedure as control; however, in the absence of Pr(NO3)3∙6H2O, it was labeled as Undoped CeO2.
The practical contents of the Pr element in CeO2 were measured by ICPMS and are shown in Table 1; the practical Pr contents in CeO2 were close to the corresponding nominal doping concentrations.

Table 1.
Practical Pr contents, grain size, lattice parameters and [VO]XPS and [VO]XPS of Undoped CeO2 and Pr-doped CeO2 with different Pr contents synthesized by solvothermal method at 200 °C for 24 h followed by calcination in air at 500 °C for 2 h.
2.3. Characterization
The crystallographic phases of cerium precursors and CeO2 samples were characterized by X-Ray Diffraction (XRD, DX-2700) analysis. The surface compositions and binding energies of CeO2 samples were determined by X-ray Photoelectron Spectroscopy (XPS, ESCALAB 250Xi). The practical doping levels of Pr elements in CeO2 samples were determined using Inductive Coupled Plasma Mass Spectrometry (ICPMS, Agilent-7800, Agilent Technologies, Carpinteria, CA, USA). The morphologies of CeO2 samples were evaluated by field-emission Scanning Electron Microscopy (SEM, JEOL-7500F, JEOL Ltd., Tokyo, Japan). N2 adsorption–desorption isotherms were measured using a QuadraSorb SI surface area analyzer, and the BET specific surface areas were determined using the Brunauer–Emmett–Teller method. Raman spectra were obtained using the LabRAM HR800 (Jobin Yvon Co., Paris, France) with a 325 nm He-Cd laser. The reflectance spectra of CeO2 samples, UV-VIS absorption spectra and absorbances of AO7 solutions were measured using an Ultraviolet-Visible spectrophotometer (UV-VIS, U-3900, Hitachi Ltd., Tokyo, Japan).
2.4. Photoreactor and Light Source
All batch experiments were performed in a 150 mL ceramic plate (Φ18 cm) at room temperature without irradiation or under irradiation by a 300 W ultraviolet lamp (300 W; 254 nm). Such ultraviolet radiation was generated by a medical ultraviolet disinfection vehicle (220 V, DANCHENG, China). During the reaction, the air conditioning was turned on to ensure the room temperature was 25 °C. The adsorption in dark and photocatalysis experiments were performed without any stirring, additional oxidant or any other substance. In addition, the distance between the light source and the liquid level was 15 cm.
2.5. Degradation of AO7 Dye
The adsorptive/photocatalytic degradations of AO7 dye on Pr-doped CeO2 were evaluated both in the dark and under UV light illumination using a medical ultraviolet lamp. Typically, 0.1 g CeO2 was dispersed into 100 mL AO7 solution (20 mg/L). Before illumination, it was left to stand for 1 h in the dark, and then the mixture was exposed to the ultraviolet radiation. Then, about 5 mL suspensions were withdrawn at regular intervals of 0.5 h and separated by centrifugation, and then the absorbance of supernatant was measured immediately at the absorption wavelength of 485 nm using a U-3900 spectrophotometer. During the test of absorbance, the adsorption or photocatalytic experiment was suspended and stopped; specifically, the heterogeneous photocatalysis reaction system was covered with a shade cloth. After the measurement of absorbance, the taken suspension including CeO2 and AO7 solution were put back into the original photocatalytic system, and the photocatalytic experiment was restarted. Finally, the removal rate (η, %) was estimated using Equation (1).
where A0 is the absorbance of the initial AO7 solution (20 mg/L) and At is the absorbance of the AO7 solution at a given time t.
3. Results and Discussion
XRD was employed to research the effect of the introduction of Pr elements on the phase composition and crystallographic structure of the samples. Figure 1a shows XRD patterns of the cerium precursors synthesized with different Pr concentrations by solvothermal treatment at 200 °C for 24 h. As observed in Figure 1a, all precursors displayed a mixture of CeCO3OH (JCPDS no. 52-0352, Hexagonal), Ce(COO)2COOH (JCPDS no. 51-0548, Orthorhombic) and CeO2 (JCPDS no. 34-0394, Cubic) characteristic peaks. After the following calcination in air at 500 °C for 2 h, all samples in Figure 1b displayed several well-resolved XRD peaks that were indexed to the (111), (200), (220), (311), (222), (400) and (331) planes of fluorite CeO2 (JCPDS no. 34-0394, Cubic); the peaks related to CeCO3OH and Ce(COO)2COOH were no longer present and no additional phases from impurities, such as Pr2O3, were detected. Moreover, the grain sizes of these particles were estimated using Scherrer’s formula based on XRD patterns and are summarized in Table 1. As observed, Pr-doping had a certain inhibitory effect on the growth of CeO2 grains, especially 3% Pr-doped CeO2; its grain size was only 10.4 nm, much smaller than 16.3 nm for Undoped CeO2.
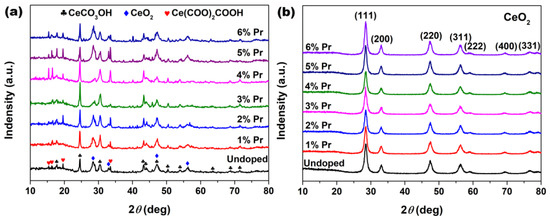
Figure 1.
XRD patterns of the samples synthesized solvothermally at 200 °C for 24 h with different Pr concentrations (a) before and (b) after calcination in air at 500 °C for 2 h.
The calculated values of lattice parameters were measured based on Bragg’s equation and are summarized in Table 1. As observed, the calculated lattice parameters for Pr-doped CeO2 synthesized with different Pr contents were greater than that of Undoped CeO2, which could be attributed to the substitution of Ce4+ (0.097 nm) ions with the larger Pr3+ (0.1126 nm [35]) ions, and the local lattice expansion of CeO2 crystal occurred as a result. In addition, the lattice parameter of doping CeO2 reached a maximum with a Pr content of 3%, decreasing with higher Pr contents. So, the concentration (3%) could represent the solid solubility limit of Pr cation in CeO2 lattice. These findings indicated that the as-prepared CeO2 samples could maintain the cubic fluorite structure with Pr-doping, and the large Pr cations partially substituted the Ce ions to form a solid solution with a solid solubility limit of 3%.
In order to probe the surface chemical compositions and their oxidation states that might have occurred in the Pr-doping CeO2 systems, XPS analysis was employed to study the Undoped and Pr-doped CeO2 samples. Figure 2a shows the wide-scan spectra of Undoped, 1% and 2% Pr-doped CeO2. As observed, all of these wide-scan spectra were dominated by the signals of Ce3d, Ce4d, O1s and C1s, and their profiles were similar to that obtained in the previous studies for CeO2 [36]. Moreover, the corresponding Pr3d XPS regions of 1% and 2% Pr-doped CeO2 were recorded and are shown in Figure 2b. The characteristic peaks of Pr3d XPS regions implied that Pr were in +3 states, indicating that the Pr element had been successfully incorporated into the CeO2 lattice with normal trivalence states [37,38,39,40].
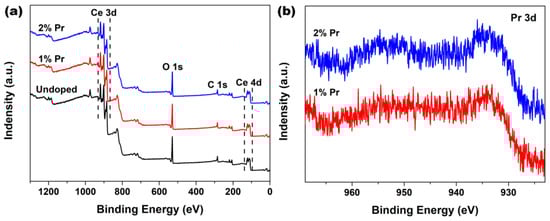
Figure 2.
(a) XPS spectra of Undoped, 1% and 2% Pr-doped CeO2 and (b) the corresponding XPS regions of Pr3d of 1% and 2% Pr-doped CeO2.
To investigate the changes of oxidation states of Ce in CeO2 with Pr doping, the Ce3d XPS regions of Undoped, 1% and 2% Pr-doped CeO2 were recorded and are shown in Figure 3a–c, respectively. According to previous research [41], the Ce3d XPS peak of CeO2 could be divided into eight separate peaks, referring to the 3d5/2 and 3d3/2 spin–orbit component of cerium cations; the bonds labeled as v1 and u1 belonged to the unique photoelectron features from Ce3+ states, whereas the bands labeled as v3, v2, v0 (and those for u) were due to Ce4+ states. As observed in Figure 3a, the Ce3d XPS region of Undoped CeO2 contained five peaks only, and no peaks associated with Ce3+ species (v1 and u1) were found, which was consistent with the previous report of Ce4+ cations, indicating the main valence of cerium in Undoped CeO2 was +4 [42]. Compared to the Ce3d XPS spectrum of Undoped CeO2 in Figure 3a, no significant changes in peak shape and binding energy were observed for 1% and 2% Pr-doped CeO2, as Figure 3b,c show. These findings indicated that the Pr-doping had little effect on the production of Ce3+ species in CeO2; in other words, Ce in the CeO2 surface was still dominated by Ce4+ after Pr-doping.
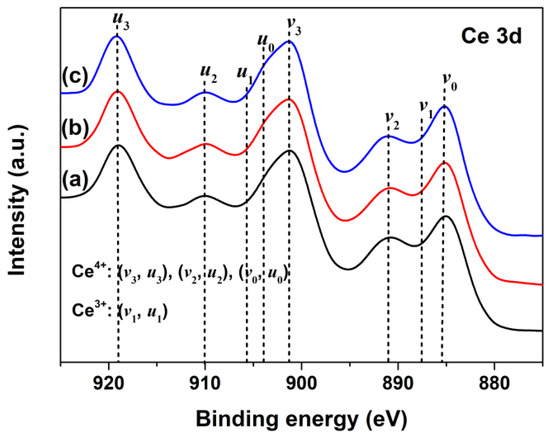
Figure 3.
Ce3d XPS spectra of (a) Undoped, (b) 1% Pr- and (c) 2% Pr-doped CeO2.
To investigate the changes of chemical states of oxygen in CeO2 with Pr doping, the O1s XPS regions and respective fitting curves of Undoped, 1% and 2% Pr-doped CeO2 were recorded, and the results are shown in Figure 4. The O1s XPS spectra of Undoped CeO2 could be curve-fitted into two peaks, indicative of the presence of two kinds of oxygen species on the CeO2 surface. The peak at about 529.1 eV (labeled as α) could be assigned to the lattice oxygen of O-Ce species, whereas that of about 531.5 eV (labeled as β) could be assigned to the chemisorbed oxygen species or/and weekly bonded oxygen species related to the oxygen vacancies (labeled as VO). The β peak that appeared in Undoped CeO2 indicated that pure CeO2 itself possessed a certain number of VO defects. Considering the traces of the Pr element in doping CeO2, the O1s XPS spectra of 1% and 2% Pr-doped CeO2 were also curve-fitted into two peaks. Compared to the binding energy of the O1s spectrum in Undoped CeO2, there was a blue shift of 0.3 eV for 1% Pr-doped CeO2 and 0.4 eV for 2% Pr-doped CeO2, respectively. The blue shift of O1s peaks suggested the reduction of the valence state of lattice oxidation from O-Ce species; in other words, Pr-doping benefited the VO species in creation. The rising numbers of VO species in CeO2 could be attributed to the incorporation of Pr3+ into the CeO2 lattice to form solid solutions. The substitution reaction of Ce4+ cation by Pr3+ cation could be written in Kroger and Vink notations, as expressed by Equation (2):
where represents a Pr3+ cation occupying the site of a Ce4+ cation, is a lattice oxygen atom, and represents an oxygen vacancy with two positive charges. In addition, the oxygen vacancies ratio (labeled as [VO]XPS) could be quantified using Equation (3), and the calculated values are shown in Table 1.
where [VO]XPS (%) represents the relative oxygen vacancy concentration calculated by O1s XPS spectra and Aα and Aβ are the integrated area of Peak α and Peak β from the O1s core-level XPS spectra in Figure 4. As shown in Table 1, the estimated values [VO]XPS of 1% and 2% Pr-doped CeO2 were 33.30% and 31.67%, respectively, higher than that of Undoped CeO2 (24.36%), which further indicated that Pr-doping promoted the creation of VO species in CeO2. Further analysis of the relative VO concentration was conducted by Raman spectra analysis, as will be discussed later.
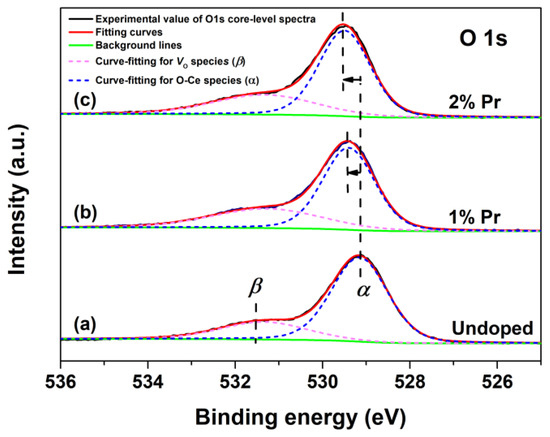
Figure 4.
O1s core-level XPS spectra of (a) Undoped, (b) 1% and (c) 2% Pr-doped CeO2.
Laser Raman is rather powerful in identifying the nature of surface VO defects because of its sensitivity to crystalline symmetry [43]. The Raman spectra for Undoped and Pr-doped CeO2 are shown in Figure 5. As observed, the undoped CeO2 showed an obvious band at 455 cm-1, which can be assigned to the F2g vibration mode of the O atoms around Ce4+ cations, and the band at 1173 cm-1 can be attributed to the second-order transverse acoustic mode of CeO2 fluorite structure, whereas the weak band at 585 cm-1 has been proven to be associated to the VO defects and has been widely observed in substoichiometric CeO2-x [44]. The presence of the weak band at 585 cm-1 suggested that there existed a certain amount of VO defects in pure CeO2. Moreover, the Pr-doped CeO2 exhibited a stronger 585 cm-1 peak than the undoped one; the intensity of the band at 585 cm-1 initially increased and then decreased with the increasing Pr-doping amount. As an alternative approach to estimate the concentration of VO defects in CeO2, the intensity ratio of the bands at 585 and 455 cm-1 (I585/I455, labeled as [VO]Raman) was calculated, and the results are shown in Table 1. The relative [VO]Raman, which is the value of I585/I455, reached a maximum in 1% Pr-doped CeO2, then decreased.
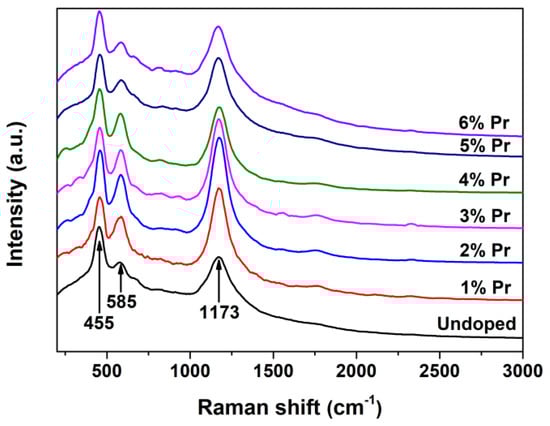
Figure 5.
Raman spectra of Undoped CeO2 and Pr-doped CeO2 with different Pr contents.
To clarify the effects of Pr-doping on the morphology of CeO2, SEM analysis was conducted. Figure 6a,b show the SEM images of Undoped and 6% Pr-doped CeO2 particles. As observed, both the morphologies of Undoped and Pr-doped CeO2 particles were the multilayered structure consisting of nanoflakes that intercalated, forming an open, porous structure. To further clarify the porous nature of CeO2 samples, N2 adsorption–desorption experiments were conducted, and their BET specific surface areas were determined using the Brunauer–Emmett–Teller method. Figure 6c,d show the N2 adsorption–desorption isotherms of Undoped and 6% Pr-doped CeO2, respectively. The hysteresis loops in the relative pressure (p/p0) range of 0.4–1.0 were observed, consistent with type IV hysteresis loops, confirming their mesoporous structure [45]. Moreover, the BET specific surface area of Undoped CeO2 was 96.0 m2/g, slightly higher than that of 6% Pr-doped CeO2 (85.8 m2/g). Compared to Undoped CeO2, the morphology of 6% Pr-doped CeO2 still maintained the original multilayered structure, implying that the incorporation of Pr cations into the CeO2 lattice had little impact on their morphology; however, Pr-doping could affect their specific surface areas.
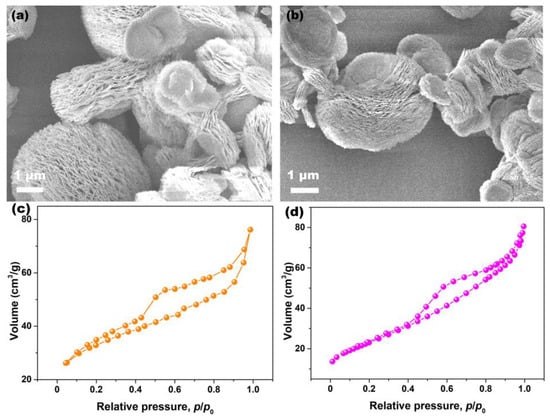
Figure 6.
SEM images of (a) Undoped and (b) 6% Pr-doped CeO2, N2 adsorption–desorption isotherms of (c) Undoped and (d) 6% Pr-doped CeO2.
UV-VIS spectroscopic measurements were carried out to investigate the effect of Pr-doping and their concentrations on the optical properties of CeO2. Figure 7 shows the reflectance spectra of Undoped and Pr-doped CeO2 with different Pr contents. For the reflectance spectrum of Undoped CeO2, no visible absorption was detected in the wavelength region of 840–520 nm, but strong absorption in the wavelength region of 350–200 nm was observed. This ultraviolet absorption was due to the charge–transfer transition from 2p orbitals of O2- of the valence band (VB) to 4f orbitals of Ce4+ of the conduction band (CB) [46,47]. Compared with the reflectance spectrum of Undoped CeO2, 1% and 2% Pr-doped CeO2 showed greater absorption in the wavelength region of 840–400 nm, and higher concentration of Pr-doping (3 to 6%) could result in stronger absorption. This was due to the reduction of band gaps between VB and CB caused by the introduction of Pr3+ cation into CeO2 crystal. Moreover, the colors of Undoped and Pr-doped CeO2 with different Pr contents are also shown in Figure 7. As observed, the color of Undoped CeO2 appeared as bright cream because of its major absorption in the wavelength region of 350–200 nm, and Pr-doped CeO2 exhibited a visible color variation from bright cream via brick red to dark brown with the increasing of Pr contents, which could be due to the doping of Pr3+ cations into the CeO2 lattice that reduce the optical band gap value between VB and CB.
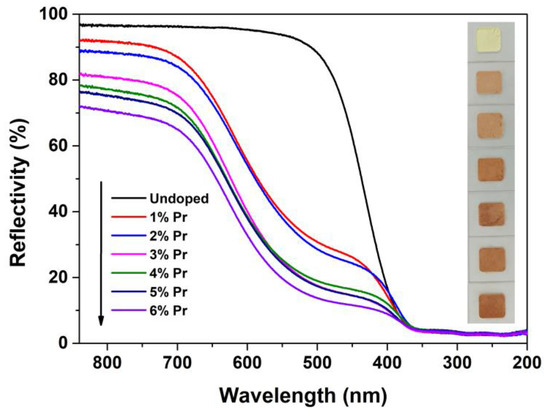
Figure 7.
Reflectance spectra and photographs of Undoped CeO2 and Pr-doped CeO2 with different Pr contents.
The adsorption in dark and photocatalytic degradation of AO7 solutions by Pr-doped CeO2 were measured and compared with that of Undoped CeO2. Figure 8a shows the removal rates of AO7 in the presence of Undoped and Pr-doped CeO2. In order to make sure of the important role of CeO2 and Pr-doped CeO2, a blank experiment (self-photosensitized process) was also performed under identical conditions. As observed in Figure 8a, the blank test confirmed that AO7 dye only slightly was degraded under ultraviolet light in the absence of CeO2 and Pr-doped CeO2, indicating that the photolysis could be ignored. Like the adsorption of AO7 in the dark, all CeO2 samples nearly reached an adsorption–desorption equilibrium within 30 min of reaction; however, only 1% and 2% Pr-doped CeO2 (37.9% and 38.2%) possessed the remarkable adsorption capability of AO7 compared to that of Undoped CeO2 (25.6%). After 4 h of reaction, the removal rates of AO7 by 1% and 2% Pr-doped CeO2 approached 100%, much higher than 66.2% for Undoped CeO2. From the analysis results of Raman spectra in Figure 5, Pr-doping with a 1–6% level could induce more VO defects than Undoped CeO2. The number of VO basically stayed the same with the doping concentration more than 3%, but their colors got darker and darker, which changed the absorption and utilization of light, supported by UV-VIS spectra in Figure 7. In addition, Pr-doping had different effects on the BET specific surface area and grain size of CeO2. Therefore, we could draw a conclusion that the factors affecting the photocatalytic efficiency of CeO2 for AO7 were not single, and it was believed that the changes in the grain size [VO] and the optical properties caused by doping effects with Pr had affected the adsorption capability and photocatalytic activity of AO7.
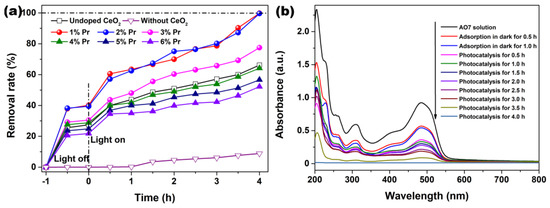
Figure 8.
(a) AO7 adsorption in dark and photocatalytic degradation upon illumination using an ultraviolet lamp (300 W; λ = 254 nm) in the presence of Undoped CeO2 and Pr-doped CeO2 with different Pr concentrations, (b) UV-VIS absorption spectra of AO7 removal by 1% Pr-doped CeO2. ([AO7] = 20 mg/L; [CeO2] = 1.0 g/L; V = 100 mL; Room temperature; Without pH preadjustment).
The continuous UV-VIS spectra of the centrifuged solution after adsorption and catalytic reactions at the different intervals were used to record and contrast with that of the initial AO7 solution, which further clarified the removal performance and mechanism of AO7. As observed in Figure 8b, the absorption spectrum of the original AO7 solution was characterized by one main band in the visible region with its maximum absorption at 485 nm, corresponding to the azo bond (-N=N-) of the AO7 molecule, which was responsible for the orange-red color of the aromatic rings pertaining to the azo groups. Other bands in the ultraviolet region were attributed to the benzene ring and naphthalene ring structure of the AO7 molecule [48]. Figure 8b shows the UV-VIS absorption spectra of AO7 removal by 1% Pr-doped CeO2. As observed, the removal rate in Figure 8a increased with respect to the treatment time, and, correspondingly, the amplitude of all peaks in Figure 8b decreased with respect to time. The continuous decrease of the absorbance peak at 485 nm and other bands in the ultraviolet region suggested that the azo bonds and the naphthyl rings of the AO7 molecule were destroyed. After photocatalysis for 4.0 h, the major absorption peaks of AO7 dye in UV-VIS region had basically disappeared. UV light illumination of AO7 aqueous solution in the presence of the as-synthesized Pr-doped CeO2 caused the absorption bands of AO7 dye in the visible region to decrease with time and finally to disappear, suggesting the destruction of its chromophoric structure in the vicinity of the azo linkage. Moreover, no other additional absorption bands were detected from Figure 8b, such as toxic organic by-products during the photocatalytic degradation of AO7, suggesting the superiority of photocatalytic degradation of organic dyes.
The photocatalytic degradation reaction could be assumed to follow a pseudo-first-order kinetic expression, as expressed by Equations (4) and (5) [49].
where q (mg/g) is the adsorption amount for AO7 dye, k (1/h) is the apparent rate constant, C0 (mg/L) is the initial concentration at t = 0, Ce (mg/L) is the solution phase concentration of AO7, m (g) is the mass of CeO2 samples and V (L) is the volume of AO7 aqueous solution. The variations in log(qe-qt) as a function of illumination time are shown in Figure 9. The apparent rate constants (k) and relative coefficients (R2) obtained by fitting with the pseudo-first-order model are summarized in Table 2. It was found that the 2% Pr-doped CeO2 showed the highest degradation rate, and that was k of 2%; Pr-doped CeO2 was about 1.7 times higher than that of undoped CeO2. The enhancement of photocatalytic activity was attributed to the doping effect induced by Pr. In addition, the correlation coefficients (R2) of all samples are above 0.93, suggesting that the photocatalytic degradation process of the AO7 molecule tends to follow the pseudo-first-order kinetic model.
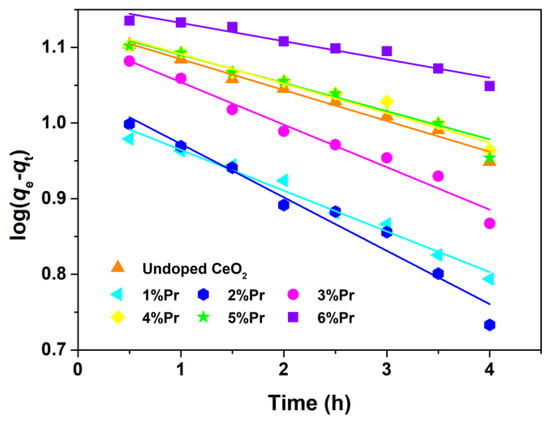
Figure 9.
Kinetic fitting for the degradation of AO7 dye with Undoped CeO2 and Pr-doped CeO2 under ultraviolet lamp (300 W; λ = 254 nm).
Table 2.
Kinetic parameters for the degradation of AO7 dye onto Undoped CeO2 and Pr-doped CeO2 under ultraviolet lamp.
From the above results of pseudo-first-order kinetic analysis, the apparent rate constants (k) of the photocatalytic degradation of the dye in presence of 3% Pr-doped CeO2 was highest, suggesting that AO7 degrades faster under the irradiation of ultraviolet light. From Figure 8a, we could find that the removal rates of AO7 by 1% and 2% Pr-doped CeO2 approached 100% within 4 h of reaction. The degradation efficiency of 1% Pr-doped CeO2 for AO7 dye was evaluated by comparing it with those of other reported materials, as shown in Table 3. In consideration of the presented results in Table 3, it turned out that 1% Pr-doped CeO2 was also an alternative material for the degradation of AO7 dye.
Table 3.
Recent literatures on the development for the degradation of AO7 dye.
Figure 10 shows the proposed radical ion mechanism for AO7 degradation. Under the irradiation of ultraviolet light, electron (e-) was excited from the VB to CB of Pr-doped CeO2 catalyst (Pr/CeO2) and a charge vacancy in the hole (h+) in the valence band was also created. These photogenerated h+ and e- could react with the adsorbed water (H2O) and O2 on the surface of the Pr/CeO2 catalyst, the active oxidative ionic radicals (O2•-) and the hydroxyl radicals (OH•) generated in the reaction medium, which were very reactive and could quickly oxidize organic species on the Pr/CeO2 surface. Moreover, the generation of OH• radicals along with the formation of hydrogen peroxides (H2O2) increased the catalytic activity towards the degradation of AO7. Subsequently, the generated H2O2 reacted with Pr/CeO2(e-), leading to the formation of nascent oxygen (active oxygen, O2*), which happened with the reduction of Ce4+ to Ce3+ states. The tetravalent oxidation state of Ce could provide multiple photogenerated e- to vary the electrical conductivity and enhance the catalytic activity of Pr/CeO2. Furthermore, the Pr-doping could induce the formation of VO defects in the CeO2 crystal, which could enhance its capacity to capture oxygen from the environment, and these stored oxygen species could be released quickly to the reaction medium, and then more highly reactive O2* species were produced, leading to the degradation of AO7 dye under the irradiation of ultraviolet light. Finaly, there was the degradation of the enlisted organics to CO2, H2O and other less toxic minerals such as nitrates and sulphates [58]. From the above description, the formation of the photogenerated h+ and e- was the beginning of the catalytic reaction. If the CeO2 catalyst surface was completely covered by AO7 molecules, the generation of h+ and e- would be seriously affected because of the blocked contact between ultraviolet light and the CeO2 catalyst surface, and the catalytic efficiency of the catalyst would also decrease.
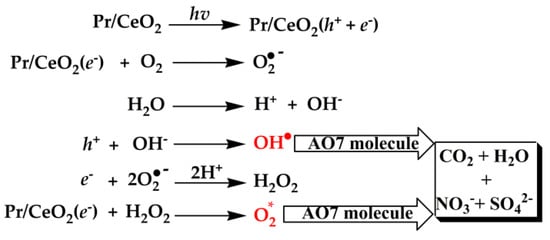
Figure 10.
Proposed radical-ions mechanism for AO7 degradation.
4. Conclusions
Pr-doped CeO2 solid solutions were synthesized via a simple solvothermal process followed by calcination. The characterization results confirmed the successful doping of Pr elements with a trivalent state into a CeO2 lattice, and the solid solubility limit of Pr in the CeO2 lattice was recognized as 3%. The 6% Pr-doped CeO2 still retained a fluorite crystal structure and original multilayered mesoporous structure; however, Pr-doping could affect their specific surface areas. The Raman spectra revealed that Pr-doping was beneficial for the creation of oxygen vacancy defects, and the relative [VO]Raman reached a maximum in 1% Pr-doped CeO2. Both 1% and 2% Pr-doped CeO2 were alternative photocatalysts for the degradation of AO7 dye, as they showed a maximum removal ability that approached 100% at room temperature and 0.1 g of catalyst within 4 h without pH preadjustment. Moreover, the photocatalytic degradation process of the AO7 molecule tends to follow the pseudo-first-order kinetic model. Hence, such Pr-doped mesoporous CeO2 has the potential for the treatment of dyestuff wastewater generated by the industry.
Author Contributions
Y.X. project administration; writing—original draft preparation; formal analysis; P.W. data curation; M.W., Y.G. and H.Y. validation; investigation; Z.D. funding acquisition; supervision. All authors have read and agreed to the published version of the manuscript.
Funding
This study was financially supported by the Leshan Normal University Research Program, China (2021SSDJS012), Science and Technology Bureau of Leshan city of China (22ZDYJ0093), and Fundamental Research Funds for the Central Universities (2022CDJXY-010).
Institutional Review Board Statement
Not applicable.
Informed Consent Statement
Not applicable.
Data Availability Statement
Not applicable.
Conflicts of Interest
The authors declare no conflict of interest.
References
- Nieto, A.; Guelly, K.; Kleit, A. Addressing criticality for rare earth elements in petroleum refining: The key supply factors approach. Resour. Policy 2013, 38, 496–503. [Google Scholar] [CrossRef]
- Lenka, R.K.; Mahata, T.; Sinha, P.K.; Tyagi, A.K. Combustion synthesis of gadolinia-doped ceria using glycine and urea fuels. J. Alloy. Compd. 2008, 466, 326–329. [Google Scholar] [CrossRef]
- Zhao, P.S.; Song, J.; Zhou, S.S.; Zhu, Y.; Jing, L.; Guo, Z.Y. Facile 1,4-dioxane-assisted solvothermal synthesis, optical and electrochemical properties of CeO2 microspheres. Mater. Res. Bull. 2013, 48, 4476–4480. [Google Scholar] [CrossRef]
- Ruocco, C.; Palma, V.; Cortese, M.; Martino, M. Stability of bimetallic Ni/CeO2-SiO2 catalysts during fuel grade bioethanol reforming in a fluidized bed reactor. Renew. Energy 2022, 182, 913–922. [Google Scholar] [CrossRef]
- Lin, F.; Pappe, K.; Kovarik, L.; Song, M.; Li Shari, X.; Engelhard, M.; Wang, Y. Effects of high-temperature CeO2 calcination on the activity of Pt/CeO2 catalysts for oxidation of unburned hydrocarbon fuels. Catal. Sci. Technol. 2022, 12, 2462–2470. [Google Scholar] [CrossRef]
- Kosynkin, V.D.; Arzgatkina, A.A.; Ivanov, E.N.; Chtoutsa, M.G.; Grabko, A.I.; Kardapolov, A.V.; Sysina, N.A. The study of process production of polishing powder based on cerium dioxide. J. Alloy. Compd. 2000, 303–304, 421–425. [Google Scholar] [CrossRef]
- Feng, H.E.; Chen, J.L.; Tian, S.S.; Lian-Meng, X.U.; Xie, J.L.; Zhong, T.Q. Study on Yellow Opaque Glass with Mixed Coloring Agents CeO2 and TiO2. J. Wuhan Univ. Technol. 2013, 35, 34–37. [Google Scholar] [CrossRef]
- Ding, Z.; Yang, W.; Huo, K.; Shaw, L. Thermodynamics and Kinetics Tuning of LiBH4 for Hydrogen Storage. Prog. Chem. 2021, 33, 1586–1597. [Google Scholar] [CrossRef]
- Ding, Z.; Li, H.; Shaw, L. New insights into the solid-state hydrogen storage of nanostructured LiBH4-MgH2 system. Chem. Eng. J. 2020, 385, 123856. [Google Scholar] [CrossRef]
- Ding, Z.; Chen, Z.; Ma, T.; Lu, C.-T.; Ma, W.; Shaw, L. Predicting the hydrogen release ability of LiBH4-based mixtures by ensemble machine learning. Energy Storage Mater. 2020, 27, 466–477. [Google Scholar] [CrossRef]
- Li, D.; Yuan, Y.; Liu, J.; Fichtner, M.; Pan, F. A review on current anode materials for rechargeable Mg batteries. J. Magnes. Alloy. 2020, 8, 963–979. [Google Scholar] [CrossRef]
- Tong, F.; Wei, S.; Chen, X.; Gao, W. Magnesium alloys as anodes for neutral aqueous magnesium-air batteries. J. Magnes. Alloy. 2021, 9, 1887–1911. [Google Scholar] [CrossRef]
- Kapoor, R.T.; Danish, M.; Singh, R.S.; Rafatullah, M.; Abdul Khalil, H.P.S. Exploiting microbial biomass in treating azo dyes contaminated wastewater: Mechanism of degradation and factors affecting microbial efficiency. J. Water Process Eng. 2021, 43, 102255. [Google Scholar] [CrossRef]
- Li, H.; Tang, C.; Wang, M.; Mei, C.; Liu, N. Decolorization of azo dyes in a heterogeneous persulfate system using FeS as the activator. Water Sci. Technol. 2021, 83, 1703–1713. [Google Scholar] [CrossRef] [PubMed]
- Ruan, C.; Ma, Y.; Shi, G.; He, C.; Du, C.; Jin, X.; Liu, X.; He, S.; Huang, Y. Self-assembly cellulose nanocrystals/SiO2 composite aerogel under freeze-drying: Adsorption towards dye contaminant. Appl. Surf. Sci. 2022, 592, 153280. [Google Scholar] [CrossRef]
- Guo, Q.; Wu, X.; Ji, Y.; Hao, Y.; Liao, S.; Cui, Z.; Li, J.; Younas, M.; He, B. pH-responsive nanofiltration membrane containing chitosan for dye separation. J. Membr. Sci. 2021, 635, 119445. [Google Scholar] [CrossRef]
- You, S.J.; Damodar, R.A.; Hou, S.C. Degradation of Reactive Black 5 dye using anaerobic/aerobic membrane bioreactor (MBR) and photochemical membrane reactor. J. Hazard. Mater. 2010, 177, 1112–1118. [Google Scholar] [CrossRef]
- Aragaw, T.A. Recovery of iron hydroxides from electro-coagulated sludge for adsorption removals of dye wastewater: Adsorption capacity and adsorbent characteristics. Surf. Interfaces 2020, 18, 100439. [Google Scholar] [CrossRef]
- Wang, D.; Jin, Z.; Pang, X.; Jiang, X.; Lu, Y.; Shen, L. Fabrication and functionalization of biological graphene aerogel by reusing microorganism in activated sludge and ionic dyes. Chem. Eng. J. 2020, 392, 124823. [Google Scholar] [CrossRef]
- Yang, Z.; Shen, W.; Chen, Q.; Wang, W. Direct electrochemical reduction and dyeing properties of CI Vat Yellow 1 using carbon felt electrode. Dye. Pigment. 2021, 184, 108835. [Google Scholar] [CrossRef]
- Sun, D.; Gu, M.; Li, R.; Yin, S.; Song, X.; Zhao, B.; Li, C.; Li, J.; Feng, Z.; Sato, T. Effects of nitrogen content in monocrystalline nano-CeO2 on the degradation of dye in indoor lighting. Appl. Surf. Sci. 2013, 280, 693–697. [Google Scholar] [CrossRef]
- Rana, A.; Sudhaik, A.; Raizada, P.; Nguyen, V.H.; Xia, C.; Khan, A.A.P.; Thakur, S.; Nguyen-Tri, P.; Nguyen, C.C.; Kim, S.Y.; et al. Graphitic carbon nitride based immobilized and non-immobilized floating photocatalysts for environmental remediation. Chemosphere 2022, 297, 134229. [Google Scholar] [CrossRef]
- Hussain, S.; Mottahir Alam, M.; Imran, M.; Ashraf Ali, M.; Ahamad, T.; Haidyrah, A.S.; Raji Alotaibi, S.M.A.; Naik, M.; Shariq, M. A facile low-cost scheme for highly photoactive Fe3O4-MWCNTs nanocomposite material for degradation of methylene blue. Alex. Eng. J. 2022, 61, 9107–9117. [Google Scholar] [CrossRef]
- Passi, M.; Pal, B. Recent advances on visible light active non-typical stoichiometric oxygen-rich Bi12O17Cl2 photocatalyst for environment pollution remediation. J. Environ. Chem. Eng. 2022, 10, 107688. [Google Scholar] [CrossRef]
- Chen, L.; Guo, C.; Blawert, C.; Yang, J.; Chen, D.; Wang, X.; Yu, Z.; Zheludkevich, M.L.; Li, W. Evaluation of the biodegradation product layer on Mg-1Zn alloy during dynamical strain. J. Magnes. Alloy. 2021, 9, 1820–1833. [Google Scholar] [CrossRef]
- Almeida, G.; Mohallem, N.; Viana, M.M. Ag/GO/TiO2 nanocomposites: The role of the interfacial charge transfer for application in photocatalysis. Nanotechnology 2022, 33, 035710. [Google Scholar] [CrossRef]
- Chen, X.; Deng, T.S.; Zhou, M.; Dong, Z.; Cheng, Z. Mixed-phase TiO2 with oxygen vacancies for enhanced visible light photocatalysis performance. Nano 2022, 17, 2250025. [Google Scholar] [CrossRef]
- Li, J.; Xie, J.; Li, D.; Yu, L.; Xu, C.; Yan, S.; Lu, Y. An Interface Heterostructure of NiO and CeO2 for Using Electrolytes of Low-Temperature Solid Oxide Fuel Cells. Nanomaterials 2021, 11, 2004. [Google Scholar] [CrossRef]
- Foletto, E.L.; Battiston, S.; Collazzo, G.C.; Bassaco, M.M.; Mazutti, M.A. Degradation of Leather Dye Using CeO2-SnO2 Nanocomposite as Photocatalyst Under Sunlight. Water Air Soil Pollut. 2012, 223, 5773–5779. [Google Scholar] [CrossRef]
- Mousavi, S.; Shahraki, F.; Aliabadi, M.; Haji, A.; Deuber, F.; Adlhart, C. Nanofiber immobilized CeO2/dendrimer nanoparticles: An efficient photocatalyst in the visible and the UV. Appl. Surf. Sci. 2019, 479, 608–618. [Google Scholar] [CrossRef]
- Mishra, S.; Soren, S.; Debnath, A.K.; Aswal, D.K.; Das, N.; Parhi, P. Rapid microwave-Hydrothermal synthesis of CeO2 nanoparticles for simultaneous adsorption/photodegradation of organic dyes under visible light. Optik 2018, 169, 125–136. [Google Scholar] [CrossRef]
- Pu, Z.Y.; Liu, X.S.; Jia, A.P.; Xie, Y.L.; Lu, J.Q.; Luo, M.F. Enhanced Activity for CO Oxidation over Pr- and Cu-Doped CeO2 Catalysts: Effect of Oxygen Vacancies. J. Phys. Chem. C 2008, 112, 15045–15051. [Google Scholar] [CrossRef]
- Paunović, N.; Dohčević-Mitrović, Z.; Scurtu, R.; Aškrabić, S.; Prekajski, M.; Matović, B.; Popović, Z.V. Suppression of inherent ferromagnetism in Pr-doped CeO2 nanocrystals. Nanoscale 2012, 4, 5469. [Google Scholar] [CrossRef] [PubMed]
- Harada, K.; Oishi, T.; Hamamoto, S.; Ishihara, T. Lattice Oxygen Activity in Pr- and La-Doped CeO2 for Low-Temperature Soot Oxidation. J. Phys. Chem. C 2013, 118, 559–568. [Google Scholar] [CrossRef]
- Shannon, R.T. Revised effective ionic radii and systematic studies of interatomic distances in halides and chalcogenides. Acta Crystallogr. A 1976, 32, 751–767. [Google Scholar] [CrossRef]
- Alex, J.; Rajkumar, S.; PrincyMerlin, J.; Aravind, A.; Sajan, D.; Praveen, C.S. Single step auto-igniting combustion technique grown CeO2 and Ni-doped CeO2 nanostructures for multifunctional applications. J. Alloy. Compd. 2021, 882, 160409. [Google Scholar] [CrossRef]
- Dash, S.; Morita, T.; Kurokawa, K.; Matsuzawa, Y.; Saini, N.L.; Yamamoto, N.; Kajitani, J.; Higashinaka, R.; Matsuda, T.D.; Aoki, Y.; et al. Impact of valence fluctuations on the electronic properties of RO1-xFxBiS2 (R=Ce and Pr). Phys. Rev. B 2018, 98, 144501. [Google Scholar] [CrossRef]
- He, H.; Dai, H.; Au, C. Defective structure, oxygen mobility, oxygen storage capacity, and redox properties of RE-based (RE = Ce, Pr) solid solutions. Catal. Today 2004, 90, 245–254. [Google Scholar] [CrossRef]
- Glisenti, A.; Natile, M.M.; Galenda, A. PrMnO3 Prepared by the Citrate Gel Method, Studied by XPS. Surf. Sci. Spectra 2009, 16, 67–74. [Google Scholar] [CrossRef]
- Kozakov, A.T.; Kochur, A.G.; Trotsenko, V.G.; Nikolskii, A.V.; El Marssi, M.; Gorshunov, B.P.; Torgashev, V.I. Valence state of cations in manganites Pr1-xCaxMnO3 (0.3 ≤ x ≤ 0.5) from X-ray diffraction and X-ray photoelectron spectroscopy. J. Alloy. Compd. 2018, 740, 132–142. [Google Scholar] [CrossRef]
- Burroughs, P.; Hamnett, A.; Orchard, A.F.; Thornton, G. Satellite structure in the X-ray photoelectron spectra of some binary and mixed oxides of lanthanum and cerium. J. Chem. Soc. 1976, 1686–1698. [Google Scholar] [CrossRef]
- Yu, R.; Yan, L.; Zheng, P.; Chen, J.; Xing, X. Controlled Synthesis of CeO2 Flower-Like and Well-Aligned Nanorod Hierarchical Architectures by a Phosphate-Assisted Hydrothermal Route. J. Phys. Chem. C 2008, 112, 19896–19900. [Google Scholar] [CrossRef]
- Wu, Z.; Li, M.; Howe, J.; Meyer, H.M.; Overbury, S.H. Probing Defect Sites on CeO2 Nanocrystals with Well-Defined Surface Planes by Raman Spectroscopy and O2 Adsorption. Langmuir 2010, 26, 16595–16606. [Google Scholar] [CrossRef]
- Cai, W.; Chen, F.; Shen, X.; Chen, L.; Zhang, J. Enhanced catalytic degradation of AO7 in the CeO2-H2O2 system with Fe3+ doping. Appl. Catal. B—Environ. 2010, 101, 160–168. [Google Scholar] [CrossRef]
- Groen, J.C.; Peffer, L.A.A.; Pérez-Ramírez, J. Pore size determination in modified micro- and mesoporous materials. Pitfalls and limitations in gas adsorption data analysis. Micropor. Mesopor. Mat. 2003, 60, 1–17. [Google Scholar] [CrossRef]
- Manoharan, D.; Vishista, K. Optical Properties of Nano-Crystalline Cerium Dioxide Synthesized by Single Step Aqueous Citrate-Nitrate Gel Combustion Method. Asian J. Chem. 2013, 25, 9045–9049. [Google Scholar] [CrossRef]
- Bharathi, R.N.; Sankar, S. Structural, optical and magnetic properties of Pr doped CeO2 nanoparticles synthesized by citrate-nitrate auto combustion method. J. Mater. Sci. Mater. Electron. 2018, 29, 6679–6691. [Google Scholar] [CrossRef]
- Mersly, L.E.; El Mouchtari, E.M.; Moujahid, E.M.; Forano, C.; El Haddad, M.; Briche, S.; Tahiri, A.A.; Rafqah, S. ZnCr-LDHs with dual adsorption and photocatalysis capability for the removal of acid Orange 7 dye in aqueous solution. J. Sci. Adv. Mater. Dev. 2021, 6, 118–126. [Google Scholar] [CrossRef]
- Das, S.; Mishra, S. Insight into the isotherm modelling, kinetic and thermodynamic exploration of iron adsorption from aqueous media by activated carbon developed from Limonia acidissima shell. Mater. Chem. Phys. 2020, 245, 122751. [Google Scholar] [CrossRef]
- Chen, Y.; Yang, S.; Wang, K.; Lou, L. Role of primary active species and TiO2 surface characteristic in UV-illuminated photodegradation of Acid Orange 7. J. Photochem. Photobiol. A 2005, 172, 47–54. [Google Scholar] [CrossRef]
- Xu, S.; Ng, J.; Zhang, X.; Bai, H.; Sun, D.D. Adsorption and photocatalytic degradation of Acid Orange 7 over hydrothermally synthesized mesoporous TiO2 nanotube. Colloids Surf. A 2011, 379, 169–175. [Google Scholar] [CrossRef]
- Awitor, K.O.; Rafqah, S.; Géranton, G.; Sibaud, Y.; Larson, P.R.; Bokalawela, R.S.P.; Jernigen, J.D.; Johnson, M.B. Photo-catalysis using titanium dioxide nanotube layers. J. Photochem. Photobiol. A 2008, 199, 250–254. [Google Scholar] [CrossRef]
- Turhan, G.D.; Kartal, Ö.E. Photocatalytic activity of La3+-doped TiO2 synthesized via sol-gel method. Nanomater. Energy 2013, 2, 148–157. [Google Scholar] [CrossRef]
- Sajjad, A.K.L.; Shamaila, S.; Tian, B.; Chen, F.; Zhang, J. Comparative studies of operational parameters of degradation of azo dyes in visible light by highly efficient WOx/TiO2 photocatalyst. J. Hazard. Mater. 2010, 177, 781–791. [Google Scholar] [CrossRef] [PubMed]
- Paušová, Š.; Krýsa, J.; Jirkovský, J.; Forano, C.; Mailhot, G.; Prevot, V. Insight into the photocatalytic activity of ZnCr-CO3 LDH and derived mixed oxides. Appl. Catal. B—Environ. 2015, 170, 25–33. [Google Scholar] [CrossRef]
- Wang, X.; Xu, G.; Tu, Y.; Wu, D.; Li, A.; Xie, X. BiOBr/PBCD-B-D dual-function catalyst with oxygen vacancies for Acid Orange 7 removal: Evaluation of adsorption-photocatalysis performance and synergy mechanism. Chem. Eng. J. 2021, 411, 128456. [Google Scholar] [CrossRef]
- Ji, P.; Tian, B.; Chen, F.; Zhang, J. CeO2 mediated photocatalytic degradation studies of C.I. acid orange 7. Environ. Technol. 2012, 33, 467–472. [Google Scholar] [CrossRef]
- Chennakesavulu, K.; Reddy, G.R. Synthesis and characterization of carbon microtube/tantalum oxide composites and their photocatalytic activity under visible irradiation. RSC Adv. 2015, 5, 56391–56400. [Google Scholar] [CrossRef]


Publisher’s Note: MDPI stays neutral with regard to jurisdictional claims in published maps and institutional affiliations. |
© 2022 by the authors. Licensee MDPI, Basel, Switzerland. This article is an open access article distributed under the terms and conditions of the Creative Commons Attribution (CC BY) license (https://creativecommons.org/licenses/by/4.0/).