
Impact Behavior of Composite Reinforced Concrete Beams with Pultruded I-GFRP Beam


Abstract
:1. Introduction
2. Experimental Program
2.1. Details of Specimens
2.2. Material Properties
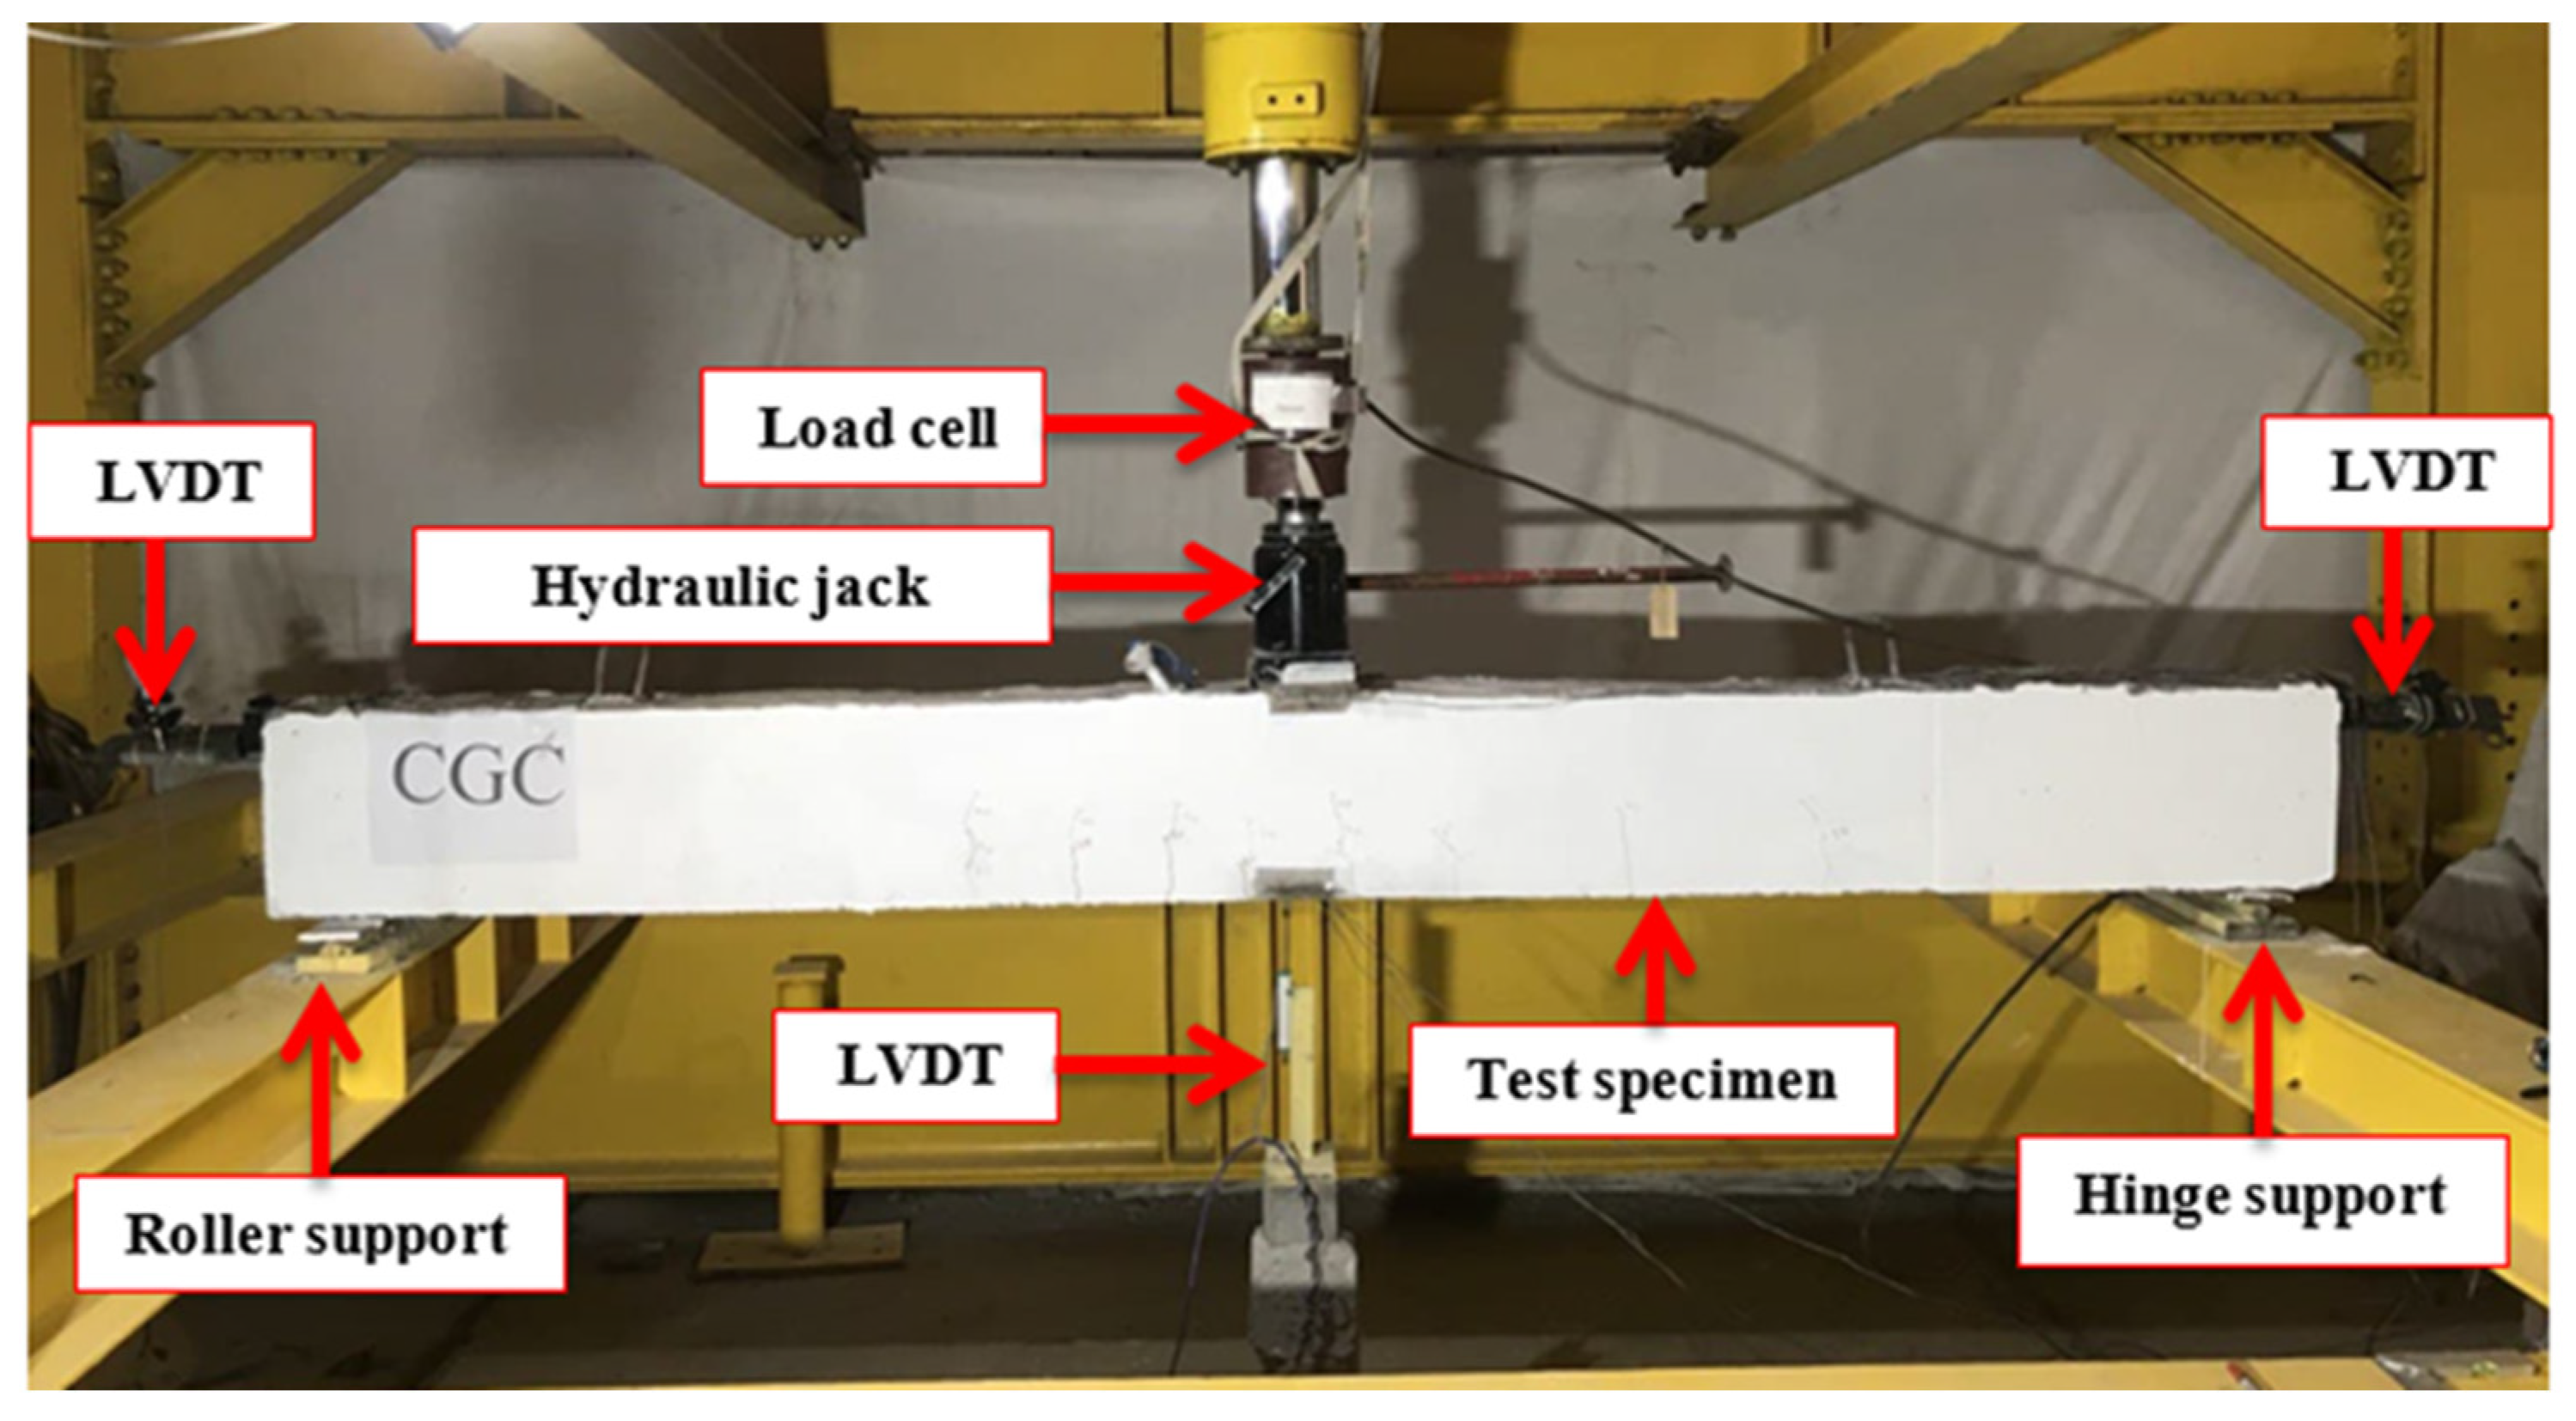
2.3. Instrumentation and Test Setup
2.3.1. Static Test
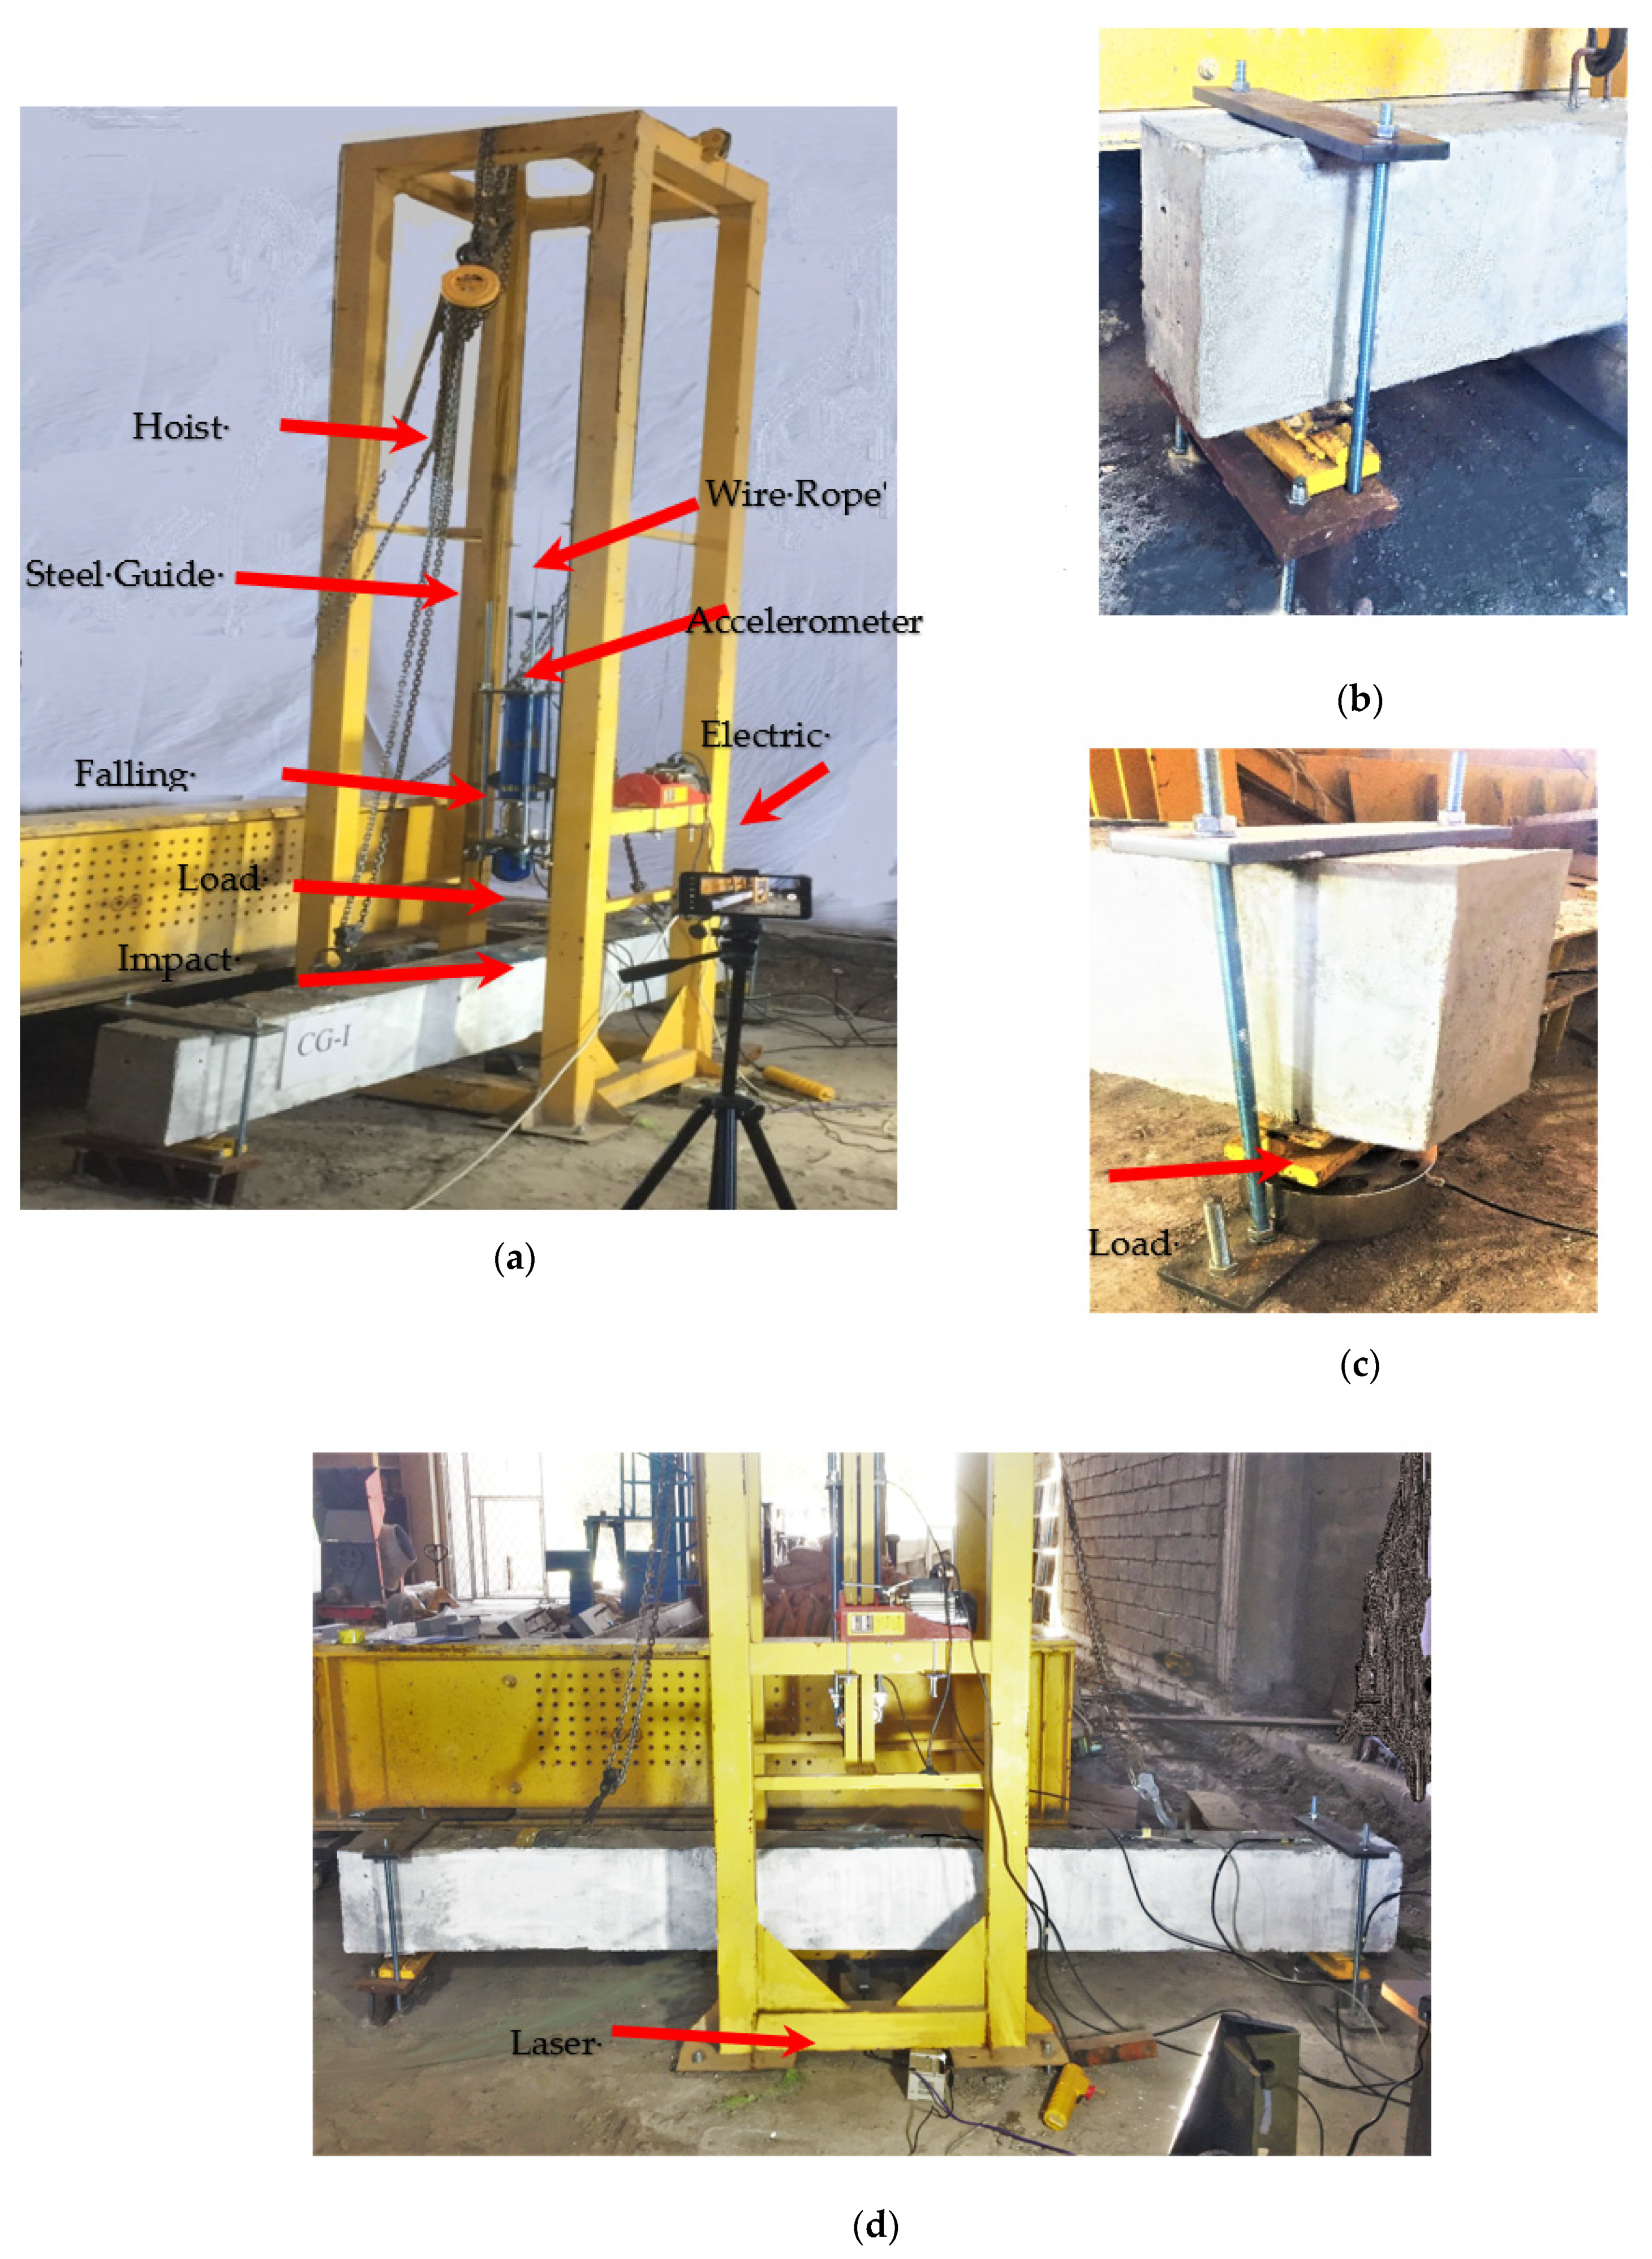
2.3.2. Impact Test
3. Experimental Results
3.1. Static Test Results
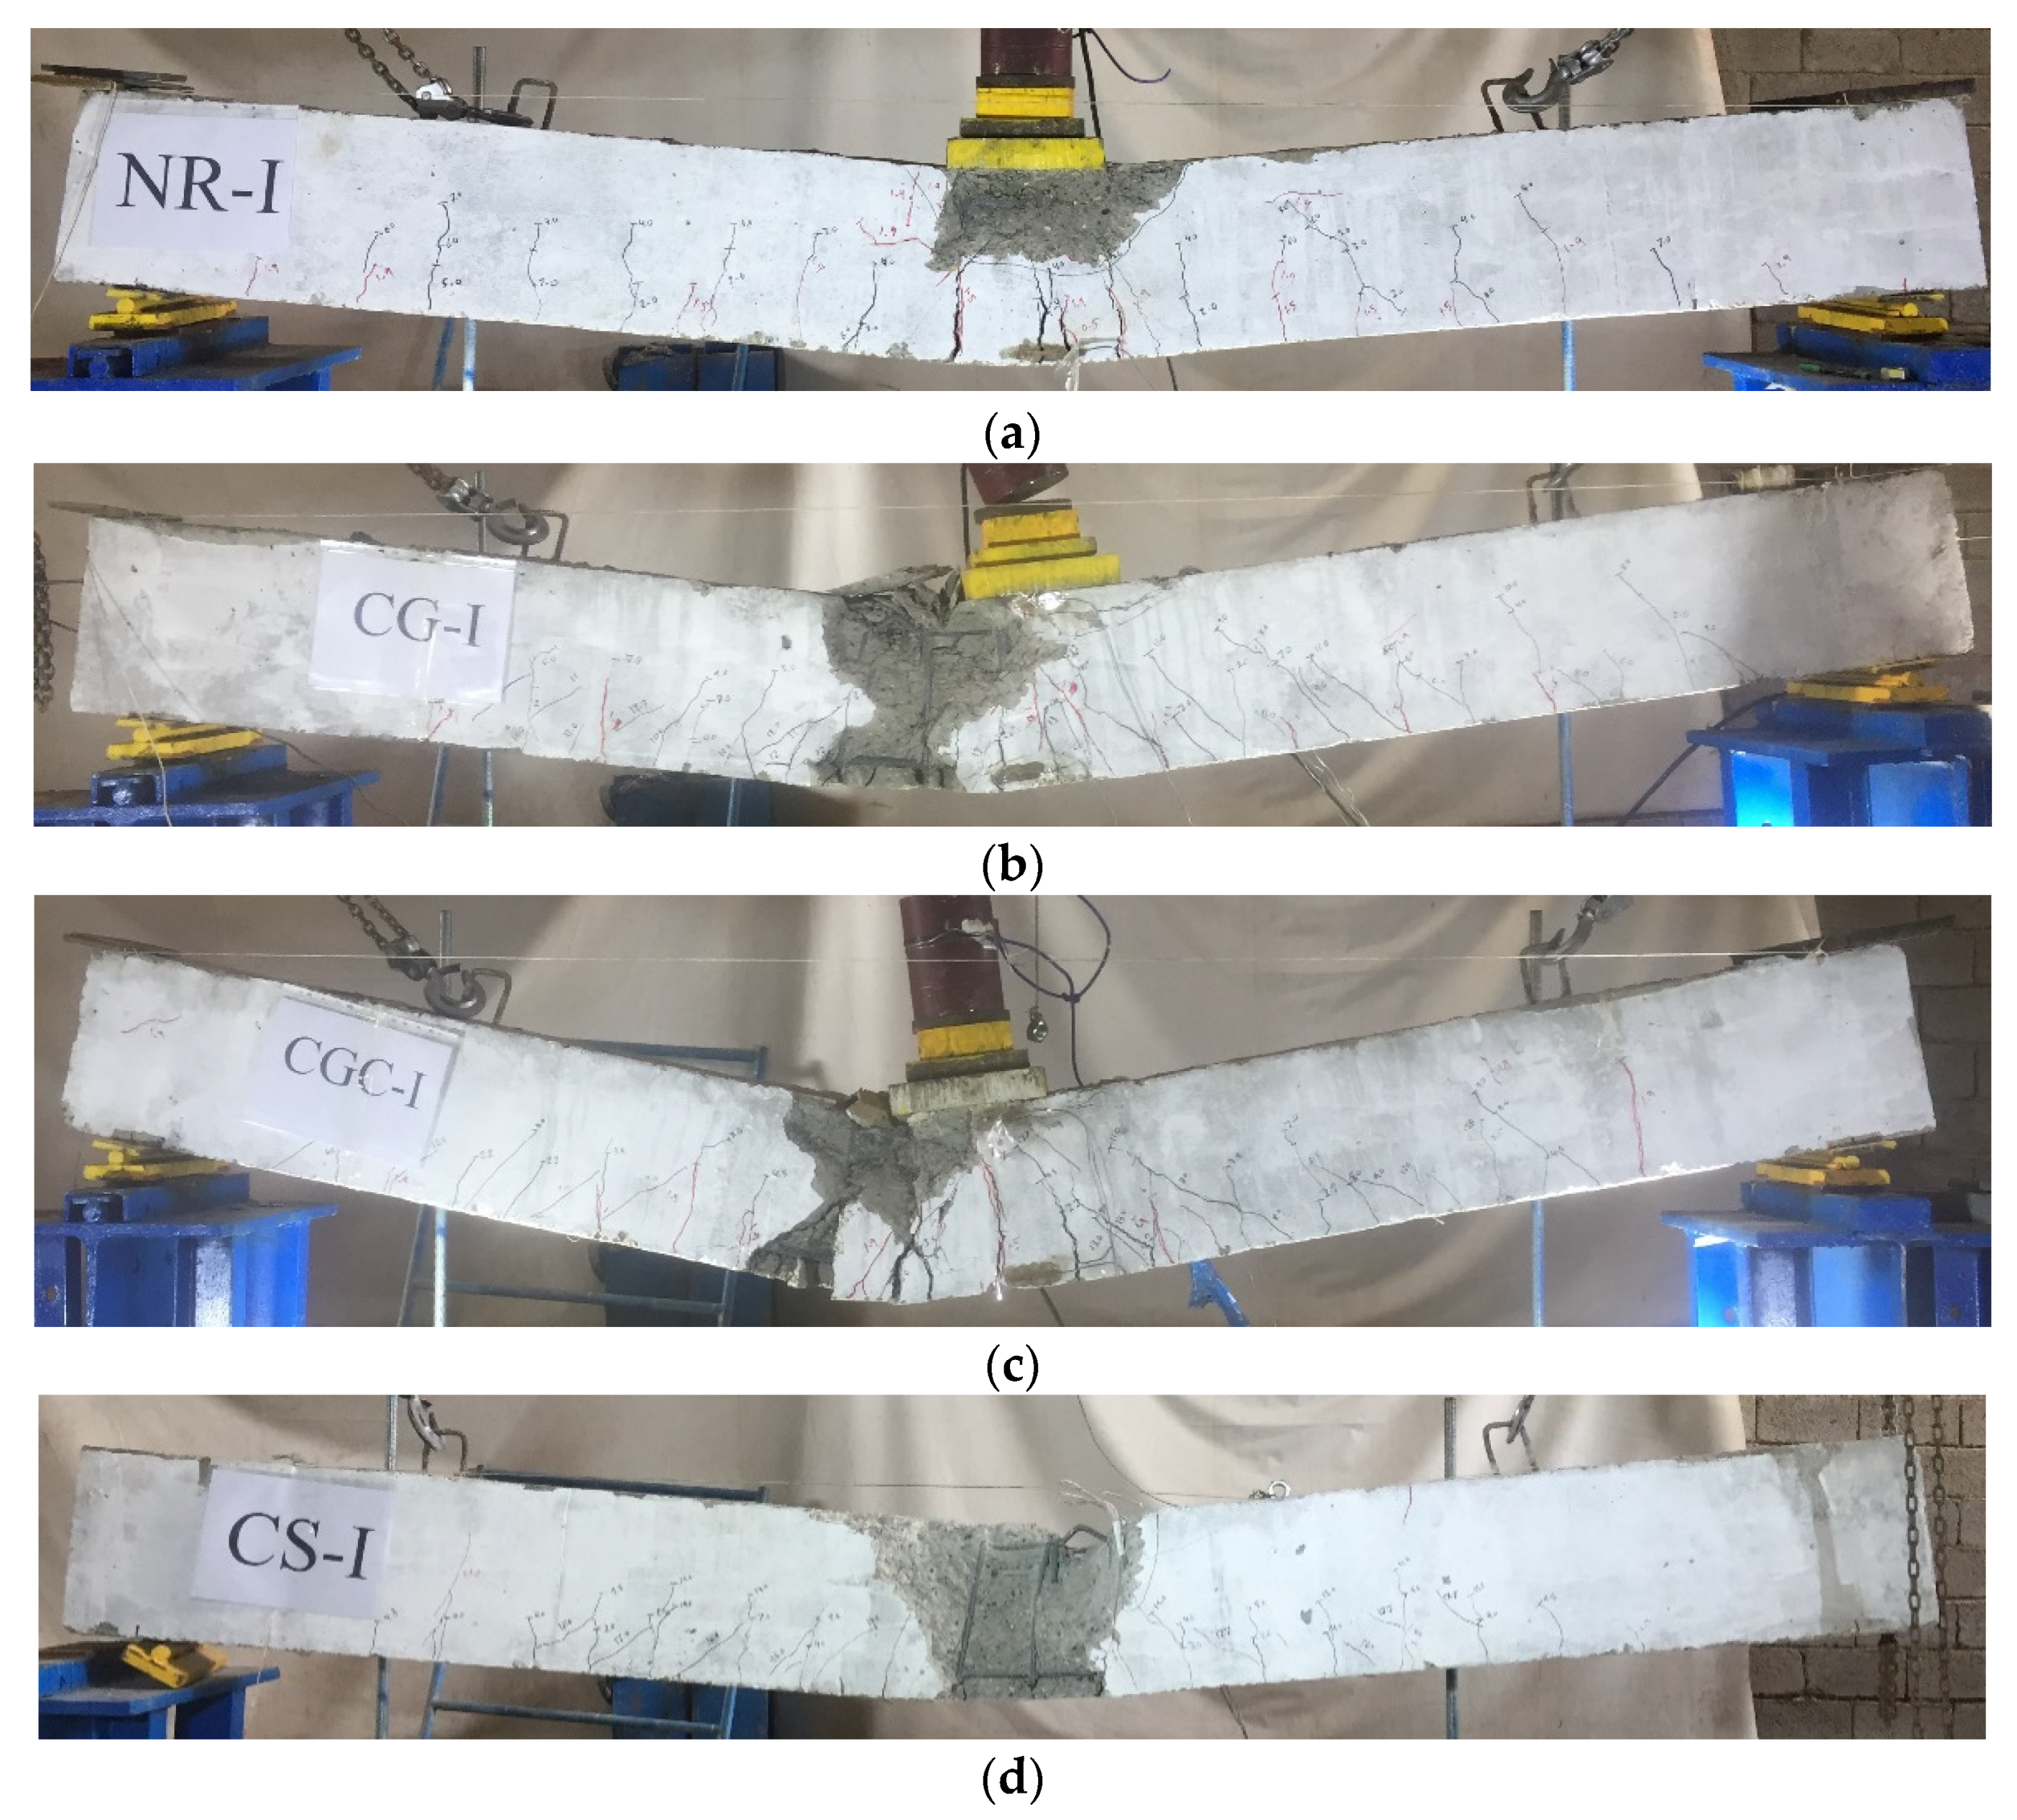
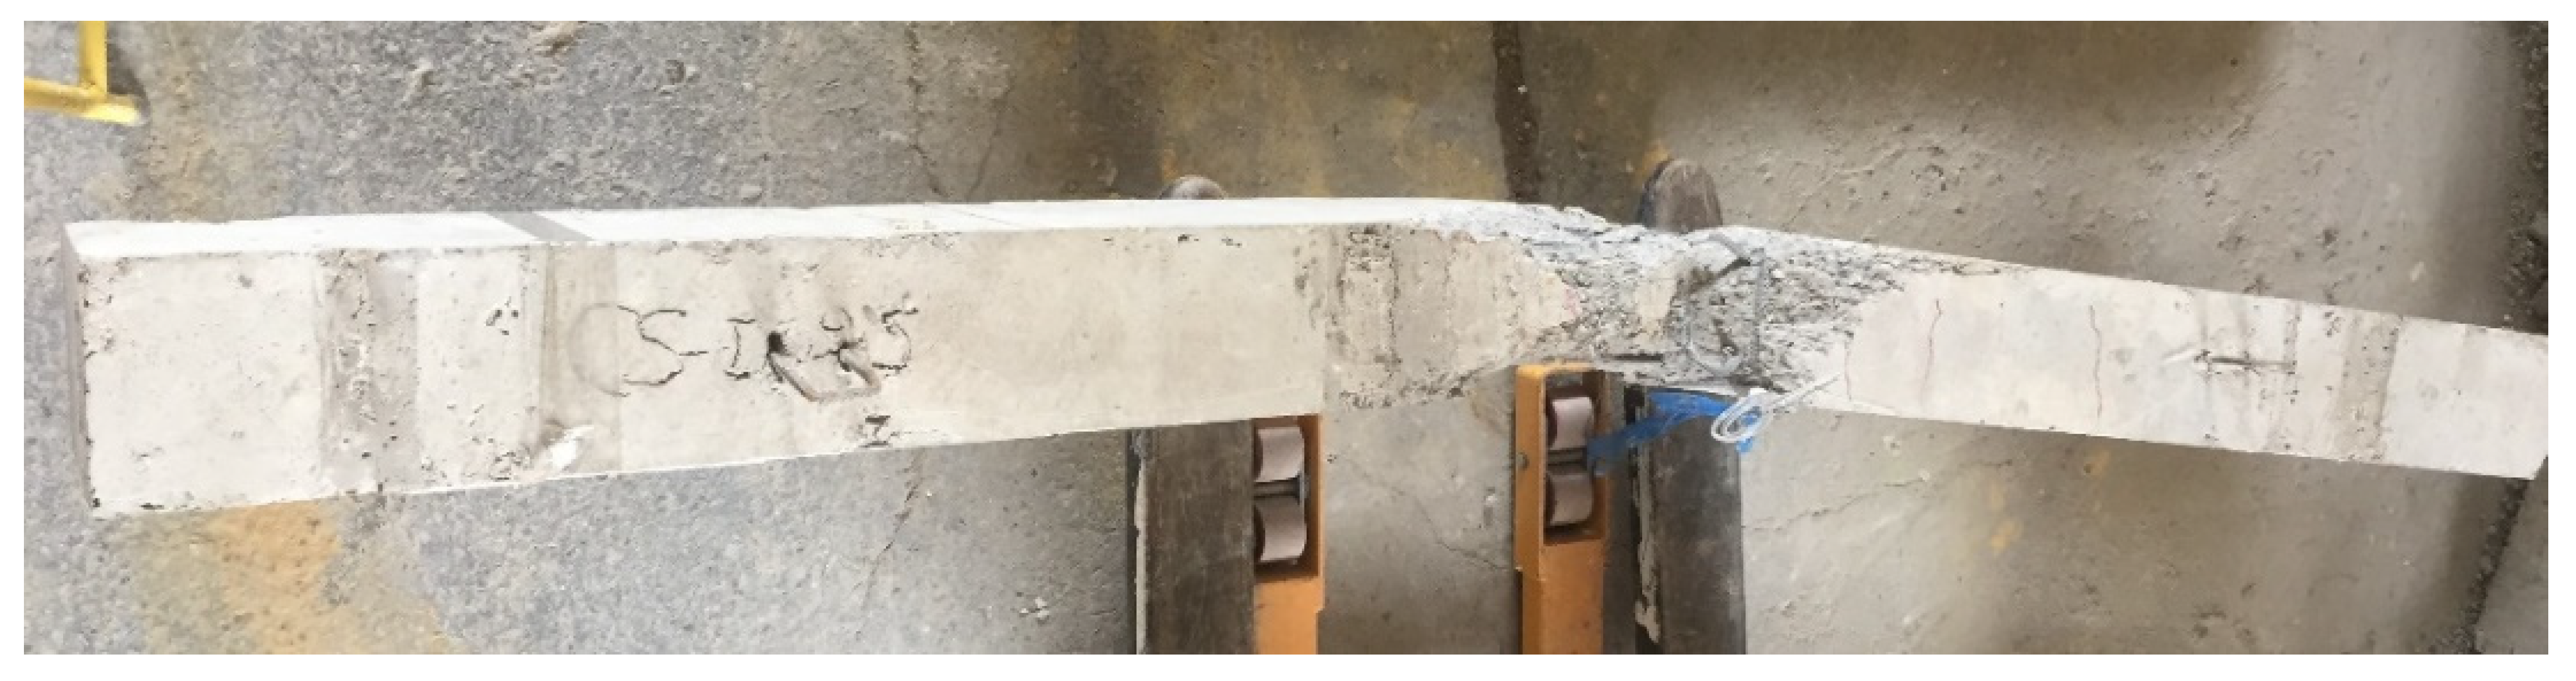
3.1.1. Crack Patterns and Modes of Failure
3.1.2. Load-Deflection Behavior
3.2. Impact Test Results
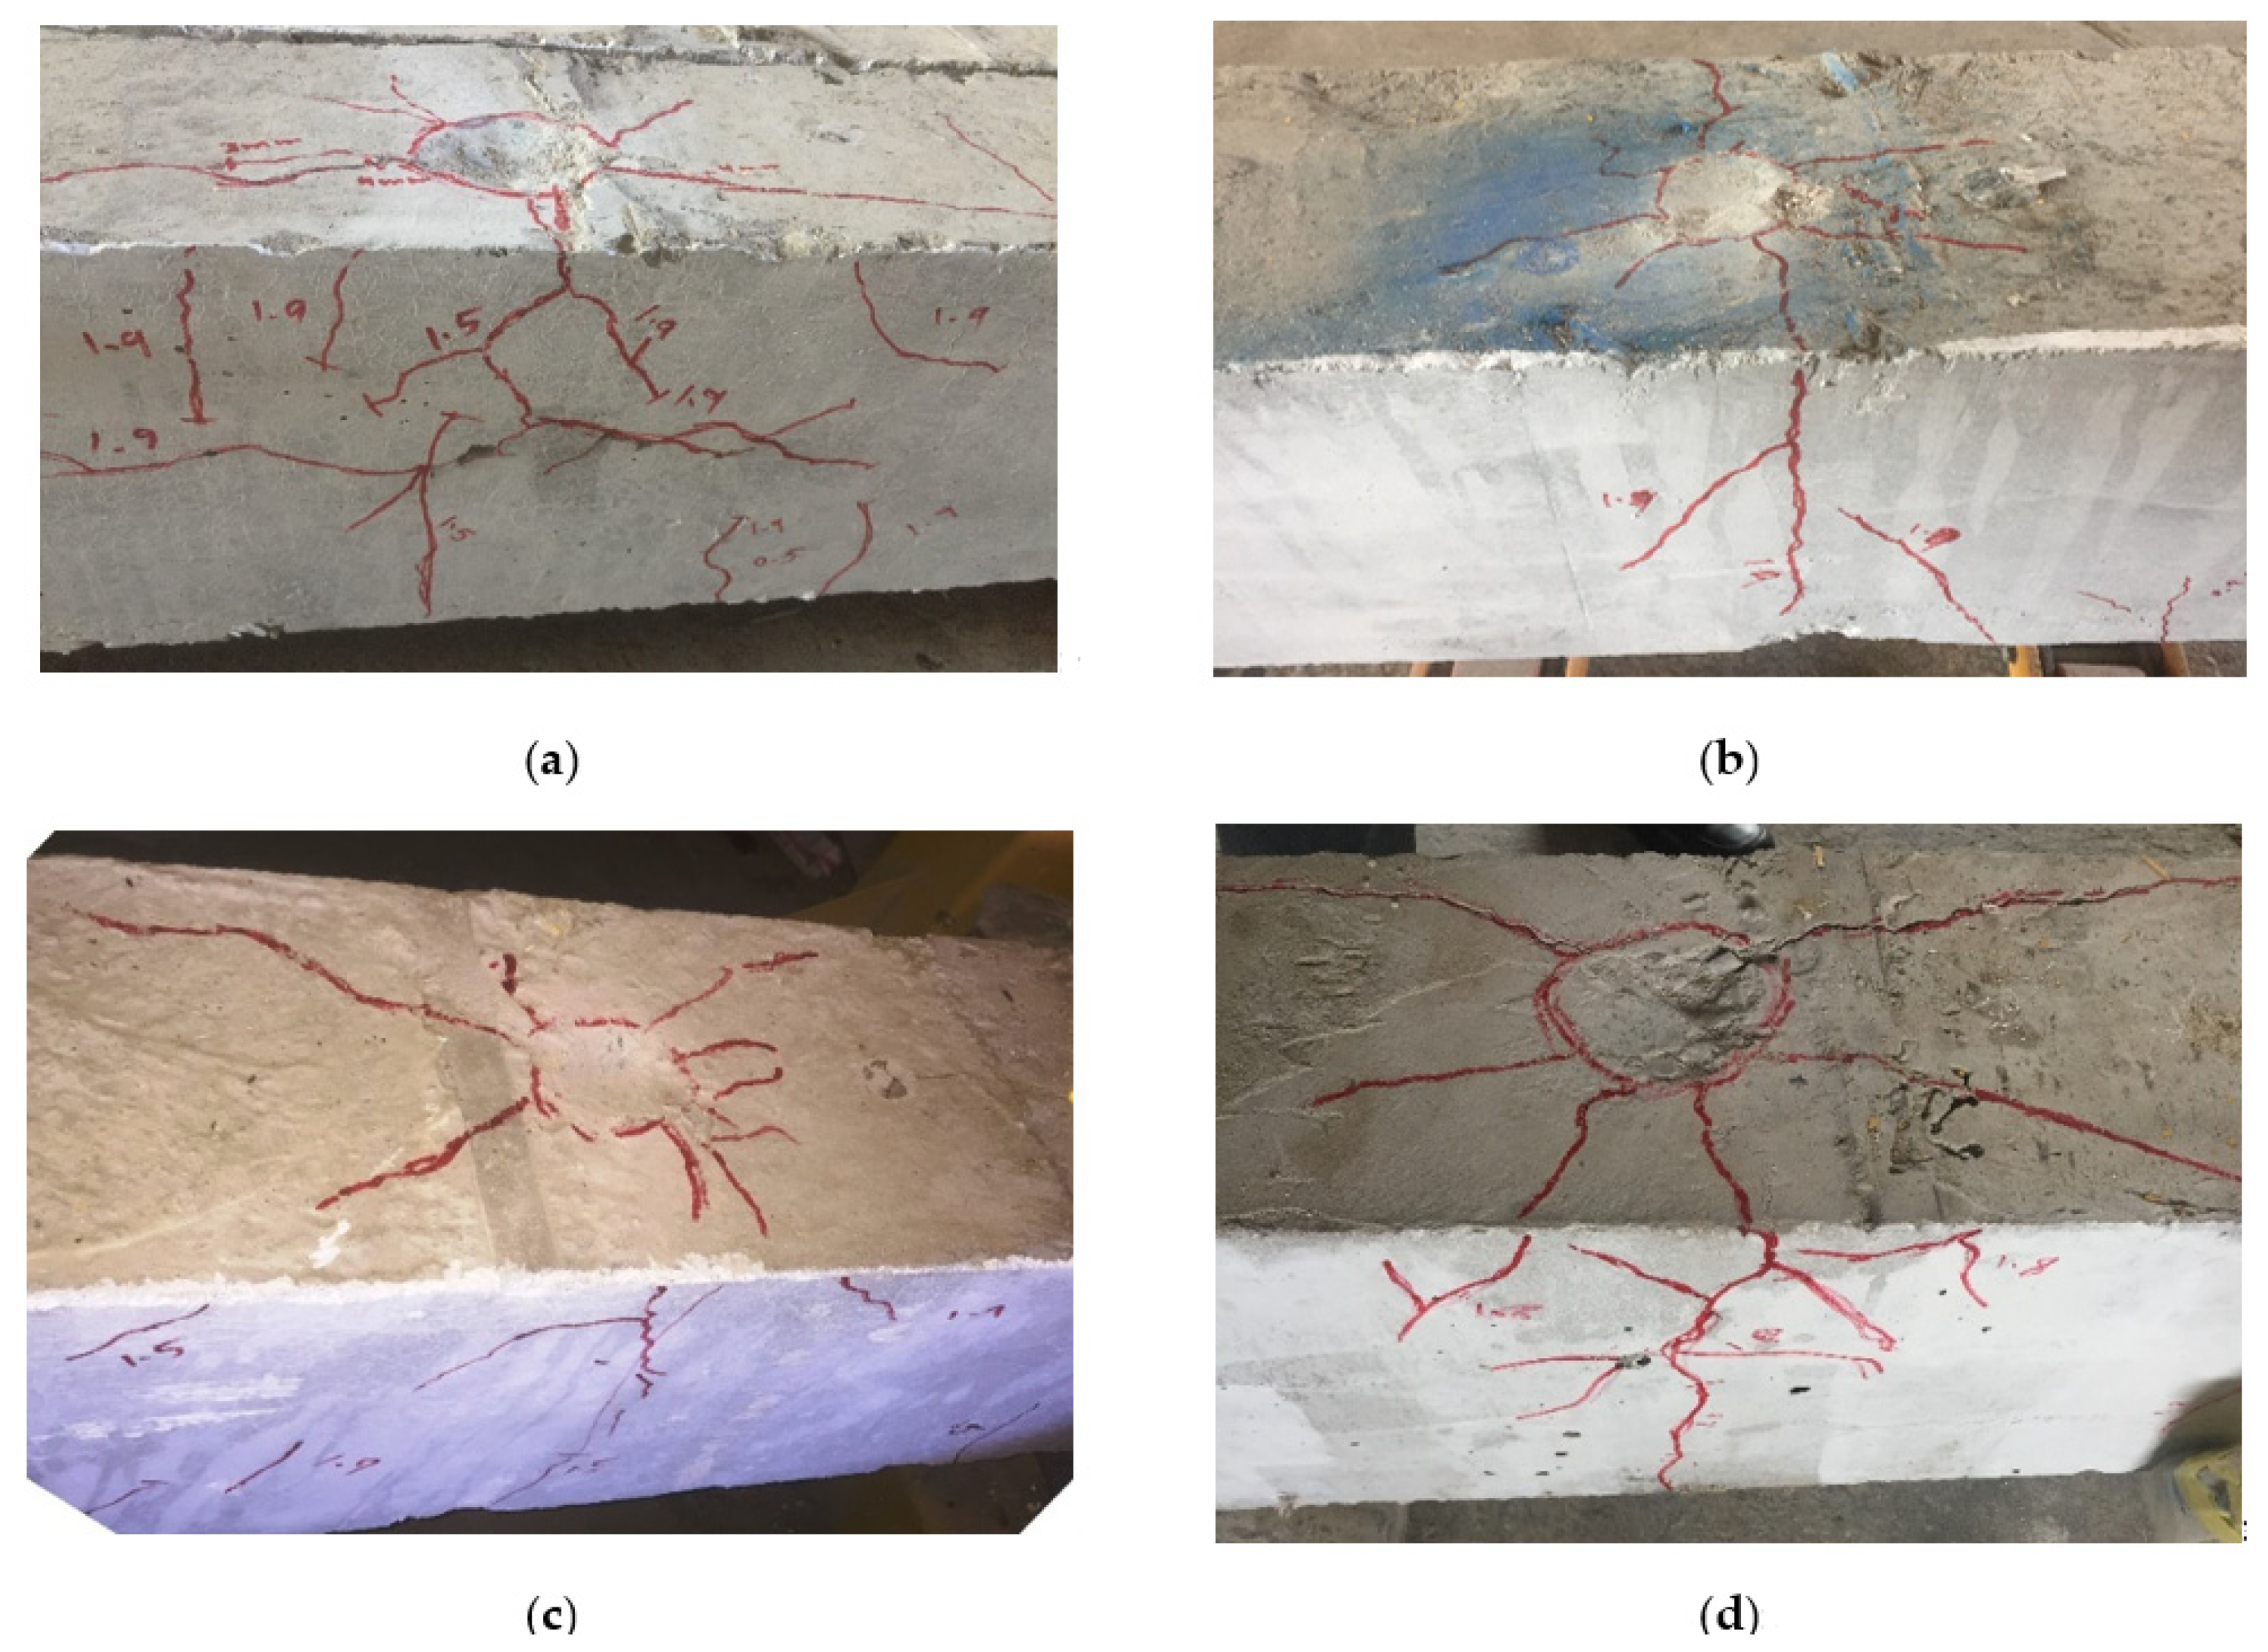
3.2.1. Crack Patterns and Modes of Failure
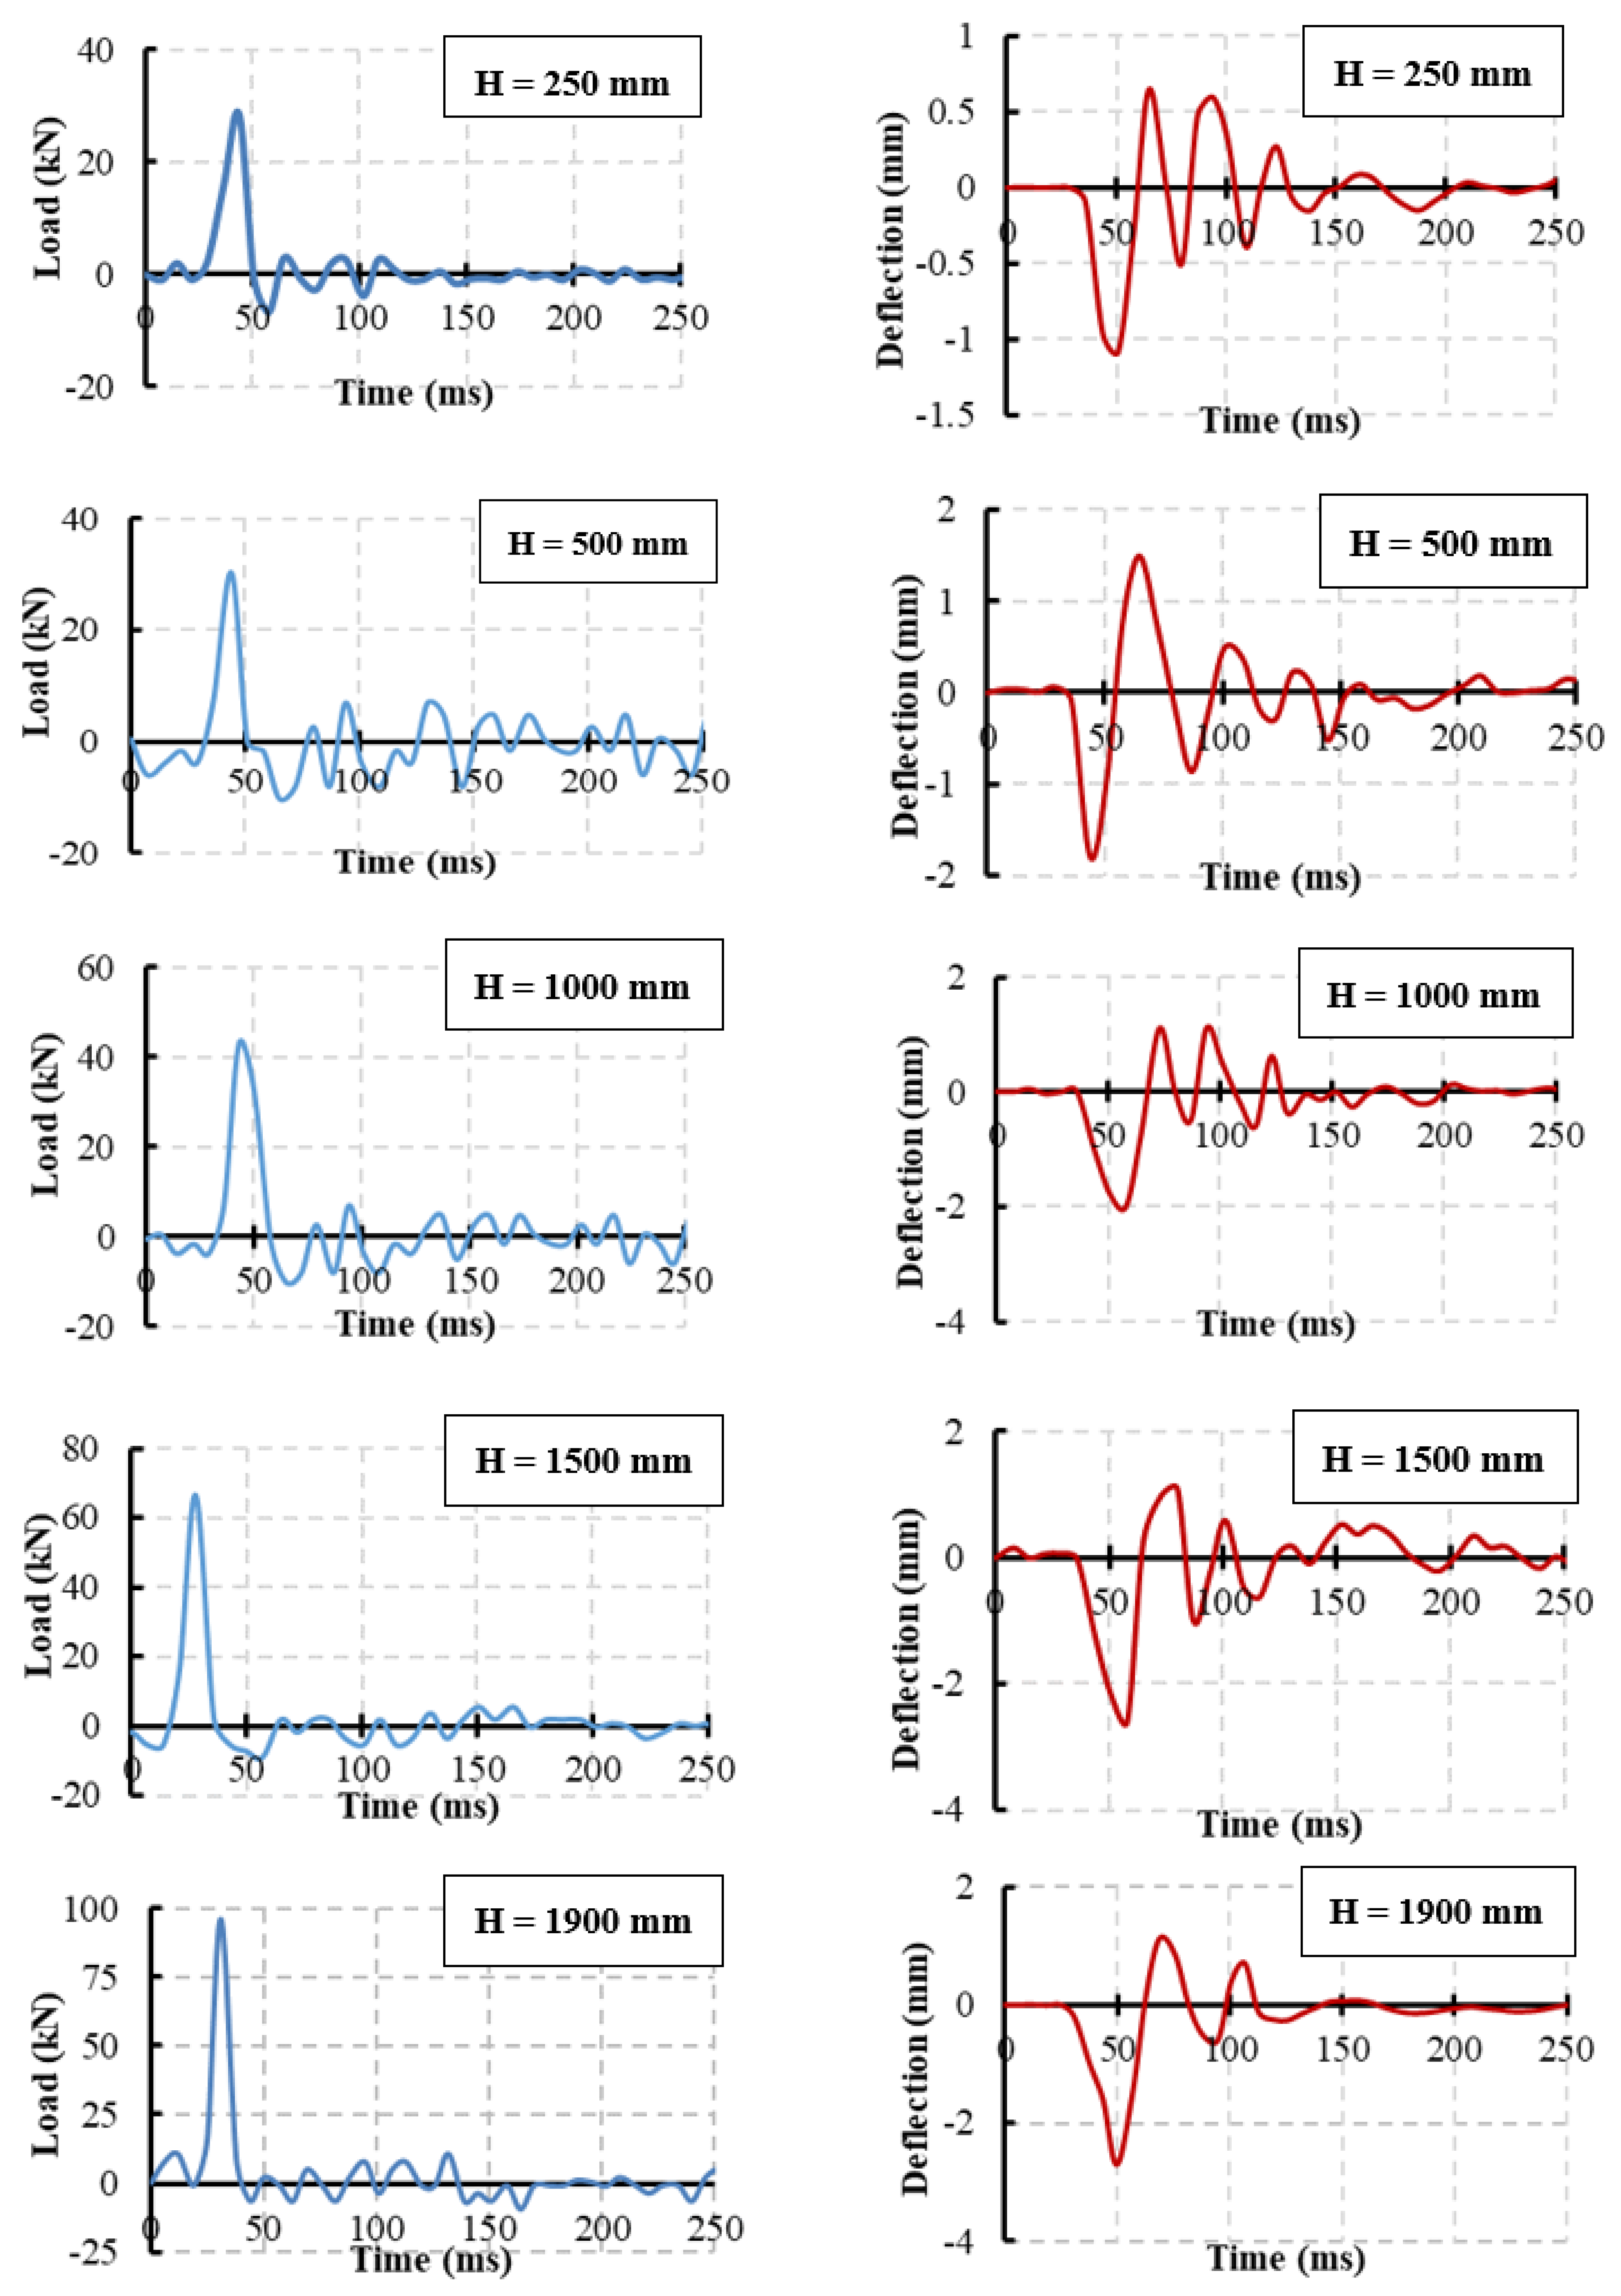
3.2.2. Impact Response
3.2.3. Residual Static Test after the Impact
4. Numerical Modeling
4.1. Finite Element Model
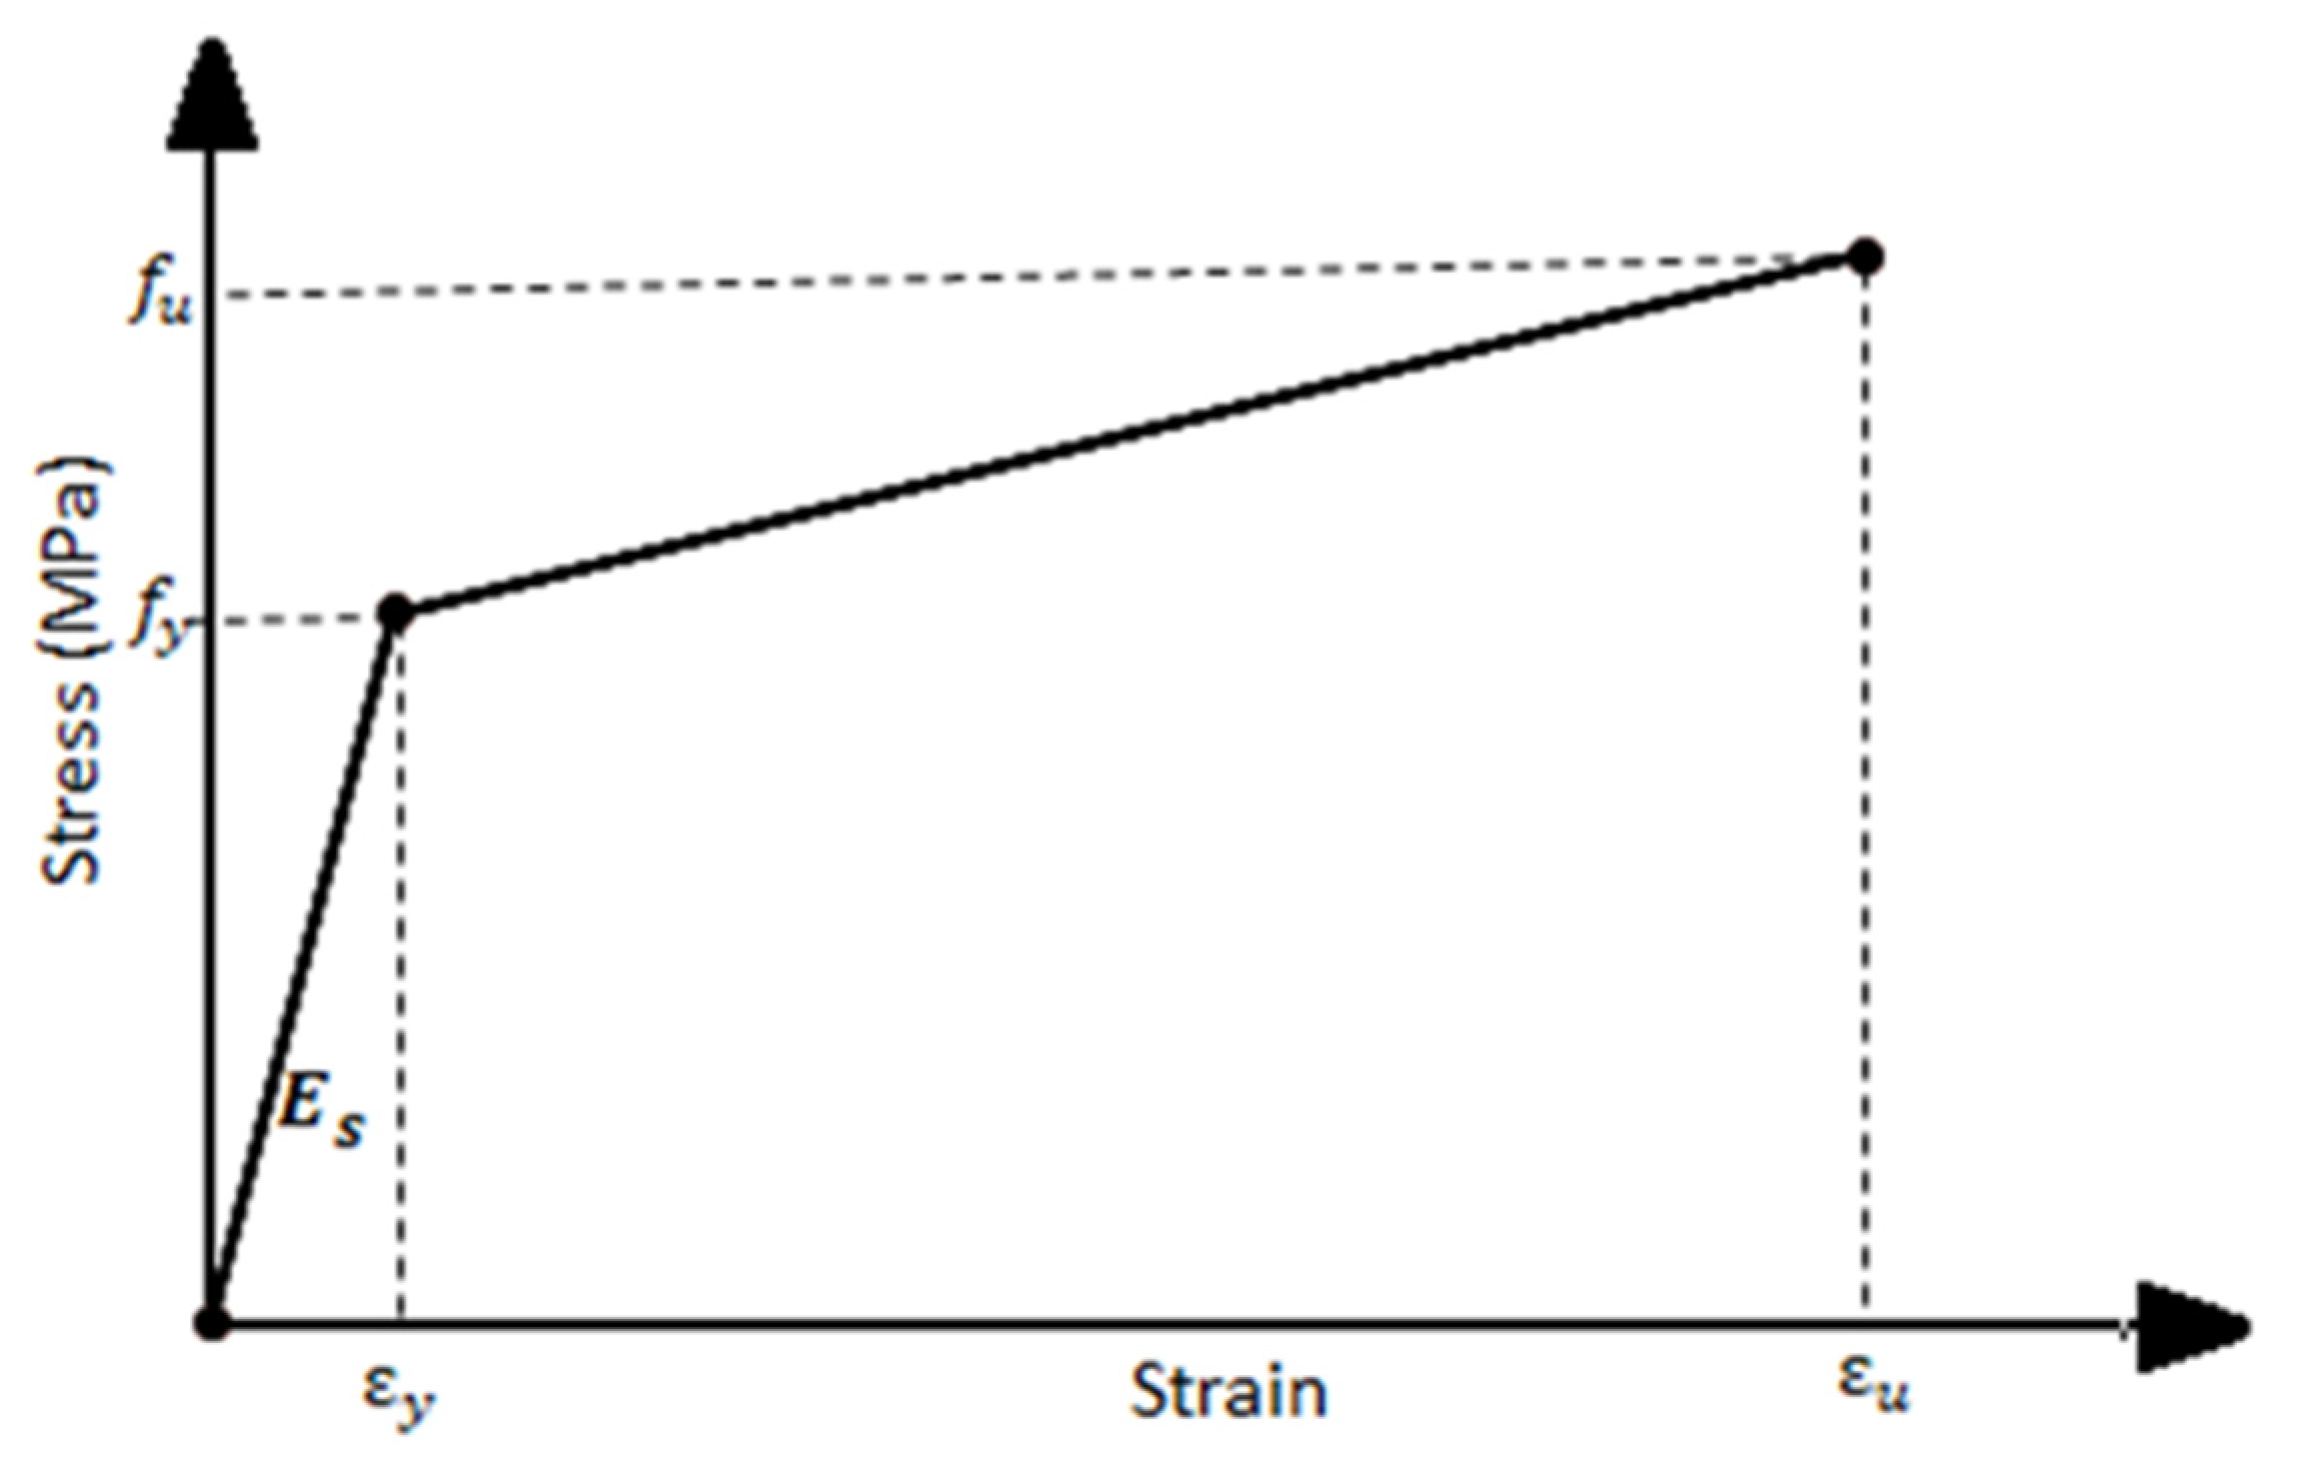
4.2. Material Models
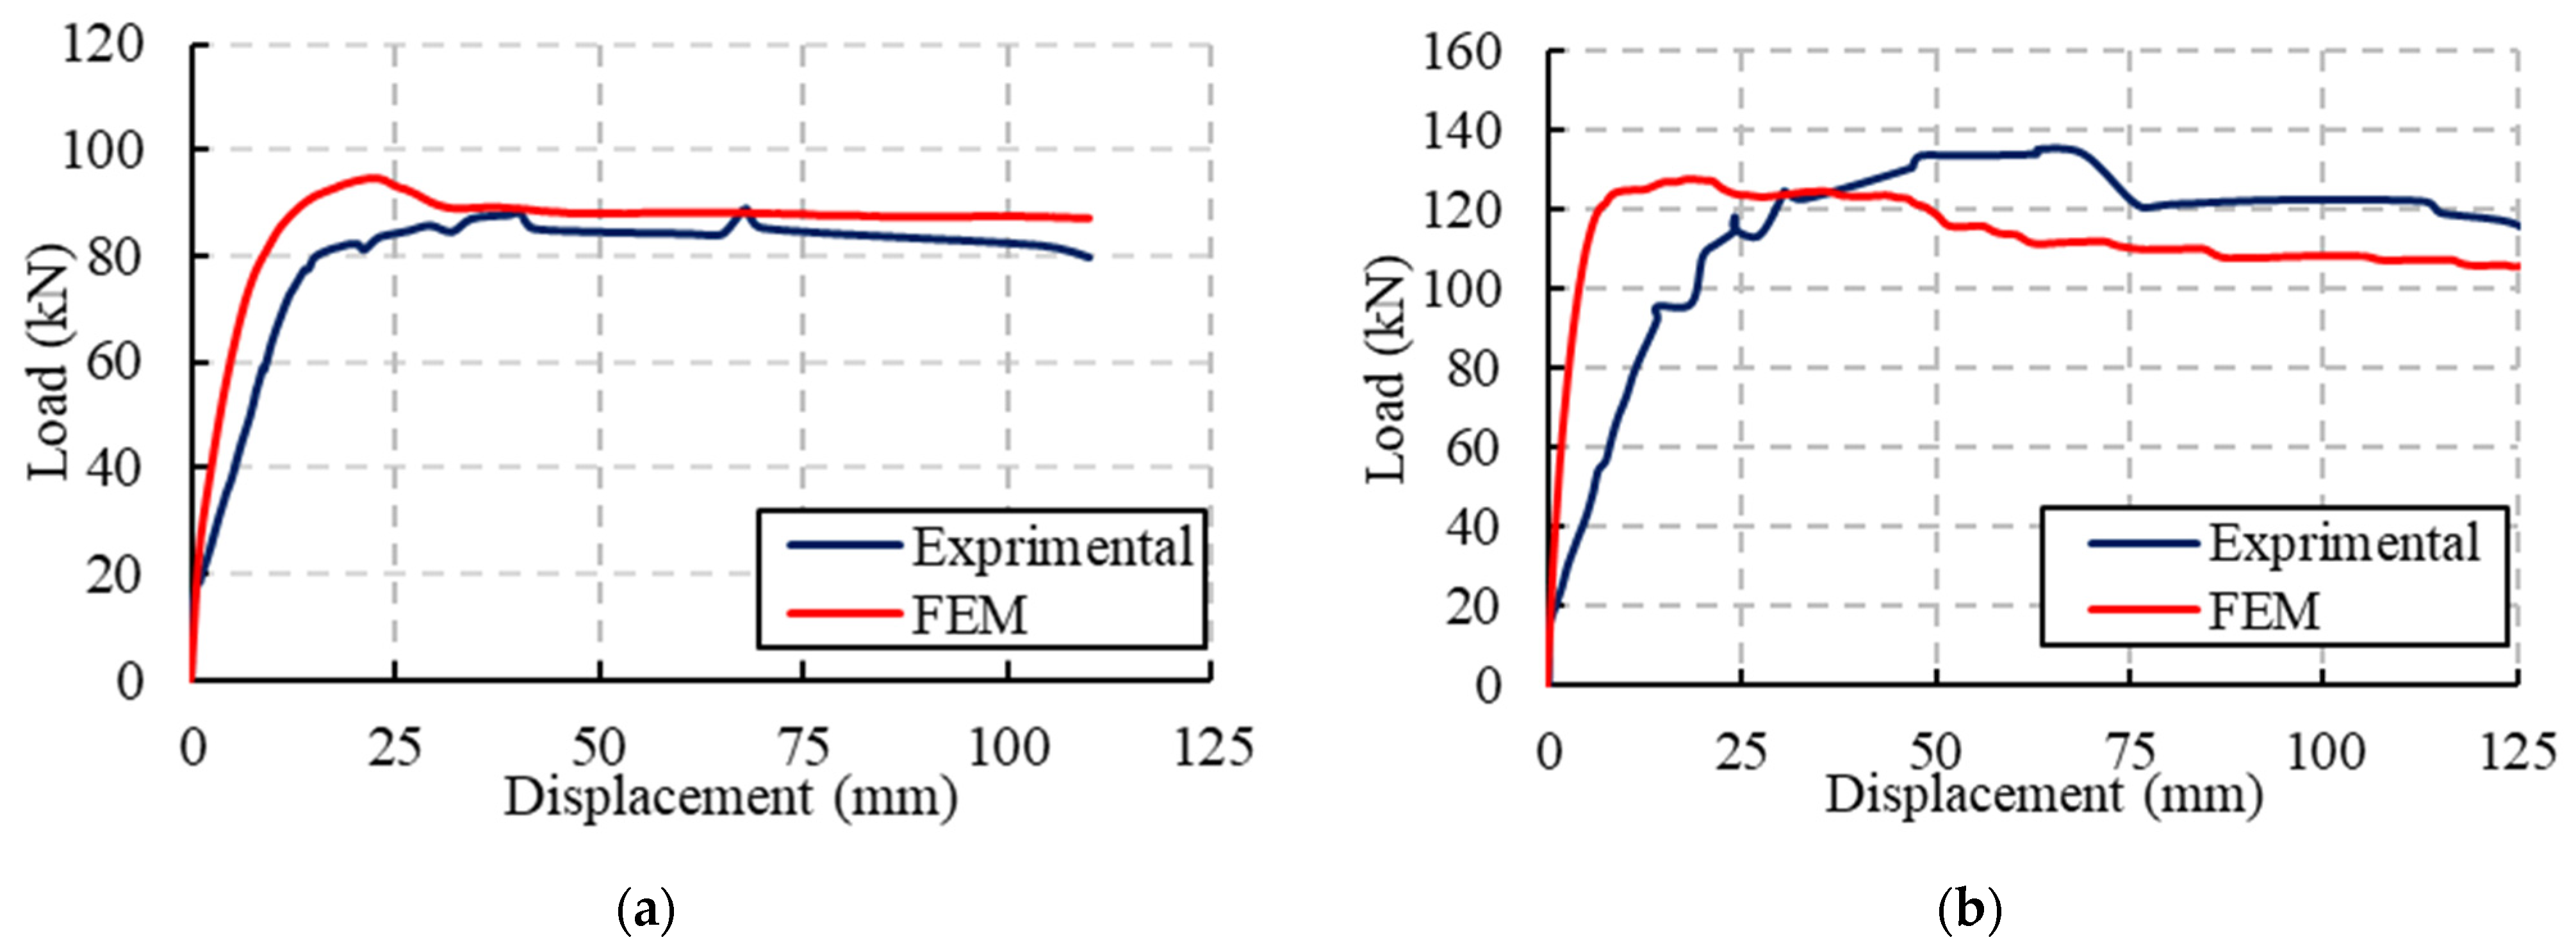
4.3. Static Analysis
Model Verifications
4.4. Impact Analysis
Model Verifications
5. Parametric Study
5.1. Static Analysis
5.2. Impact Analysis
6. Conclusions
- The embedded GFRP I-beam in the RC specimens with and without shear connectors increased the load-bearing capacity by 51% and 65%, respectively, relative to the reference specimen NR. However, this improvement was 100% in the case of using steel I-beam.
- Increasing the composite interaction between the GFRP I-beam and concrete by means of shear connectors improved the ultimate capacity by 9.5% relative to the composite specimen without shear connectors.
- For the composite specimen CS-I, the maximum impact force was 190% greater than the reference specimen NR-I at a drop height of 1900 mm whereas the maximum impact forces for specimens CG-I and CGC-I were 19% and 77%, respectively, more significant than the reference beam at the same drop height. The high stiffness for the steel I-beams relative to the GFRP I-beams was the reason for this difference in behavior, where the impact force is proportional to the structural stiffness.
- The composite specimens CG-I and CGC-I showed reductions in the maximum mid-span deflections relative to the reference specimen NR-I. For the 1900 mm drop height, reductions of 9.4% and 21% were obtained, respectively, whereas the composite specimen CS-I showed a 17% increase in the maximum mid-span deflection due to the high impact force caused by the section’s high stiffness.
- As the compressive strength increased, the static ultimate load capacity increased and the corresponding deflection decreased. For the composite specimens with GFRP I-beam, the ultimate load capacity was improved by 23% and 40% for compressive strengths 35 MPa and 45 MPa, respectively. However, these improvements were 13% and 22% for the reference specimen NR, respectively. On the other hand, the corresponding deflections were reduced by 60% for the specimen CG. However, these reductions were 23% and 48% for the concrete strength 35 MPa and 45 MPa, respectively, for the specimen CGC. These results confirmed the effectiveness of concrete strength to improve the stiffness of the composite specimens was less pronounced when the shear connectors were used.
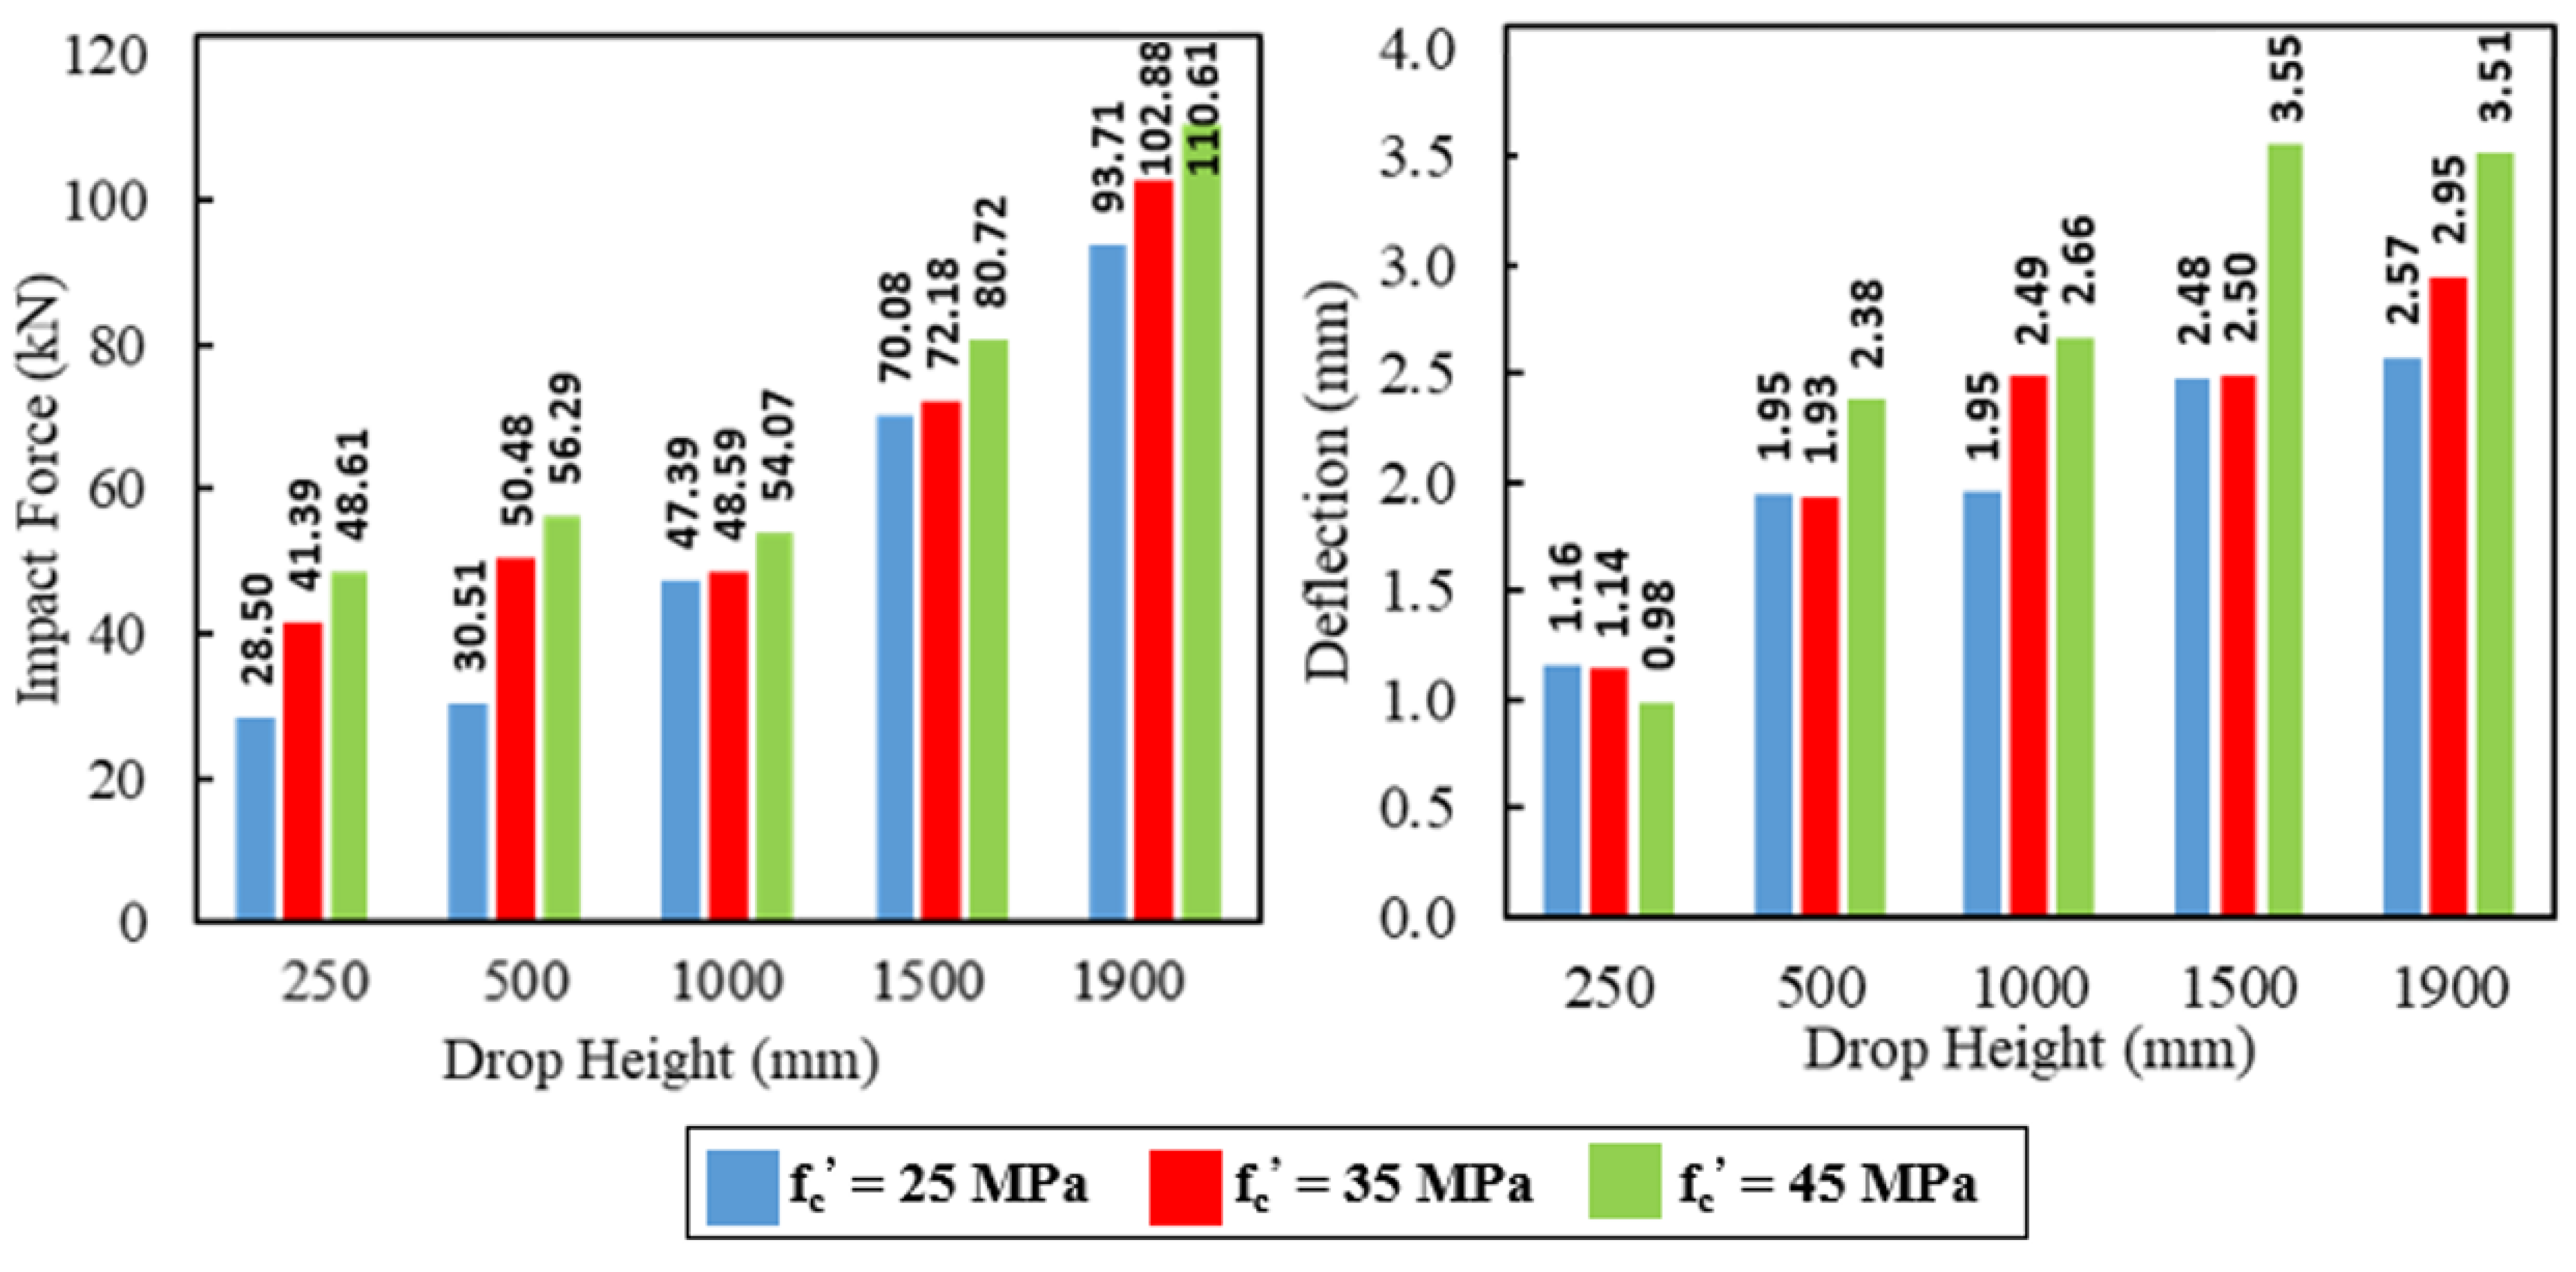
- The impact characteristics of the RC composite specimens with GFRP I-beam were influenced effectively by increasing the compressive strength of concrete. The average increase in the maximum impact load was between 18% and 25% for all specimens when the compressive strength was 35 MPa. However, it was between 30% and 40% when the compressive strength was 45 MPa. Therefore, the concrete compressive strength was more effective in improving the impact behavior of the composite specimens relative to those without GFRP I-beams.
Author Contributions
Funding
Institutional Review Board Statement
Informed Consent Statement
Data Availability Statement
Acknowledgments
Conflicts of Interest
References
- Neagoe, C.A.; Gil, L.; Pérez, M.A. Experimental study of GFRP-concrete hybrid beams with low degree of shear connection. Constr. Build. Mater. 2015, 101, 141–151. [Google Scholar] [CrossRef] [Green Version]
- Yuan, J.S.; Hadi, M.N.S. Flexural behavior of composite beam reinforced with GFRP I-beam. In Proceedings of the 6th Asia-Pacific Conference on FRP in Structures APFIS 2017, Singapore, 19–21 July 2017; pp. 19–21. [Google Scholar]
- Yu, Y.J.; Kim, C.-H.; Cho, J.-Y. Investigation of Behavior of RC Beams Subjected to Impact Loading Considering Combination of Mass and Impact Velocity. Procedia Eng. 2017, 210, 353–359. [Google Scholar] [CrossRef]
- Tabiei, A.; Svanson, A.; Hargrave, M. Impact behavior of pultruded composite box-beams. Compos. Struct. 1996, 36, 155–160. [Google Scholar] [CrossRef]
- Li, Z.; Khennane, A.; Hazell, P.J.; Remennikov, A.M. Performance of a hybrid GFRP-concrete beam subject to low-velocity impacts. Compos. Struct. 2018, 206, 425–438. [Google Scholar] [CrossRef]
- Soleimani, S.M.; Roudsari, S.S. Analytical study of reinforced concrete beams tested under quasi-static and impact loadings. Appl. Sci. 2019, 9, 2838. [Google Scholar] [CrossRef] [Green Version]
- Allawi, A.A.; Ali, S.I. Flexural behavior of composite GFRP pultruded I-section beams under static and impact loading. Civ. Eng. J. 2020, 6, 2143–2158. [Google Scholar] [CrossRef]
- Roudsari, S.; Hamoush, S.; Soleimani, S.; Abu-Lebdeh, T.; Haghighifar, M. Analytical Study of Reinforced Concrete Beams Strengthened by FRP Bars Subjected to Impact Loading Conditions. Am. J. Eng. Appl. Sci. 2018, 11, 407–425. [Google Scholar] [CrossRef]
- ASTM C496/C496M-17; Standard Test Method for Splitting Tensile Strength of Cylindrical Concrete Specimens. ASTM International: West Conshohocken, PA, USA, 2017.
- ASTM C469/C469M-14e1; Standard Test Method for Static Modulus of Elasticity and Poisson’s Ratio of Concrete in Compression. ASTM International: West Conshohocken, PA, USA, 2014.
- ASTM-A370-19; Standard Test Methods and Definitions for Mechanical Testing of Steel Products. ASTM International: West Conshohocken, PA, USA, 2019.
- ASTM-D695-15; Standard Test Method for Compressive Properties of Rigid Plastics. ASTM International: West Conshohocken, PA, USA, 2015.
- International Standard. ISO 527-4; Determination of Tensile Properties of Plastics Part 4. No. 1109. ISO: Geneva, Switzerland, 1997; p. 14.
- Abaqus. Abaqus 6.2: Computer Software for Finite Element Analysis; Dassault Systems Simulia: Johnston, RI, USA, 2020. [Google Scholar]
- EN 1992-1-1; Eurocode 2: Design of Concrete Structures—Part 1-1: General Rules and Rules for Buildings. British Standards Institution: London, UK, 2011.
- Barbero, E.J.; Cosso, F.A.; Roman, R.; Weadon, T.L. Determination of material parameters for ABAQUS progressive damage analysis of E-glass epoxy laminates. Compos. Part B Eng. 2013, 46, 211–220. [Google Scholar] [CrossRef]
- Hashin, Z. Failure criteria for unidirectional fiber composites. J. Appl. Mech. Trans. ASME 1980, 47, 329–334. [Google Scholar] [CrossRef]
- Barbero, E.J. Finite Element Analysis of Composite Materials Using ABAQUS; CRC Press Taylor and Francis Group: Boca Raton, FL, USA, 2013. [Google Scholar]


| Group | Specimens | Cross-Section (mm) | Specimen Weight (kg/m) | Type of Test | Type of Encased Beam | Connection * |
|---|---|---|---|---|---|---|
| I | NR | 200 × 300 | 503.89 | Static | N/A | NSC |
| CG | 200 × 300 | 509.83 | Static | GFRP I-beam | NSC | |
| CGC | 200 × 300 | 510.51 | Static | GFRP I-beam | SC | |
| CS | 200 × 300 | 529.8 | Static | Steel I-beam | NSC | |
| II | NR-I | 200 × 300 | 503.89 | Impact and Static | N/A | NSC |
| CG-I | 200 × 300 | 509.83 | Impact and Static | GFRP I-beam | NSC | |
| CGC-I | 200 × 300 | 510.51 | Impact and Static | GFRP I-beam | SC | |
| CS-I | 200 × 300 | 529.8 | Impact and Static | Steel I-beam | NSC |
| Slump Test (mm) | Compressive Strength * (MPa) | Compressive Strength ** (MPa) | Splitting Tensile Strength (MPa) | Modulus of Rupture (MPa) | Modulus of Elasticity (MPa) |
|---|---|---|---|---|---|
| 100 | 23.43 | 29.29 | 2.46 | 2.41 | 20,754.64 |
| Material | Diameter (mm) | Thickness (mm) | Yield Strength (MPa) | Transverse Compressive Strength (MPa) | Longitudinal Compressive Strength (MPa) | Longitudinal Tensile Strength (MPa) | Longitudinal Modulus of Elasticity (GPa) | Transverse Modulus of Elasticity (GPa) |
|---|---|---|---|---|---|---|---|---|
| Steel | 16 | - | 520.73 | - | - | 687.07 | 200 | - |
| 10 | - | 407.7 | - | - | 465.63 | 200 | - | |
| - | 10 | 375.9 | - | - | 479.63 | 200 | - | |
| GFRP | - | 10 | - | 118.3 | 326.14 | 347.5 | 27.1 | 6.8 |
| Specimens | Striker Mass (kg) | Drop Height (m) | Tested Acceleration of Striker m/s2 | Impact Velocity (m/s) | Kinetic Energy (Joule) | Momentum (kg·m/s) |
|---|---|---|---|---|---|---|
| NR-I | 42 | 0.25 | 7.63 | 1.95 | 80.09 | 82.02 |
| 42 | 0.5 | 6.31 | 2.51 | 132.53 | 105.51 | |
| 42 | 1.0 | 6.72 | 3.67 | 282.15 | 153.95 | |
| 42 | 1.5 | 6.55 | 4.43 | 412.66 | 186.18 | |
| 42 | 1.9 | 4.89 | 4.31 | 389.93 | 180.98 | |
| CG-I | 42 | 0.25 | 6.56 | 1.81 | 68.91 | 76.08 |
| 42 | 0.5 | 6.96 | 2.64 | 146.25 | 110.84 | |
| 42 | 1.0 | 5.45 | 3.30 | 228.84 | 138.64 | |
| 42 | 1.5 | 5.32 | 3.99 | 335.11 | 167.78 | |
| 42 | 1.9 | 5.86 | 4.72 | 467.28 | 198.12 | |
| CGC-I | 42 | 0.25 | 8.38 | 2.05 | 87.96 | 85.96 |
| 42 | 0.5 | 7.01 | 2.65 | 147.11 | 111.16 | |
| 42 | 1.0 | 7.51 | 3.87 | 315.32 | 162.75 | |
| 42 | 1.5 | 5.86 | 4.19 | 369.28 | 176.12 | |
| 42 | 1.9 | 8.26 | 5.60 | 659.38 | 235.35 | |
| CS-I | 42 | 0.25 | 6.14 | 1.75 | 64.50 | 73.61 |
| 42 | 0.5 | 7.57 | 2.75 | 158.94 | 115.55 | |
| 42 | 1.0 | 8.12 | 4.03 | 340.99 | 169.24 | |
| 42 | 1.5 | 6.68 | 4.48 | 420.94 | 188.04 | |
| 42 | 1.9 | 6.22 | 4.86 | 496.47 | 204.21 |
| Specimen | Crack Load Pcr (kN) | Yield Load Py (kN) | Ultimate Load Pu (kN) | Increase in Ultimate Load (%) | Mode of Failure |
|---|---|---|---|---|---|
| NR | 19.82 | 79.5 | 89.17 | - | Yield to steel bars and concrete crushing. |
| CG | 20.62 | 110.4 | 134.62 | 51 | Delamination and transverse shear failure in the web of the GFRP I-section. |
| CGC | 20.89 | 120.2 | 147.23 | 65 | Delamination and transverse shear failure in the web of the GFRP I-section. |
| CS | 30.03 | 162.5 | 178.3 | 100 | Yielding of steel I-section, crushing of compressive concrete. |
| Specimen | Height of Drop (mm) | Impact Force (kN) | % Change | Corresponding Mid-Span Deflection (mm) | % Change |
|---|---|---|---|---|---|
| NR-I | 250 | 28.52 | - | 1.20 | - |
| 500 | 30.21 | - | 1.80 | - | |
| 1000 | 43.02 | - | 2.00 | - | |
| 1500 | 66.53 | - | 2.60 | - | |
| 1900 | 95.82 | - | 2.70 | - | |
| CG-I | 250 | 46.79 | +64% | 1.09 | −9.1% |
| 500 | 62.83 | +30% | 1.59 | −11.6% | |
| 1000 | 86.58 | +100% | 1.95 | −2.5% | |
| 1500 | 95.32 | +43% | 2.39 | −8.1% | |
| 1900 | 113.98 | +19% | 2.41 | −10.7% | |
| CGC-I | 250 | 33.25 | +17% | 1.01 | −15.8 |
| 500 | 42.70 | +41% | 1.20 | −33.3% | |
| 1000 | 68.57 | +59% | 1.95 | −2.5% | |
| 1500 | 107.56 | +62% | 2.13 | −18.1% | |
| 1900 | 169.79 | +77% | 2.32 | −14.1 | |
| CS-I | 250 | 63.72 | +123% | 1.23 | 2.5% |
| 500 | 111.96 | +270% | 2.1 | 16.1% | |
| 1000 | 142.81 | +232% | 2.34 | 17.2% | |
| 1500 | 195.61 | +194% | 3.04 | 16.9% | |
| 1900 | 221.24 | +130% | 3.92 | 45.1% |
| Specimens | Without Impact Loads (kN) | With Impact Loads (kN) | Residual Static Strength (%) * |
|---|---|---|---|
| NR/NR-I | 89.17 | 75.2 | 84 |
| CG/CG-I | 134.62 | 133.1 | 99 |
| CGC/CGC-I | 147.23 | 137.5 | 93 |
| CS/CS-I | 178.3 | 163.3 | 91 |
| Parameter | φ | Eccentricity ε | fbo⁄fco | K | μ |
|---|---|---|---|---|---|
| Value | 31° | 0.1 | 1.16 | 0.667 | 0.001 |
| Definition | Value | |
|---|---|---|
| Engineering Elastic Constants | Longitudinal Modulus of Elasticity (Ez)E | 27.1 GPa ** |
| Transverse Modulus of Elasticity (Ex = Ey) | 6.8 GPa | |
| Transverse Shear Modulus of Elasticity (Gxy) | 17.5 GPa | |
| In-Plane Shear Modulus of Elasticity (Gzx = Gzy) | 2.7 GPa | |
| Major Poisson’ Ratio (υzx = υzy) | 0.23 | |
| Minor Poisson’ Ratio (υxy) | 0.1 | |
| Strength Values | Longitudinal Tensile Strength | 347.5 MPa |
| Longitudinal Compressive Strength | 326.14 MPa | |
| Transverse Tensile Strength | 50 MPa | |
| Transverse Compressive Strength | 118.3 MPa | |
| Transverse Shear Strength | 8.04 MPa | |
| In-Plane Shear Strength | 104.23 MPa | |
| Damage Evolution | Longitudinal Tensile Fracture Energy | 18.3 |
| Longitudinal Compressive Fracture Energy | 5.8 | |
| Transverse Tensile Fracture Energy | 5 | |
| Transverse Compressive Fracture Energy | 5.5 | |
| Damage Stabilization | Viscosity Coefficient in the Longitudinal Tensile Direction | 0.001 |
| Viscosity Coefficient in the Longitudinal Compressive Direction | 0.001 | |
| Viscosity Coefficient in the Transverse Tensile Direction | 0.001 | |
| Viscosity Coefficient in the Transverse Compressive Direction | 0.001 |
| Specimens | Compressive Strength (MPa) | Max. Load (kN) | Increase in Max. Load (%) | Deflection at Max. Load (mm) | Decrease in Deflection (%) |
|---|---|---|---|---|---|
| NR | 25 | 94.43 | - | 22.63 | - |
| 35 | 107.00 | 13.31 | 21.64 | 4.4 | |
| 45 | 115.64 | 22.46 | 20.27 | 10.4 | |
| CG | 25 | 127.5 | - | 18 | - |
| 35 | 156.71 | 23 | 7.28 | 59.6 | |
| 45 | 180.1 | 41.8 | 6.84 | 62 | |
| CGC | 25 | 141.19 | - | 14.127 | - |
| 35 | 173.88 | 23.15 | 10.83 | 23.3 | |
| 45 | 196.73 | 39.33 | 7.28 | 48.47 |
| Specimens | Compressive Strength (MPa) | Increase in Max. Impact Load (%) for Drop Height (mm) | Average Increasing Ratio (%) | ||||
|---|---|---|---|---|---|---|---|
| 250 | 500 | 1000 | 1500 | 1900 | |||
| NR-I | 35 | 45.25 | 65.44 | 2.53 | 3 | 9.78 | 25.2 |
| 45 | 70.56 | 84.48 | 14.1 | 15.18 | 18.03 | 40.47 | |
| CG-I | 35 | 13.31 | 7.76 | 27.14 | 28.27 | 16.02 | 18.5 |
| 45 | 26.59 | 12.98 | 37.76 | 39.58 | 31.85 | 29.75 | |
| CGC-I | 35 | 40.83 | 24.87 | 12.06 | 22.91 | 4.57 | 21.05 |
| 45 | 75.83 | 48.87 | 27.96 | 38 | 13.54 | 40.84 | |
| Specimens | Compressive Strength (MPa) | The Difference in Max. Deflection (%) for Drop Height (mm) | Average Difference Ratio (%) | ||||
|---|---|---|---|---|---|---|---|
| 250 | 500 | 1000 | 1500 | 1900 | |||
| NR-I | 35 | −1.4 | −0.9 | 27.27 | 0.89 | 14.59 | 9.03 |
| 45 | −14.9 | 22.18 | 36.48 | 43.5 | 36.56 | 30.72 | |
| CG-I | 35 | −16.7 | 6.32 | 39.03 | 29.15 | 5.46 | 19.34 |
| 45 | −28.1 | 47.15 | 58.38 | 52 | 12.14 | 39.56 | |
| CGC-I | 35 | −0.4 | 32.6 | 16.11 | 36.55 | 40.37 | 25.21 |
| 45 | −2.1 | 67.55 | 26.25 | 64 | 56.9 | 43.3 | |
Publisher’s Note: MDPI stays neutral with regard to jurisdictional claims in published maps and institutional affiliations. |
© 2022 by the authors. Licensee MDPI, Basel, Switzerland. This article is an open access article distributed under the terms and conditions of the Creative Commons Attribution (CC BY) license (https://creativecommons.org/licenses/by/4.0/).
Share and Cite
Ibrahim, T.H.; Allawi, A.A.; El-Zohairy, A. Impact Behavior of Composite Reinforced Concrete Beams with Pultruded I-GFRP Beam. Materials 2022, 15, 441. https://doi.org/10.3390/ma15020441
Ibrahim TH, Allawi AA, El-Zohairy A. Impact Behavior of Composite Reinforced Concrete Beams with Pultruded I-GFRP Beam. Materials. 2022; 15(2):441. https://doi.org/10.3390/ma15020441
Chicago/Turabian StyleIbrahim, Teghreed H., Abbas A. Allawi, and Ayman El-Zohairy. 2022. "Impact Behavior of Composite Reinforced Concrete Beams with Pultruded I-GFRP Beam" Materials 15, no. 2: 441. https://doi.org/10.3390/ma15020441