Author Contributions
Conceptualization, J.-F.C. and H.K.; Methodology, A.B., J.S., M.L., J.-F.C. and H.K.; validation, H.K.; investigation, A.B., C.R.; data curation, A.B., C.R., writing—original draft preparation, A.B.; writing—review and editing, H.K.; visualization, H.K.; supervision, J.-F.C., H.K.; project administration, J.-F.C., H.K. All authors have read and agreed to the published version of the manuscript.
Figure 1.
Micro-shrinkage porosity.
Figure 1.
Micro-shrinkage porosity.
Figure 2.
Casting device.
Figure 2.
Casting device.
Figure 3.
(a) Ingot cross section prior to normalization treatment. Red: boundary between columnar and equiaxed the black squares correspond to the zooms presented in figures (b,c). (b) Columnar zone, (c) equiaxed zone. (d) Sample cutting localization and labels for microstructure analyzes on an ingot after normalizing heat treatment.
Figure 4.
(a) Type 100 ingot with indication of wire cutting positions (skin in red, core in blue) for cylindrical bars. (b) Tensile and fatigue sample geometry.
Figure 4.
(a) Type 100 ingot with indication of wire cutting positions (skin in red, core in blue) for cylindrical bars. (b) Tensile and fatigue sample geometry.
Figure 5.
Metallographic observations after Nital etching in: (a) the skin (A4) and (b) core (C4) parts.
Figure 5.
Metallographic observations after Nital etching in: (a) the skin (A4) and (b) core (C4) parts.
Figure 6.
MnS type III (a,b), typical EDS observation of one of the particles (c).
Figure 6.
MnS type III (a,b), typical EDS observation of one of the particles (c).
Figure 7.
Probability density distribution p in function of the void volume v.
Figure 7.
Probability density distribution p in function of the void volume v.
Figure 8.
Micro-shrinkage characterization. (a) Sphericity in function of the volume v, and (b) total surface in function of the volume v.
Figure 8.
Micro-shrinkage characterization. (a) Sphericity in function of the volume v, and (b) total surface in function of the volume v.
Figure 9.
Tensile and compressive curve for skin and core specimens.
Figure 9.
Tensile and compressive curve for skin and core specimens.
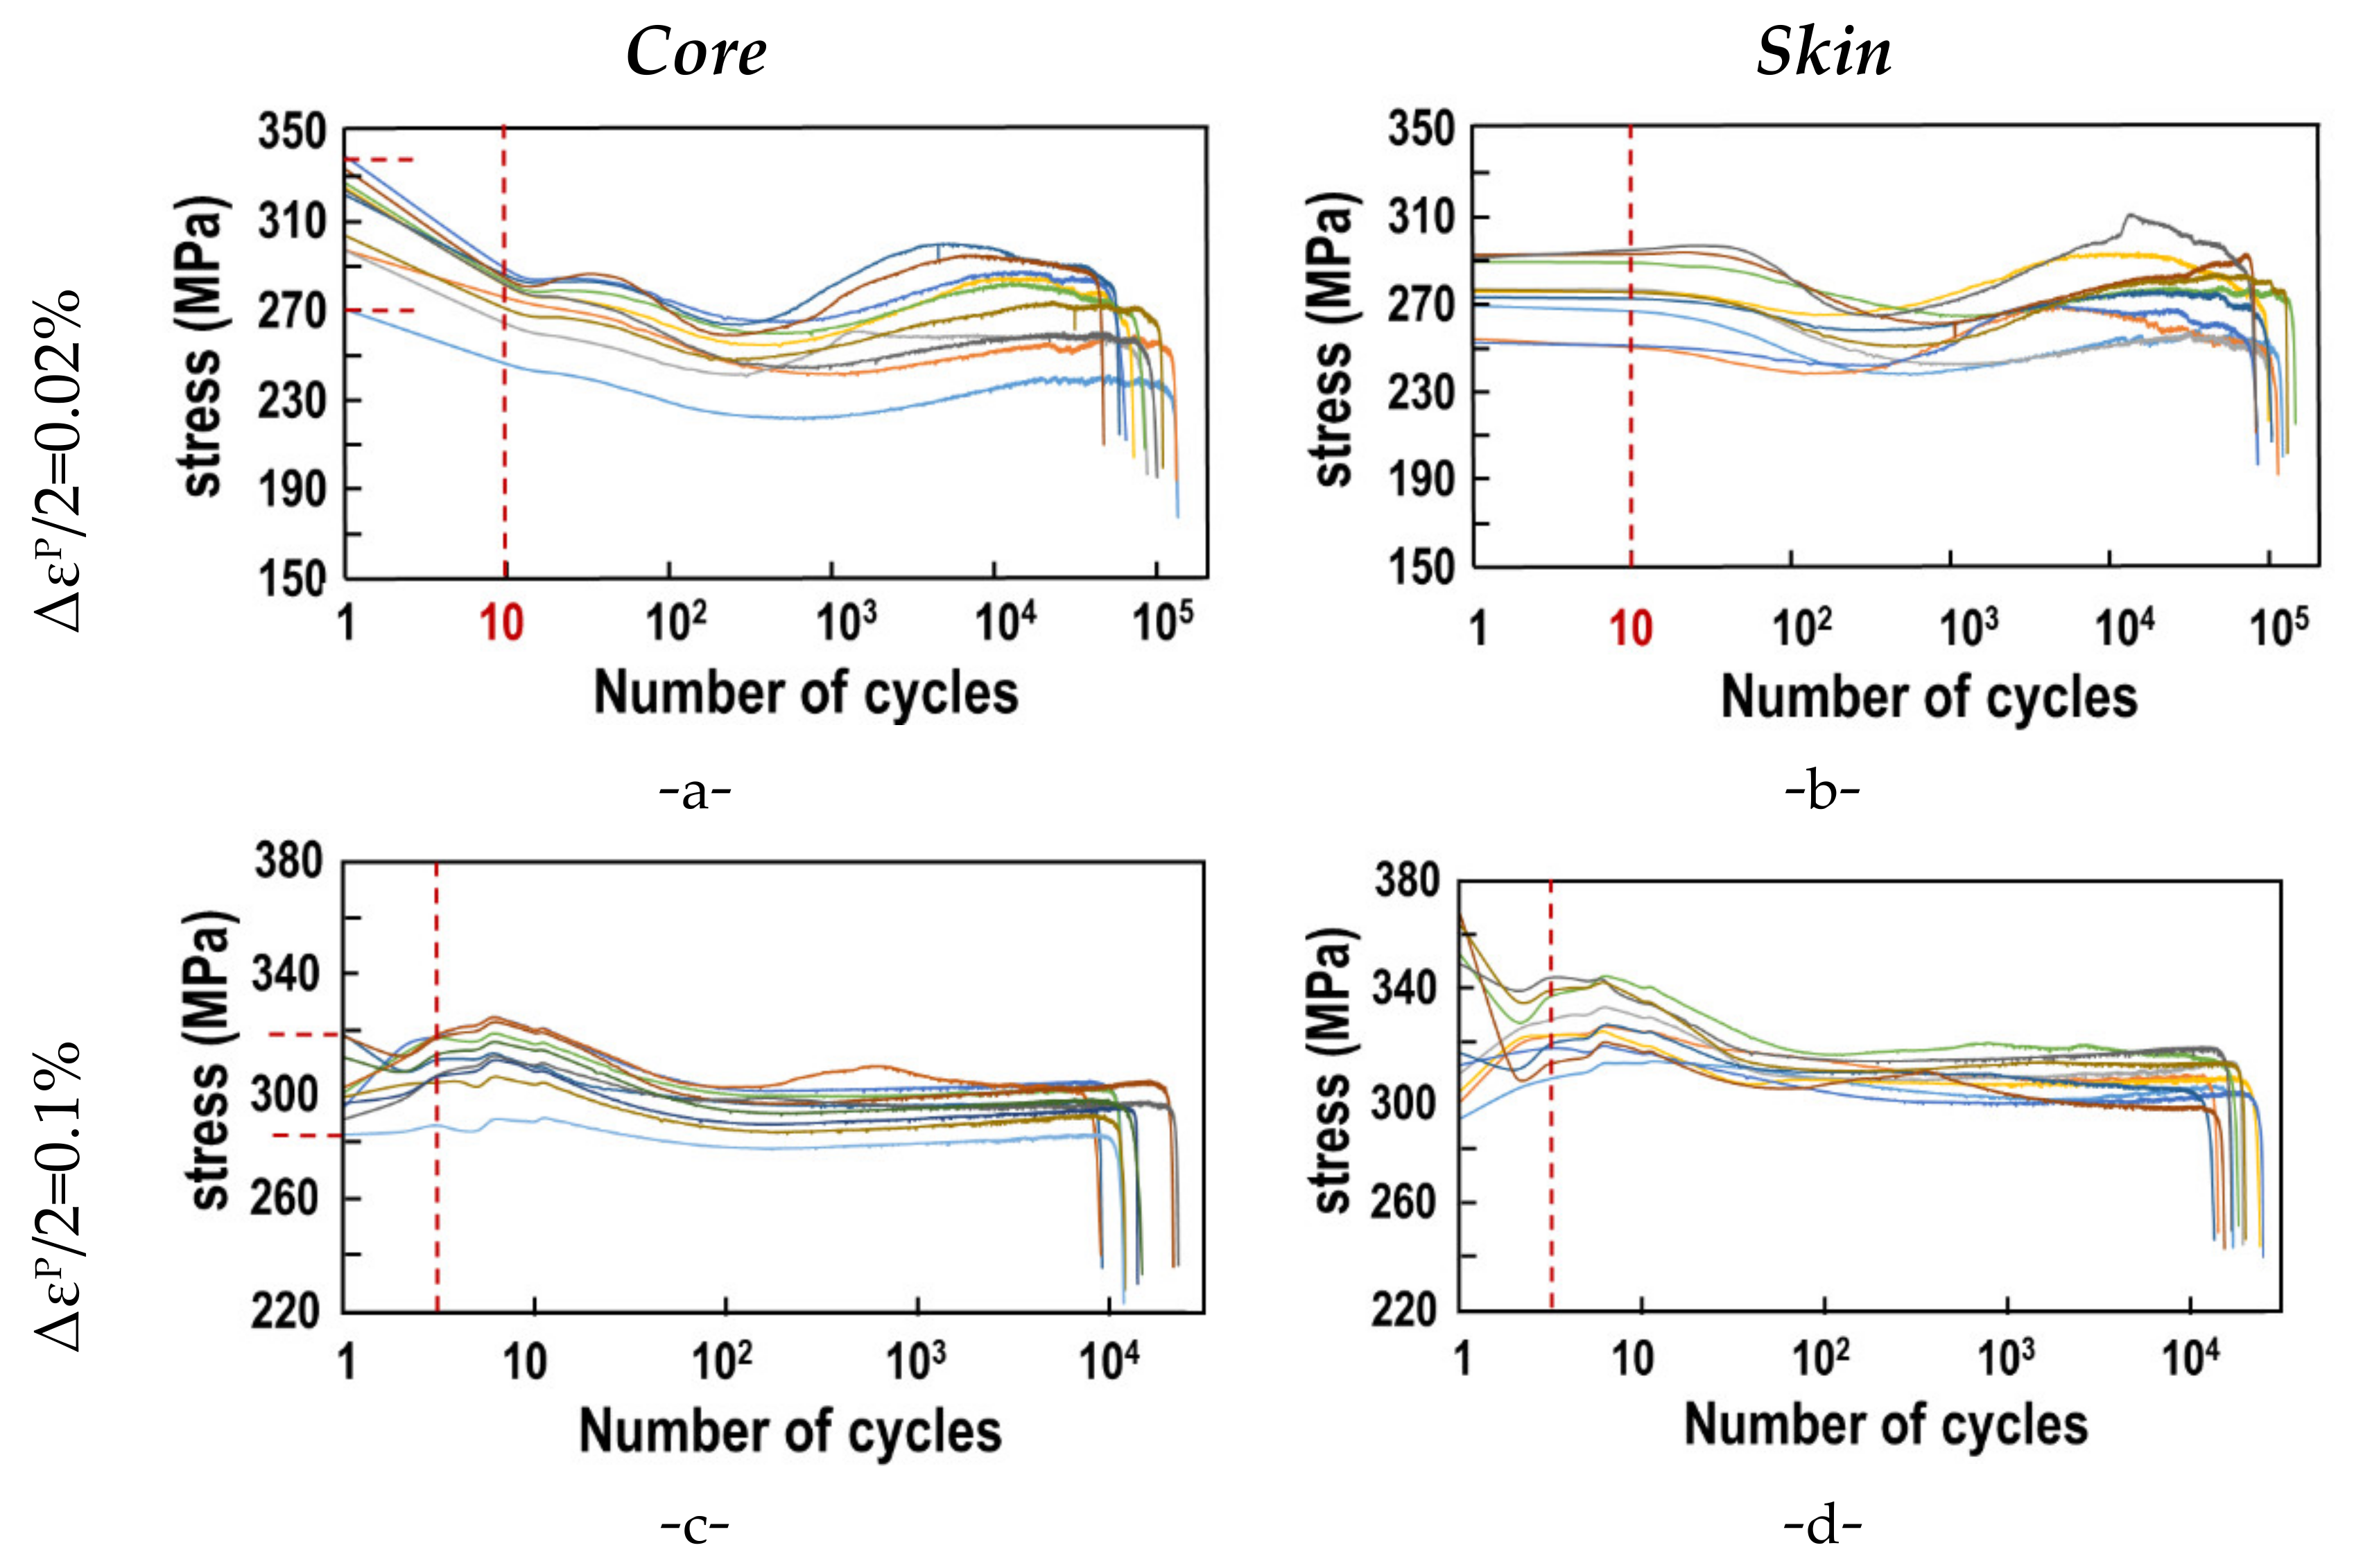
Figure 10.
Fatigue test results (stress vs. number of cycles) for different values of plastic strain ΔεP/2 = 0.1% (a,b); 0.2% (c,d) and 0.4% (e,f). Samples for the ingot core are represented in (a,c,e) and from the ingot skin in (b,d,f).
Figure 10.
Fatigue test results (stress vs. number of cycles) for different values of plastic strain ΔεP/2 = 0.1% (a,b); 0.2% (c,d) and 0.4% (e,f). Samples for the ingot core are represented in (a,c,e) and from the ingot skin in (b,d,f).
Figure 11.
Manson–Coffin plot based on experimental values obtained in this work and compared to literature data. The latter are Han et al. work on quenched G20Mn5 and Wu et al. work on normalized G20Mn5. HCF data (yellow points) were obtained with applied stress tests. Corresponding elastic strain values are used to plot the results on this strain vs. number of cycles to rupture graph.
Figure 12.
Stress as function of the normalized number of cycles for all considered loadings.
Figure 12.
Stress as function of the normalized number of cycles for all considered loadings.
Figure 13.
Comparison of three most common damage variables for all considered strain levels ΔεP/2: 0.01% (a), 0.2% (b), and 0.4%(c).
Figure 13.
Comparison of three most common damage variables for all considered strain levels ΔεP/2: 0.01% (a), 0.2% (b), and 0.4%(c).
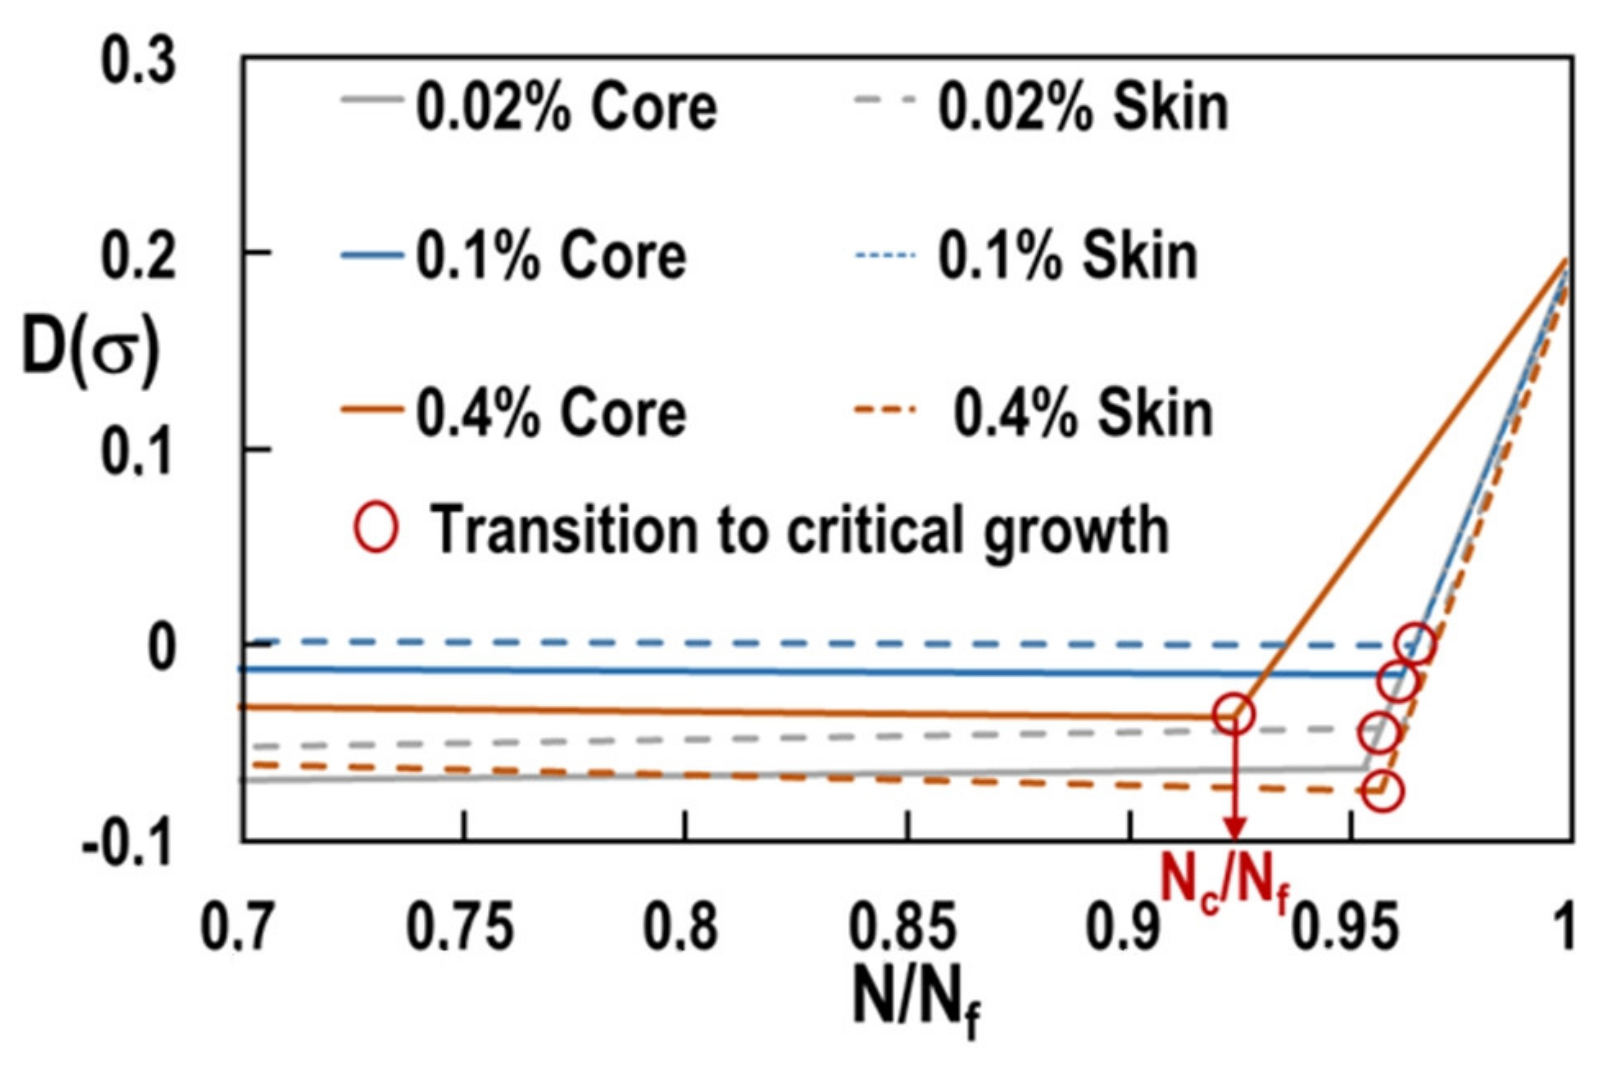
Figure 14.
Damage D(σ) as a function of the normalized number of cycles. Determination of the critical number of cycles NC corresponding to the transition from sub-critical to critical growth.
Figure 14.
Damage D(σ) as a function of the normalized number of cycles. Determination of the critical number of cycles NC corresponding to the transition from sub-critical to critical growth.
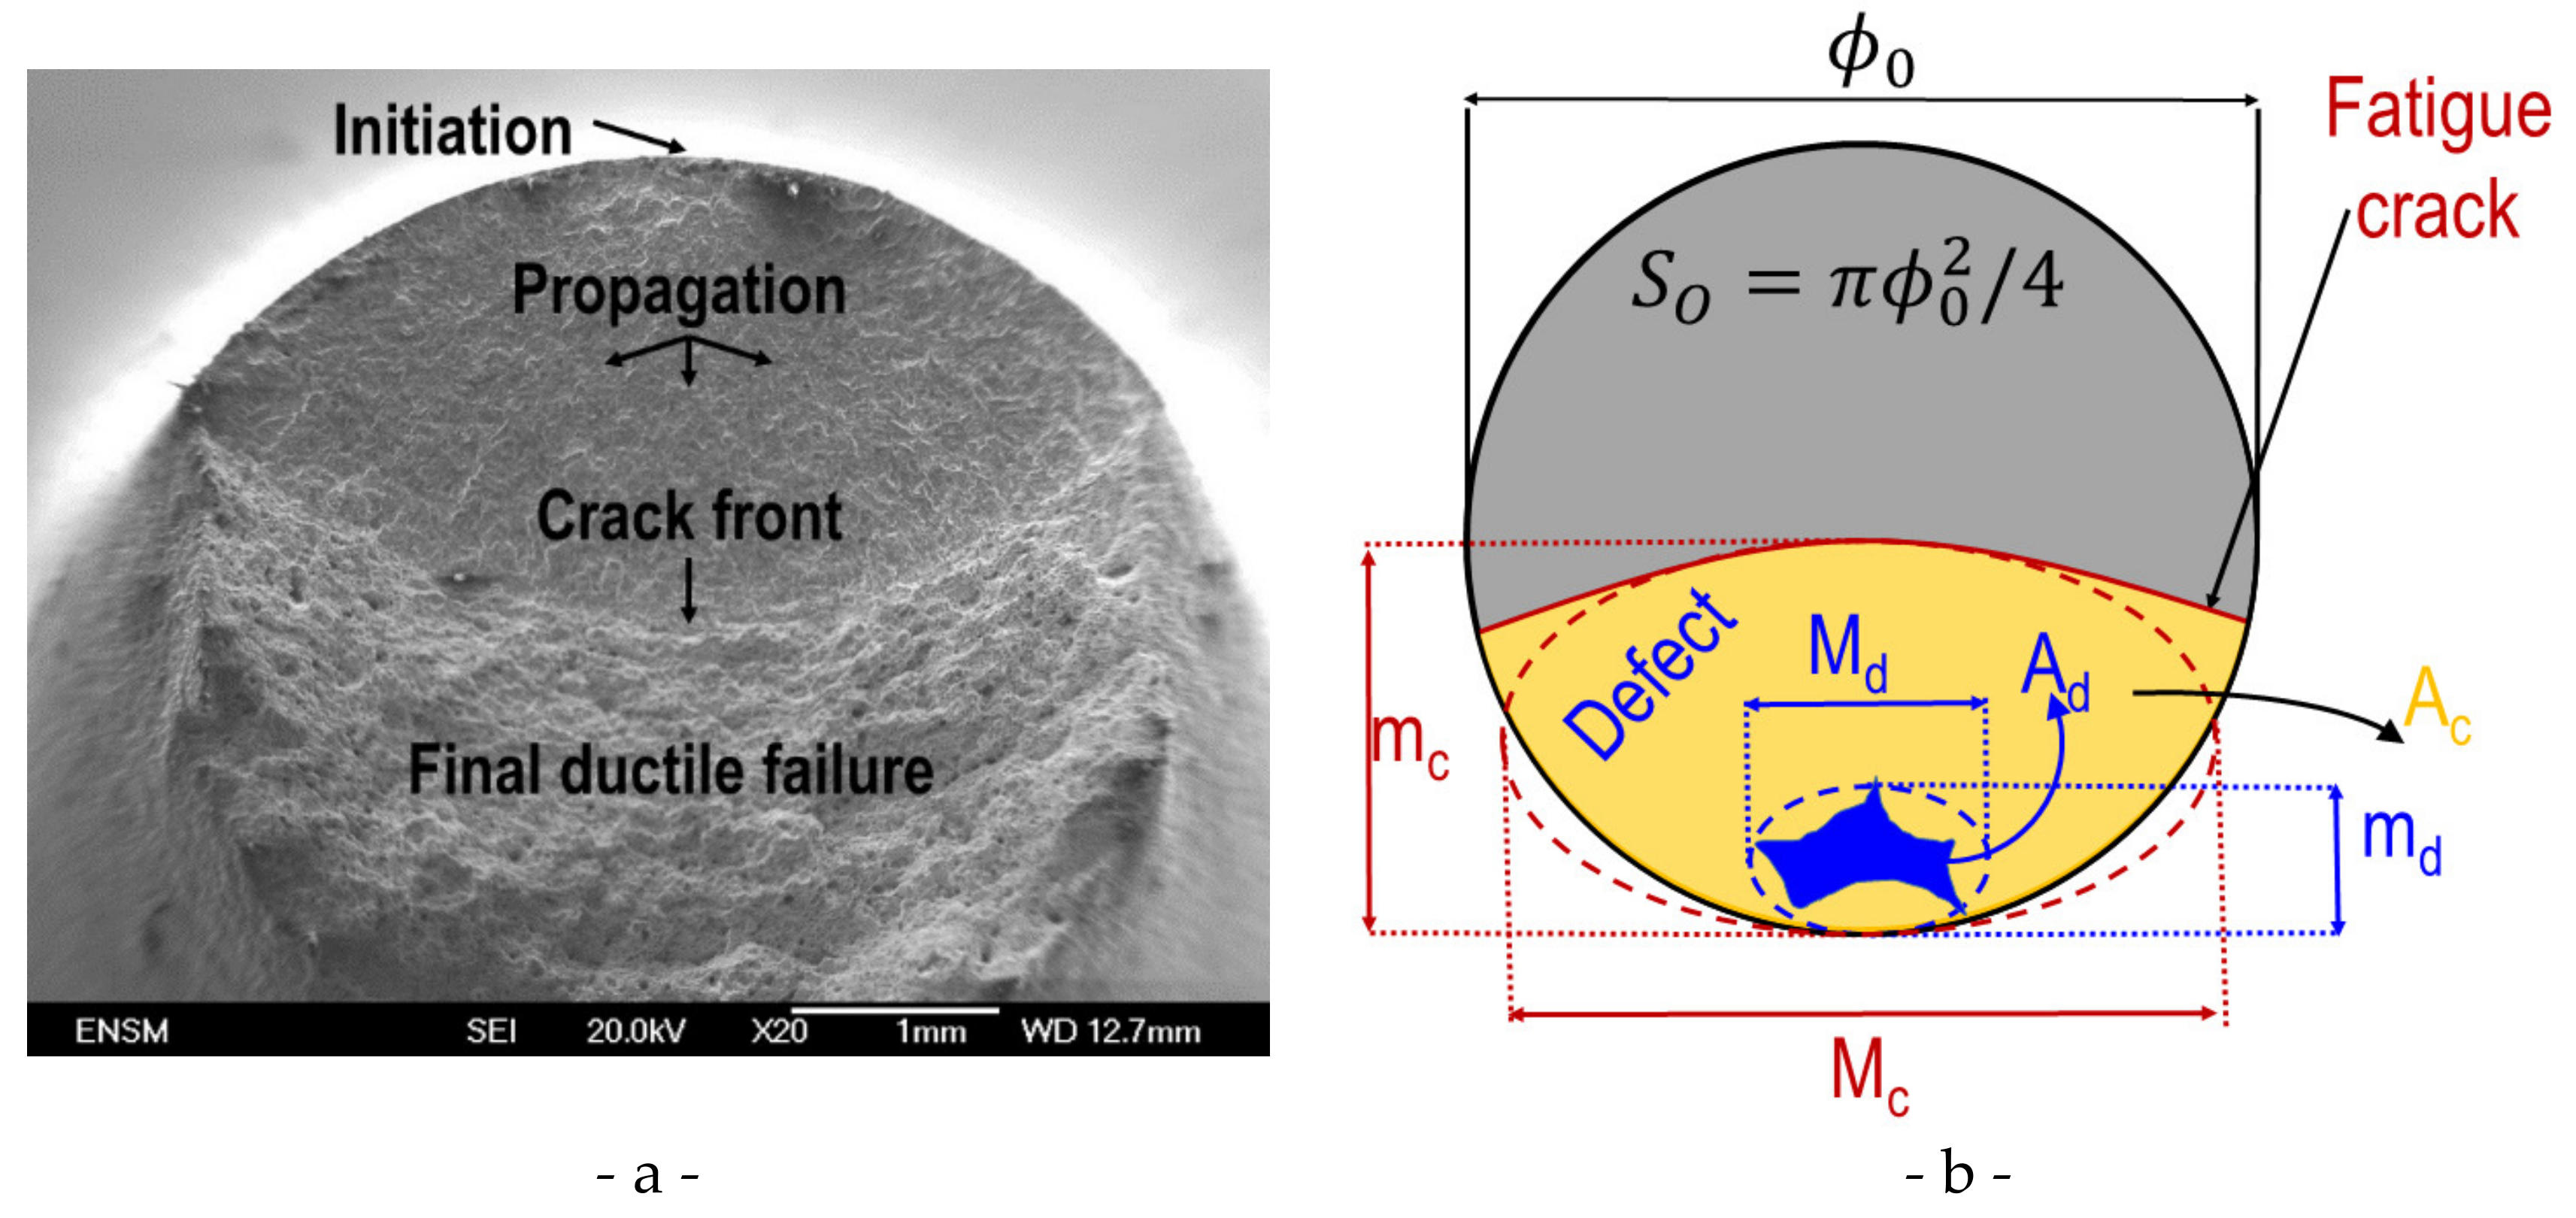
Figure 15.
Fracture surface analysis. (a) Typical fracture surface with crack initiation at a single defect. (b) Different measurements made on each fracture surface to determine the values of the corresponding damage variables.
Figure 15.
Fracture surface analysis. (a) Typical fracture surface with crack initiation at a single defect. (b) Different measurements made on each fracture surface to determine the values of the corresponding damage variables.
Figure 16.
Correlation between stress intensity factor based on the initial defect area Ad and the normalized number of cycles in stage II. (a) Classical representation with (b) the same results in cartesian axes.
Figure 16.
Correlation between stress intensity factor based on the initial defect area Ad and the normalized number of cycles in stage II. (a) Classical representation with (b) the same results in cartesian axes.
Table 1.
G20Mn5 chemical composition (%wt).
Table 1.
G20Mn5 chemical composition (%wt).
| C | Mn | Si | S | P | Ni | Cr | Mo | V | Al | Fe |
|---|
| 0.18 | 1.12 | 0.36 | 0.009 | 0.011 | 0.07 | 0.26 | 0.05 | 0.005 | 0.05 | 97.8 |
Table 2.
Low-cycle fatigue test parameters. Three different levels of plastic deformation. The plastic load ratio () is equal to −1.
Table 2.
Low-cycle fatigue test parameters. Three different levels of plastic deformation. The plastic load ratio () is equal to −1.
Strain
Level | | Signal
(Strain) | Censoring
(Cycles) | Shutoff |
|---|
| 1 | 0.02 | Triangular | 106 | |
| 2 | 0.1 | 105 |
| 3 | 0.4 | 104 |
Table 3.
Mean grain size in the skin and in the core of the ingot. designates the average equivalent grain diameter.
Table 3.
Mean grain size in the skin and in the core of the ingot. designates the average equivalent grain diameter.
| Location | | G Index |
|---|
| Skin | 16.4 | 8.8 |
| Core | 16.9 | 8.9 |
Table 4.
Indexes of inclusion cleanliness.
Table 4.
Indexes of inclusion cleanliness.
| Location | MnS Type III (Fine) | MnS Type III (Thick) |
|---|
| Skin | 1.13 | 0.60 |
| Core | 1.08 | 0.68 |
Table 5.
Mean values of the porosity distribution in the skin and the core of the ingot. and correspond, respectively, to the mean void volume fraction and number of voids per unit volume. and designate, respectively, the mean void (micro-shrinkage) volume and diameter.
Table 5.
Mean values of the porosity distribution in the skin and the core of the ingot. and correspond, respectively, to the mean void volume fraction and number of voids per unit volume. and designate, respectively, the mean void (micro-shrinkage) volume and diameter.
| Location | |
| | |
|---|
| skin | 0.0104 | 403 | 5.3 104 | 46.6 |
| core | 0.00947 | 234 | 8.8 104 | 55.2 |
Table 6.
Monotonic test results. Average values from three tests for tensile tests and tens of tests for hardness in each batch (core or skin).
Table 6.
Monotonic test results. Average values from three tests for tensile tests and tens of tests for hardness in each batch (core or skin).
| | Core | Skin |
|---|
| UTS (Mpa) | 518 | 528 |
| Rp0.2 (Mpa) | 293 | 309 |
| A% (%) | 37% | 37% |
| Ferrite micro-hardness (HV) | 113 | 121 |
| Pearlite micro-hardness (HV) | 303 | 291 |
| Macro-hardness (HV) | 140 | 142 |
Table 7.
Number of cycles at failure (Nf) as function of the plastic strain.
Table 7.
Number of cycles at failure (Nf) as function of the plastic strain.
| ΔεP/2 |
|---|
| 0.02% | 0.1% | 0.4% |
| Core | Skin | Core | Skin | Core | Skin |
| 92339 | 108684 | 13796 | 17940 | 835 | 1697 |
Table 8.
Manson–Coffin coefficients.
Table 8.
Manson–Coffin coefficients.
| | | c |
|---|
| Skin | 0.2996 | 0.714 |
| Core | 0.8822 | 0.626 |
| Global | 0.5536 | 0.677 |
Table 9.
Detailed results from low cycle fatigue tests.
Table 9.
Detailed results from low cycle fatigue tests.
| | | ΔεP/2 |
|---|
| | | 0.02% | 0.1% | 0.4% |
|---|
| | | Core | Skin | Core | Skin | Core | Skin |
| Number of cycles at failure Nf | mean | 92339 | 108684 | 13796 | 17940 | 835 | 1 697 |
| stand. dev. | 29511 | 20524 | 4703 | 3776 | 433 | 704 |
| stand. dev./mean | 34% | 20% | 34% | 21% | 52% | 41% |
| max. | 139875 | 148455 | 22677 | 24428 | 1741 | 2617 |
| Min. | 48754 | 83775 | 8937 | 13195 | 473 | 298 |
| 15% | 30% | 51% |
| σstab. (MPa) | 251.5 | 251.7 | 292.2 | 308.6 | 362.2 | 369.4 |
Table 10.
Damage measurements on fatigue specimens fracture surfaces.
Table 10.
Damage measurements on fatigue specimens fracture surfaces.
Damage
Variable | Δεp/2 |
|---|
| 0.02% | 0.1% | 0.4% |
|---|
| Core | Skin | Core | Skin | Core | Skin |
|---|
| D1 | 28% | 24% | 30% | 29% | 30% | 35% |
| D2 | 28% | 24% | 28% | 29% | 30% | 35% |
| D3 | 34% | 33% | 36% | 38% | 39% | 44% |
| D4 | 35% | 34% | 36% | 38% | 38% | 43% |


 ,
, 


