
Investigation of Fluidity and Strength of Enhanced Foam-Cemented Paste Backfill


Abstract
:1. Introduction
2. Materials and Methods
2.1. Materials
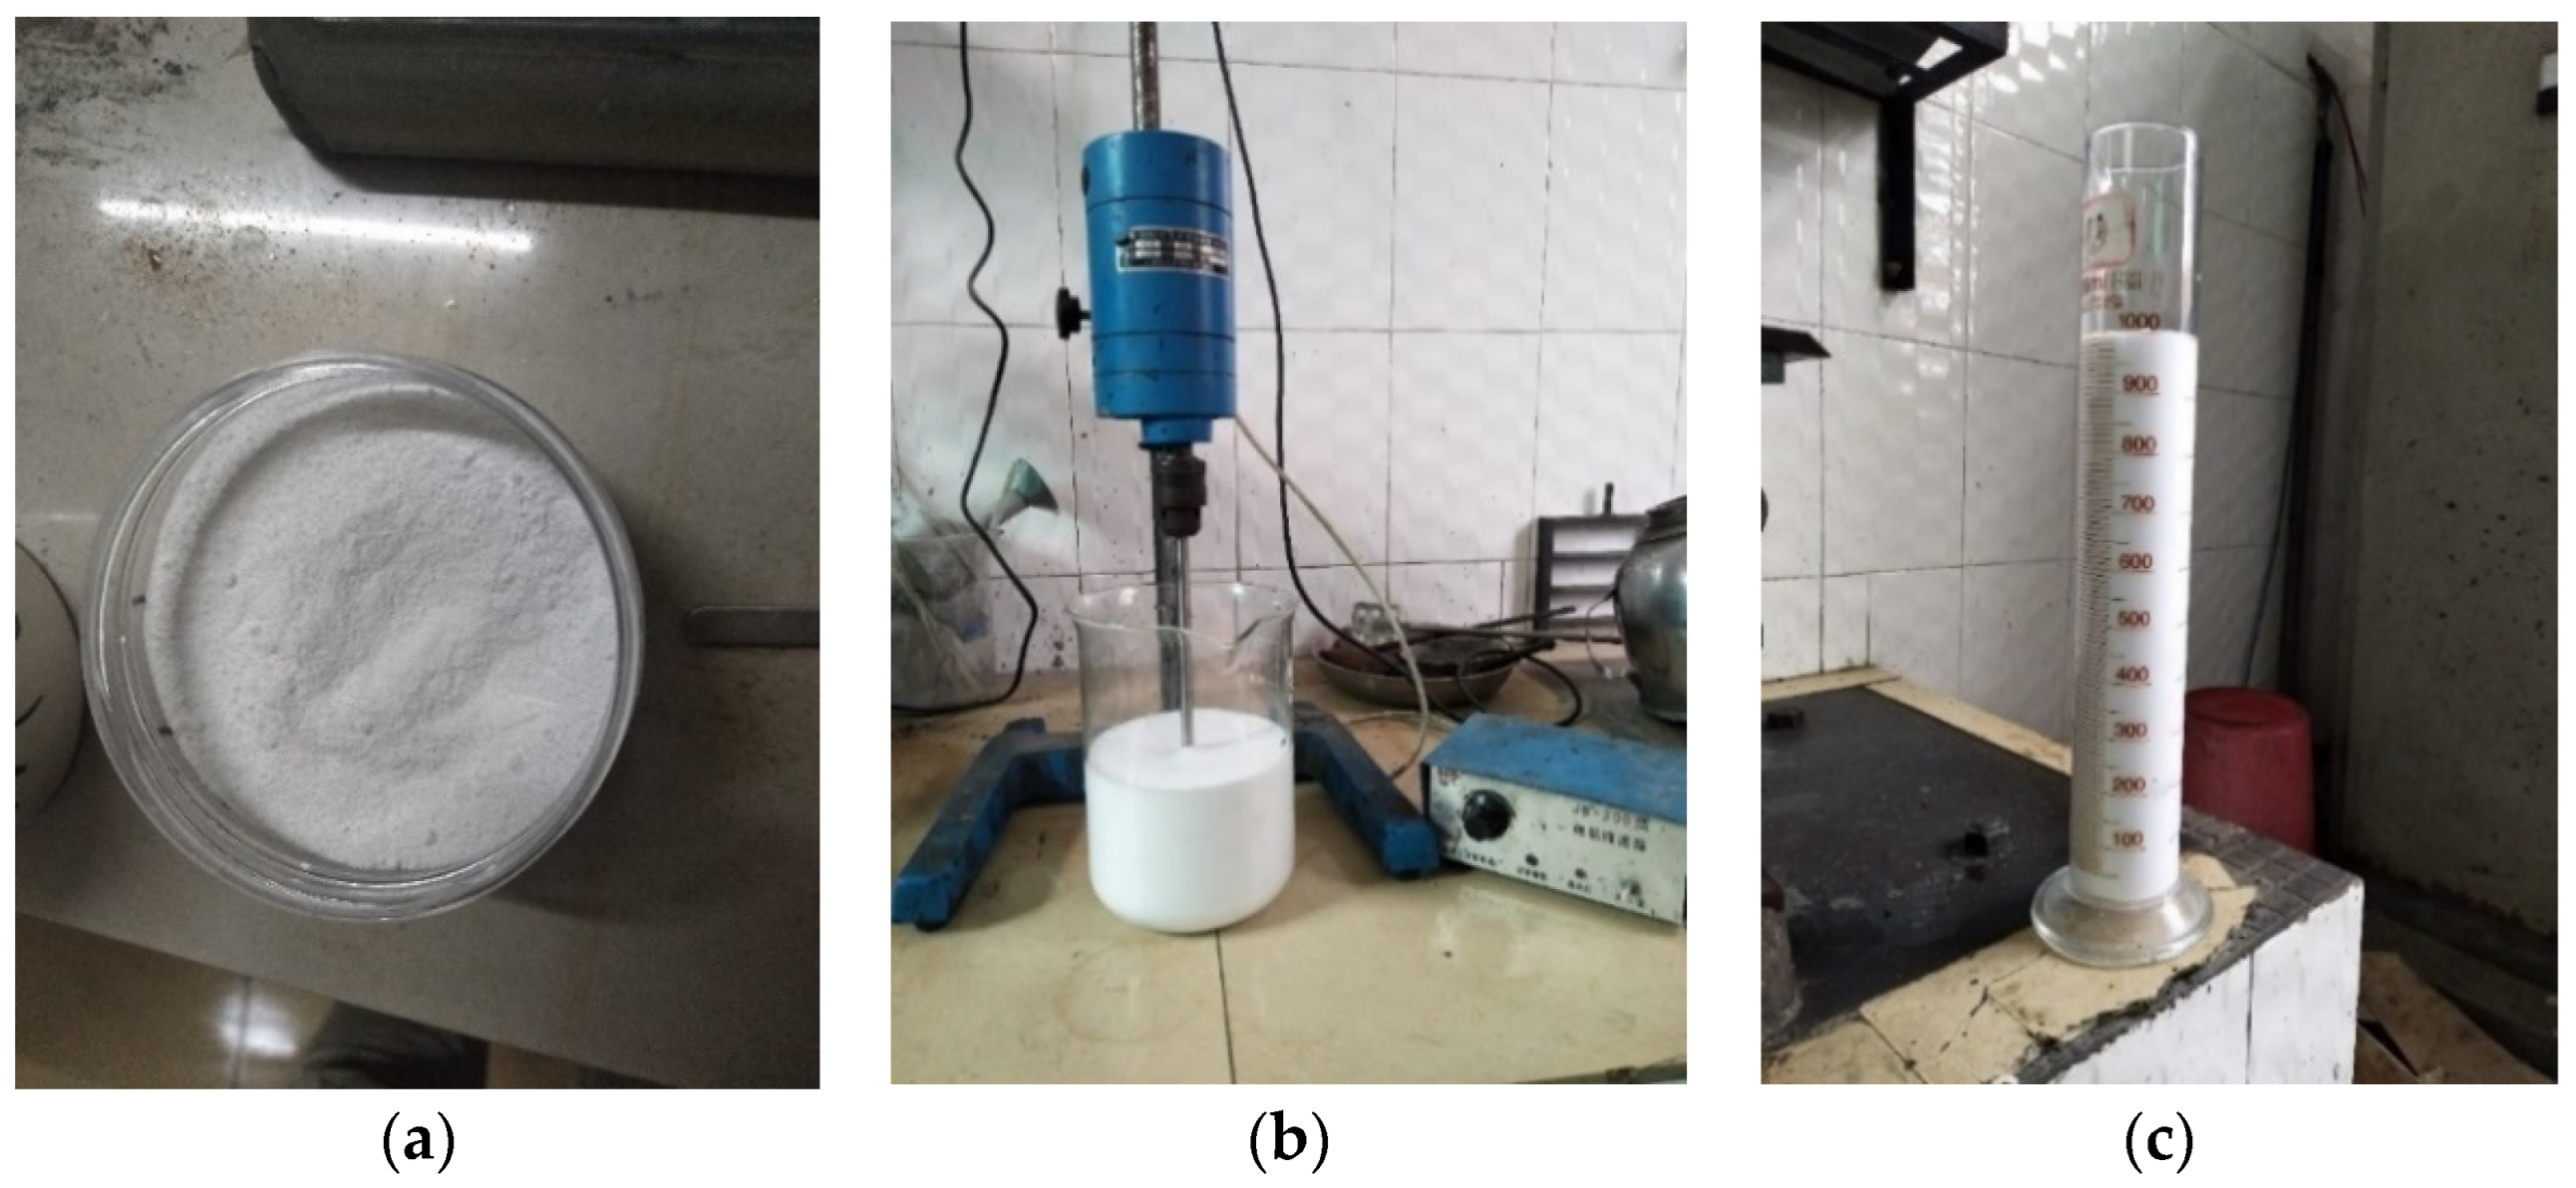
2.2. Foam Preparation
2.2.1. Foaming Agent Content
2.2.2. Foam Stabilizer Content
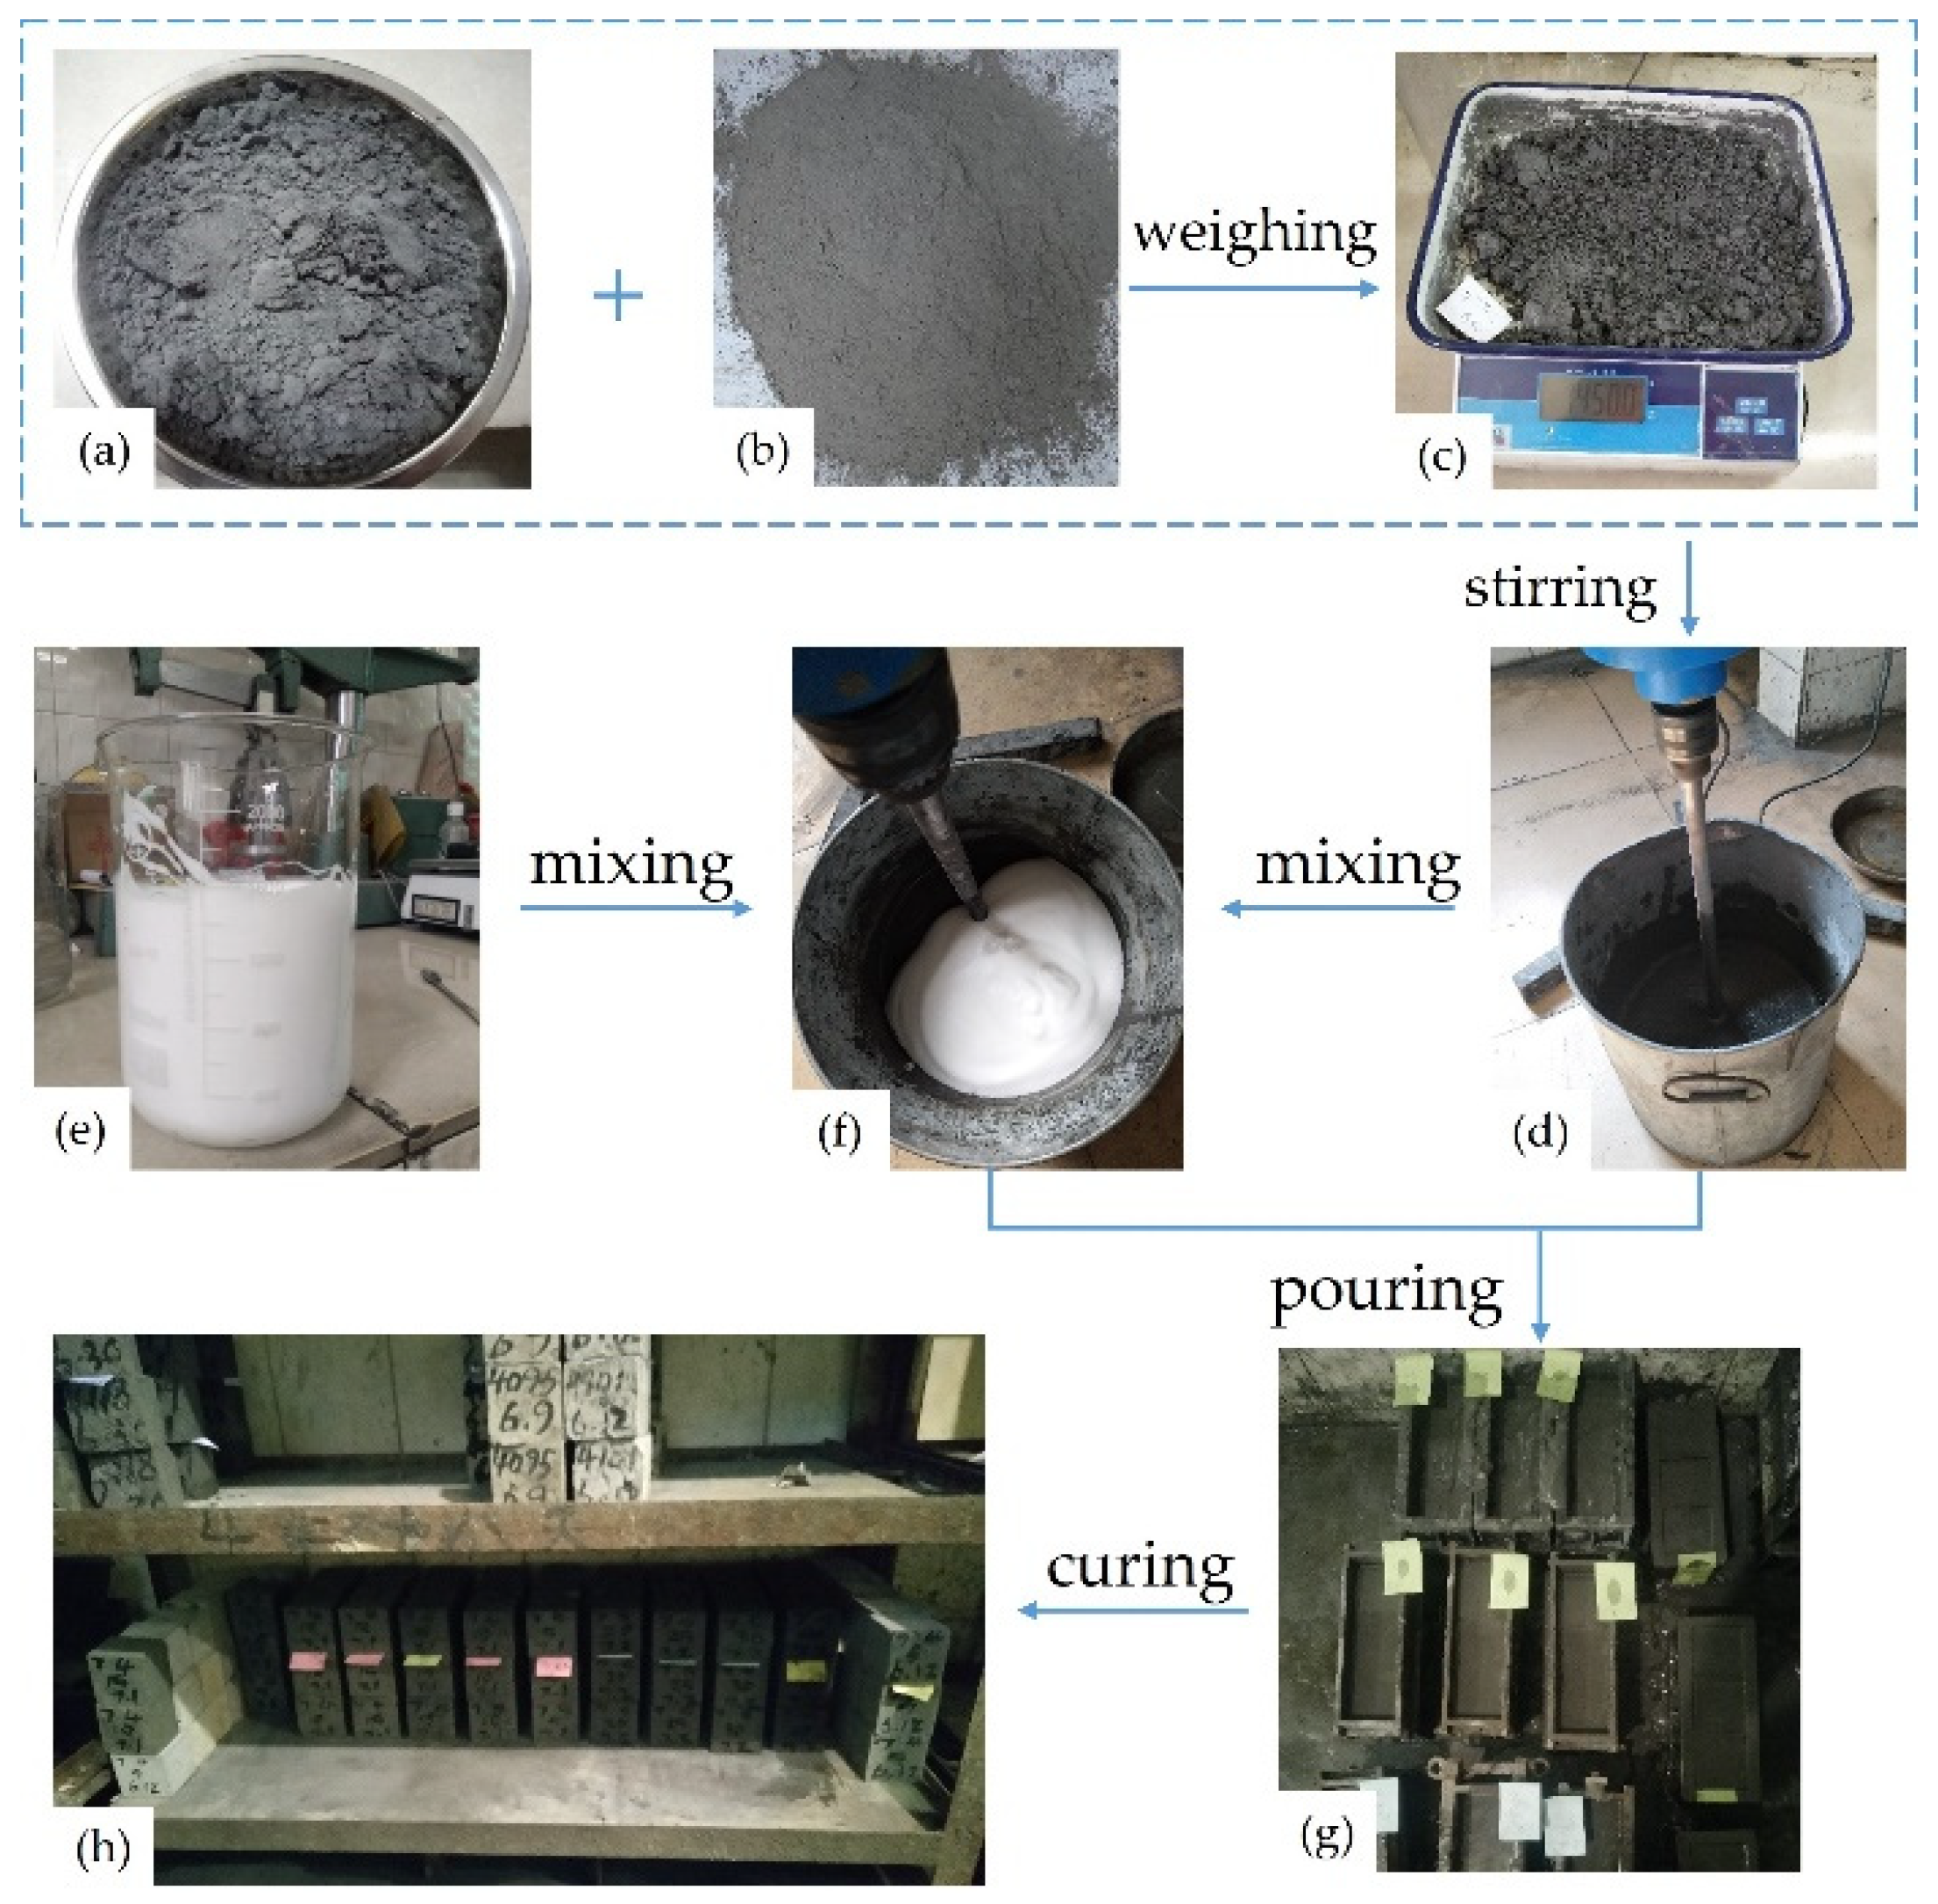
2.3. FCPB Preparation
2.4. Test Methods
2.4.1. Fresh Density
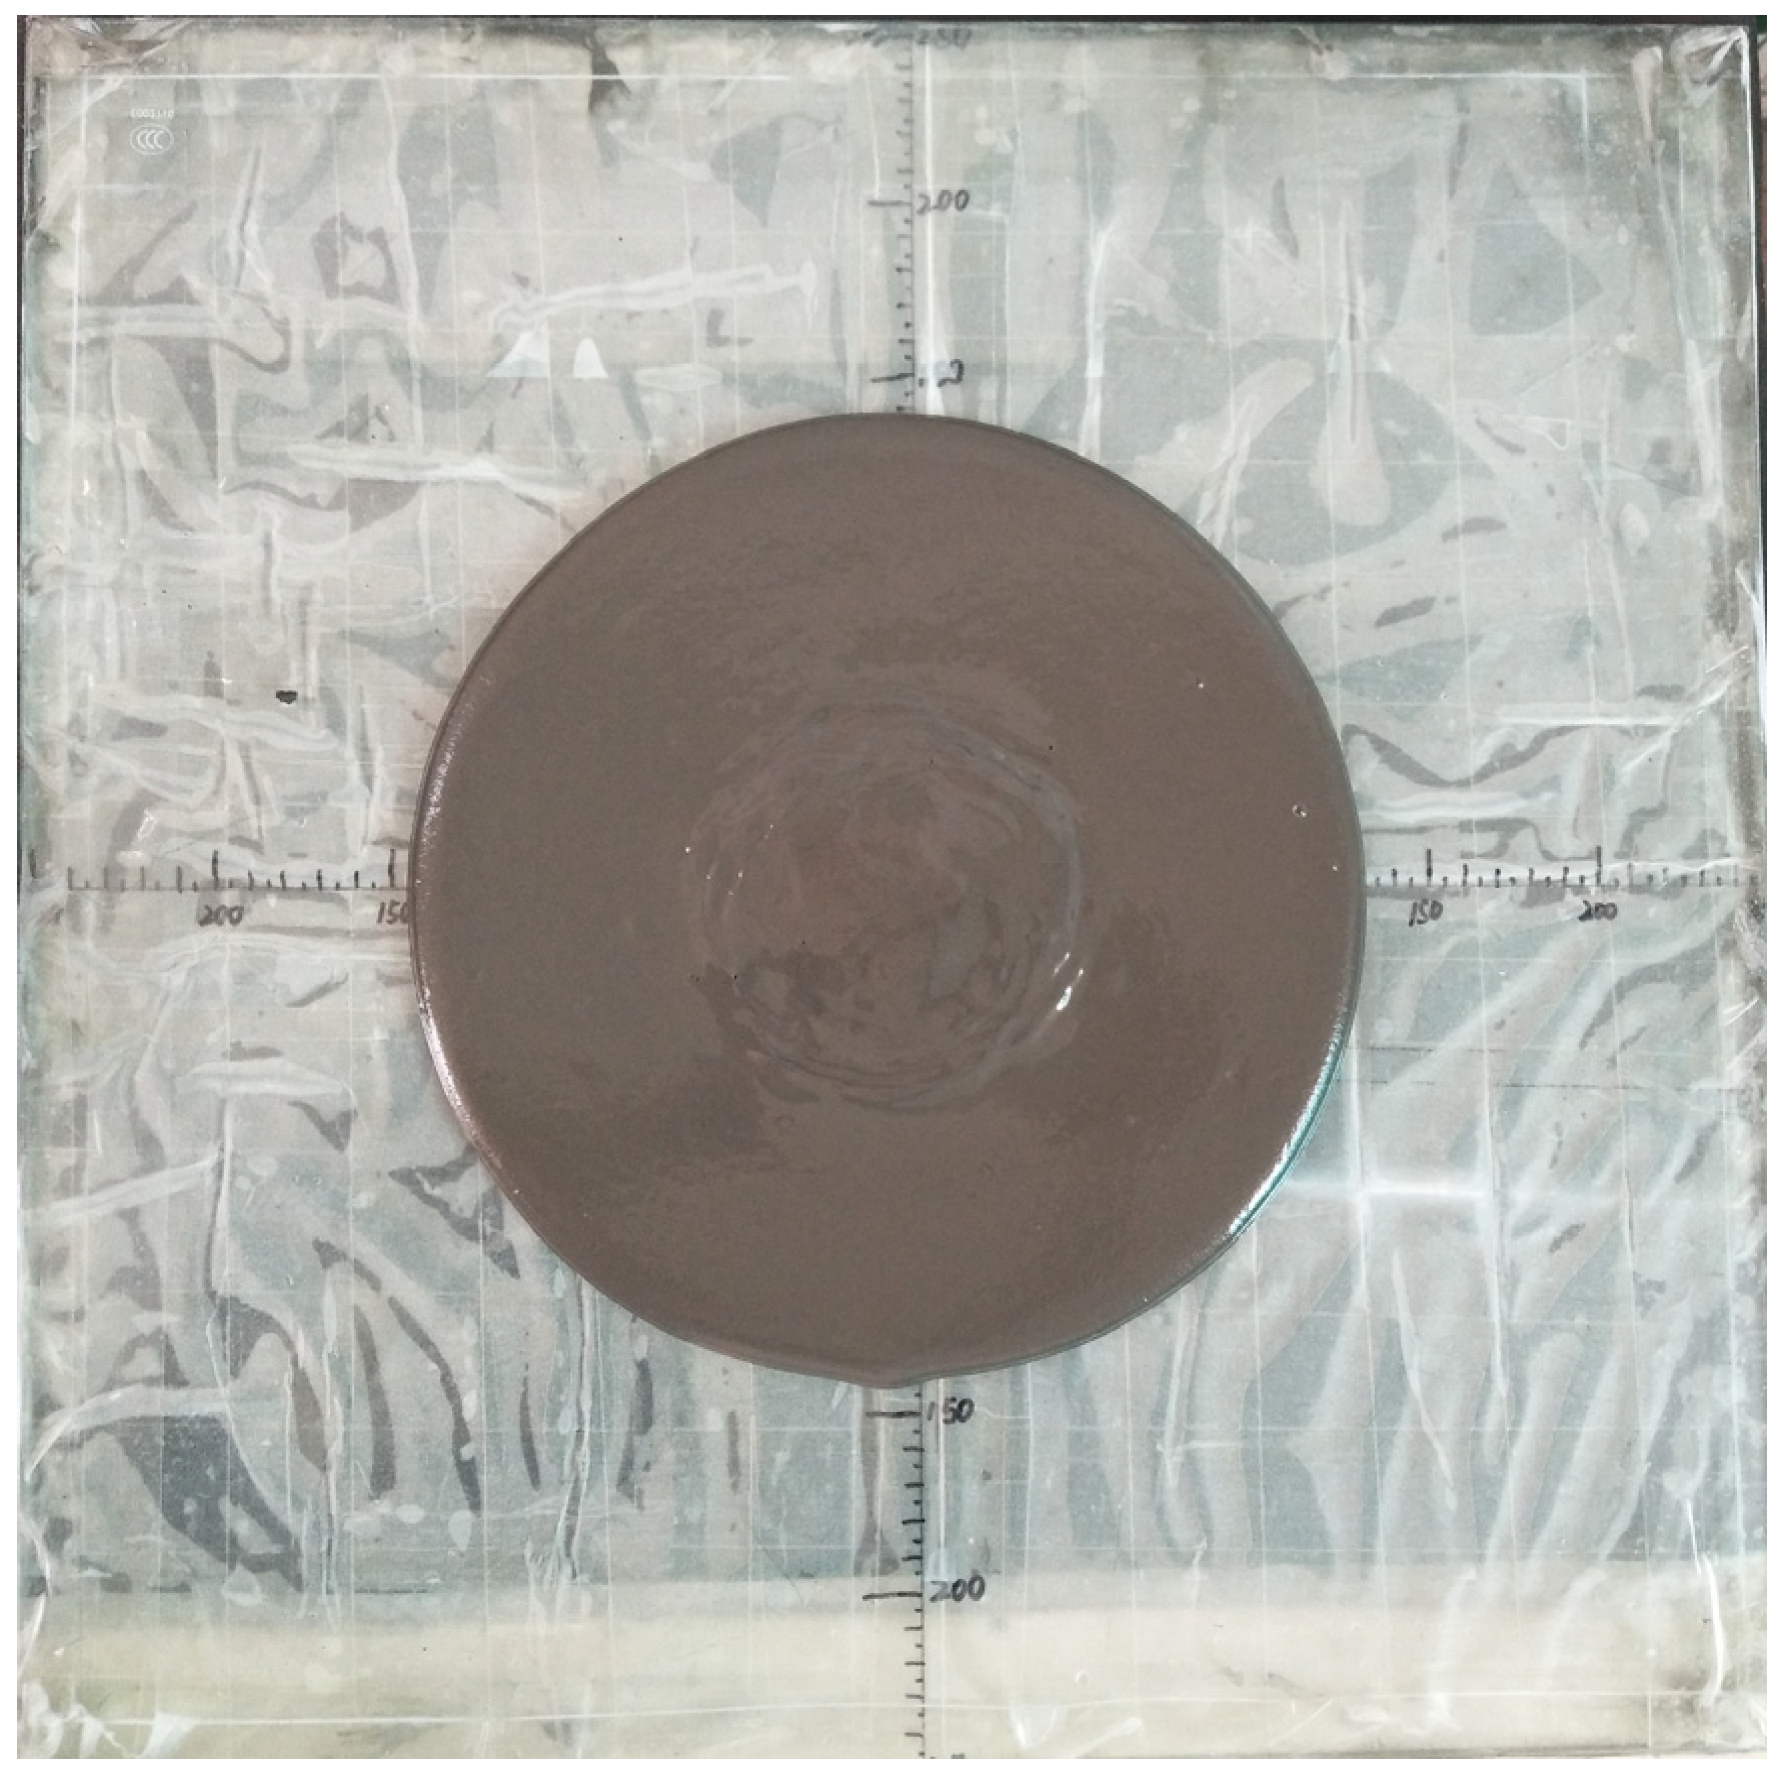
2.4.2. Spread Test
2.4.3. UCS Test
2.4.4. SEM Analysis
3. Results and Discussion
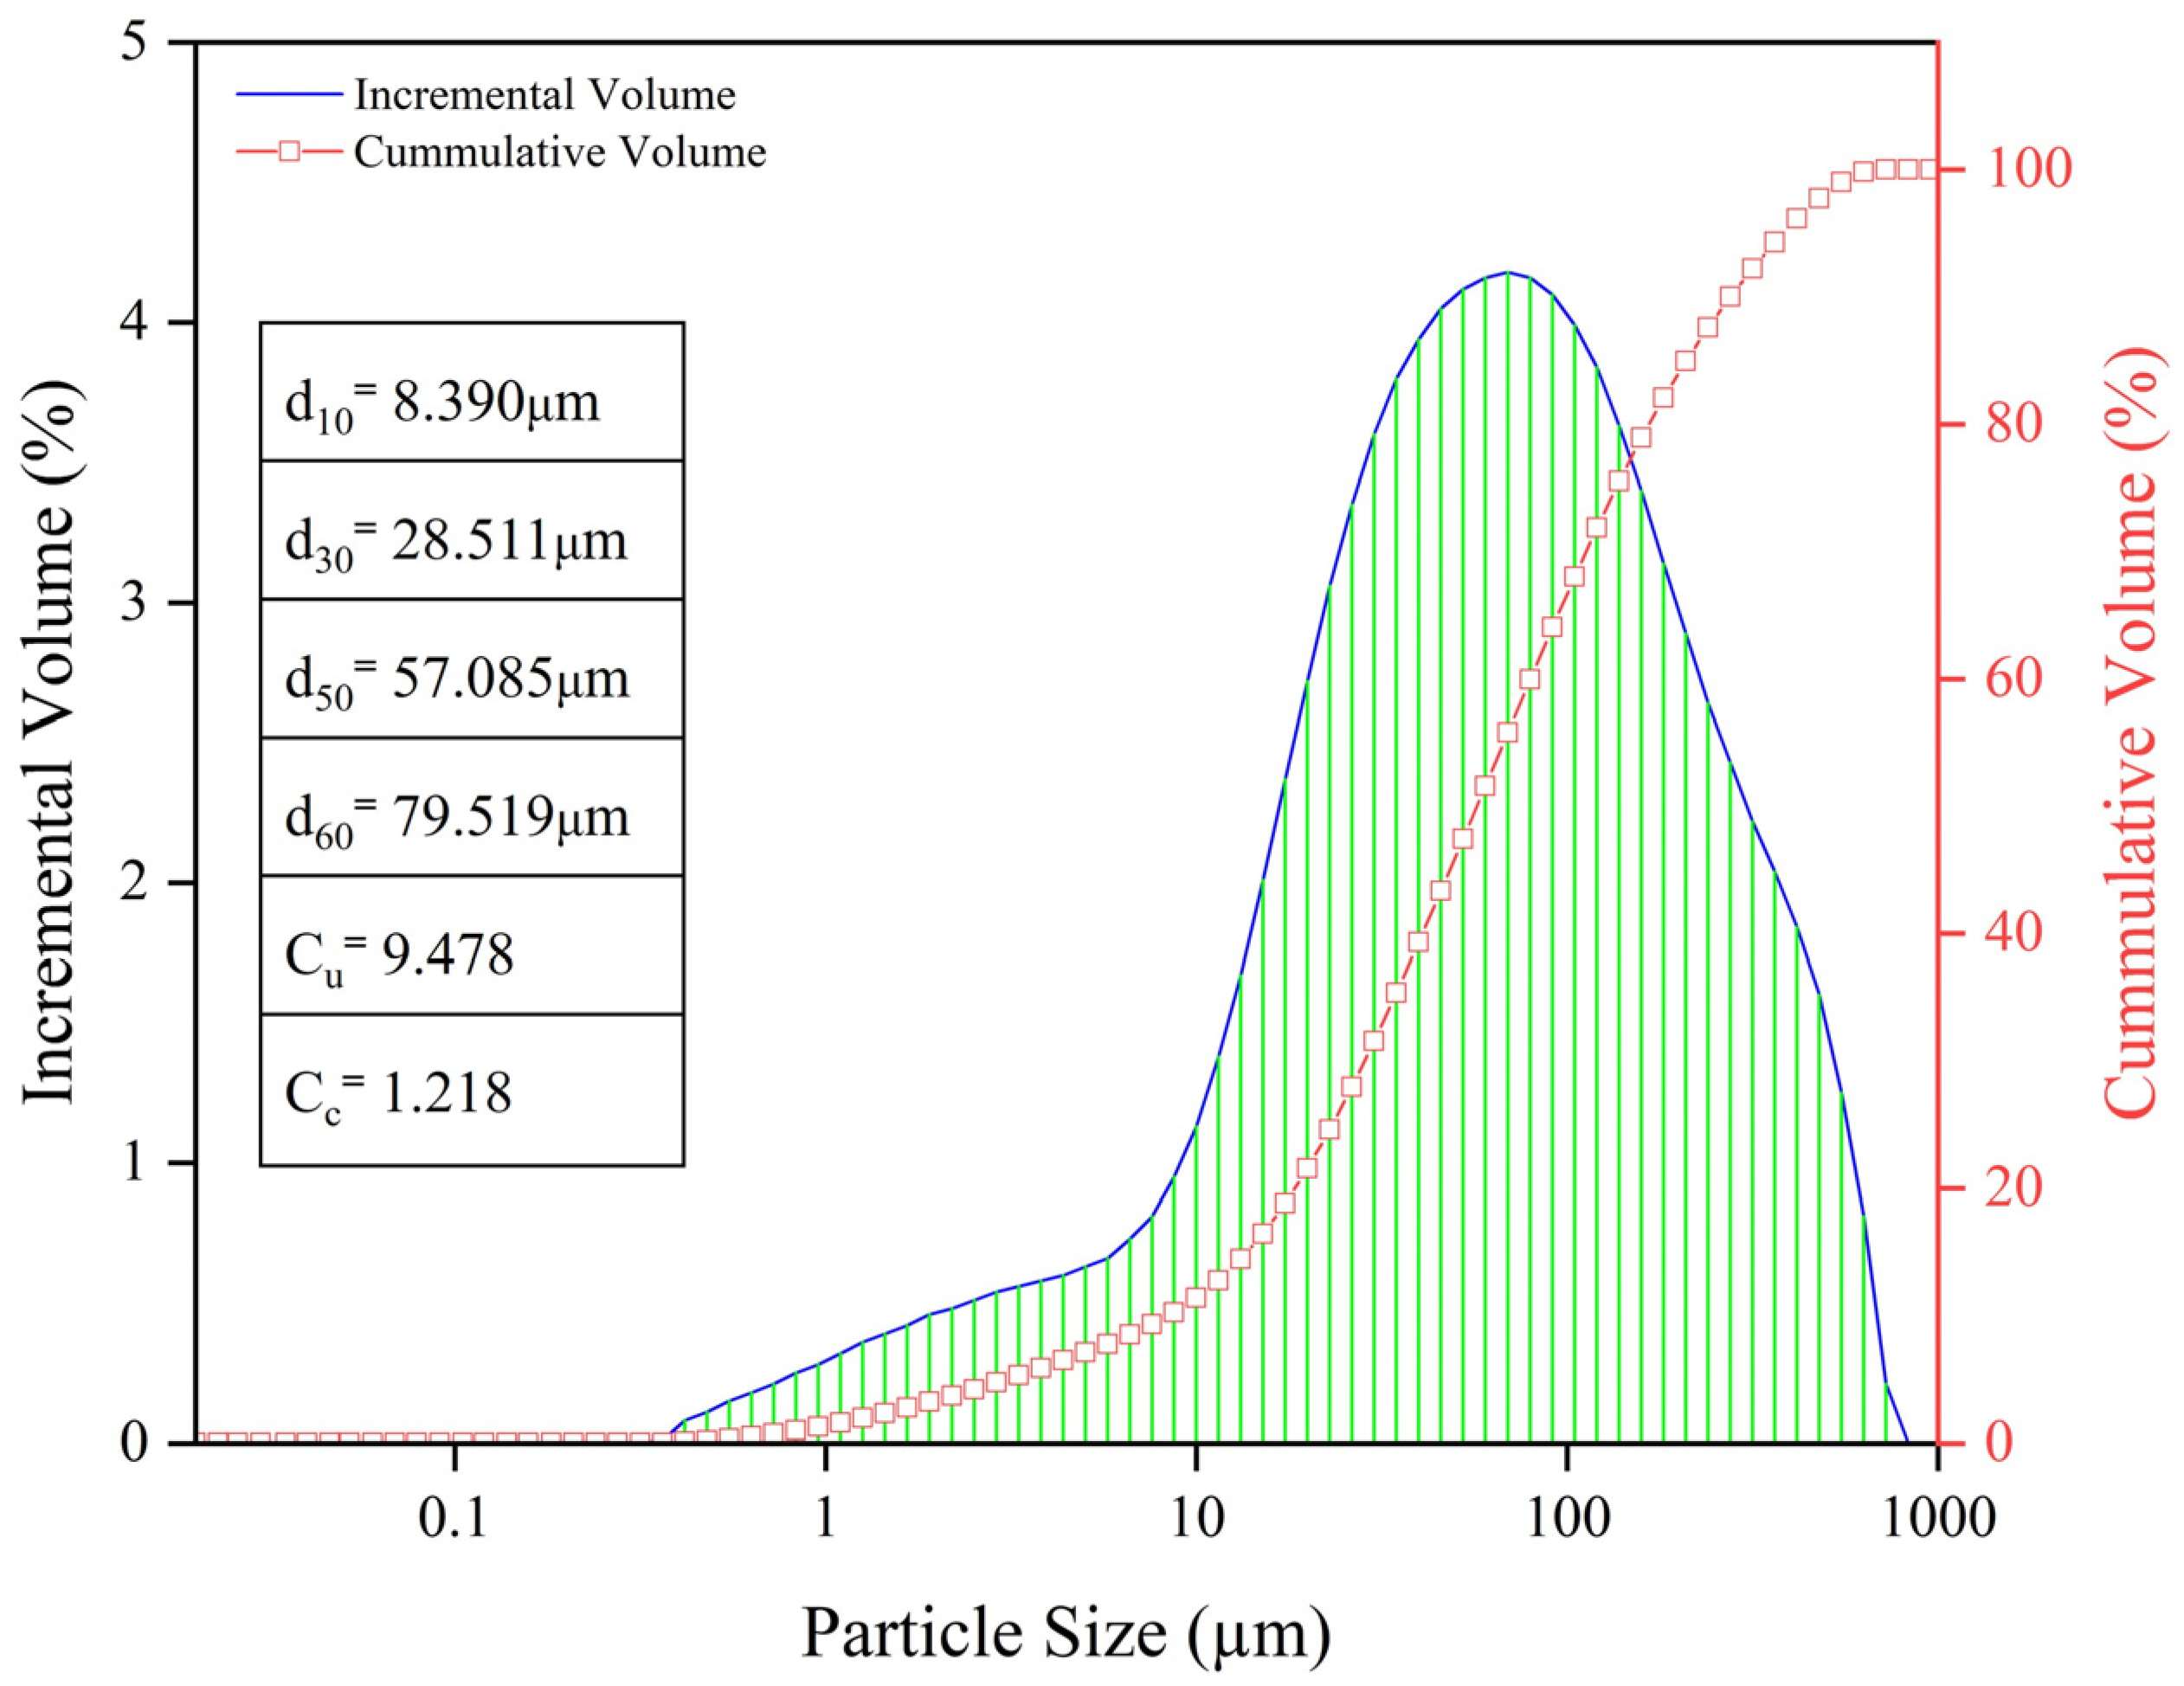
3.1. Particle Size Distribution
3.2. Determination of Admixture Contents
3.2.1. Foaming Agent Content
3.2.2. Foam Stabilizer Content
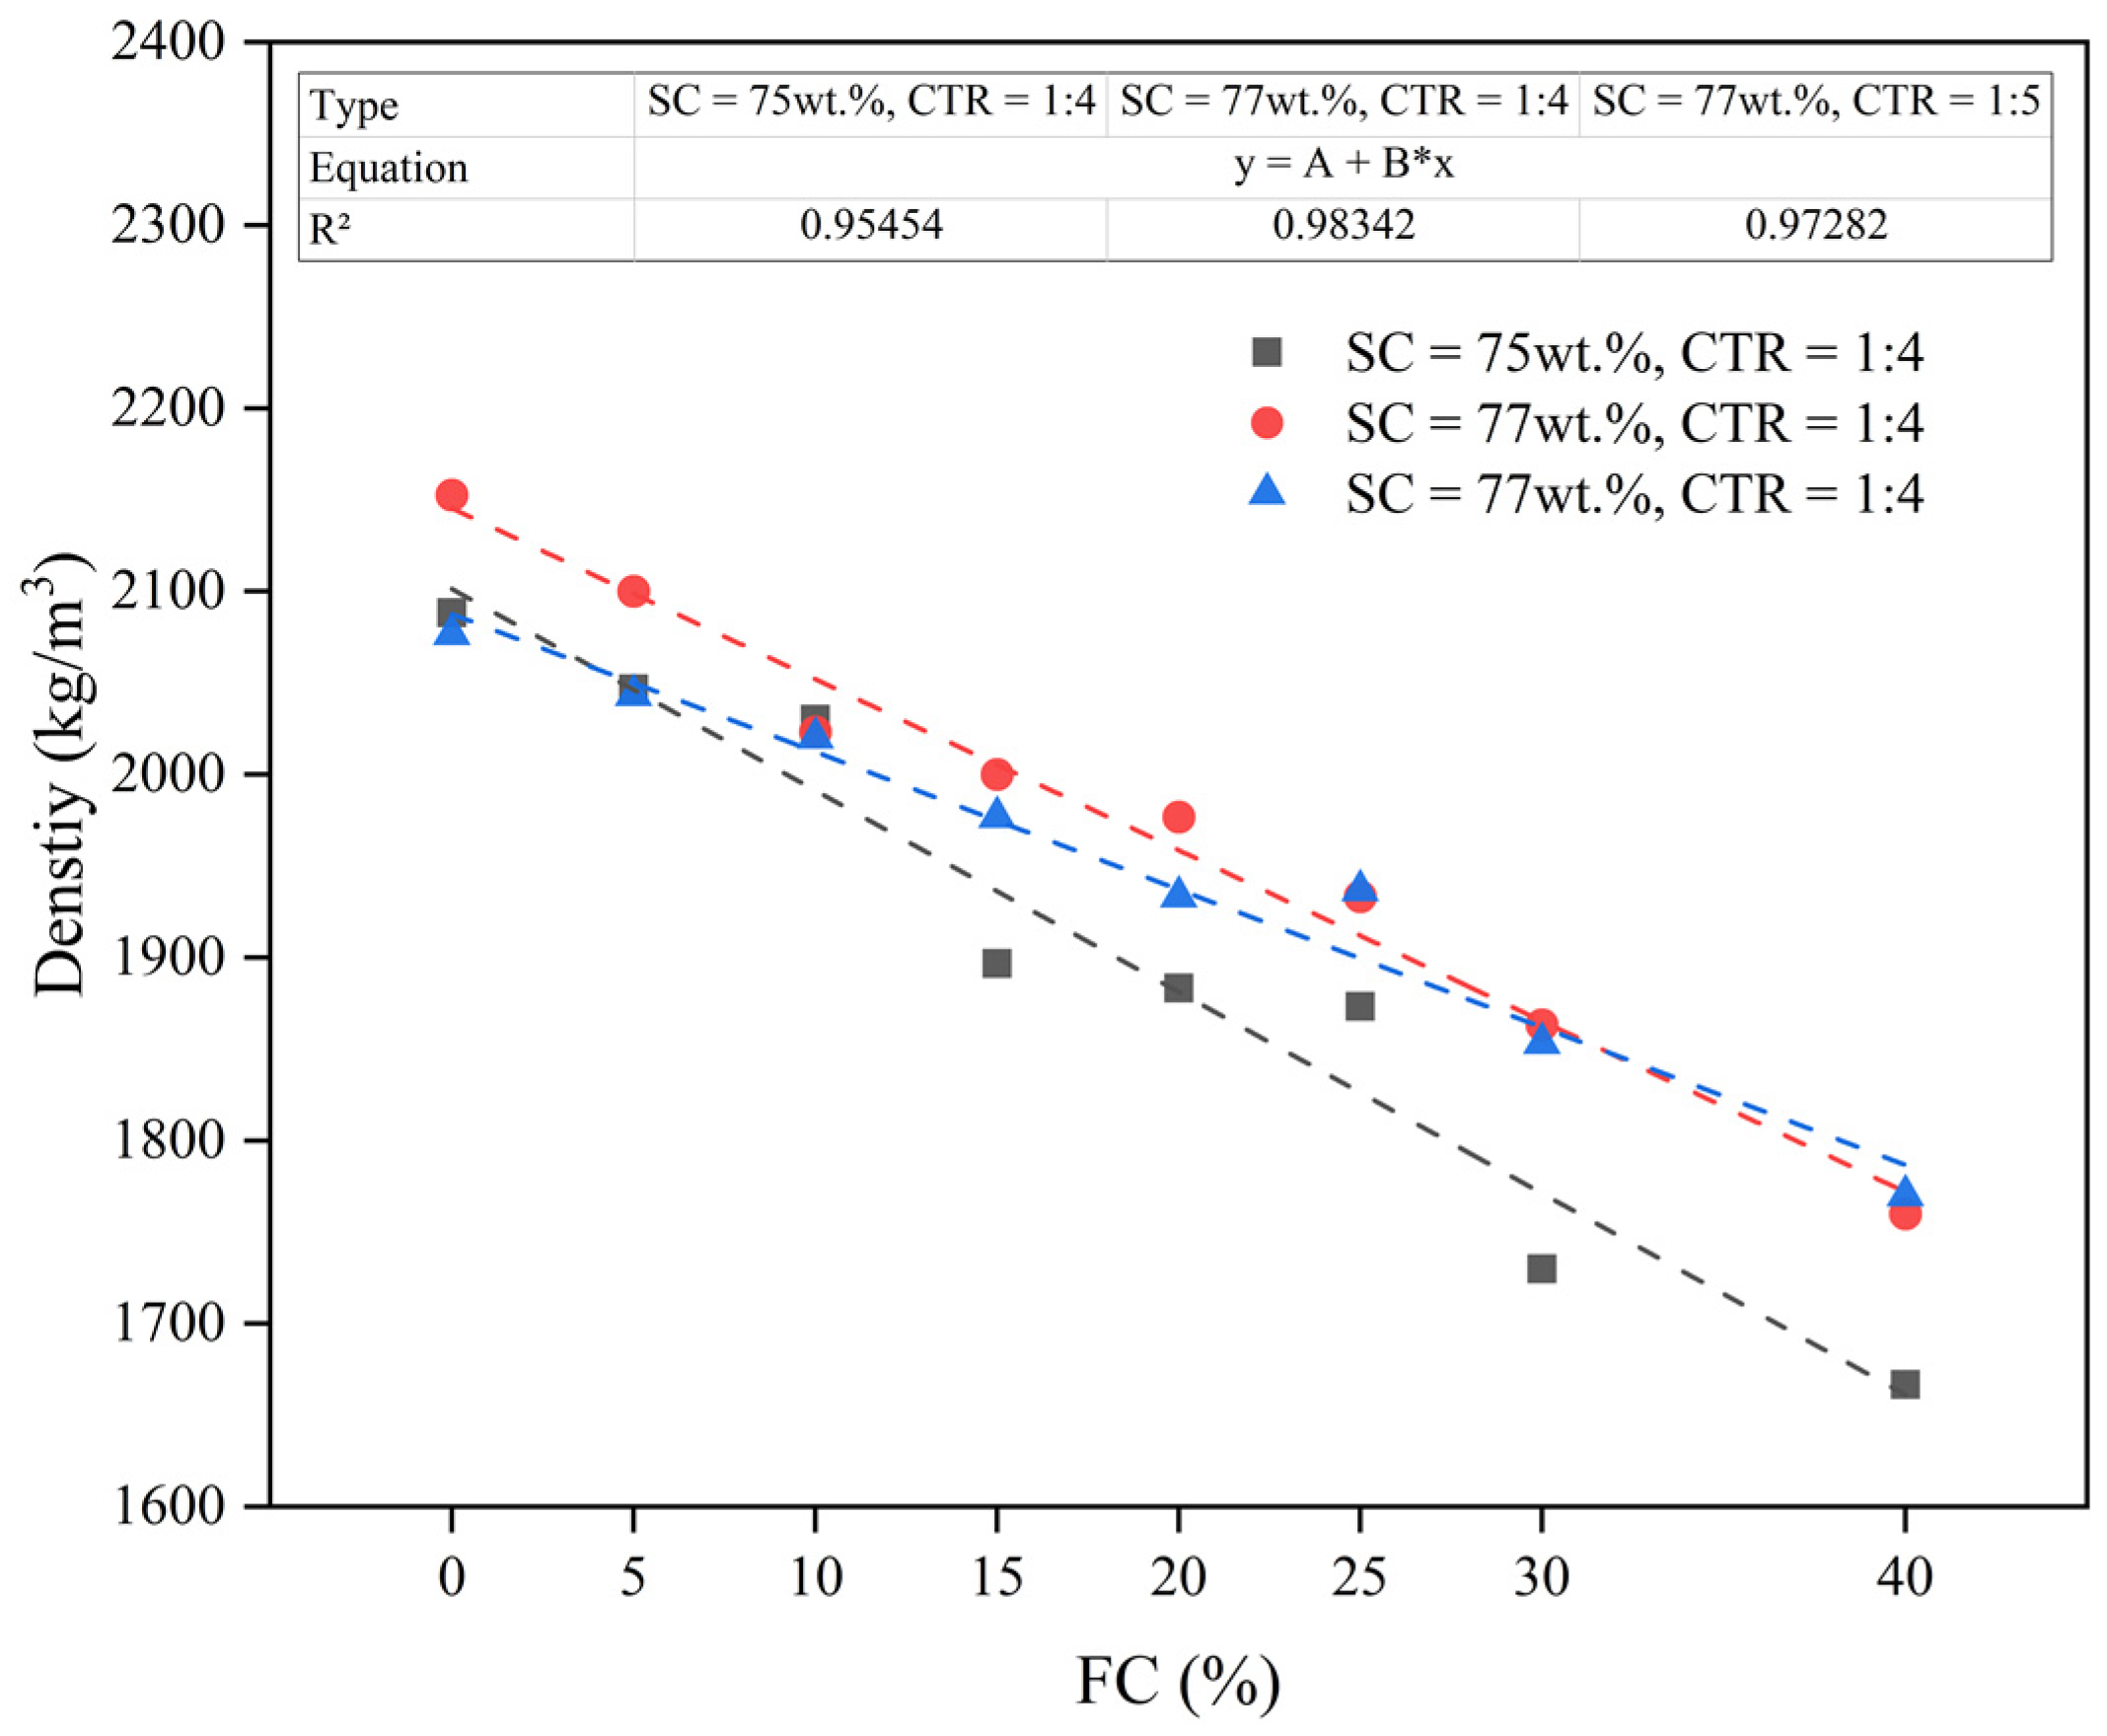
3.3. Density
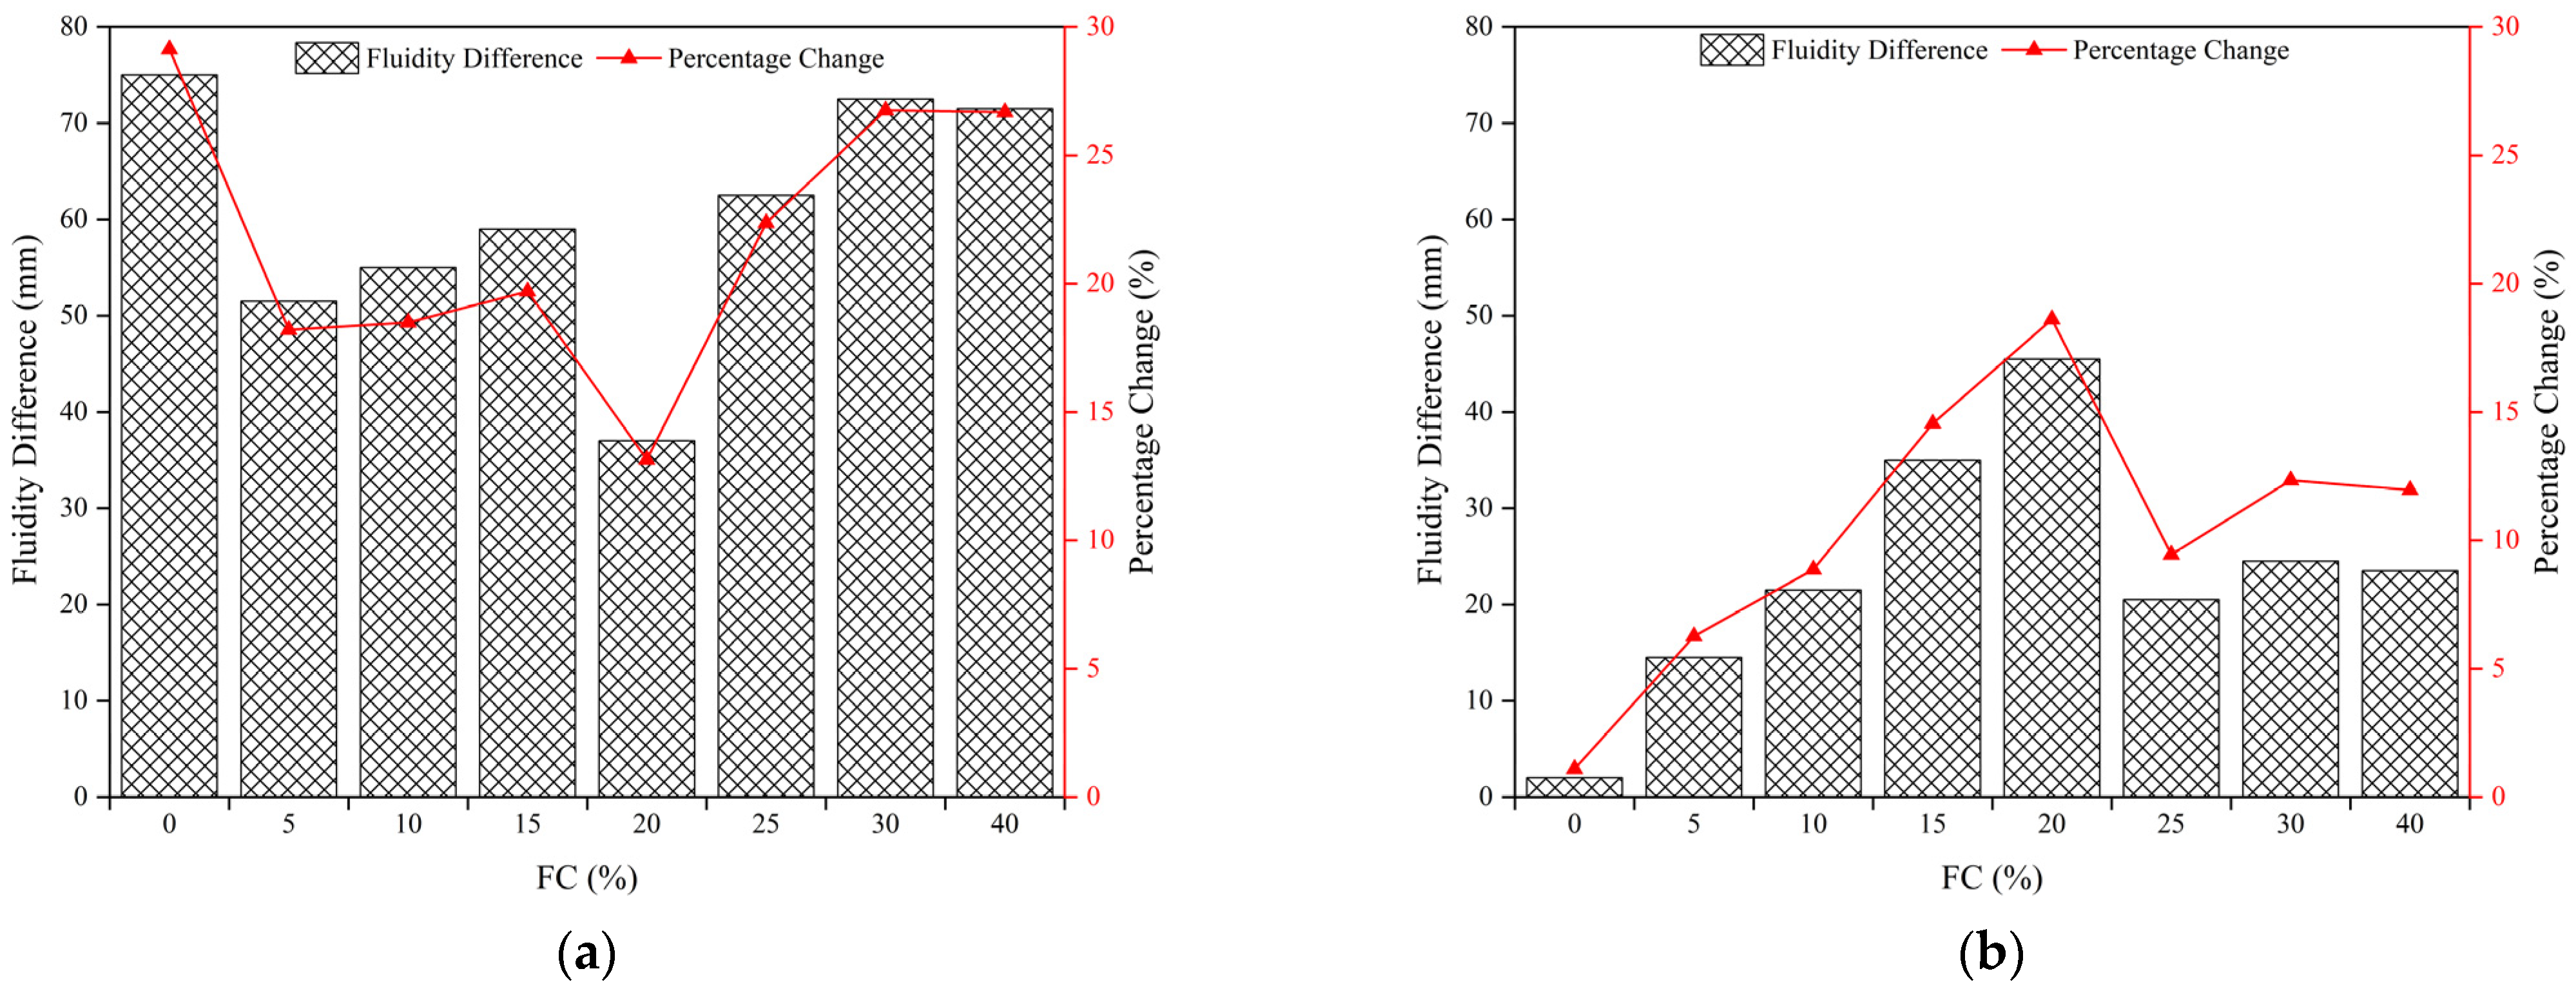
3.4. Fluidity
3.4.1. Effect of FCs on the UCS of FCPB
3.4.2. Effect of SCs and CTRs on the UCS of FCPB
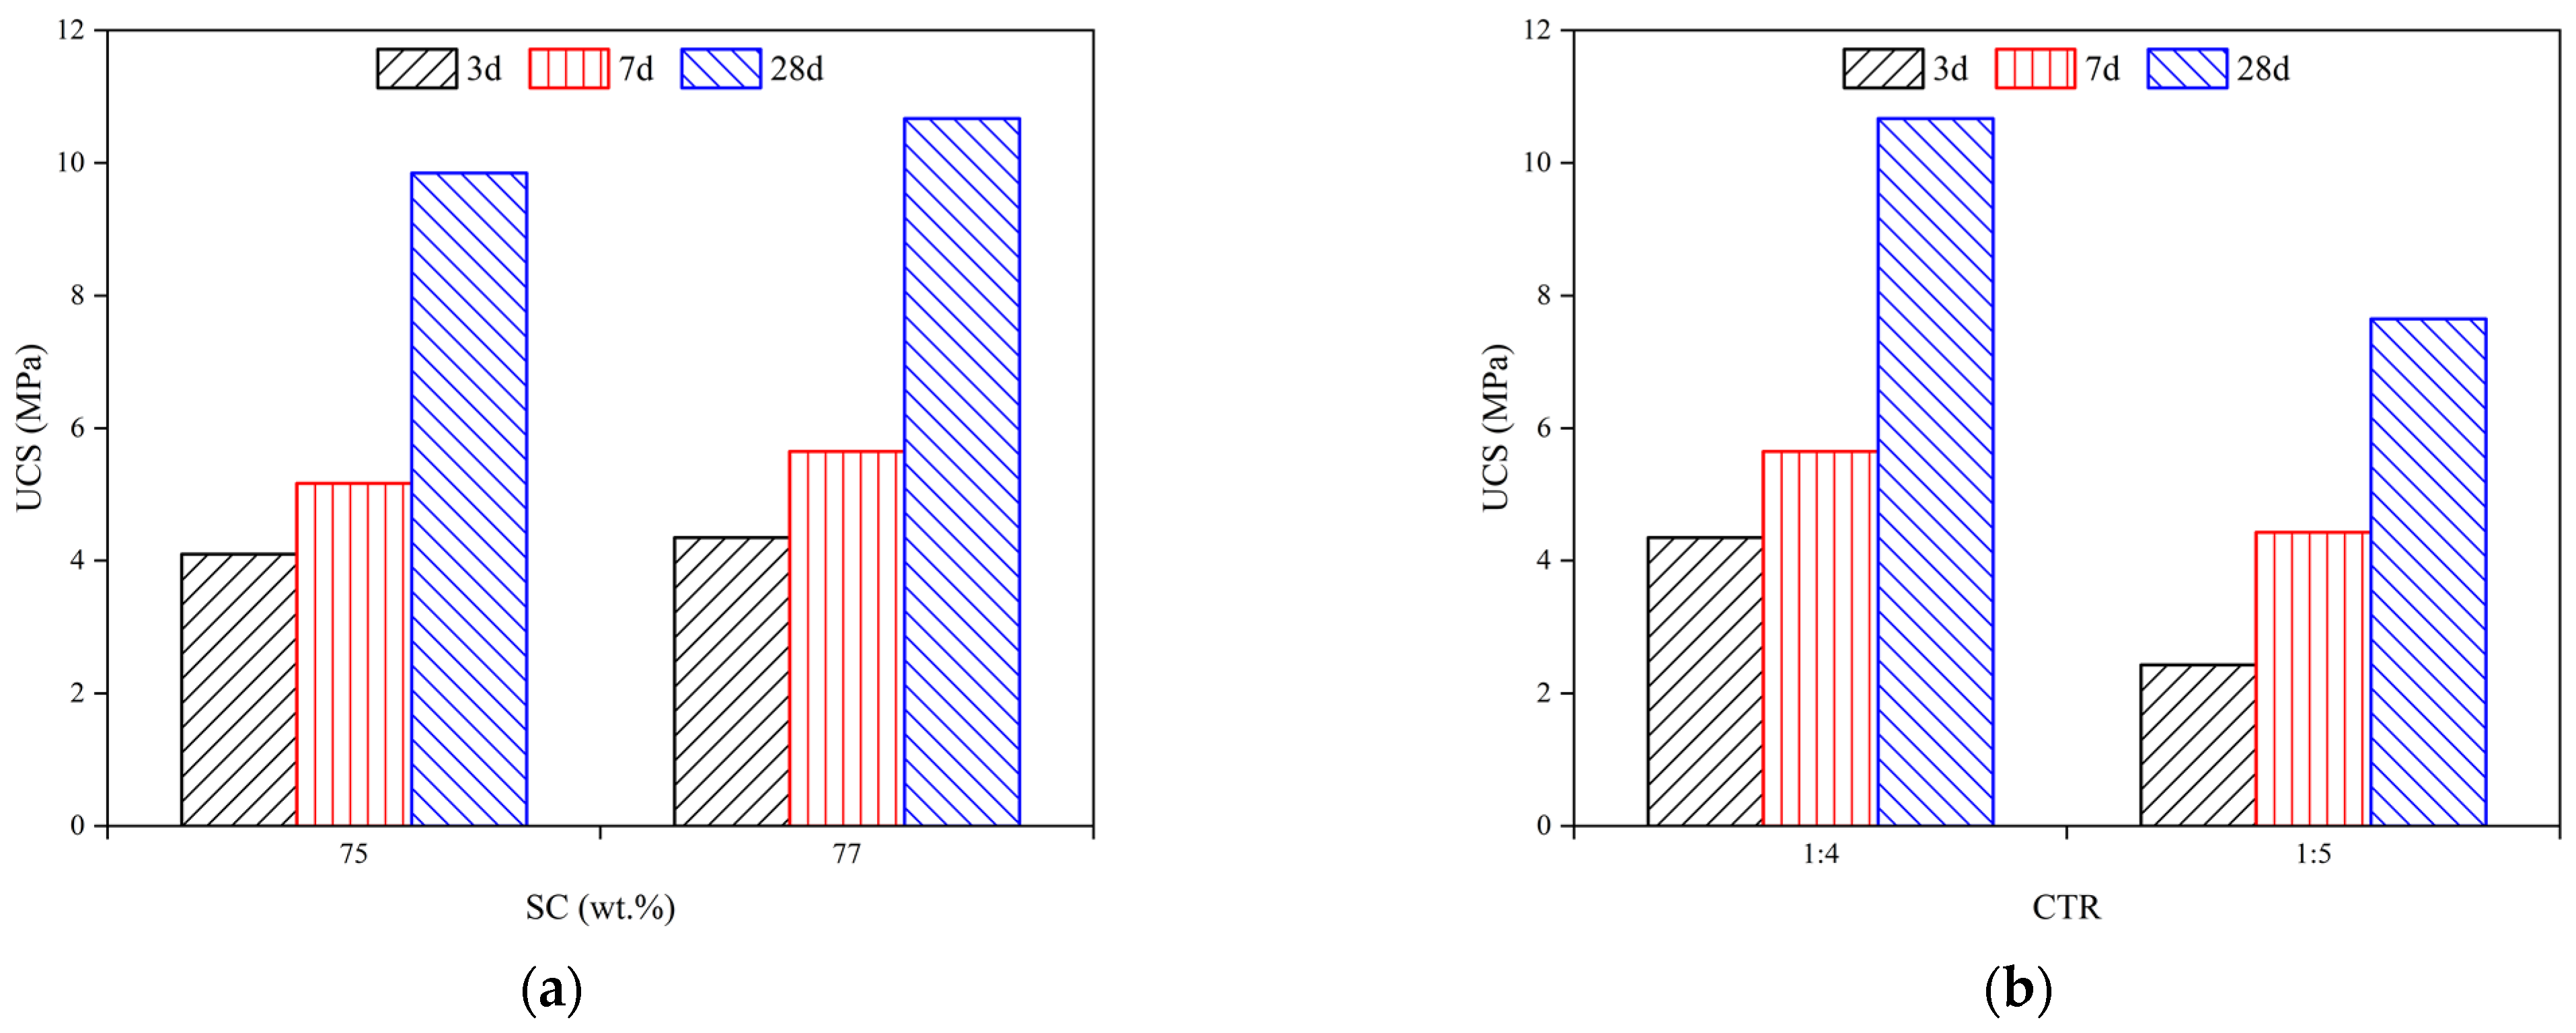
3.5. Unconfined Compressive Strength
3.5.1. Effect of FCs on the UCS of the FCPB
3.5.2. Effect of SCs and CTRs on the UCS of the FCPB
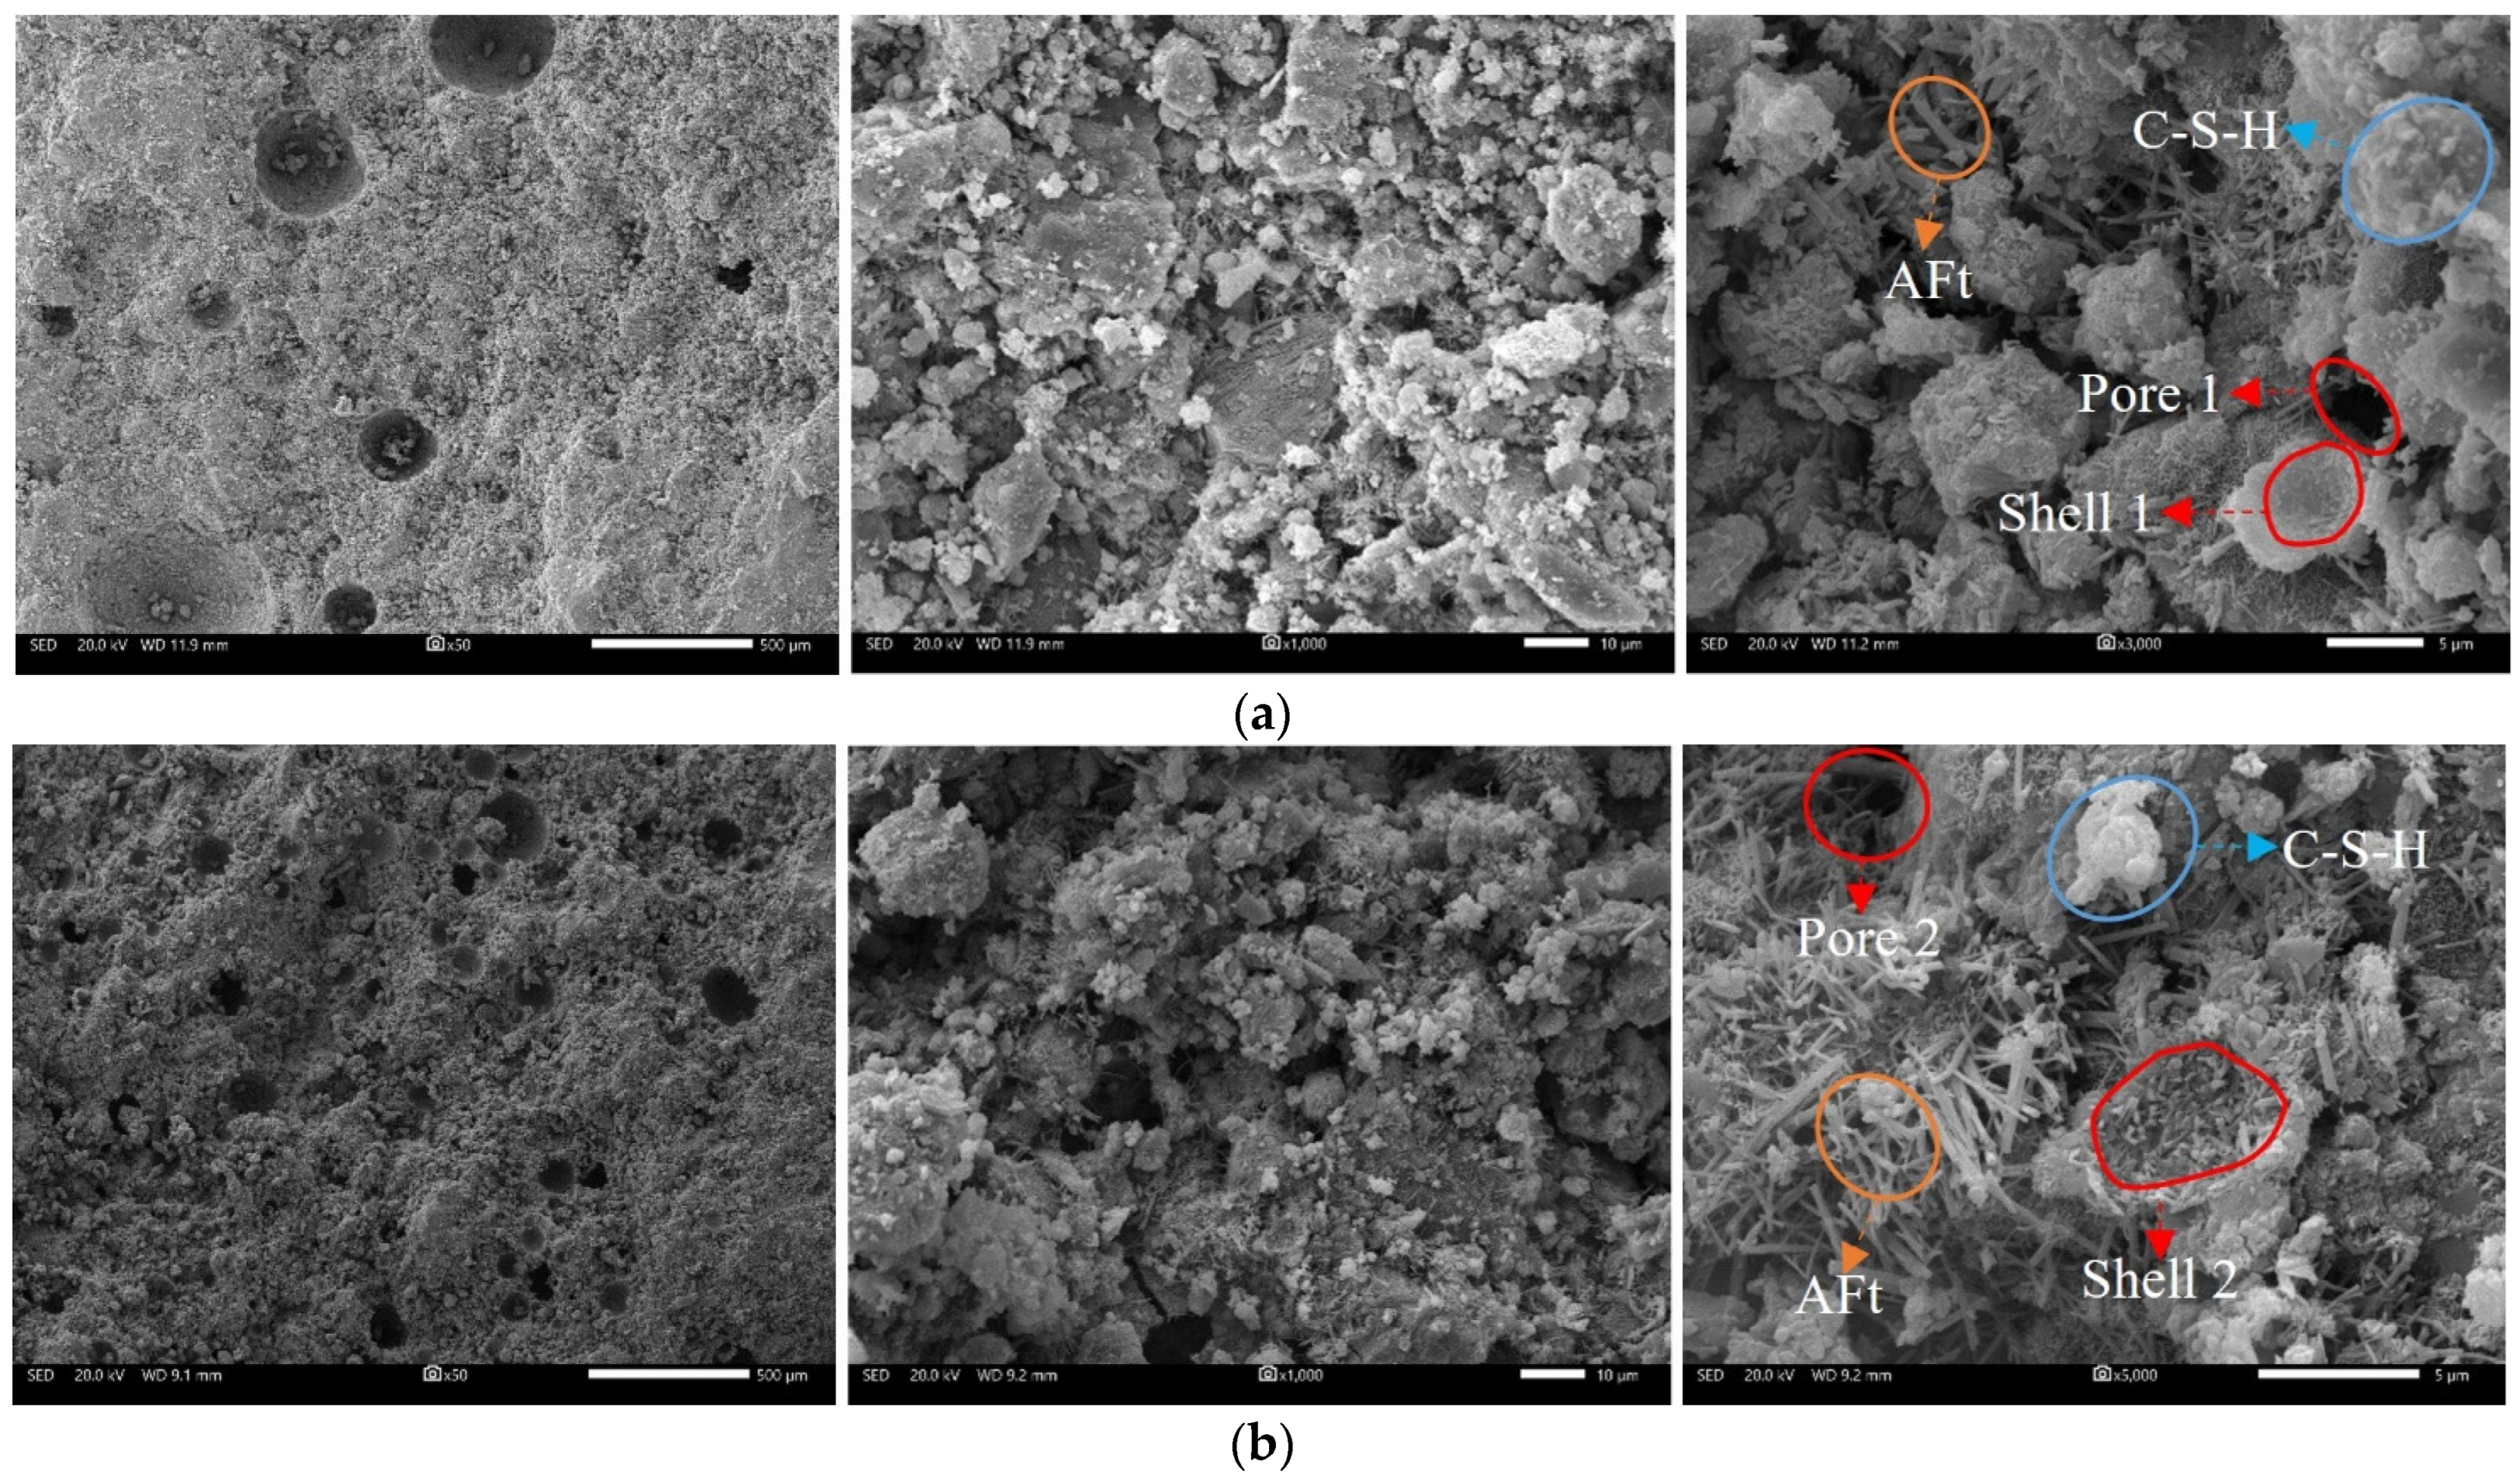
3.6. SEM Observation
4. Conclusions
- (1)
- The foaming ratio increases with the foaming agent content. After the foam stabilizer is added, the foaming ratio tends to decrease but the foam half-life tends to increase. The optimum contents of the foaming agent and the stabilizer are 0.5 wt.% and 0.2 wt.%, respectively.
- (2)
- The density of the FCPB decreases with an increasing foam content (FC) but increases with an increase in the solid content and the cement-tailing ratio.
- (3)
- The fluidity of the FCPB increases first and then decreases with an increasing FC, but it is always higher than the fluidity of the FCPB without foam. The fastest increase in fluidity is observed when the FC increases from 0% to 5%, and the fluidity reaches the maximum between FCs of 15% and 20%. A small amount of foam helps to improve the fluidity of the FCPB, but too much foam reduces the free water in the slurry, which leads to a decrease in the FCPB fluidity.
- (4)
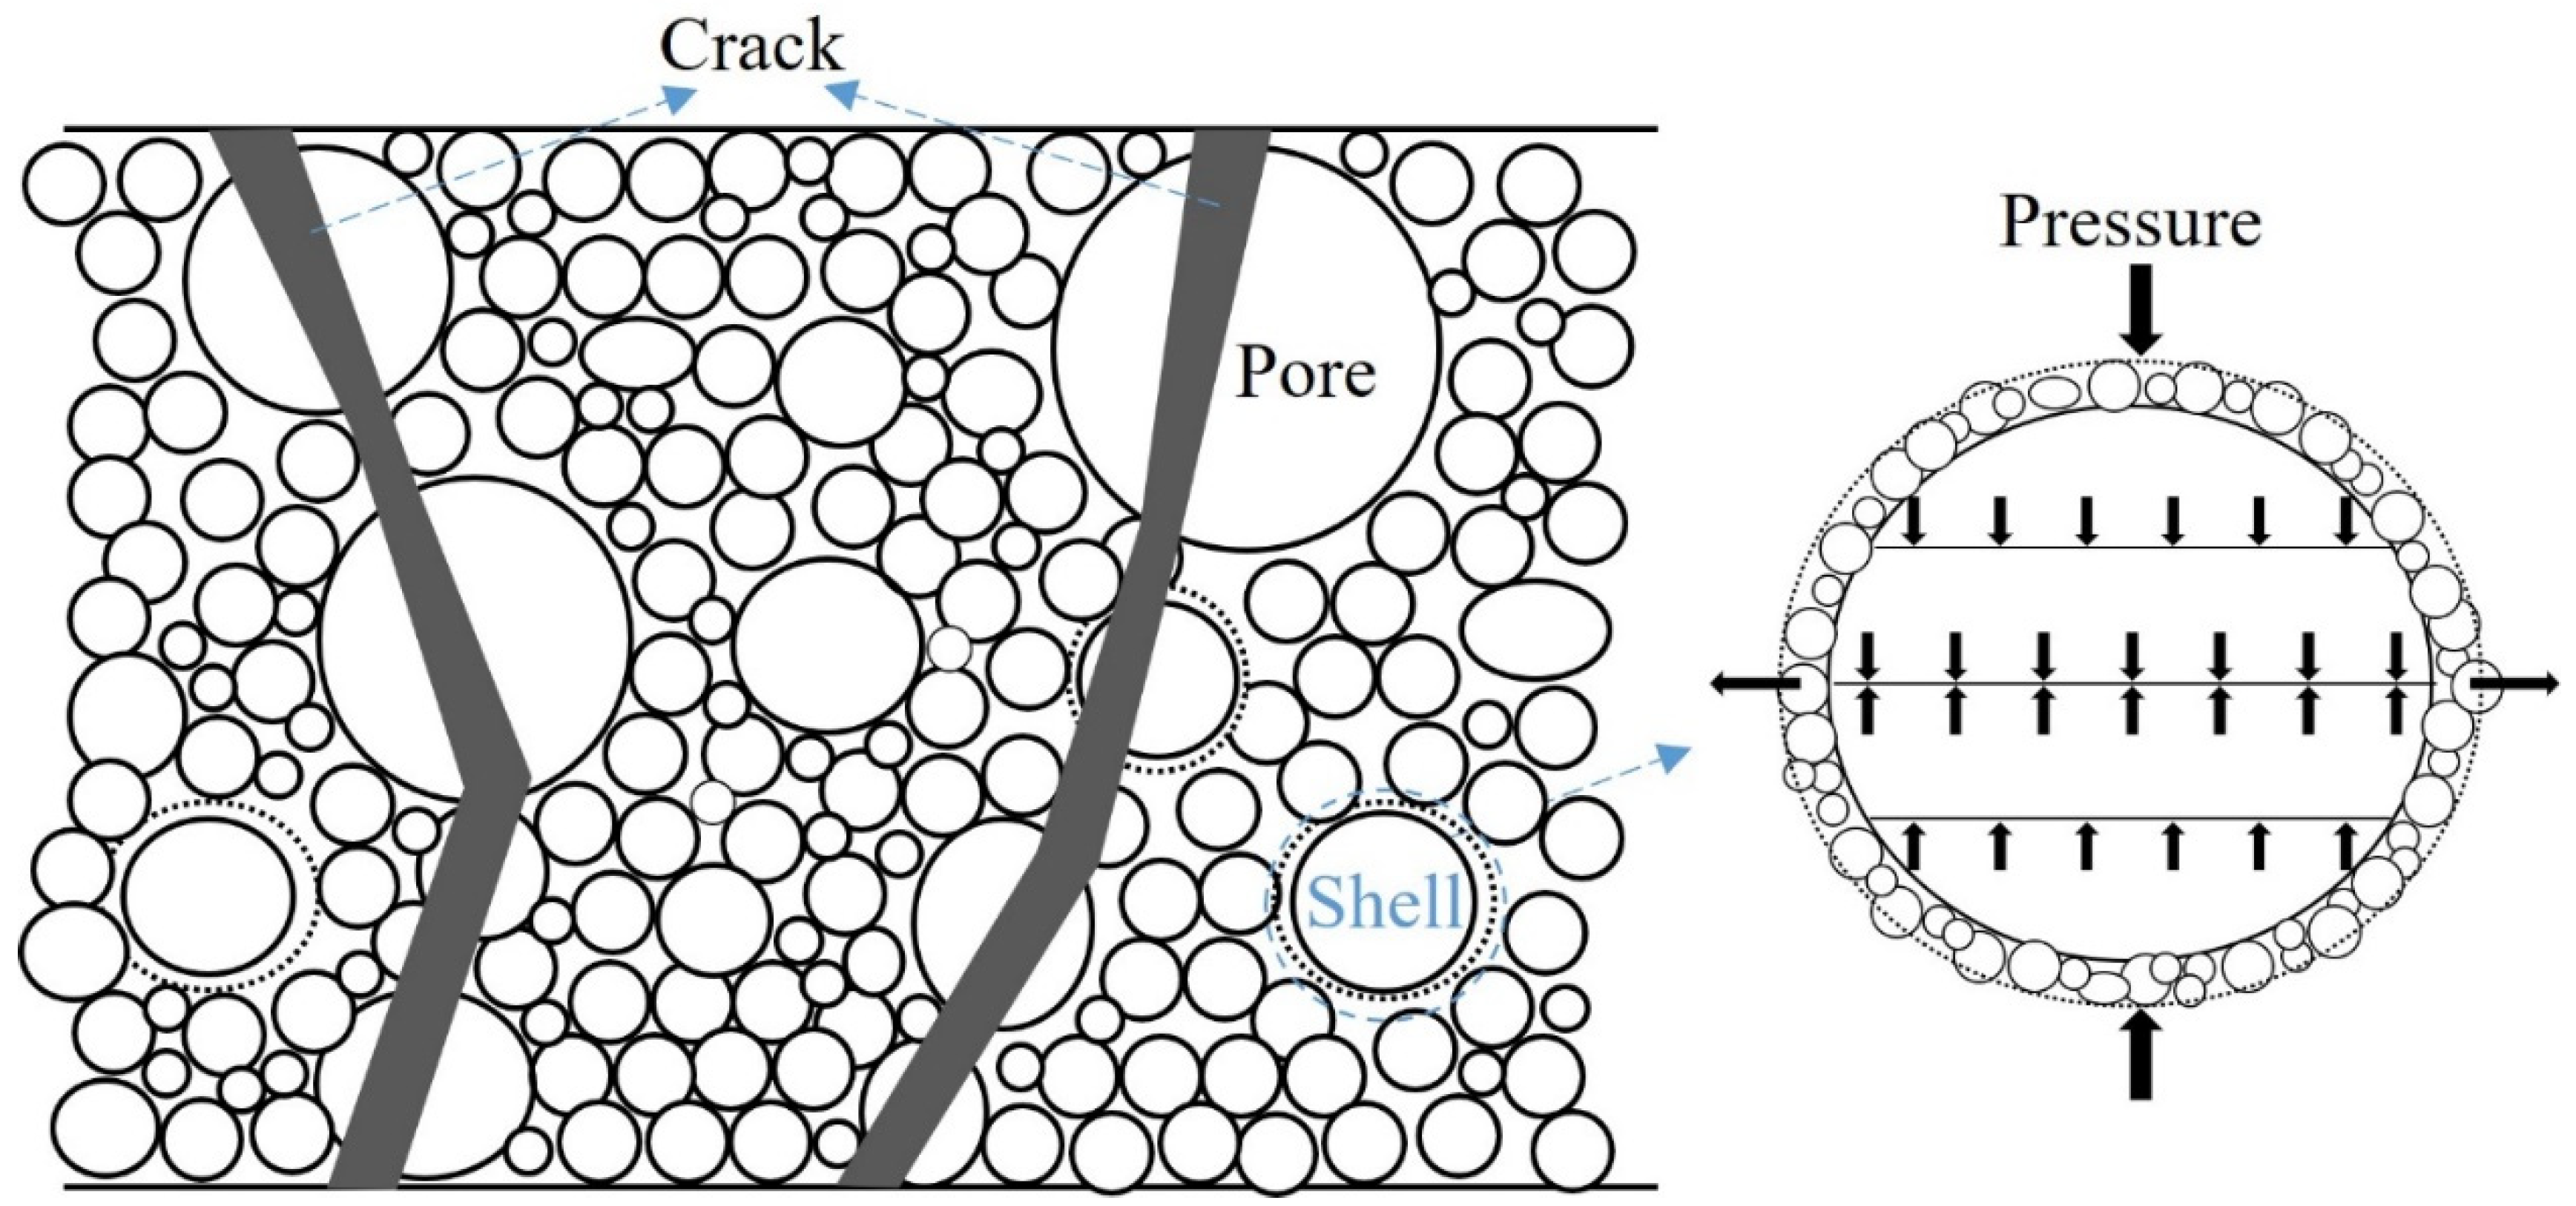
- The UCS of the FCPB increases first and then decreases with an increasing FC and becomes the maximum when the FC increases from 0% to 5%, which is related to the change in the pore structure on adding the foam. The gels adhere to the surface of the bubble to form a spherical shell that replaces the original pore, thus improving the anti-pressure ability of the FCPB. However, excessive foam makes the porosity too high, which decreases the UCS. Furthermore, the UCS increases with an increase in the solid content, the cement-tailing ratio, and curing time.
Author Contributions
Funding
Institutional Review Board Statement
Informed Consent Statement
Data Availability Statement
Conflicts of Interest
References
- Chen, X.; Zhou, J.; Chen, Q.; Shi, X.; Gou, Y. CFD Simulation of Pipeline Transport Properties of Mine Tailings Three-Phase Foam Slurry Backfill. Minerals 2017, 7, 149. [Google Scholar] [CrossRef] [Green Version]
- Chen, Q.; Zhang, Q.; Wang, X.; Xiao, C.; Hu, Q. A hydraulic gradient model of paste-like crude tailings backfill slurry transported by a pipeline system. Environ. Earth Sci. 2016, 75, 1099. [Google Scholar] [CrossRef]
- Chen, X.; Shi, X.Z.; Zhou, J.; Li, E.M.; Qiu, P.Y.; Gou, Y.G. High strain rate compressive strength behavior of cemented paste backfill using split Hopkinson pressure bar. Int. J. Min. Sci. Technol. 2021, 31, 387–399. [Google Scholar] [CrossRef]
- Wu, A.; Yong, W.; Bo, Z.; Shen, J. Effect of Initial Backfill Temperature on the Deformation Behavior of Early Age Cemented Paste Backfill That Contains Sodium Silicate. Adv. Mater. Sci. Eng. 2016, 2016, 1–10. [Google Scholar] [CrossRef] [Green Version]
- Koupouli, N.J.F.; Belem, T.; Rivard, P.; Effenguet, H. Direct shear tests on cemented paste backfill–rock wall and cemented paste backfill–backfill interfaces. J. Rock Mech. Geotech. Eng. 2016, 8, 472–479. [Google Scholar] [CrossRef] [Green Version]
- Ghirian, A.; Fall, M. Coupled thermo-hydro-mechanical–chemical behaviour of cemented paste backfill in column experiments. Part I: Physical, hydraulic and thermal processes and characteristics. Eng. Geol. 2013, 164, 195–207. [Google Scholar] [CrossRef]
- Wu, D.; Sun, G.; Liu, Y. Modeling the thermo-hydro-chemical behavior of cemented coal gangue-fly ash backfill. Constr. Build. Mater. 2016, 111, 522–528. [Google Scholar] [CrossRef]
- Behera, S.K.; Mishra, D.P.; Singh, P.; Mishra, K.; Mandal, S.K.; Ghosh, C.N.; Kumar, R.; Mandal, P.K. Utilization of mill tailings, fly ash and slag as mine paste backfill material: Review and future perspective. Constr. Build. Mater. 2021, 309, 125120. [Google Scholar] [CrossRef]
- Zhang, S.; Yang, L.; Ren, F.; Qiu, J.; Ding, H. Rheological and mechanical properties of cemented foam backfill: Effect of mineral admixture type and dosage. Cem. Concr. Compos. 2020, 112, 103689. [Google Scholar] [CrossRef]
- Fernández, Á.; García Calvo, J.L.; Alonso, M.C. Ordinary Portland Cement composition for the optimization of the synergies of supplementary cementitious materials of ternary binders in hydration processes. Cem. Concr. Compos. 2018, 89, 238–250. [Google Scholar] [CrossRef]
- Yu, Z.; Shi, X.-Z.; Chen, X.; Zhou, J.; Qi, C.-C.; Chen, Q.-S.; Rao, D.-J. Artificial intelligence model for studying unconfined compressive performance of fiber-reinforced cemented paste backfill. Trans. Nonferrous Met. Soc. China 2021, 31, 1087–1102. [Google Scholar] [CrossRef]
- Chen, X.; Shi, X.Z.; Zhou, J.; Yu, Z.; Huang, P.S. Determination of mechanical, flowability, and microstructural properties of cemented tailings backfill containing rice straw. Constr. Build. Mater. 2020, 246, 118520. [Google Scholar] [CrossRef]
- Ouattara, D.; Mbonimpa, M.; Yahia, A.; Belem, T. Assessment of rheological parameters of high density cemented paste backfill mixtures incorporating superplasticizers. Constr. Build. Mater. 2018, 190, 294–307. [Google Scholar] [CrossRef]
- Peng, X.; Fall, M.; Haruna, S. Sulphate induced changes of rheological properties of cemented paste backfill. Miner. Eng. 2019, 141, 105849. [Google Scholar] [CrossRef]
- Chen, S.; Du, Z.; Zhang, Z.; Yin, D.; Feng, F.; Ma, J. Effects of red mud additions on gangue-cemented paste backfill properties. Powder Technol. 2020, 367, 833–840. [Google Scholar] [CrossRef]
- Ramamurthy, K.; Kunhanandan Nambiar, E.K.; Indu Siva Ranjani, G. A classification of studies on properties of foam concrete. Cem. Concr. Compos. 2009, 31, 388–396. [Google Scholar] [CrossRef]
- Aldridge, D. Foamed concrete for highway bridge works. In One Day Awareness Seminar on Foamed Concrete: Properties, Applications and Potential; University of Dundee: Scotland, UK, 2000; pp. 33–41. [Google Scholar]
- Nambiar, E.K.K.; Ramamurthy, K. Influence of filler type on the properties of foam concrete. Cem. Concr. Compos. 2006, 28, 475–480. [Google Scholar] [CrossRef]
- Sang, G.; Zhu, Y.; Yang, G.; Zhang, H. Preparation and characterization of high porosity cement-based foam material. Constr. Build. Mater. 2015, 91, 133–137. [Google Scholar] [CrossRef]
- Hefni, M.; Hassani, F.P.; Nokken, M.; Kermani, M. Investigation into the development of foam mine fill. In Proceedings of the International Symposium of Mining with Backfill, Perth, Australia, 20–22 May 2014; pp. 49–59. [Google Scholar] [CrossRef]
- Xu, S.; Suorineni, F.T.; Li, K.; Li, Y. Evaluation of the strength and ultrasonic properties of foam-cemented paste backfill. Int. J. Min. Reclam. Environ. 2016, 31, 544–557. [Google Scholar] [CrossRef]
- Qiu, J.P.; Guo, Z.B.; Li, L.; Zhang, S.Y.; Zhao, Y.L.; Ma, Z.Y. A Hybrid Artificial Intelligence Model for Predicting the Strength of Foam-Cemented Paste Backfill. Ieee Access 2020, 8, 84569–84583. [Google Scholar] [CrossRef]
- Zhang, S.Y.; Yang, L.; Qiu, J.P.; Hou, C.; Guo, Z.B. Fluidity and strength behaviors of cemented foam backfill: Effect of particle size distribution and foaming agent dosage. Bull. Eng. Geol. Environ. 2021, 80, 3177–3191. [Google Scholar] [CrossRef]
- Xu, X.; Sun, X.; Yao, W.; Wu, P.; Qiu, J.; Guo, Z.; Liu, N. Strength and Ultrasonic Characteristics of Cemented Paste Backfill Incorporating Foaming Agent. Minerals 2021, 11, 681. [Google Scholar] [CrossRef]
- Hefni, M.; Hassani, F. Experimental Development of a Novel Mine Backfill Material: Foam Mine Fill. Minerals 2020, 10, 564. [Google Scholar] [CrossRef]
- Odler, I.; Rößler, M. Investigations on the relationship between porosity, structure and strength of hydrated Portland cement pastes. II. Effect of pore structure and of degree of hydration. Cem. Concr. Res. 1985, 15, 401–410. [Google Scholar] [CrossRef]
- Fridjonsson, E.O.; Hasan, A.; Fourie, A.B.; Johns, M.L. Pore structure in a gold mine cemented paste backfill. Miner. Eng. 2013, 53, 144–151. [Google Scholar] [CrossRef]
- Ouellet, S.; Bussiere, B.; Aubertin, M.; Benzaazoua, M. Characterization of cemented paste backfill pore structure using SEM and IA analysis. Bull. Eng. Geol. Environ. 2008, 67, 139–152. [Google Scholar] [CrossRef]
- Li, L.G.; Kwan, A.K.H. Effects of superplasticizer type on packing density, water film thickness and flowability of cementitious paste. Constr. Build. Mater. 2015, 86, 113–119. [Google Scholar] [CrossRef]
- GB/T 50123-2019; National Standards of the People’s Republic of China. Standard for Geotechnical Testing Method. China Planning Press: Beijing, China, 2019.
- Regismond, S.T.A.; Winnik, F.M.; Goddard, E.D. Stabilization of aqueous foams by polymer/surfactant systems: Effect of surfactant chain length. Colloids Surf. A Physicochem. Eng. Asp. 1998, 141, 165–171. [Google Scholar] [CrossRef]
- Zhi, H.T. Research and Application of Modification of Lightweight Foam Concrete Foaming Agent. Master’s Thesis, Zhengzhou University, Zhengzhou, China, 2019. [Google Scholar]
- Hou, L.; Li, J.; Lu, Z.; Niu, Y. Influence of foaming agent on cement and foam concrete. Constr. Build. Mater. 2021, 280, 122399. [Google Scholar] [CrossRef]
- Li, J.; Yilmaz, E.; Cao, S. Influence of Solid Content, Cement/Tailings Ratio, and Curing Time on Rheology and Strength of Cemented Tailings Backfill. Minerals 2020, 10, 922. [Google Scholar] [CrossRef]
- Fall, M.; Benzaazoua, M.; Saa, E.G. Mix proportioning of underground cemented tailings backfill. Tunn. Undergr. Space Technol. 2008, 23, 80–90. [Google Scholar] [CrossRef]
- Lafhaj, Z.; Goueygou, M.; Djerbi, A.; Kaczmarek, M. Correlation between porosity, permeability and ultrasonic parameters of mortar with variable water/cement ratio and water content. Cem. Concr. Res. 2006, 36, 625–633. [Google Scholar] [CrossRef]
- Wu, L. Stability Theory of Plates and Shells; Huazhong University of Science and Engineering Press: Wuhan, China, 1996. [Google Scholar]


| Scenario | Solid Content (wt.%) | Cement-Tailing Ratio | Curing Time (Days) | Foam Content (%) |
|---|---|---|---|---|
| 1 | 75 | 1:4 | 3, 7, 28 | 0, 5, 10, 15, 20, 25, 30, 40 |
| 2 | 77 | 1:4 | 3, 7, 28 | 0, 5, 10, 15, 20, 25, 30, 40 |
| 3 | 77 | 1:5 | 3, 7, 28 | 0, 5, 10, 15, 20, 25, 30, 40 |
| Items | Wet Density (g/cm3) | Dry Density (g/cm3) | True Density (g/cm3) | Porosity (%) | Permeability Coefficient (cm/s) |
|---|---|---|---|---|---|
| Tailings | 2.16 | 1.93 | 3.18 | 39.31 | 8.70 × 10⁻⁴ |
| Compositions | CaO | SiO2 | Al2O3 | Fe2O3 | MgO | K2O | Other |
|---|---|---|---|---|---|---|---|
| wt.% | 65.20 | 16.80 | 5.69 | 4.57 | 3.51 | 1.49 | 2.74 |
| Foam Stabilizer Content (g/L) | 0 | 0.5 | 1 | 1.5 | 2 | 3 |
|---|---|---|---|---|---|---|
| Foaming Ratio | 1.000 | 0.321 | 0.714 | 0.179 | 0.500 | 0.000 |
| Half-life Period | 0.000 | 0.466 | 0.309 | 0.362 | 0.640 | 1.000 |
| Scenario | SC (wt.%) | CTR | Foam Content | |||||||
|---|---|---|---|---|---|---|---|---|---|---|
| 0% | 5% | 10% | 15% | 20% | 25% | 30% | 40% | |||
| 1 | 75 | 1:4 | 2088 | 2047 | 2030 | 1897 | 1883 | 1873 | 1730 | 1667 |
| 2 | 77 | 1:4 | 2153 | 2100 | 2023 | 2000 | 1977 | 1933 | 1863 | 1760 |
| 3 | 77 | 1:5 | 2077 | 2043 | 2020 | 1977 | 1933 | 1937 | 1853 | 1770 |
Publisher’s Note: MDPI stays neutral with regard to jurisdictional claims in published maps and institutional affiliations. |
© 2022 by the authors. Licensee MDPI, Basel, Switzerland. This article is an open access article distributed under the terms and conditions of the Creative Commons Attribution (CC BY) license (https://creativecommons.org/licenses/by/4.0/).
Share and Cite
Shi, X.; Zhao, Z.; Chen, X.; Kong, K.; Yuan, J. Investigation of Fluidity and Strength of Enhanced Foam-Cemented Paste Backfill. Materials 2022, 15, 7101. https://doi.org/10.3390/ma15207101
Shi X, Zhao Z, Chen X, Kong K, Yuan J. Investigation of Fluidity and Strength of Enhanced Foam-Cemented Paste Backfill. Materials. 2022; 15(20):7101. https://doi.org/10.3390/ma15207101
Chicago/Turabian StyleShi, Xiuzhi, Zhengkai Zhao, Xin Chen, Kun Kong, and Jingjing Yuan. 2022. "Investigation of Fluidity and Strength of Enhanced Foam-Cemented Paste Backfill" Materials 15, no. 20: 7101. https://doi.org/10.3390/ma15207101